© 2011 Altegris Advisors. PAST RESULTS ARE NOT NECESSARILY INDICATIVE OF FUTURE RESULTS. The risk of loss in trading commodities can be substantial. See Important Risk Disclosures at the end of this document.
Yearly
Returns
10-Year ReturnsJanuary 2001–December 2010
Q1
Return
Q2
Return
2011 YTD
Return
2010
Return
2009
Return
2008
Return
Total
Return
Ann
ROR
Std
Dev
Max
DD
Altegris 40 Index® -1.23% -2.42% -3.62% 11.33% -7.98% 15.47% 95.24% 6.92% 10.90% -13.24%
HFRI Fund Weighted Composite Index 1.71% -0.94% 0.76% 10.25% 19.98% -19.03% 91.17% 6.69% 6.35% -21.42%
S&P 500 TotalReturn Index 5.92% 0.10% 6.02% 15.06% 26.46% -37.00% 30.77% 2.72% 15.82% -50.95%
Barclays US Aggregate Composite Bond Index 0.43% 2.30% 2.74% 6.56% 5.93% 5.24% 74.89% 5.75% 3.81% -3.82%
MSCI EAFE Index (Net) 3.36% 1.56% 4.98% 7.75% 31.78% -43.38% 73.44% 5.66% 18.27% -56.68%
NAREIT Composite Index 6.98% 2.50% 9.65% 27.55% 27.79% -37.84% 158.88% 9.98% 23.98% -68.17%
GSCI Total Return Index 11.57% -7.71% 2.96% 9.02% 13.67% -46.49% 44.25% 3.73% 25.06% -67.65%
Yearly ReturnsQuarterly Returns
2011
10-Year ReturnsJuly 2001-June 2011

© 2011 Altegris Advisors. PAST RESULTS ARE NOT NECESSARILY INDICATIVE OF FUTURE RESULTS. The risk of loss in trading commodities can be substantial. See Important Risk Disclosures at the end of this document.

© 2011 Altegris Advisors. PAST RESULTS ARE NOT NECESSARILY INDICATIVE OF FUTURE RESULTS. The risk of loss in trading commodities can be substantial. See Important Risk Disclosures at the end of this document.
© 2011 Altegris Advisors. PAST RESULTS ARE NOT NECESSARILY INDICATIVE OF FUTURE RESULTS. The risk of loss in trading commodities can be substantial. See Important Risk Disclosures at the end of this document.

© 2011 Altegris Advisors. PAST RESULTS ARE NOT NECESSARILY INDICATIVE OF FUTURE RESULTS. The risk of loss in trading commodities can be substantial. See Important Risk Disclosures at the end of this document.

© 2011 Altegris Advisors. PAST RESULTS ARE NOT NECESSARILY INDICATIVE OF FUTURE RESULTS. The risk of loss in trading commodities can be substantial. See Important Risk Disclosures at the end of this document.
85
90
95
100
105
110
6/1/2011 6/11/2011 6/21/2011
System enters the trade on a downward move, then captures the profits over the next several trading days
Announcement of oil reserve release increases supply, sending oil prices down

© 2011 Altegris Advisors. PAST RESULTS ARE NOT NECESSARILY INDICATIVE OF FUTURE RESULTS. The risk of loss in trading commodities can be substantial. See Important Risk Disclosures at the end of this document.
4,400
4,900
5,400
5,900
5%
15%
25%
35%
45%
55%
1/14/2011 2/14/2011 3/14/2011 4/14/2011 5/14/2011 6/14/2011
Rolling 10-day Annualized Standard Deviation (left axis) GSCI Total Return Index Daily Prices (right axis)
A significant pick-up in volatilty as commodity prices reverse in Q2
© 2011 Altegris Advisors. PAST RESULTS ARE NOT NECESSARILY INDICATIVE OF FUTURE RESULTS. The risk of loss in trading commodities can be substantial. See Important Risk Disclosures at the end of this document.
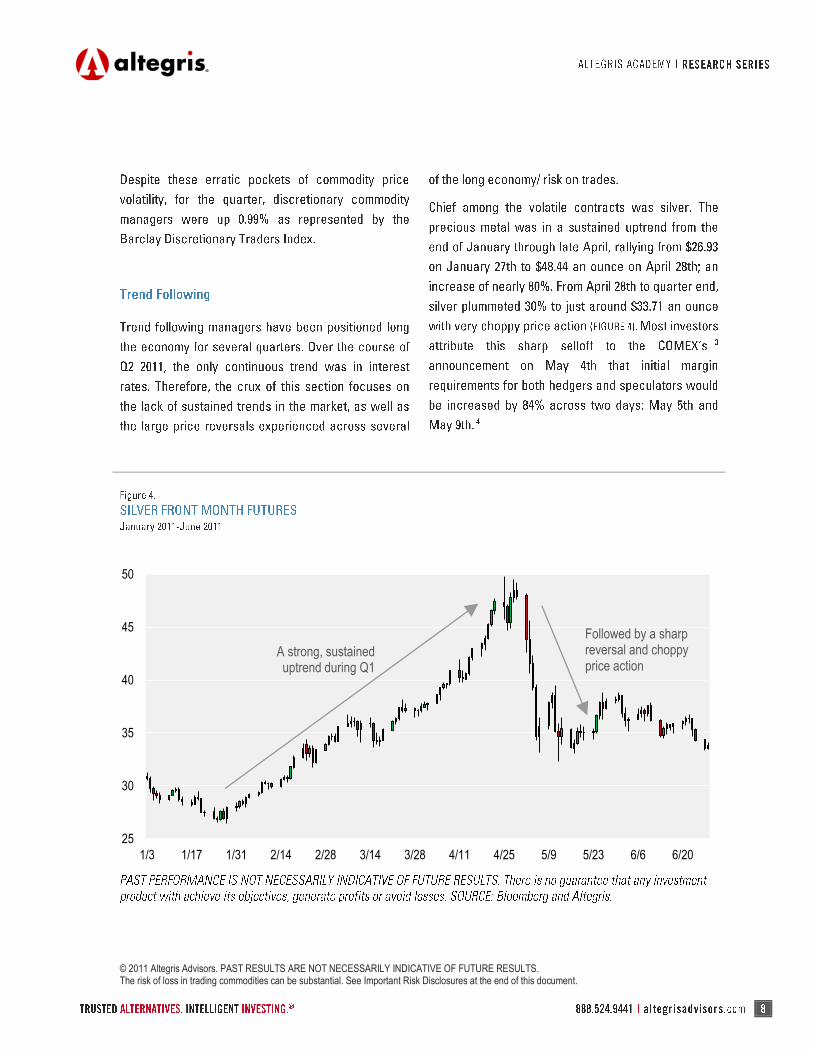
25
30
35
40
45
50
1/3 1/17 1/31 2/14 2/28 3/14 3/28 4/11 4/25 5/9 5/23 6/6 6/20
A strong, sustained uptrend during Q1
Followed by a sharp reversal and choppy price action

© 2011 Altegris Advisors. PAST RESULTS ARE NOT NECESSARILY INDICATIVE OF FUTURE RESULTS. The risk of loss in trading commodities can be substantial. See Important Risk Disclosures at the end of this document.
1.25
1.30
1.35
1.40
1.45
1.50
1/3 1/17 1/31 2/14 2/28 3/14 3/28 4/11 4/25 5/9 5/23 6/6 6/20
Strong uptrend as the euro
strengthened against the U.S. dollar
Downtrend followed by choppy
price action dominates May and June

© 2011 Altegris Advisors. PAST RESULTS ARE NOT NECESSARILY INDICATIVE OF FUTURE RESULTS. The risk of loss in trading commodities can be substantial. See Important Risk Disclosures at the end of this document.
0
250
500
750
1000
Oct-09 Feb-10 Jun-10 Oct-10 Feb-11 Jun-11
CORN FRONT MONTH FUTURES
0
50
100
150
200
250
Oct-09 Feb-10 Jun-10 Oct-10 Feb-11 Jun-11
COTTON FRONT MONTH FUTURES
500
1000
1500
2000
Oct-06 Jun-07 Feb-08 Oct-08 Jun-09 Feb-10 Oct-10 Jun-11
S&P 500 FUTURES
100
110
120
130
140
Oct-06 Jun-07 Feb-08 Oct-08 Jun-09 Feb-10 Oct-10 Jun-11
10-YEAR U.S. TREASURY FUTURES
Price 200-Day Average

© 2011 Altegris Advisors. PAST RESULTS ARE NOT NECESSARILY INDICATIVE OF FUTURE RESULTS. The risk of loss in trading commodities can be substantial. See Important Risk Disclosures at the end of this document.

© 2011 Altegris Advisors. PAST RESULTS ARE NOT NECESSARILY INDICATIVE OF FUTURE RESULTS. The risk of loss in trading commodities can be substantial. See Important Risk Disclosures at the end of this document.
Altegris 40 The Altegris 40 Index tracks the performance of the 40 leading managed futures programs, by ending monthly equity (assets) for the previous month, as tracked by Altegris Advisors. The Altegris 40 index represents the dollar-weighted average performance of those 40 programs.
Alternative Edge Short-Term Traders
The Alternative Edge Short-Term Traders Index is designed to track the daily performance of a portfolio of CTAs and global macro managers executing diversified trading strategies with a less than 10-day average holding period.
Barclay Discretionary
The Barclay Discretionary Traders Index is an equal weighted composite of managed programs whose approach is at least 65% discretionary or judgmental. In 2011 there are 150 discretionary programs included in the index.
Barclays US Aggregate
The Barclays Capital US Aggregate Index represents securities that are SEC-registered, taxable, and dollar denominated. The index covers the US investment grade fixed rate bond market, with index components for government and corporate securities, mortgage pass-through securities, and asset-backed securities. These major sectors are subdivided into more specific indices that are calculated and reported on a regular basis. These specific indices include the Government/Credit Index, Government Index, Treasury Index, Agency Index, and Credit Index.
GSCI The GSCI Total Return Index measures a fully collateralized commodity futures investment. Currently, the GSCI includes 24 commodity nearby futures contracts.
HFRI The HFRI Fund Weighted Composite Index is an equal-weighted return of all funds in the HFR Monthly Indices, excluding HFRI Fund of Funds Index.
MCSI EAFE The MSCI EAFE Index is a capitalization-weighted index widely accepted as a benchmark of non-US stocks compiled by Morgan Stanley. It represents an aggregate of 21 individual country indices that collectively represent many of the major markets of the world.
NAREIT The NAREIT Composite Total Return Index includes both price and income returns of all publicly traded REITs (Equity, Mortgage, and Hybrid). The index began on December 31, 1971 with a base value of 100.
S&P 500 The S&P 500 Total Return Index is the total return version of S&P 500 index. The S&P 500 index is unmanaged and is generally representative of certain portions of the US equity markets. For the S&P 500 Total Return Index, dividends are reinvested on a daily basis and the base date for the index is January 4, 1988. All regular cash dividends are assumed reinvested in the S&P 500 index on the ex-date. Special cash dividends trigger a price adjustment in the price return index.
VIX VIX is the ticker symbol for the Chicago Board Options Exchange (CBOE) Volatility Index, which shows the market's expectation of 30-day volatility. It is constructed using the implied volatilities of a wide range of S&P 500 index options. This volatility is meant to be forward looking and is calculated from both calls and puts. The VIX is a widely used measure of market risk and is often referred to as the "investor fear gauge". There are three variations of volatility indexes: the VIX tracks the S&P 500, the VXN tracks the Nasdaq 100 and the VXD tracks the Dow Jones Industrial Average.

© 2011 Altegris Advisors. PAST RESULTS ARE NOT NECESSARILY INDICATIVE OF FUTURE RESULTS. The risk of loss in trading commodities can be substantial. See Important Risk Disclosures at the end of this document.
© 2011 Altegris Advisors. PAST RESULTS ARE NOT NECESSARILY INDICATIVE OF FUTURE RESULTS. The risk of loss in trading commodities can be substantial. See Important Risk Disclosures at the end of this document.
* The Altegris Companies are wholly owned subsidiaries of Genworth Financial, Inc., and include: (1) Altegris Advisors, LLC, an SEC registered
investment adviser; (2) Altegris Investments, Inc., an SEC-registered broker-dealer and FINRA member; (3) Altegris Portfolio Management, Inc.
(dba Altegris Funds), a CFTC-registered commodity pool operator, NFA member and California registered investment adviser; and (4) Altegris
Clearing Solutions, LLC, a CFTC-registered futures introducing broker and commodity trading advisor and NFA member. The Altegris Companies
and their affiliates have a financial interest in the products they sponsor, advise and/or recommend, as applicable. Depending on the investment,
the Altegris Companies and their affiliates and employees may receive sales commissions, a portion of management or incentive fees,
investment advisory fees, 12b-1 fees or similar payment for distribution, a portion of commodity futures trading commissions, margin interest and
other futures-related charges, fee revenue, and/or advisory consulting fees.
Genworth Financial, Inc. (NYSE:GNW) is a leading Fortune 500 insurance holding company with more than $100 billion in assets and employs
approximately 6,500 people. Genworth has leadership positions in offerings that assist consumers protect themselves, invest for the future and
plan for retirement, and also offers mortgage insurance to help consumers achieve homeownership while assisting lenders manage risk and
capital.

© 2011 Altegris Advisors. PAST RESULTS ARE NOT NECESSARILY INDICATIVE OF FUTURE RESULTS. The risk of loss in trading commodities can be substantial. See Important Risk Disclosures at the end of this document.