
Headwater streams – what are they and what do they do?Ken Fritz and Brent Johnson
Photo image area measures 2” H x 6.93” W and can be masked by a collage strip of one, two or three images.
The photo image area is located 3.19” from left and 3.81” from top of page.
Each image used in collage should be reduced or cropped to a maximum of 2” high, stroked with a 1.5 pt white frame and positioned edge-to-edge with accompanying images.
Although this work was reviewed by EPA and approved for publication, it may not necessarily reflect official Agency policy.
Office of Research and DevelopmentNational Exposure Research Laboratory, Ecological Exposure Research Division May 24, 2011
Although this work was reviewed by EPA and approved for publication, it may not necessarily reflect official Agency policy.

Outline of presentation• What are headwater streams?
- Where are they?C t f h d t- Components of headwater catchments
- Longitudinal transitions• Hydrology of headwater streams
- Major flowpaths- Expansion – contractionExpansion contraction- How to characterize permanence
• Headwater stream functionsSt t d f ti- Structure and function
- What are the vitals and how to measure them
1

What are headwater streams?
• Subjective term for a small tributarytributary– depends on context and scale
• Tributaries are permanent longitudinal features (bed g (& banks) where water & associated materials from surface runoff and/or
Bank
Bank
Streambed
surface runoff and/or ground water are concentrated & mixed at
2
the land-atmosphere interface.
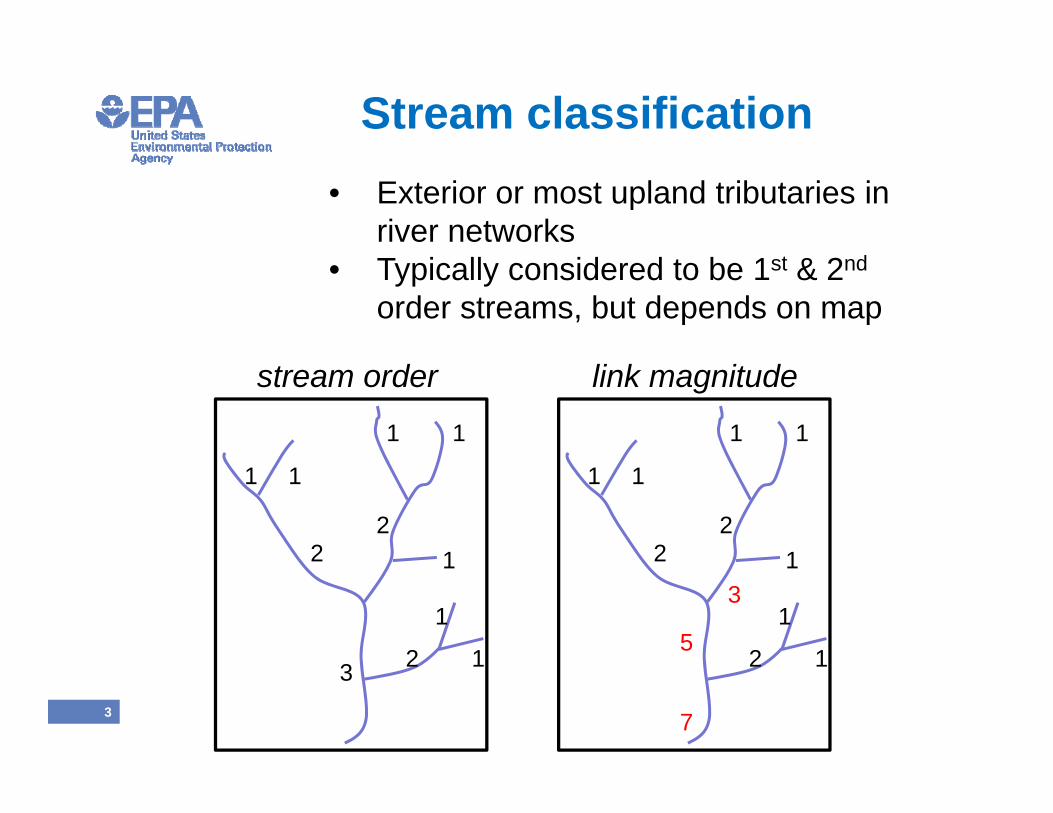
Stream classification• Exterior or most upland tributaries in
river networks• Typically considered to be 1st & 2nd
order streams, but depends on map
1 1
stream order link magnitude
1 1
1 1
12
2
1 1
12
21
1
1
2
2
31
1
1
2
25
3
123
7
12

Extent of headwater streams
1500000osed
) Stream numberTotal length
headwaters: 94.9% of streams & 73.2% of total lengthto
tal m
iles
(clo
1500
mi)
ota e gtAverage length
1000000
er (o
pen)
and
1000
rage
leng
th (m
500000
Stre
am n
umbe
500
Aver
0 0
2 4 6 8 10
Order3 5 91 7
4 (from Leopold et al. 1964)

Headwater streams: a national picturepicture
Headwater Stream Length as a Percentage of Total Stream Length% Headwater Streams% Headwater Streams
01-1920 -3637-4849-5758-100
State boundary
5 (from Nadeau and Rains 2007)
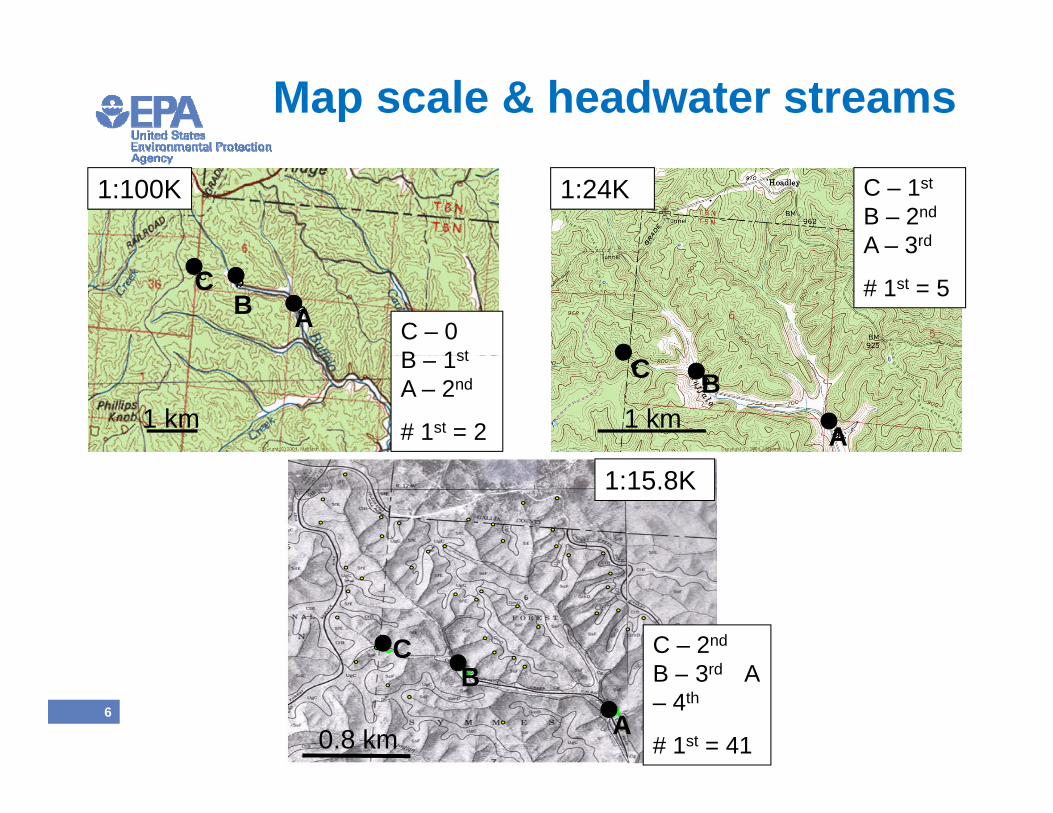
Map scale & headwater streams
C – 1st
B – 2nd
A – 3rd
1:24K1:100K
A 3
# 1st = 5CB A C – 0
B 1st
B
A
C
1 km
B – 1st
A – 2nd
# 1st = 21 km
1:15.8K
c C – 2nd
dC
6 a
b B – 3rd A – 4th
# 1st = 41A
B
0.8 km

Extent of headwater streams
National Field surveying the position Hydrographic Database (NHD) total stream length : 233 km
y g pof channel origins & hydrologic transition zones
length : 233 kmEstimate extent of headwater streams within surrounding HUC based on
Generated prediction total
surrounding HUC based on field determined Flow Accumulation Coefficients.
stream length: 527 km
Comparisons to existing resource databases.
7

NHD coming up short?Total stream length (km)Location HUC drainage
area (km2) NHD 1 24 K
Generated Percent
additional l th1:24 K length
Robinson Forest, KY 7.5 12 28 +133.3 Wayne N.F., OH 45.4 17 49 +188.2 Dodge Brook, NH 76.3 151 317 +109.9Dodge Brook, NH 76.3 151 317 109.9Edge of Appalachia, OH 77.5 2 28 +1300.0 Hoosier N.F., IN 91.4 39 49 +25.6 Lower Big Sandy, WV 104.3 114 299 +162.3 Shawnee N F IL 128 7 233 527 +125 9Shawnee N.F., IL 128.7 233 527 +125.9Silver Creek, WA 131.4 242 511 +111.4 Cheat River, WV 158.4 179 454 +153.6 Huntington River, VT 172.3 276 508 +84.1g ,Beaverkill, NY 251.3 255 481 +88.8 Fir Brook, NY 342.8 438 701 +60.0
n = 12 X = +114.4
8
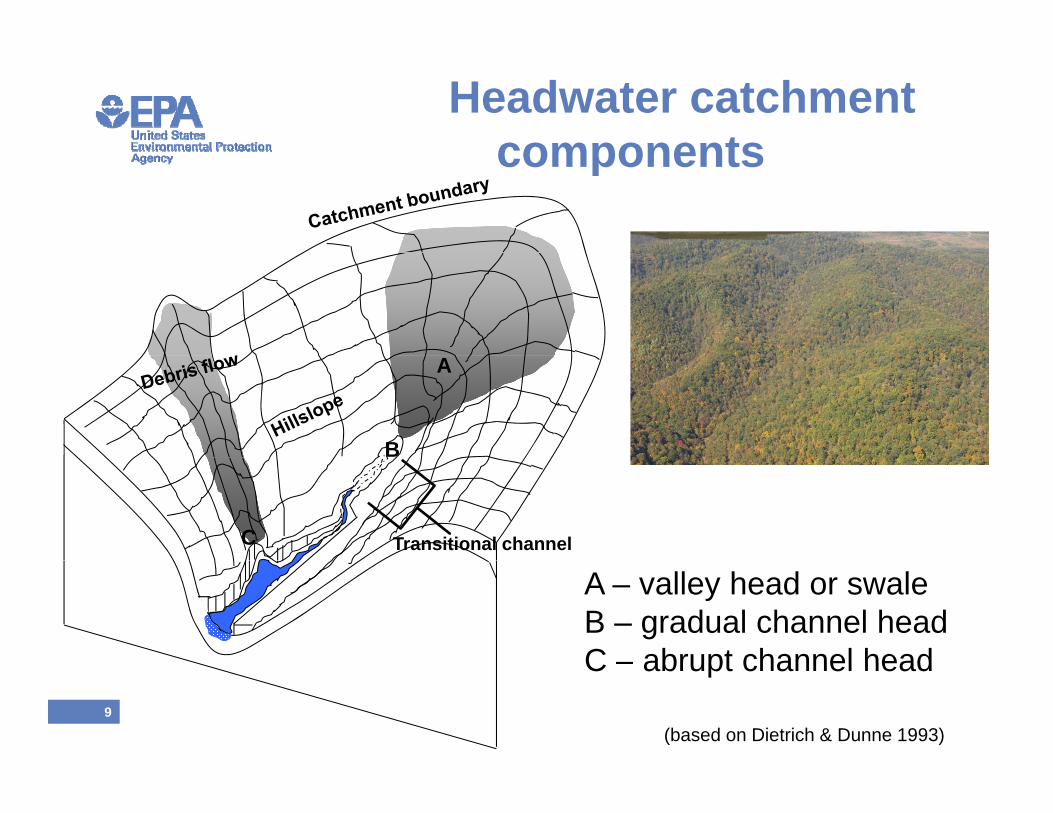
Headwater catchment componentscomponents
A
B
C Transitional channel
A – valley head or swaleB – gradual channel headC – abrupt channel head
9
C – abrupt channel head
(based on Dietrich & Dunne 1993)

A longitudinal tour
10

Drainage area: 1.9 haSlope: 46.3%D : 128 mm (cobble boulder)D50: 128 mm (cobble-boulder)Steep sideslopes Colluvial/cascade
11
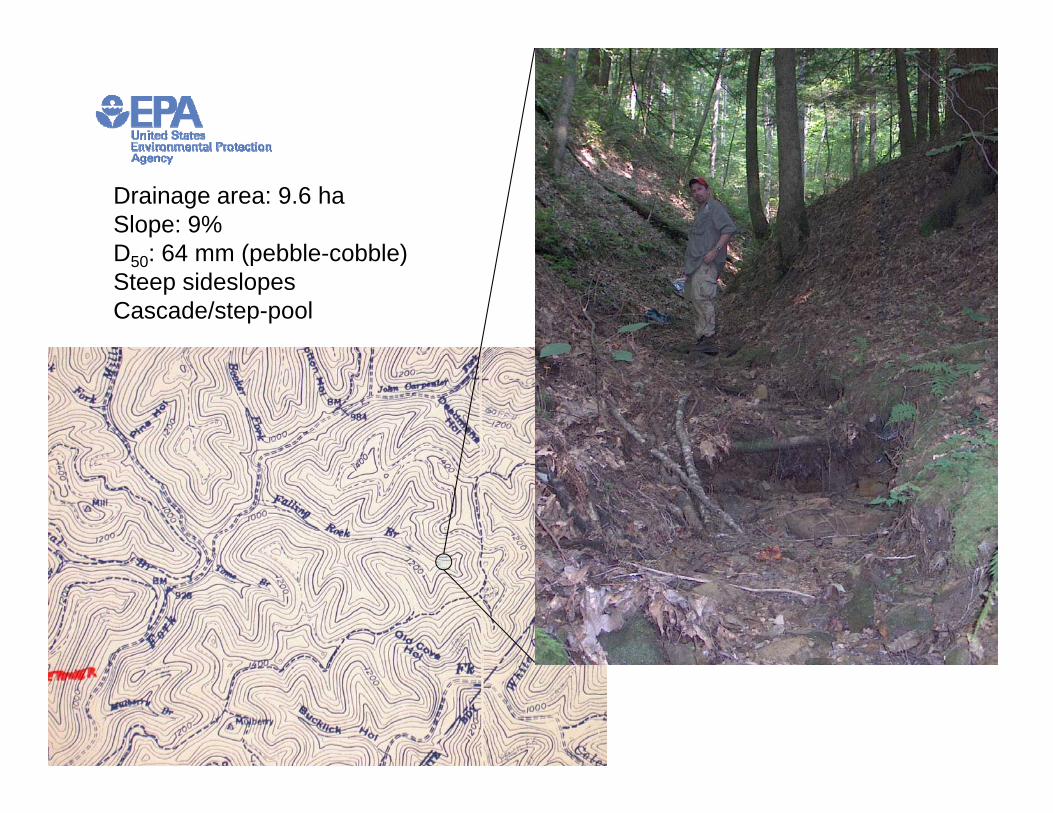
Drainage area: 9.6 haSlope: 9%D : 64 mm (pebble cobble)D50: 64 mm (pebble-cobble)Steep sideslopesCascade/step-pool
12
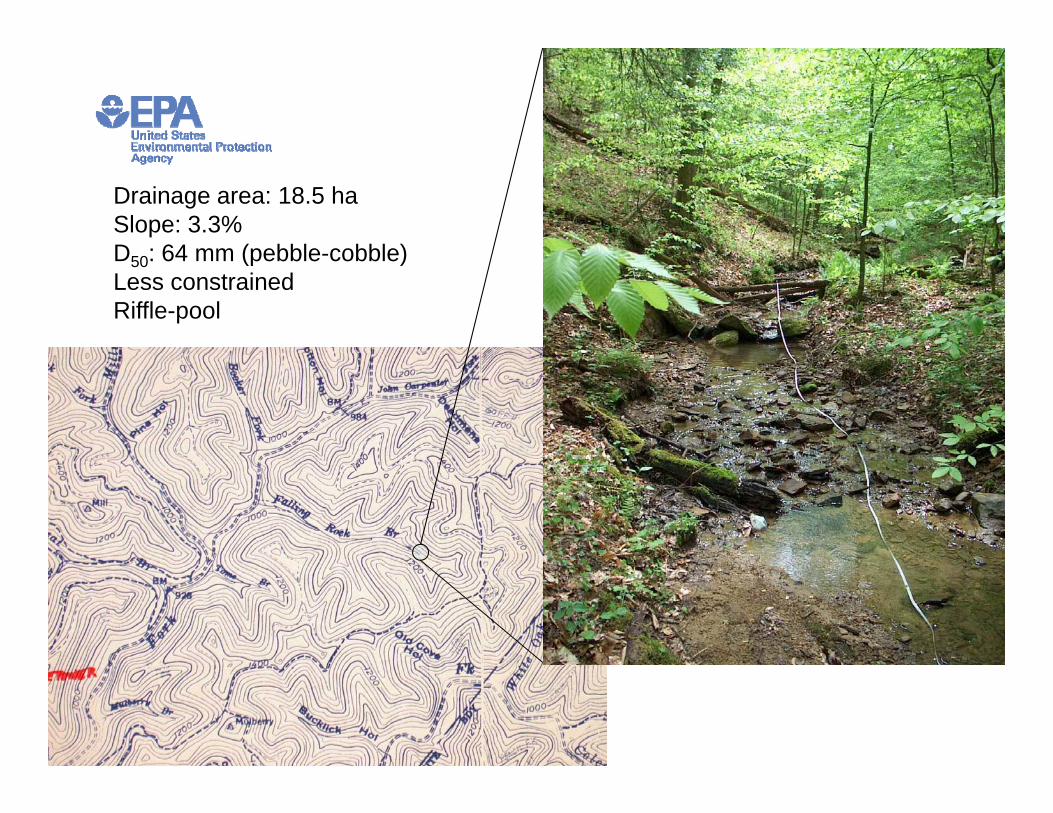
Drainage area: 18.5 haSlope: 3.3%D : 64 mm (pebble cobble)D50: 64 mm (pebble-cobble)Less constrainedRiffle-pool
13
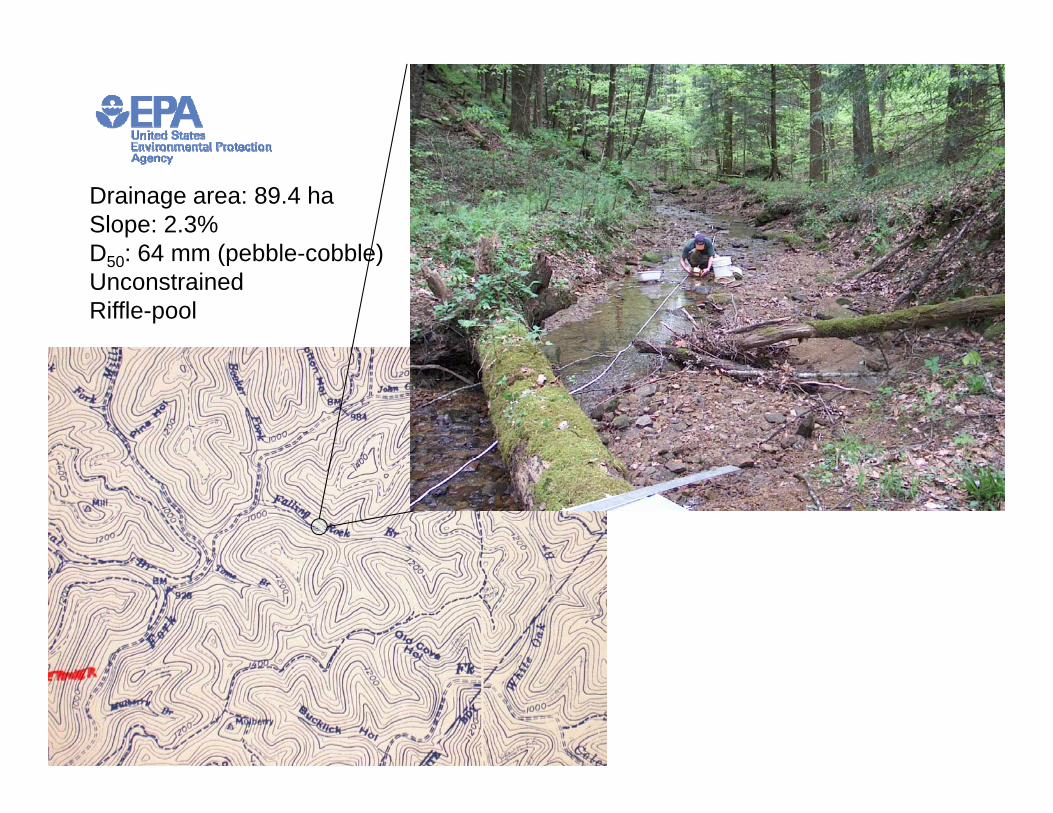
Drainage area: 89.4 haSlope: 2.3%D : 64 mm (pebble cobble)D50: 64 mm (pebble-cobble)UnconstrainedRiffle-pool
14
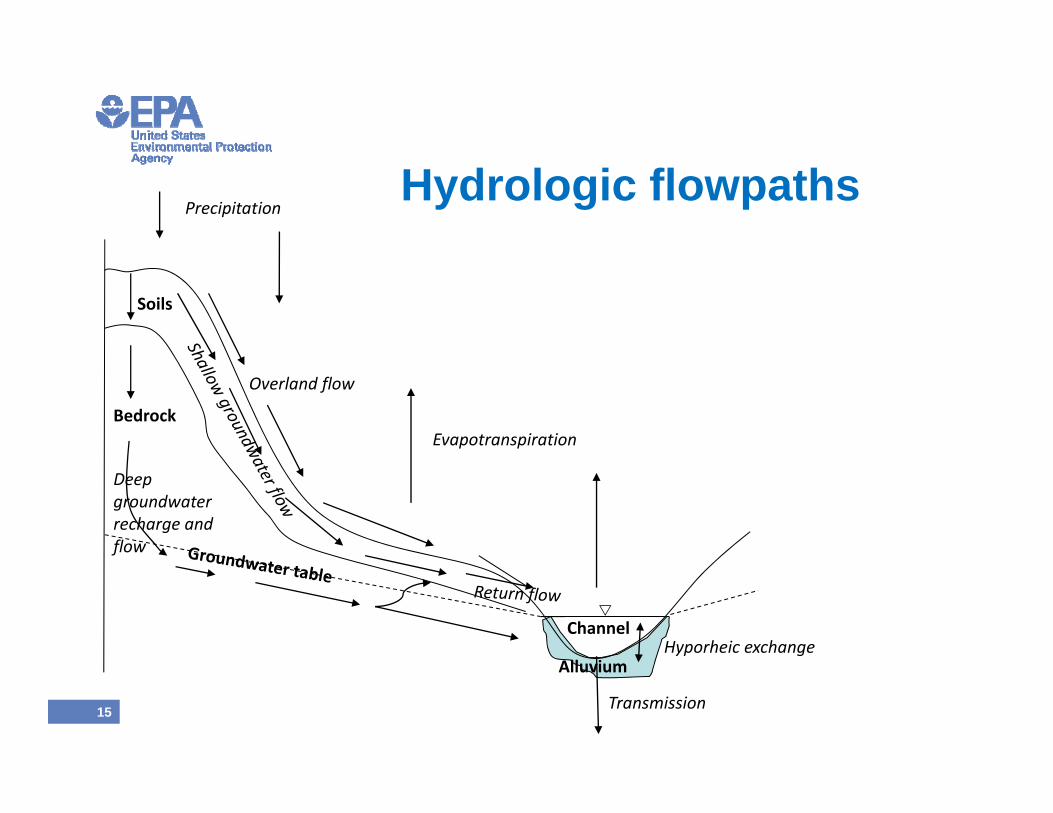
PrecipitationHydrologic flowpaths
Soils
Overland flow
EvapotranspirationBedrock
Deep groundwater recharge and flow
ChannelHyporheic exchange
All i
15 Transmission
Alluvium
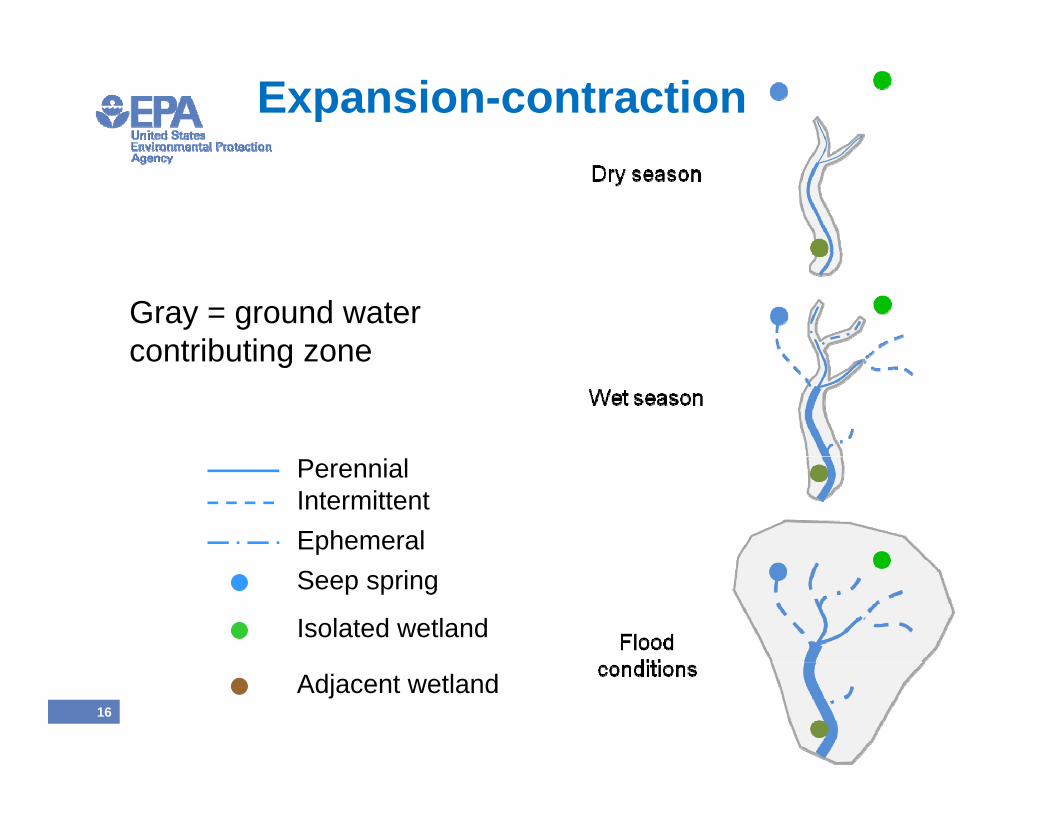
Expansion-contraction
Gray = ground water contributing zonecontributing zone
PerennialIntermittentEphemeralSeep spring
Isolated wetland
16
Adjacent wetland
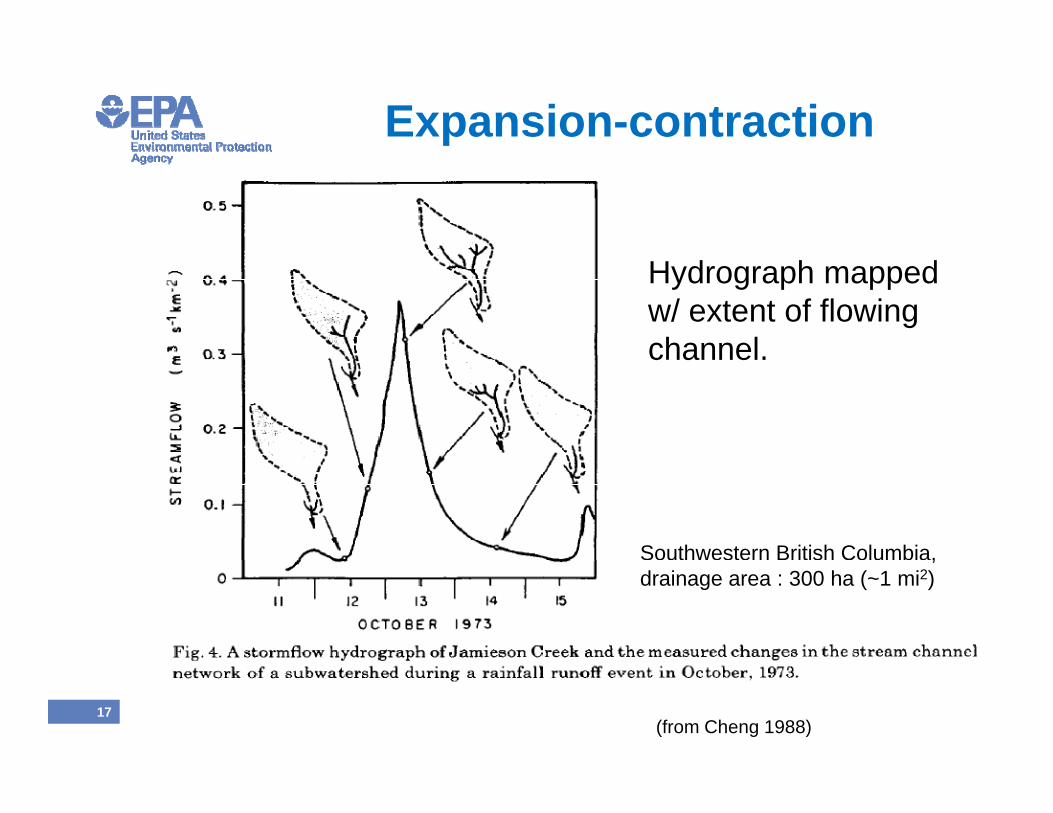
Expansion-contraction
Hydrograph mapped w/ extent of flowing channelchannel.
Southwestern British Columbia, ,drainage area : 300 ha (~1 mi2)
17(from Cheng 1988)

Hydrologic Permanence• Ephemeral, intermittent & perennial• But permanence varies continuously(rather than categorically) in frequency, duration & timing
• Interannual variation• Interannual variation• Longitudinal gradient, but can be discontinuous over space
• Surface and subsurface• Direct and indirect methods to
h t i18
characterize
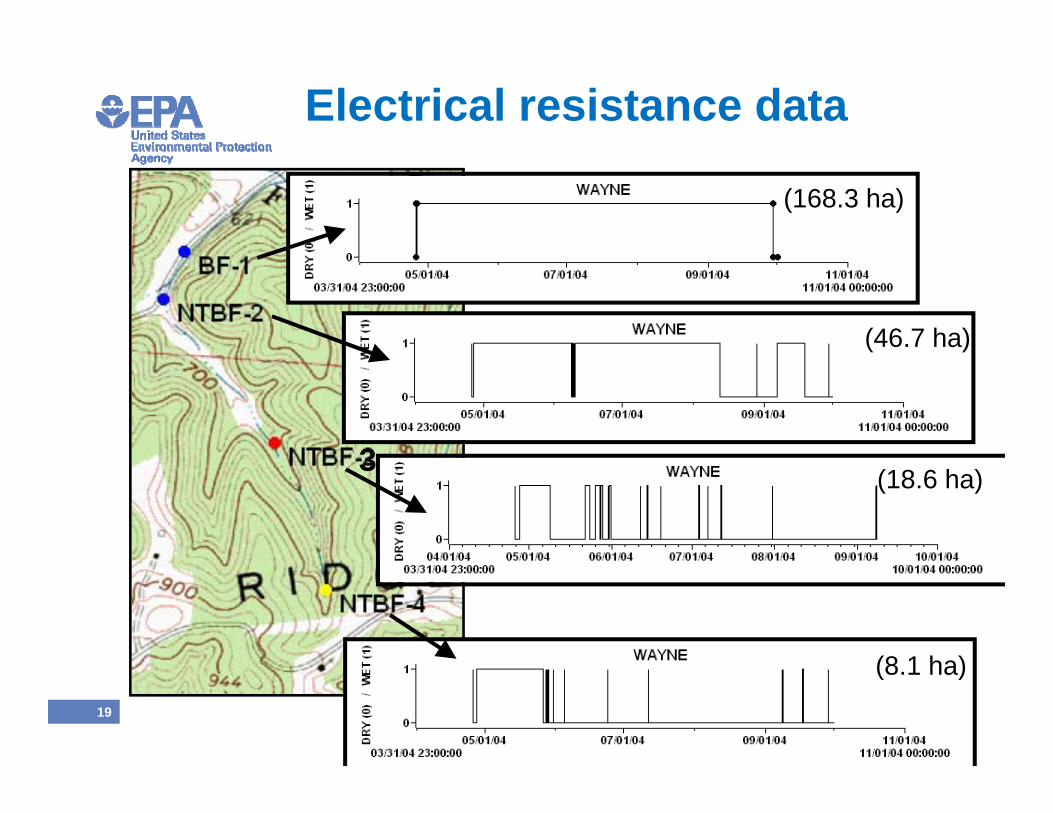
Electrical resistance data
(168.3 ha)
(46.7 ha)
3 (18.6 ha)3
(8 1 ha)19
(8.1 ha)

Structural Measures of Stream Condition
Woody debris
Canopy cover
Woody debris
Geomorphology
Streambed particle
Pools
Algal
Riparian vegetation
Streambed particle size
Current velocity Riffles
Algal biomass RBPs
Current velocity Riffles
Invertebrate diversity
Salamander abundance

Functional Measures of Stream Condition
Organic matter retention
Organic matter inputLeaf decomposition
Organic matter retention
Energy management
Hydrologic exchangeColonization
Primary production
Nutrient uptake
Benthic metabolism
p
Secondary productionOrganic matter export
Sediment retention
g p

What do Appalachian headwater t d ?streams do?
Intimately linked to hillslopesRepresent sources to the network
• Supply water• Store transform and transport
Represent sources to the network
• Store, transform and transport organic matter/energy (metabolism & production)
• Store and transport sediment• Store, transform & transport
nutrientsnutrients• Buffer water temperature
Not necessarily continuously
22
y yCumulatively over time & space
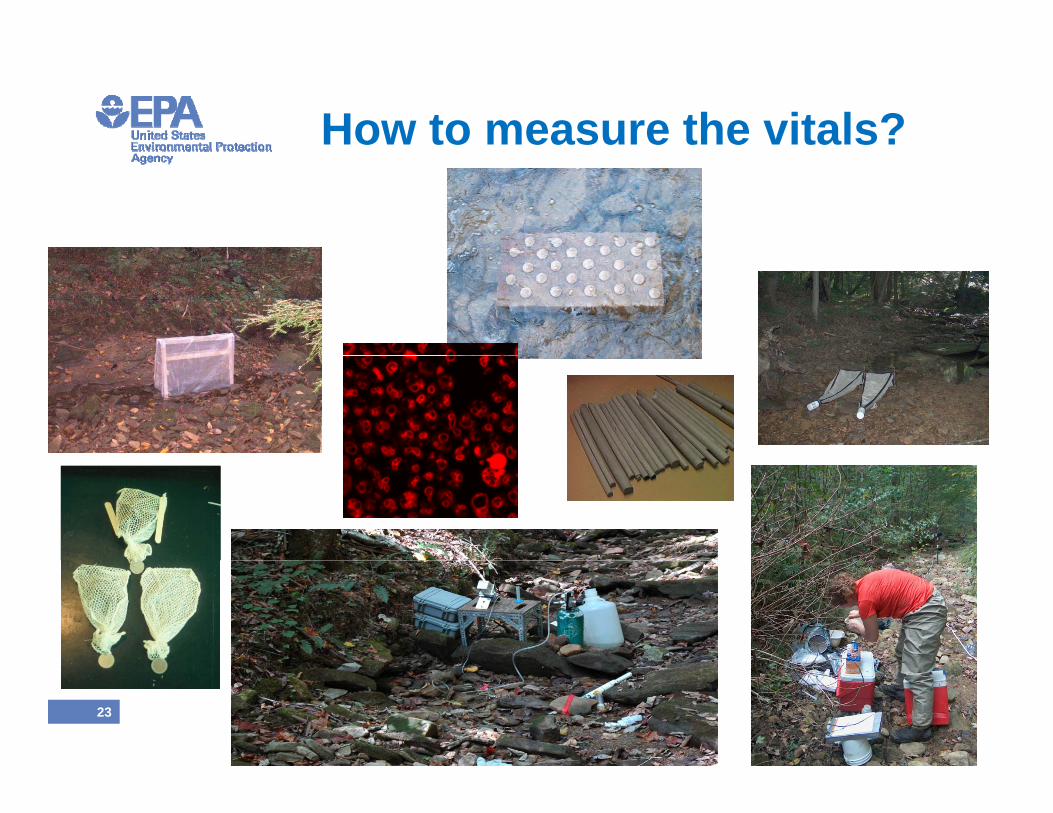
How to measure the vitals?
23
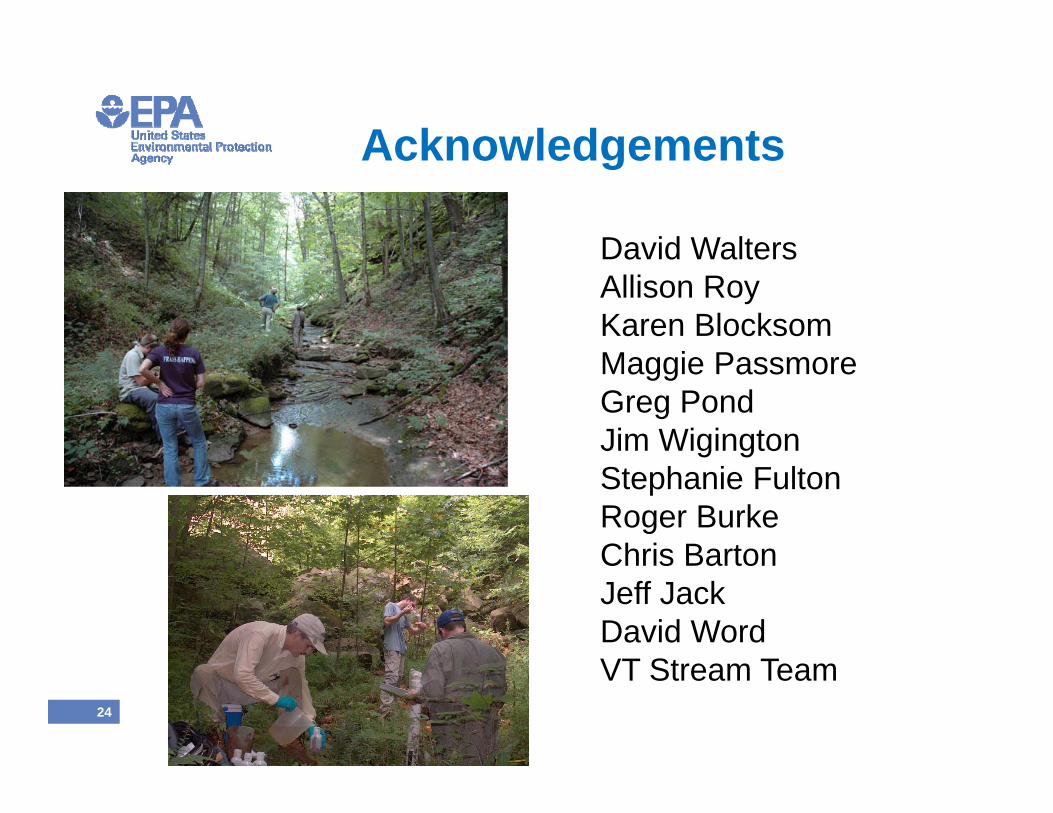
AcknowledgementsAcknowledgements
David WaltersDavid WaltersAllison RoyKaren BlocksomM i PMaggie PassmoreGreg PondJim WigingtonStephanie FultonRoger BurkeChris BartonChris BartonJeff JackDavid WordVT St T
24
VT Stream Team


