
H A R S H A A N A N T H A RA M A N
DATA-DRIVEN PLANNING FOR SOLID WASTE MANAGEMENT IN CHENNAI


CONTENTS
• The need for a rational approach to MSWM Planning• The data collection and survey methodology
developed in response to this need• Planning from Data: how data supports decision-
making• The methodology developed for participatory
planning
(Grounded in our experience in Ward 173, Chennai) • How these processes can be adapted to different
contexts

THE NEED FOR A RATIONAL APPROACH TO MWSM PLANNING
OUR EXPERIENCE IN WARD 173
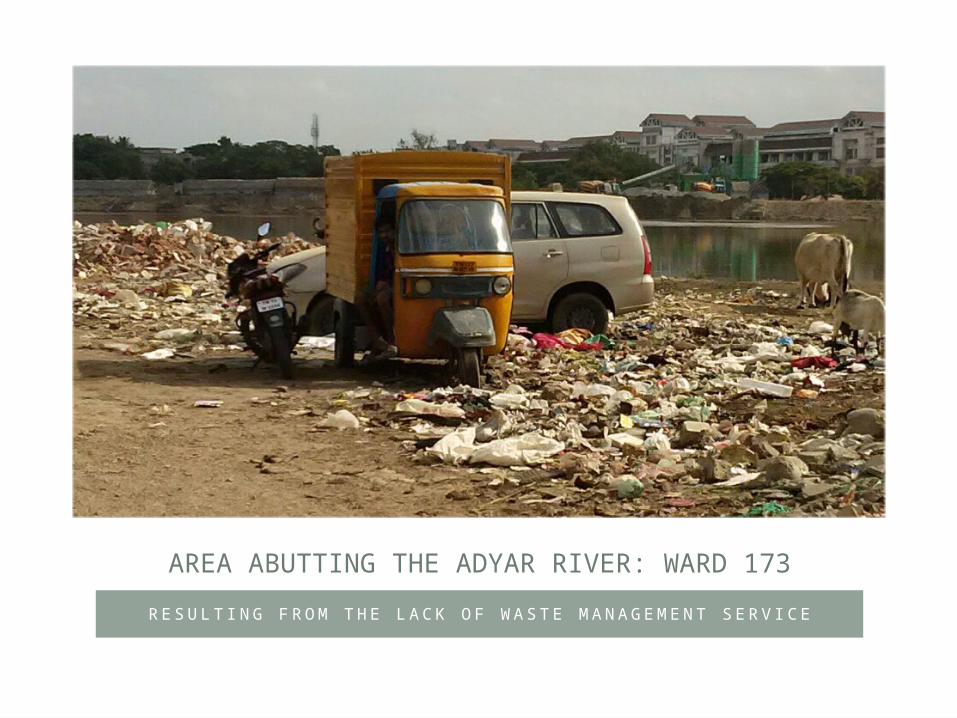
AREA ABUTTING THE ADYAR RIVER: WARD 173
R E S U LT I N G F R O M T H E L A C K O F WA S T E M A N A G E M E N T S E RV I C E
IMPACT OF POOR DATA ON SWM
• Poor waste collection in general• Low income households become invisible and are
not accounted for while planning waste collection systems• Leading to unhygienic disposal, pollution of
waterways, local garbage dumps • No specialized mechanisms for dealing with
special waste generators and bulk waste generators• Dumpsites are fast reaching capacity and scarcity
of land underline the need for sustainable alternatives

IMPACT OF POOR DATA ON SWM
• Poor understanding of MSW and how to deal with it sustainably• Specifically: • No planning for resource recovery• Dumping of organic waste leading to higher
greenhouse gas emissions • Unsanitary dumping of harmful and hazardous
substances leading to pollution of ground water

AN EXAMPLE: POOR DATA
Zone wise
Zone TPD
No. of Wards /Zone
Ward TPD (basis: zone)
No. of HH/ Ward
Waste generation/HH*
Waste generation/HH
Ward TPD (basis: per capita)
% diff. between col 3 & 7
Column 1 2 3 4 5 6 7 8
Source From RFP (CoC)
From RFP (CoC)
Col 1/2 From RFP (CoC)
Col 3/4 From Contract
Col 4*6 Comparing
Zone 9 530 18 29.44 9222 3.19 2.4 22.13 33%Zone 10 525 16 32.81 9563 3.43 2.4 22.95 43%Zone 13 425 13 32.69 9000 3.63 2.4 21.60 51%* In kgs. This column calculates the waste generation per household per day based on total waste generation and number of households. This data is provided in the Request For Proposal document.

AN EXAMPLE: IMPACT OF POOR DATA
• As per CoC documents, the number of households in Ward 173 is 9000 • But the actual number of households in Ward 173
as per data collected in May-July 2014 is 14,443• Including small commercial establishments this
number is 15,388: a difference of 41.5%
This explains the poor service provision and why the door-to-door collection and garbage clearance levels are so low!

A DATA COLLECTION AND SURVEY METHODOLOGY
AS IMPLEMENTED IN WARD 173

WHAT DO WE NEED TO KNOW
• The number and location of different categories of waste generators in the ward i.e. the households, small businesses and bulk waste producers • Total and per capita waste generation in Ward
173• Composition of waste generated • Potential sites for decentralized waste processing
facilities • Waste management habits

METHODOLOGY
To collect this data requires a two pronged methodology: • Mapping to collect • Location and numbers of different waste generators• Logistical information for planning (open spaces, roads,
terrain, etc.)
• Sample survey to collect information on kind of waste generated, present methods of disposal, and present habits of waste management

P R I N T E D M A P S A R E U S E D T O M A P M A N U A L LY W I T H A C C O M PA N Y I N G D ATA S H E E T S
PAPER MAPPING: UNMARKED SEGMENT

S H O W I N G C LU S T E R S , D U M P S T E R S , A BW P , A N D A S H O P
PAPER MAPPING: A MARKED SEGMENT

U N I Q U E I D W I T H S E G M E N T , T Y P E O F I N F RA S T R U C T U R E , N O. O F H H A N D S H O P S
SCREENSHOT OF QGIS SHOWING NON-BULK DATA

U N I Q U E I D , T Y P E , N O . O F H H / S H O P S , A D D , C O N TA C T D E TA I L S , E T C .
SCREENSHOT OF QGIS SHOWING BULK DATA

B LU E I N D I C AT E N O N B U L K , G R E E N I N D I C AT E B U L K
WARD 173 MAPPED DATA

W I T H R O A D S , A N D W A S T E R E L A T E D D A T A T H I S M A P C A N B E U S E D T O P L A N F O R A L L S W M L O G I S T I C S A C C U R A T E LY
MAP SHOWING DIFFERENT WASTE GENERATORS

METHODOLOGY
Sample Survey in Ward 173• Systematic random sampling used to select 5% of
the households in the Ward for the survey• Mapping data used to determine sample• Results of the survey to be extrapolated for SWM
solutions for the entire Ward• Sample survey conducted in two phases –
Recruitment & Collection

1 5 O F 5 0 ( 3 0 % ) B LO C K S S E L E C T E D AT RA N D O M
50 BLOCKS OF 250-300 HOUSEHOLDS CREATED
METHODOLOGY
Sample Survey in Ward 173: Recruitment• Within each of the 15 selected blocks, we selected
50 households (roughly 20%) and 4 shops per block using systematic random sampling
• Recruitment involved approaching selected households and shops requesting their participation in the survey
• Recruited units were provided dustbins for segregation, pictoral instructions, and garbage bags for nine days
• Sample Size in Ward 173: 750 Households, 48 Shops

U S I N G S Y S T E M AT I C RA N D O M S A M P L I N G
BLOCK SHOWING SAMPLE SELECTION

METHODOLOGY
Sample Survey in Ward 173: Collection Segregated waste – organic, inorganic and
sanitary – collected from the sample households & shops for nine consecutive days early every morning
Waste collected was then weighed & weight recorded for each category
Inorganic waste further segregated into recyclables and residuals

C O N S E RVA N CY W O R K E R S TA N D S W I T H S E G R E G AT I O N B I N S
SEGREGATED COLLECTION

R E C O R D I N G D ATA O N WA S T E G E N E RAT I O N & C O M P O S I T I O N
WEIGHING GARBAGE BAGS

R E C O R D I N G D ATA O N WA S T E G E N E RAT I O N & C O M P O S I T I O N
WEIGHING GARBAGE BAGS

PLANNING FROM DATADATA FOR BETTER DECISION MAKING

PLANNING FROM DATA
• Basic principles of waste hierarchy, protecting livelihoods, sustainability, inclusiveness, equity
• Benchmarks and thumb rules: researched and compiled
• Leveraging existing sustainable systems, such as the informal waste workers
• For example: • Number of units for collection per worker team = 200 to 220 • Optimal size of composting unit – not more than 2 MT • Optimal size of biogas plant – 5 MT• Optimal area for secondary segregation of dry waste: 1 MT
= 1600 sq. ft.
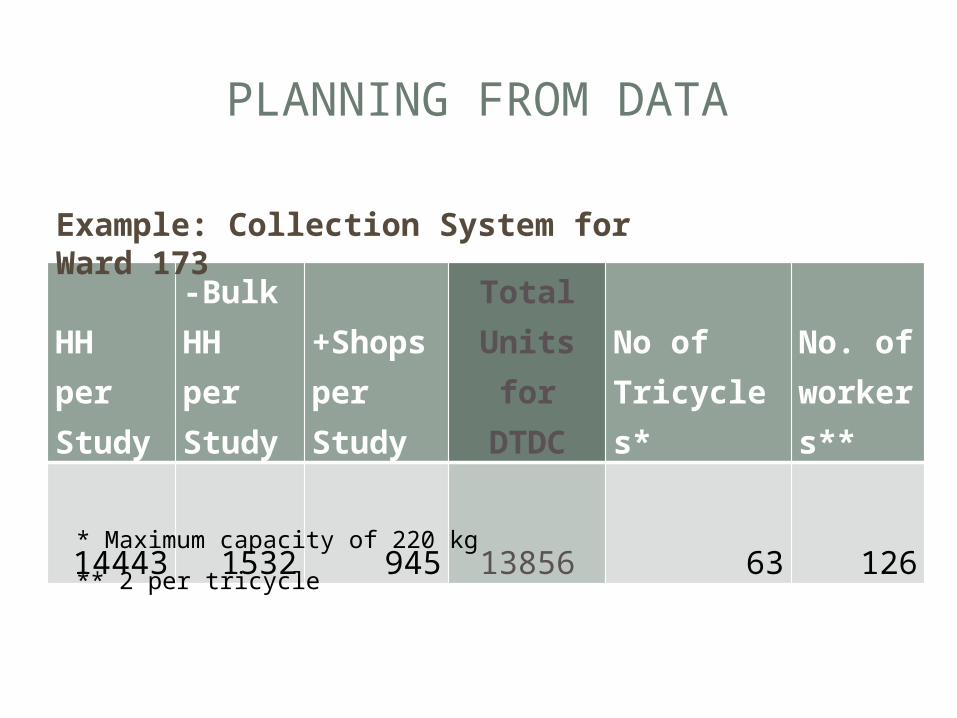
PLANNING FROM DATA
HH per Study
-Bulk HH per Study
+Shops per Study
Total Units for
DTDC
No of Tricycles*
No. of workers**
14443 1532 945 13856 63 126* Maximum capacity of 220 kg
** 2 per tricycle
Example: Collection System for Ward 173

WA R D 1 7 3

AVERAGE WASTE GENERATION PER HOUSEHOLD PER DAY

WASTE GENERATION BY HOUSEHOLDS IN WARD 173

WASTE GENERATION BY SHOPS IN WARD 173

PRIMARY CATEGORISATION OF RECYCLABLE WASTE

PERCENTAGE COMPOSITION OF RECYCLABLE WASTE
WA R D 1 7 3

TOTAL ESTIMATED WASTE GENERATION IN WARD 173

WA R D 1 7 3
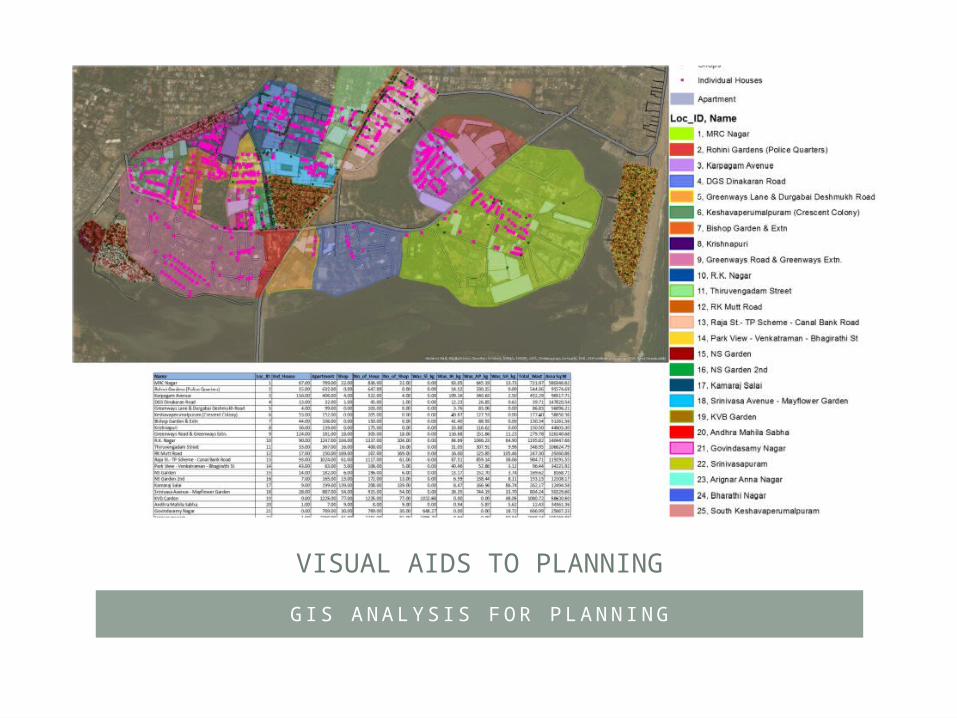
G I S A N A LY S I S F O R P L A N N I N G
VISUAL AIDS TO PLANNING

P L A N N I N G F O R R E S O U RC E R E C OV E RY PA R K S
OPEN AREAS AND AMOUNT OF WASTE GENERATED

PARTICIPATORY PLANNING

PARTICIPATORY PLANNING
At every stage• In Planning:• The conception of a ward level pilot • The pilot proposal based on data collected
• In Data Collection: mapping, surveys, etc. • In Conceptualising: through community meetings,
one-on-one interactions, and distribution of flyers• Implementation: citizen monitoring committees,
etc.• Necessary for public consultation prior to deciding
location of RRPs

S R I N I VA S A P U RA M , WA R D 1 7 3
COMMUNITY MEETING TO PRESENT FINDIJNGS
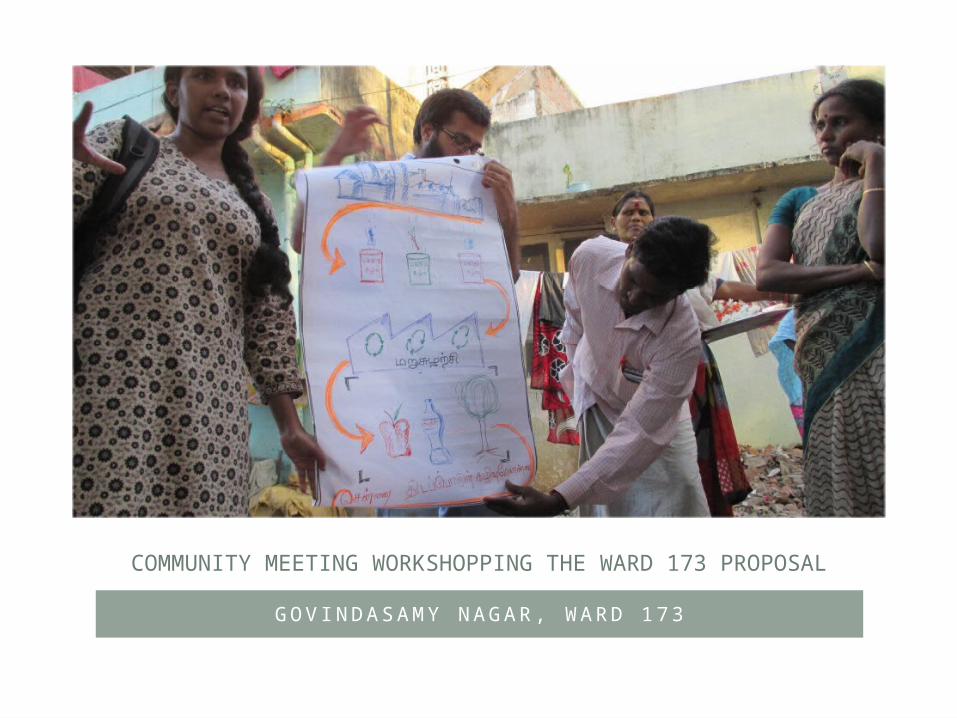
G OV I N DA S A M Y N AG A R , WA R D 1 7 3
COMMUNITY MEETING WORKSHOPPING THE WARD 173 PROPOSAL

ADAPTING THE METHODOLOGY FOR DIFFERENT CONTEXTS

ADAPTING ACCORDING TO CONTEXT
• The simple question is:
What do we need to know to plan better?
• Low cost & Low tech.
• Waste Diagnostic Toolkit; Waste Diagnostic Report.

THANK YOU!QUESTIONS?


