
Supply Chain ContinuityHow GoPro Coped with US West Coast Ports Congestion 2014-2015
2015 NAFTZ Annual Conference – Los Angeles, CA
Jeremiah Pomerleau
Senior Manager, Transportation and Trade Compliance
Key Milestones – US WC Port Congestion
Supply Chain Overview
Business Factors & Constraints
Options & Competing Forces
Strategy, Execution & Rationale
Financial & Delivery Impact
Success Factors
Agenda

MAY DEC
Port Congestion – Key Milestones
JAN MARFEB
2015
FEB 16
JUN JUL AUG SEP OCT MAYNOV APR JUN JUL
ILWU / PMA Negotiations Begin Tentative 5-year Deal Reached
ILWU/PMW Ratify DealUS Labor Secretary Mediates
ILWU Initiates Slowdown
Contract Expiration!
End of Backlog In-Sight
JUN 30
FEB 20MAY 14
2014
OCT 31 JUN 15
Congestion Meter
MAY 15

4
2014 AMR Postponement Supply Chain – Inbound
Ocean Freight (SEA)
Transit: 40/40HC service @ 24 Days DTD
Lower-box Assemblies (LBA)
Finished Goods Accessories (ACC)
International Air Freight (IAF)
Transit: 3 Services @ 1.5 to 4 Days DTD
Bulk Cameras only (CAM)
HKG->LGB
GoPro DC (B2B)
Riverside, CA
Futian FTZ
Hong Kong X-Dock
HKG
Intra-China Logistics Flow
Key Metrics
IAF/SEA Mix @ 60% SEA
IAF Premium @ ≤ 25%
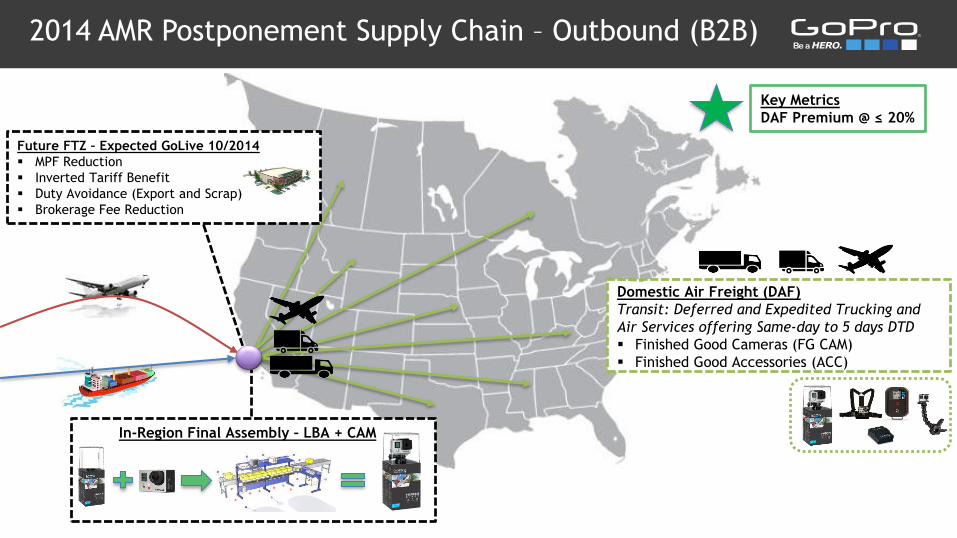
2014 AMR Postponement Supply Chain – Outbound (B2B)
In-Region Final Assembly – LBA + CAM
Domestic Air Freight (DAF)
Transit: Deferred and Expedited Trucking and
Air Services offering Same-day to 5 days DTD
Finished Good Cameras (FG CAM)
Finished Good Accessories (ACC)
Key Metrics
DAF Premium @ ≤ 20%
Future FTZ – Expected GoLive 10/2014
MPF Reduction
Inverted Tariff Benefit
Duty Avoidance (Export and Scrap)
Brokerage Fee Reduction
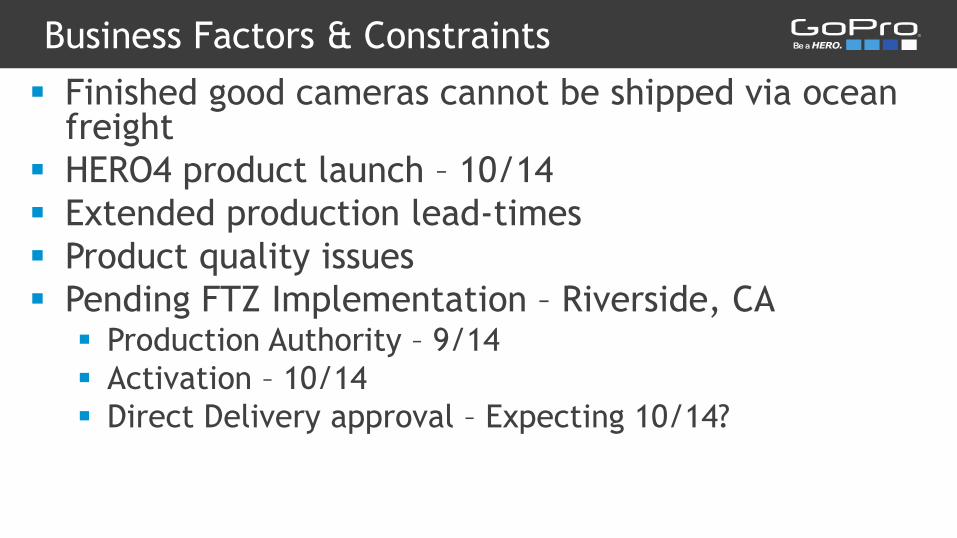
Business Factors & Constraints
Finished good cameras cannot be shipped via ocean freight
HERO4 product launch – 10/14
Extended production lead-times
Product quality issues
Pending FTZ Implementation – Riverside, CA Production Authority – 9/14
Activation – 10/14
Direct Delivery approval – Expecting 10/14?
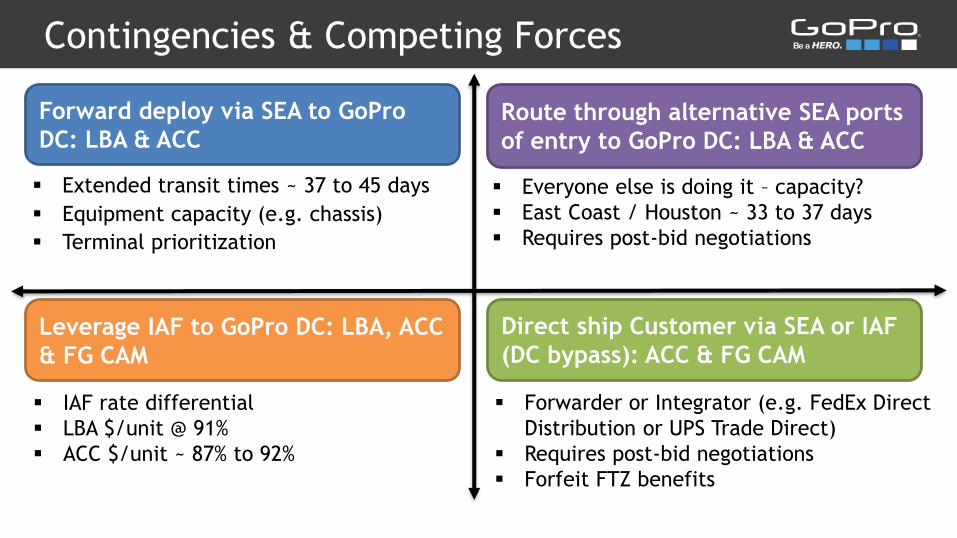
Contingencies & Competing Forces
Forward deploy via SEA to GoPro
DC: LBA & ACC
Extended transit times ~ 37 to 45 days
Equipment capacity (e.g. chassis)
Terminal prioritization
Route through alternative SEA ports
of entry to GoPro DC: LBA & ACC
Leverage IAF to GoPro DC: LBA, ACC
& FG CAM
Direct ship Customer via SEA or IAF
(DC bypass): ACC & FG CAM
Forwarder or Integrator (e.g. FedEx Direct
Distribution or UPS Trade Direct)
Requires post-bid negotiations
Forfeit FTZ benefits
IAF rate differential
LBA $/unit @ 91%
ACC $/unit ~ 87% to 92%
Everyone else is doing it – capacity?
East Coast / Houston ~ 33 to 37 days
Requires post-bid negotiations

Strategy, Execution & Rationale
•Avoided rerouting due to DC’s proximity to port
•Built inventories of LBA and ACC
•Factored 45 days transit into forecast
•Shifted to a new vessel operator, Evergreen -dedicated terminal (~37 to 38 days)
Forward deploy via SEA to GoPro DC:
LBA & ACC
•Sustainable flat-rate pricing - immune to peak season
•Guaranteed capacity with hard block space agreements
•Imported primarily ACC and LBA while CAM continued to ship in bulk
Leverage IAF to GoPro DC:
LBA, ACC & FG CAM

9
Level-set customer expectations
Communicated business continuity plan
Enhanced order management focus –
inventory levels and customer forecasts
Sourced contingency IAF direct rates to key
customer DCs and Stores
Strategy, Execution & Rationale
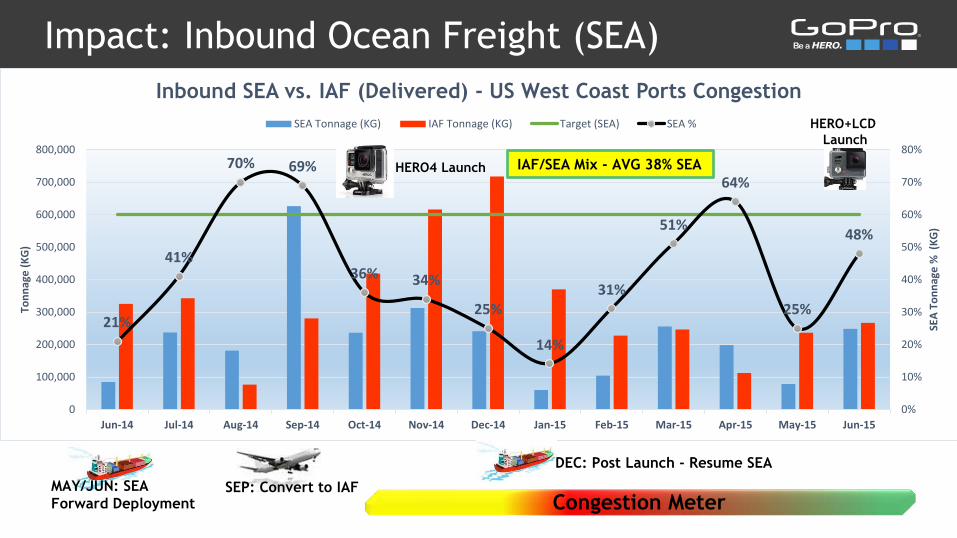
Impact: Inbound Ocean Freight (SEA)
21%
41%
70% 69%
36% 34%
25%
14%
31%
51%
64%
25%
48%
0%
10%
20%
30%
40%
50%
60%
70%
80%
0
100,000
200,000
300,000
400,000
500,000
600,000
700,000
800,000
Jun-14 Jul-14 Aug-14 Sep-14 Oct-14 Nov-14 Dec-14 Jan-15 Feb-15 Mar-15 Apr-15 May-15 Jun-15
SEA
To
nn
age
% (
KG
)
Ton
nag
e (
KG
)
Inbound SEA vs. IAF (Delivered) - US West Coast Ports Congestion
SEA Tonnage (KG) IAF Tonnage (KG) Target (SEA) SEA %
HERO4 Launch
HERO+LCD
Launch
Congestion Meter
IAF/SEA Mix - AVG 38% SEA
MAY/JUN: SEA
Forward DeploymentSEP: Convert to IAF
DEC: Post Launch - Resume SEA
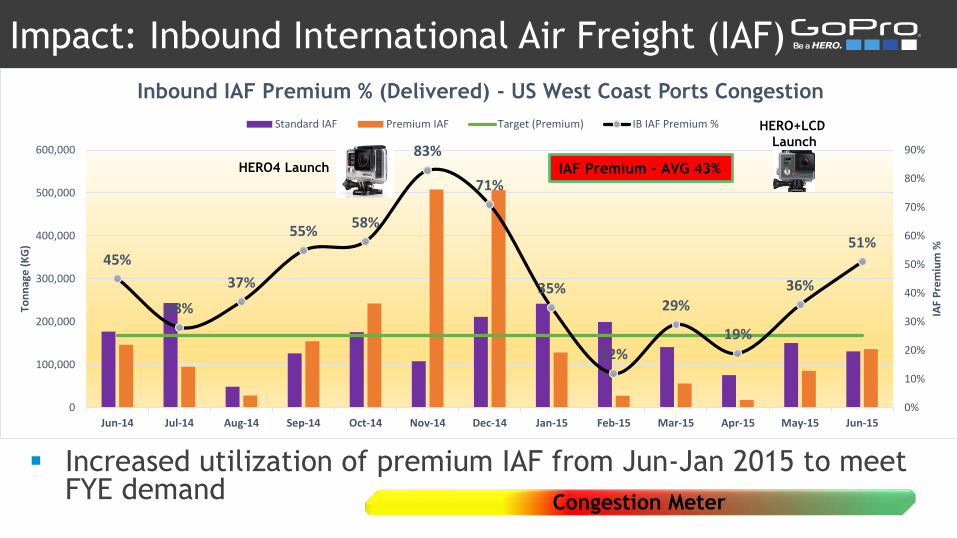
Impact: Inbound International Air Freight (IAF)
45%
28%
37%
55%58%
83%
71%
35%
12%
29%
19%
36%
51%
0%
10%
20%
30%
40%
50%
60%
70%
80%
90%
0
100,000
200,000
300,000
400,000
500,000
600,000
Jun-14 Jul-14 Aug-14 Sep-14 Oct-14 Nov-14 Dec-14 Jan-15 Feb-15 Mar-15 Apr-15 May-15 Jun-15
IAF
Pre
miu
m %
Ton
nag
e (
KG
)
Inbound IAF Premium % (Delivered) - US West Coast Ports Congestion
Standard IAF Premium IAF Target (Premium) IB IAF Premium %
Increased utilization of premium IAF from Jun-Jan 2015 to meet FYE demand
HERO4 Launch
HERO+LCD
Launch
Congestion Meter
IAF Premium - AVG 43%
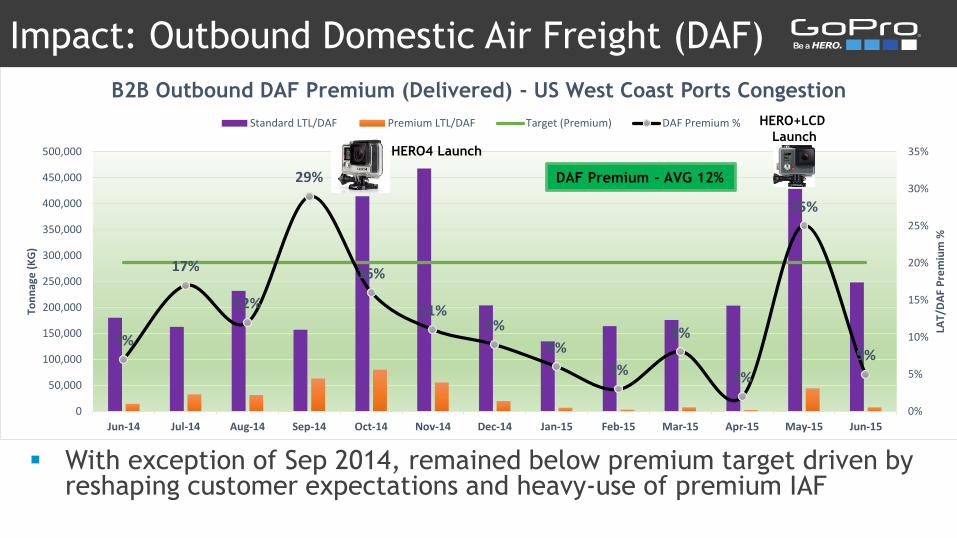
Impact: Outbound Domestic Air Freight (DAF)
7%
17%
12%
29%
16%
11%9%
6%
3%
8%
2%
25%
5%
0%
5%
10%
15%
20%
25%
30%
35%
0
50,000
100,000
150,000
200,000
250,000
300,000
350,000
400,000
450,000
500,000
Jun-14 Jul-14 Aug-14 Sep-14 Oct-14 Nov-14 Dec-14 Jan-15 Feb-15 Mar-15 Apr-15 May-15 Jun-15
LAT/
DA
F P
rem
ium
%
Ton
nag
e (
KG
)
B2B Outbound DAF Premium (Delivered) - US West Coast Ports Congestion
Standard LTL/DAF Premium LTL/DAF Target (Premium) DAF Premium %
With exception of Sep 2014, remained below premium target driven by reshaping customer expectations and heavy-use of premium IAF
HERO4 Launch
HERO+LCD
Launch
DAF Premium - AVG 12%

Key Success Factors
Focused attention to market news and industry analysis
Communication of business continuity plan to customers
Production output and lead-time planning aligned with real-time visibility to customer demand
Close collaboration with internal functions and external supply chain partners
Sustainable pricing structure with healthy mix of hard and soft block space agreements

All About the Love of Compliance…
GoPro
US CBP
T h a n k Yo u


