WHO/ILO Joint Estimates of theWork-related Burden ofDisease and Injury, 2000–2016
GLOBAL MONITORING REPORT

WHO/ILO Joint Estimates of theWork-related Burden ofDisease and Injury, 2000–2016
GLOBAL MONITORING REPORT
WHO/ILO joint estimates of the work-related burden of disease and injury, 2000-2016: global monitoring report
ISBN (WHO) 978-92-4-003494-5 (electronic version)ISBN (WHO) 978-92-4-003495-2 (print version)ISBN (ILO) 978-92-2-035431-5 (print) ISBN (ILO) 978-92-2-035432-2 (web PDF)
© World Health Organization and International Labour Organization, 2021
Some rights reserved. This work is available under the Creative Commons Attribution-NonCommercial-ShareAlike 3.0 IGO licence (CC BY-NC-SA 3.0 IGO; https://creativecommons.org/licenses/by-nc-sa/3.0/igo).
Under the terms of this licence, you may copy, redistribute and adapt the work for non-commercial purposes, provided the work is appropriately cited, as indicated below. In any use of this work, there should be no suggestion that the World Health Organization (WHO) or the International Labour Organization (ILO) endorse any specific organization, products or services. The unauthorized use of the WHO or ILO names or logos is not permitted. If you adapt the work, then you must license your work under the same or equivalent Creative Commons licence. If you create a translation of this work, you should add the following disclaimer along with the suggested citation: “This translation was not created by the World Health Organization (WHO) or the International Labour Organization (ILO). Neither WHO nor ILO are responsible for the content or accuracy of this translation. The original English edition shall be the binding and authentic edition”.
Any mediation relating to disputes arising under the licence shall be conducted in accordance with the mediation rules of the World Intellectual Property Organization (http://www.wipo.int/amc/en/mediation/rules).
Suggested citation. WHO/ILO joint estimates of the work-related burden of disease and injury, 2000-2016: global monitoring report: Geneva: World Health Organization and the International Labour Organization, 2021. Licence: CC BY-NC-SA 3.0 IGO.
Cataloguing-in-Publication (CIP) data. CIP data are available at http://apps.who.int/iris.
Sales, rights and licensing. To purchase WHO publications, see http://apps.who.int/bookorders. To submit requests for commercial use and queries on rights and licensing, see http://www.who.int/copyright. ILO publications and digital products can be obtained through major booksellers and digital distribution platforms, For more information, visit the website: www.ilo.org/publns.
Third-party materials. If you wish to reuse material from this work that is attributed to a third party, such as tables, figures or images, it is your responsibility to determine whether permission is needed for that reuse and to obtain permission from the copyright holder. The risk of claims resulting from infringement of any third-party-owned component in the work rests solely with the user.
General disclaimers. The designations employed and the presentation of the material in this publication do not imply the expression of any opinion whatsoever on the part of WHO or ILO concerning the legal status of any country, territory, city or area or of its authorities, or concerning the delimitation of its frontiers or boundaries. Dotted and dashed lines on maps represent approximate border lines for which there may not yet be full agreement.
The mention of specific companies or of certain manufacturers’ products does not imply that they are endorsed or recommended by WHO or ILO in preference to others of a similar nature that are not mentioned. Errors and omissions excepted, the names of proprietary products are distinguished by initial capital letters.
All reasonable precautions have been taken by WHO and ILO to verify the information contained in this publication. However, the published material is being distributed without warranty of any kind, either expressed or implied. The responsibility for the interpretation and use of the material lies with the reader. In no event shall WHO or ILO be liable for damages arising from its use.
FOREWORD FROM THE WHO DIRECTOR-GENERAL AND THE ILO DIRECTOR-GENERAL vACKNOWLEDGEMENTS viLIST OF ABBREVIATIONS viiEXECUTIVE SUMMARY viii
1. INTRODUCTION 1
2. OCCUPATIONAL RISK FACTOR AND HEALTH OUTCOME PAIRS 3 2.1. Established pairs 4 2.1.1. Selection 4 2.1.2. Data sources 4 2.2. Recently added pairs 4 2.2.1. Selection 4 2.2.2. Data sources 4
3. ESTIMATION METHODS 7 3.1. Established pairs 8 3.2. Recently added pairs 8 3.2.1. Exposure estimates 8 3.2.2. Burden of disease estimates 8 3.3. Inequalities 8 3.4. Uncertainty 9
4. RESULTS 10 4.1. Overview of estimates for all pairs 11 4.2. Estimates for established pairs 19 4.2.1. Occupational exposure to asbestos 20 4.2.2. Occupational exposure to arsenic 21 4.2.3. Occupational exposure to benzene 21 4.2.4. Occupational exposure to beryllium 22 4.2.5. Occupational exposure to cadmium 23 4.2.6. Occupational exposure to chromium 24
CONTENTS
4.2.7. Occupational exposure to diesel engine exhaust 254.2.8. Occupational exposure to formaldehyde 254.2.9. Occupational exposure to nickel 264.2.10. Occupational exposure to polycyclic aromatic hydrocarbons 274.2.11. Occupational exposure to silica 274.2.12. Occupational exposure to sulphuric acid 284.2.13. Occupational exposure to trichloroethylene 294.2.14. Occupational asthmagens 294.2.15. Occupational particulate matter, gases and fumes 304.2.16. Occupational noise 314.2.17. Occupational injuries 324.2.18. Occupational ergonomic factors 34
4.3. Estimates for recently added pairs 354.3.1. Exposure to long working hours: stroke 364.3.2. Exposure to long working hours: ischaemic heart disease 364.3.3. Preventive actions 37
4.4. Trends over time 384.5. Inequalities in work-related burden of disease 39
4.5.1. By geographic region 394.5.2. By sex 414.5.3. By age group 42
5. DISCUSSION 44
6. CONCLUSION 46
REFERENCES 48
ANNEXES 54
iv
FOREWORD FROM THE WHO DIRECTOR-GENERAL
AND THE ILO DIRECTOR-GENERAL
[signature]
Dr Tedros Adhanom Ghebreyesus Guy Ryder
Director-General Director-General
World Health Organization International Labour Organization
8 September 2021
Nobody should get sick or die from doing their job. And yet every year, 1.9 million people die from exposure to risk factors in the workplace. The 2030 Sustainable Development Goals (SDGs) aim “to ensure healthy lives and promote well-being” and “decent work” for all people, whatever their economic or social status.
Achieving these goals requires the comprehensive, accurate and transparent monitoring of workers’ health and safety. Quantifying the impact of each occupational risk factor is essential for mitigating it. That’s why the World Health Organization (WHO) and the International Labour Organization (ILO) have established the WHO/ILO Joint Estimates of the Work-related Burden of Disease and Injury (WHO/ILO Joint Estimates).
In 2016, we agreed to produce a single unified methodology and a single set of joint estimates on the work-related burden of disease and injury. In 2019, we further strengthened our partnership by signing a Collaboration Agreement to produce these estimates regularly.
This report is the first fruits of that collaboration. It details the impact on human health of each occupational risk factor, and offers concrete policies and actions to improve occupational and workers’ health and safety. These estimates provide a valuable basis for identifying, prioritizing, planning, costing, implementing and evaluating effective policies and actions to prevent the work-related burden of disease and injury, at country, regional and global levels, across sectors.
This report is a snapshot of a wider problem. The challenge for all of us now is to act on what it is showing us.
Dr Tedros Adhanom GhebreyesusDirector-GeneralWorld Health Organization
Guy RyderDirector-GeneralInternational Labour Organization
17 September 2021
v
ACKNOWLEDGEMENTS
This report presents the World Health Organization/International Labour Organization Joint Estimates of the Work-related Burden of Disease and Injury (WHO/ILO Joint Estimates).
The WHO/ILO Joint Estimates were produced by Frank Pega (WHO), Natalie Momen (WHO), Kai Streicher (WHO) and Bálint Náfrádi (ILO).
Frank Pega and Natalie Momen were the lead writers of this report; the drafting team also included Yuka Ujita (ILO), Bálint Náfrádi and Halim Hamzaoui (ILO). Rola Al-Elmam (WHO), Richard Brown (WHO), Ahmadreza Hosseinpoor (WHO), Ivan Ivanov (WHO), Kathleen Krupinski (WHO), Franklin Muchiri (ILO), Ann Olsson (International Agency for Research on Cancer), Lesley Onyon (WHO) and Annette Prüss-Üstün (WHO) also provided valuable technical inputs to this report.
Frank Pega coordinated the development and production of the WHO/ILO Joint Estimates and the report; the ILO focal point was Yuka Ujita and then Halim Hamzaoui. Maria Neira (WHO) and Vera Paquete-Perdigão (ILO) provided overall guidance.
The National Institute of Occupational Health and Poison Control, Chinese Center for Disease Control and Prevention shared survey data on exposure to long working hours for the People’s Republic of China. Eurostat produced and shared the transition probabilities for exposure to long working hours for 27 countries in the European Region.
Financial support for the preparation of this publication was provided by the United States Centers for Disease Control and Prevention National Institute for Occupational Safety and Health through its cooperative agreement with WHO (grant nos 1E11 OH0010676-02, 6NE11OH010461-02-01 and 5NE11OH010461-03-00); the German Federal Ministry of Health (BMG Germany) under the BMG–WHO Collaborative Programme 2020–2023 (WHO specified award reference 70672); and the Spanish Agency for International Cooperation (AECID) (WHO specified award reference 71208). The European Union also provided financial support to the ILO through the Vision Zero Fund (VZF) project on filling data and knowledge gaps on occupational safety and health in global supply chains, implemented within the framework of the ILO Flagship Programme “Safety + Health for All”.
The contents of this publication are solely the responsibility of WHO and the ILO, and they do not necessarily represent the official views of any of the WHO or ILO donors mentioned above.
vi WHO/ILO JOINT ESTIMATES OF THE WORK-RELATED BURDEN OF DISEASE AND INJURY, 2000-2016
LIST OF ABBREVIATIONS
DALY disability-adjusted life year
GATHER Guidelines for accurate and transparent health estimates reporting
IARC International Agency for Research on Cancer
ILO International Labour Organization
SDG Sustainable Development Goal
UN United Nations
UR uncertainty range
WHO World Health Organization
vii
EXECUTIVE SUMMARY
To achieve the United Nations 2030 Agenda of Sustainable Development Goals (SDGs), specifically SDG3 and SDG8, exposure to occupational risk factors and the attributable health loss must be reduced or even eliminated; this requires the monitoring of such exposures and health loss, at country, regional and global levels. For this purpose, the World Health Organization (WHO) and the International Labour Organization (ILO) have produced their first Joint Estimates of the Work-related Burden of Disease and Injury (WHO/ILO Joint Estimates). This Global Monitoring Report describes the objectives, data sources and methods of these new interagency estimates, and reports the WHO/ILO Joint Estimates generated in this estimation cycle.
The WHO/ILO Joint Estimates have been produced within the framework of the global Comparative Risk Assessment, in which exposure to a specific occupational risk factor is linked to the specific attributable burden of one specific health outcome (i.e. a defined disease or injury). For 39 established pairs of occupational risk factor and health outcome, the estimates are produced using population attributable fractions calculated from recent burden of disease estimates. For two additional pairs, population attributable fractions are calculated from new databases of exposure to occupational risk factors and risk ratios produced in WHO/ILO systematic reviews and meta-analyses. The estimation methods used apply population attributable fractions for specific occupational risk factors to total disease burden envelopes to provide estimates of the burden of disease attributable to the risk factors. In this estimation cycle, WHO and the ILO have produced estimates for the 41 selected pairs of occupational risk factor and health outcome. All estimates are available for the years 2000, 2010 and 2016, reported at country, regional and global levels, and are fully disaggregated by sex and age group.
Globally in 2016, a total of 1.88 (95% uncertainty range (UR): 1.84–1.92) million deaths and 89.72 (95% UR: 88.61–90.83) million disability-adjusted life years (DALYs) were estimated to be attributable to the 41 pairs of occupational risk factor and health outcome. Diseases accounted for 80.7% (1.52 million; 95% UR: 1.47–1.56 million) of the deaths and 70.5% (63.28 million; 95% UR: 62.17–64.39 million) of the DALYs, and injuries accounted for 19.3% (0.36 million; 95% UR: 0.36–0.37 million) of the deaths and 29.5% (26.44 million: 95% UR: 26.42–26.46 million) of the DALYs. All covered diseases are non-communicable diseases. The occupational risk factor with the largest number of attributable deaths was exposure to long working hours (≥ 55 hours per week) (744 924 deaths; 95% UR: 705 519–784 329), followed by occupational particulate matter, gases and fumes (450 381 deaths; 95% UR: 430 248–470 514) and occupational injuries (363 283 deaths; 95% UR: 358 251–368 315). The health outcome with the largest work-related burden of deaths was chronic obstructive pulmonary disease (450 381 deaths; 95% UR: 430 248–470 514), followed by stroke (398 306 deaths; 95% UR: 369 693–426 919) and ischaemic heart disease (346 618 deaths; 95% UR: 319 524–373 712). A disproportionately large work-related burden of disease is observed in the WHO African Region, South-East Asia Region and the Western Pacific Region, males and older age groups.
This first set of WHO/ILO Joint Estimates can be used for global monitoring of exposure to occupational risk factors and work-related burden of disease and injury, and to identify, plan, cost, implement and evaluate actions to effectively prevent exposure to occupational risk factors and their associated disease and injury burdens.
viii WHO/ILO JOINT ESTIMATES OF THE WORK-RELATED BURDEN OF DISEASE AND INJURY, 2000-2016

1. INTRODUCTIONGLOBAL MONITORING REPORT
1
The World Health Organization (WHO) and the International Labour Organization (ILO) have a long history of productive interagency collaboration. When WHO was founded in 1948, its Basic documents included an agreement to collaborate, including by exchanging data and evidence, with the ILO (1). However, until very recently WHO and the ILO have produced separate estimates on work-related burden of disease, with the use of different methodologies yielding different results. In this report, as in the broader burden of disease framework, the term “burden of disease” refers to the combined burdens of three types of health outcomes, namely communicable diseases, non-communicable disease and injuries (2, 3). Member States have asked that the two United Nations (UN) Specialized Agencies harmonize their estimates, and UN reform has compelled UN organizations to build synergies as One UN. The Sustainable Development Goals (SDGs) and the 2030 Agenda (4) call for partnerships for development and improved policy coherence. To contribute towards achievement of the SDGs, WHO and the ILO agreed in 2016 to develop a joint estimation methodology and produce the WHO/ILO Joint Estimates of the Work-related Burden of Disease and Injury (WHO/ILO Joint Estimates): the most comprehensive set of official estimates of work-related burden of disease produced to date.
WHO and the ILO were able to use their existing and already-shared methodologies for many established pairs of occupational risk factor and health outcome. However, several other pairs of occupational risk factor and health outcome were considered either in need of a new evidence review or else likely to contribute appreciably to the burden of disease but had not been included in either WHO or ILO estimates; sixteen of these pairs of occupational risk factor and health outcome were prioritized in this cycle of the WHO/ILO Joint Estimates. For these additional pairs of interest, WHO and the ILO established protocols for, and conducted a series of, systematic reviews and meta-analyses of the evidence base (5–22). These evidence syntheses were carried out with the support of experts from government departments in 11 countries (often ministries of health and labour) and over 220 individual experts from 35 countries, covering all six WHO regions (Africa, Americas, South-East Asia, Europe, Eastern Mediterranean and Western Pacific) and all five ILO regions (Africa, Americas, Arab States, Asia and the Pacific, and Europe and Central Asia).
All WHO/ILO Joint Estimates are produced according to the strict statistical rules and established regulations of WHO and the ILO. The data sources and methods used in obtaining these estimates are reported according to the Guidelines for accurate and transparent health estimates reporting (GATHER) (23).
In this report we aim to present the WHO/ILO Joint Estimates in a user-friendly format to inform decision-makers, policymakers and practitioners within and beyond occupational and workers’ health and safety, at the workplace, enterprise, national, regional and global levels. We first provide a brief summary of the pairs of occupational risk factor and health outcome considered – 39 established pairs, and the two recently added pairs of exposure to long working hours and the health outcomes of ischaemic heart disease and stroke – and the data sources for these pairs in Section 2. We then briefly describe the methods used to produce the WHO/ILO Joint Estimates in Section 3; a detailed Technical Report can be found elsewhere (24). We report the WHO/ILO Joint Estimates for 41 pairs of occupational risk factor and health outcome in Section 4. Our discussion in Section 5 considers the strengths and limitations of the WHO/ILO Joint Estimates.
2 WHO/ILO JOINT ESTIMATES OF THE WORK-RELATED BURDEN OF DISEASE AND INJURY, 2000-2016
2. OCCUPATIONAL RISK FACTOR AND HEALTH OUTCOME PAIRS
GLOBAL MONITORING REPORT
3
The WHO/ILO Joint Estimates have been produced for 41 pairs of occupational risk factor and health outcome: 39 previously established and two recently added.
2.1. Established pairs
2.1.1. SelectionThirty-nine established pairs of occupational risk factor and health outcome (Table 1) were selected for inclusion in the WHO/ILO Joint Estimates, for which WHO and the ILO had previously already used the same data sources and estimation methods (2, 3). All these pairs have been included in the global Comparative Risk Assessment for some time (2, 3). The Comparative Risk Assessment is a systematic evaluation of the changes in population health that result from modifying the population distribution of exposure to a risk factor or a group of risk factors (Ezzati et al. (2, 3)).
While there are established methods for estimating the burdens of silicosis, asbestosis, coal worker’s pneumoconiosis and unspecified pneumoconiosis attributable to occupational exposure to dusts and fibres, WHO and the ILO are currently reviewing these methods and the available bodies of evidence (9); these pairs were therefore not included in this estimation cycle or this Global Monitoring Report.
2.1.2. Data sourcesFor the 39 established pairs of occupational risk factor and health outcome (Table 1), the burden of disease attributable to occupational risk factors was estimated using the Comparative Risk Assessment framework (2, 3). We sourced recent burden of disease estimates available from the Global Burden of Disease Study (25), now through the Institute of Health Metrics and Evaluation (29), from which we derived population attributable fractions (Annex 1). Population attributable fractions quantify the proportion of deaths or disability-adjusted life years (DALYs) lost from a particular health outcome that is attributable to a specific risk factor, that is, the reduction in numbers of deaths or DALYs from this disease or injury that would be expected to occur if exposure to that risk factor was removed or present at a reduced level.
2.2. Recently added pairs
2.2.1. Selection Through the application of pre-specified criteria, potential additional pairs of occupational risk factor and health outcome were prioritized. Based on scoping reviews of the literature, WHO and the ILO (supported by individual experts) selected an additional 16 pairs of occupational risk factor and health outcome that may contribute substantially to the work-related burden of disease for systematic review and meta-analysis. Of these, two pairs proceeded to burden of disease estimation in this cycle and are presented in this report: exposure to long working hours (defined as working for ≥ 55 hours per week) and the health outcomes of ischaemic heart disease and stroke. A detailed Technical Report can be found elsewhere (24).
2.2.2. Data sources (a) Systematic reviews and meta-analysesFor the WHO/ILO Joint Estimates, 15 systematic reviews and meta-analyses were conducted to gather evidence on the additional pairs of occupational risk factor and health outcome (for list see table 1 in Pega et al. (30)). Evidence was reviewed and synthesized on both the prevalence of exposure
4 WHO/ILO JOINT ESTIMATES OF THE WORK-RELATED BURDEN OF DISEASE AND INJURY, 2000-2016
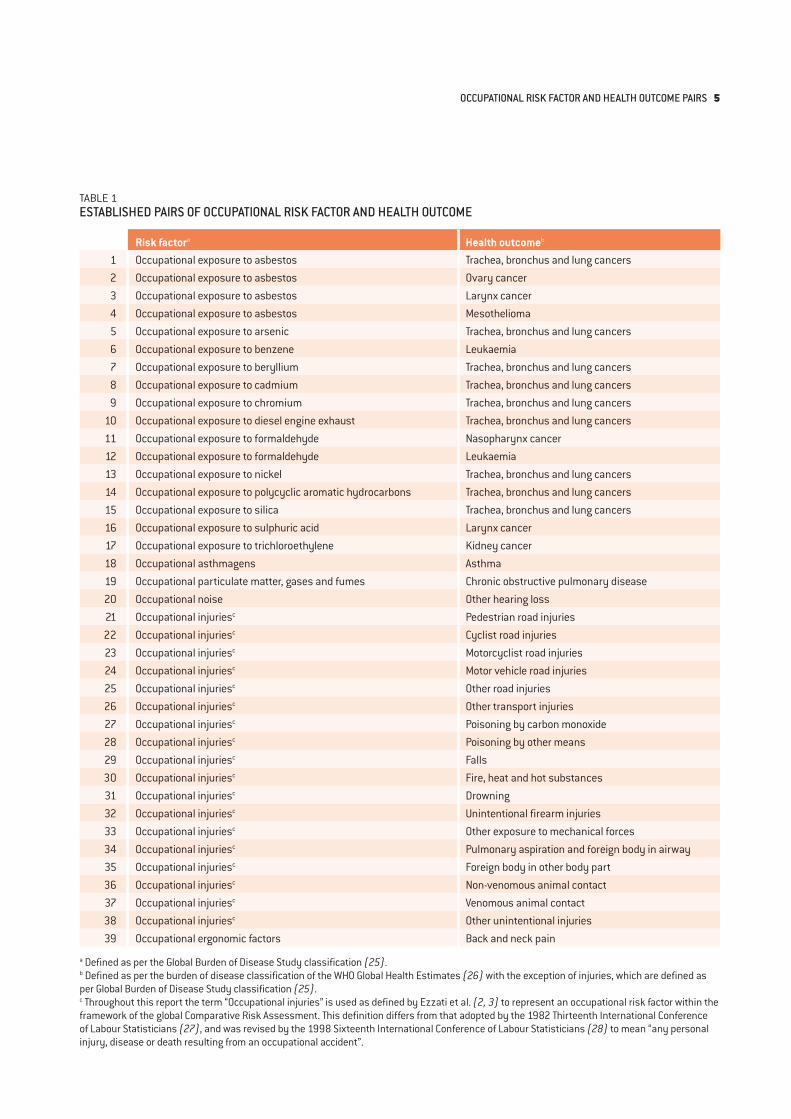
TABLE 1ESTABLISHED PAIRS OF OCCUPATIONAL RISK FACTOR AND HEALTH OUTCOME
Risk factora Health outcomeb 1 Occupational exposure to asbestos Trachea, bronchus and lung cancers2 Occupational exposure to asbestos Ovary cancer3 Occupational exposure to asbestos Larynx cancer4 Occupational exposure to asbestos Mesothelioma5 Occupational exposure to arsenic Trachea, bronchus and lung cancers6 Occupational exposure to benzene Leukaemia7 Occupational exposure to beryllium Trachea, bronchus and lung cancers8 Occupational exposure to cadmium Trachea, bronchus and lung cancers9 Occupational exposure to chromium Trachea, bronchus and lung cancers
10 Occupational exposure to diesel engine exhaust Trachea, bronchus and lung cancers11 Occupational exposure to formaldehyde Nasopharynx cancer12 Occupational exposure to formaldehyde Leukaemia13 Occupational exposure to nickel Trachea, bronchus and lung cancers14 Occupational exposure to polycyclic aromatic hydrocarbons Trachea, bronchus and lung cancers15 Occupational exposure to silica Trachea, bronchus and lung cancers16 Occupational exposure to sulphuric acid Larynx cancer17 Occupational exposure to trichloroethylene Kidney cancer18 Occupational asthmagens Asthma19 Occupational particulate matter, gases and fumes Chronic obstructive pulmonary disease20 Occupational noise Other hearing loss21 Occupational injuriesc Pedestrian road injuries22 Occupational injuriesc Cyclist road injuries23 Occupational injuriesc Motorcyclist road injuries24 Occupational injuriesc Motor vehicle road injuries25 Occupational injuriesc Other road injuries26 Occupational injuriesc Other transport injuries27 Occupational injuriesc Poisoning by carbon monoxide28 Occupational injuriesc Poisoning by other means29 Occupational injuriesc Falls30 Occupational injuriesc Fire, heat and hot substances31 Occupational injuriesc Drowning32 Occupational injuriesc Unintentional firearm injuries33 Occupational injuriesc Other exposure to mechanical forces34 Occupational injuriesc Pulmonary aspiration and foreign body in airway35 Occupational injuriesc Foreign body in other body part36 Occupational injuriesc Non-venomous animal contact37 Occupational injuriesc Venomous animal contact38 Occupational injuriesc Other unintentional injuries39 Occupational ergonomic factors Back and neck pain
a Defined as per the Global Burden of Disease Study classification (25).b Defined as per the burden of disease classification of the WHO Global Health Estimates (26) with the exception of injuries, which are defined as per Global Burden of Disease Study classification (25).c Throughout this report the term “Occupational injuries” is used as defined by Ezzati et al. (2, 3) to represent an occupational risk factor within the framework of the global Comparative Risk Assessment. This definition differs from that adopted by the 1982 Thirteenth International Conference of Labour Statisticians (27), and was revised by the 1998 Sixteenth International Conference of Labour Statisticians (28) to mean “any personal injury, disease or death resulting from an occupational accident”.
OCCUPATIONAL RISK FACTOR AND HEALTH OUTCOME PAIRS 5
to occupational risk factors (five systematic reviews), and on the effect of exposure to these risk factors on health outcomes (10 systematic reviews). A series of peer-reviewed articles describing the protocols for and results from the systematic reviews and meta-analyses (5–22), and new methods for conducting these (31), have been published in an international academic journal (30). WHO and the ILO determined the pairs for which the evidence base was of sufficient quality and strength to proceed to burden of disease estimates.
(b) WHO/ILO databasesFor some of the recently added pairs of occupational risk factor and health outcome, new WHO/ILO databases were developed from data shared by countries, areas and territories with one or more of WHO, the ILO and Eurostat. These interagency databases were established specifically for the purpose of producing the WHO/ILO Joint Estimates. For the occupational risk factor of exposure to long working hours, the WHO/ILO databases used results from 2324 surveys (mostly Labour Force Surveys) from 154 countries, areas and territories, as well as 1742 quarterly datasets of Labour Force Surveys conducted in 46 countries. A detailed description of all databases used for estimation is provided elsewhere (32).
6 WHO/ILO JOINT ESTIMATES OF THE WORK-RELATED BURDEN OF DISEASE AND INJURY, 2000-2016
3. ESTIMATION METHODSGLOBAL MONITORING REPORT
7
3.1. Established pairs
We applied the population attributable fractions calculated from recent burden of disease estimates (25) to the WHO Global Health Estimates, which provide the total disease envelopes for the years 2000, 2010 and 2016 (26), to obtain estimates of the numbers of deaths and DALYs for each health outcome attributable to its respective occupational risk factor.
3.2. Recently added pairs
3.2.1. Exposure estimatesWe used an established multilevel model to predict the geographical and temporal prevalence of exposure to long working hours (33), as applied by WHO in its estimates for environmental risk factor exposures (34, 35). The multilevel model has also been used by WHO in the production of SDG indicators 3.9.1 (mortality rate attributed to household and ambient air pollution) and 3.9.2 (mortality rate attributed to unsafe water, unsafe sanitation and lack of hygiene), as endorsed by the UN Statistical Commission. Prevalence of exposure to long working hours was modelled based on data from direct exposure measurements. An exposure window was agreed upon based on advice from a WHO/ILO Technical Advisory Group, and the annual prevalence of exposure to long working hours for each year within the exposure window was used in exposure modelling. The methods used to estimate exposure to long working hours are described in detail elsewhere (32).
3.2.2. Burden of disease estimatesAs for the established risk factors, the burden of disease attributable to exposure to long working hours was also estimated within the Comparative Risk Assessment framework (2, 3). For the two recently added pairs of long working hours and the health outcomes of ischaemic heart disease and stroke, population attributable fractions were calculated using (i) the prevalence estimates produced by WHO and the ILO, and (ii) the pooled risk ratios obtained from the systematic reviews and meta-analyses conducted by WHO and the ILO (with the support of working groups of individual experts). These population attributable fractions were then applied to the total disease burden envelopes for the health outcome from the WHO Global Health Estimates for the years 2000, 2010 and 2016 (26), yielding the number of deaths and DALYs from each health outcome attributable to exposure to long working hours (Pega et al. (32)).
3.3. Inequalities
For describing inequalities in the work-related burden of disease between regions, sexes and age groups, we used the number of deaths or DALYs per 100 000 population (i.e. death or DALY rate) for all regions, both sexes and for people of working age (≥ 15 years) as the reference. For specific regions, sexes or age groups, we calculated (i) the rate difference: the rate for a particular group minus the reference rate (as an absolute inequality measure); and (ii) the rate ratio: the rate for a particular group divided by the reference rate (as a relative inequality measure) (36).
8 WHO/ILO JOINT ESTIMATES OF THE WORK-RELATED BURDEN OF DISEASE AND INJURY, 2000-2016
3.4. Uncertainty
The WHO/ILO Joint Estimates, as for any estimates of this kind, are subject to uncertainty. All estimates of exposure to occupational risk factors and of burden of disease were produced with their 95% uncertainty ranges (URs) at the 2.5% and 97.5% quantiles. For this purpose, uncertainty was propagated across estimation models (Pega et al. (32)). This report presents the 95% uncertainty ranges for key estimates in the main text; however, 95% uncertainty ranges are available for all estimates in the online estimates repository (available at https://www.who.int/teams/environment-climate-change-and-health/monitoring/who-ilo-joint-estimates).
ESTIMATION METHODS 9
4. RESULTSGLOBAL MONITORING REPORT
10
4.1. Overview of estimates for all pairs
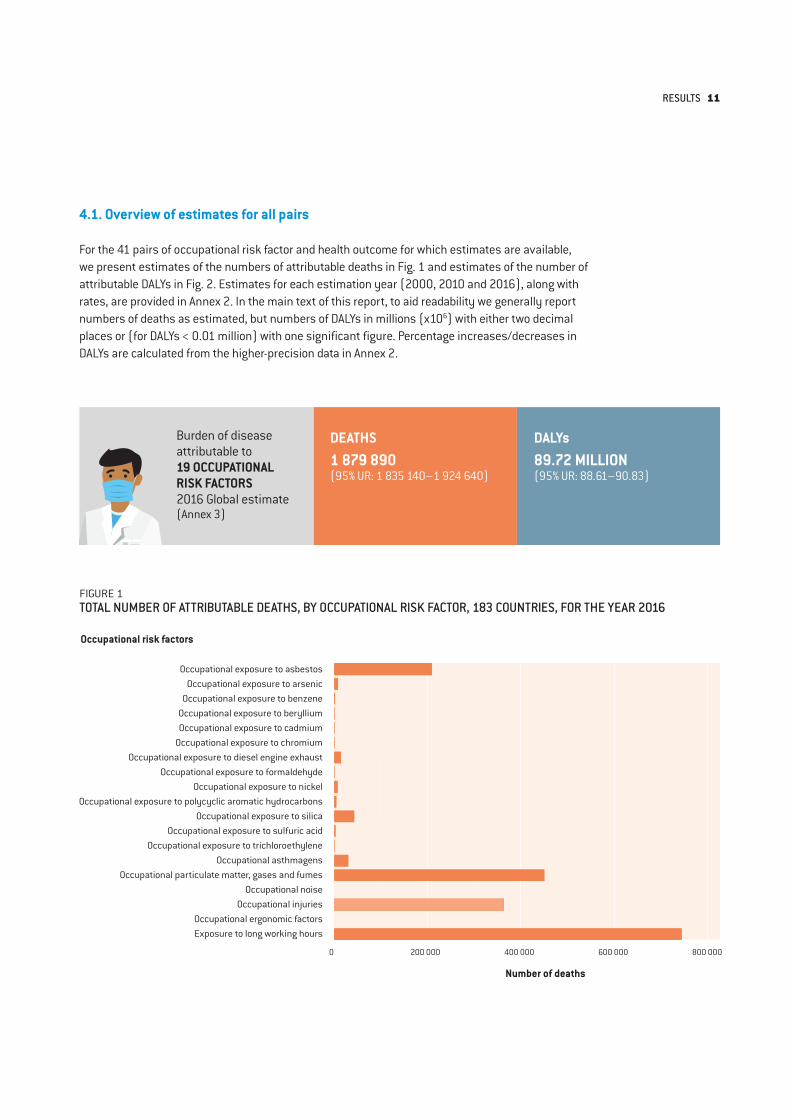
For the 41 pairs of occupational risk factor and health outcome for which estimates are available, we present estimates of the numbers of attributable deaths in Fig. 1 and estimates of the number of attributable DALYs in Fig. 2. Estimates for each estimation year (2000, 2010 and 2016), along with rates, are provided in Annex 2. In the main text of this report, to aid readability we generally report numbers of deaths as estimated, but numbers of DALYs in millions (x106) with either two decimal places or (for DALYs < 0.01 million) with one significant figure. Percentage increases/decreases in DALYs are calculated from the higher-precision data in Annex 2.
FIGURE 1TOTAL NUMBER OF ATTRIBUTABLE DEATHS, BY OCCUPATIONAL RISK FACTOR, 183 COUNTRIES, FOR THE YEAR 2016
Occupational risk factors
Number of deaths
Occupational exposure to asbestosOccupational exposure to arsenic
Occupational exposure to benzeneOccupational exposure to berylliumOccupational exposure to cadmium
Occupational exposure to chromiumOccupational exposure to diesel engine exhaust
Occupational exposure to formaldehydeOccupational exposure to nickel
Occupational exposure to polycyclic aromatic hydrocarbonsOccupational exposure to silica
Occupational exposure to sulfuric acidOccupational exposure to trichloroethylene
Occupational asthmagensOccupational particulate matter, gases and fumes
Occupational noiseOccupational injuries
Occupational ergonomic factorsExposure to long working hours
0 200 000 400 000 600 000 800 000
Burden of disease attributable to19 OCCUPATIONAL RISK FACTORS2016 Global estimate(Annex 3)
DEATHS 1 879 890(95% UR: 1 835 140–1 924 640)
DALYs 89.72 MILLION(95% UR: 88.61–90.83)
RESULTS 11
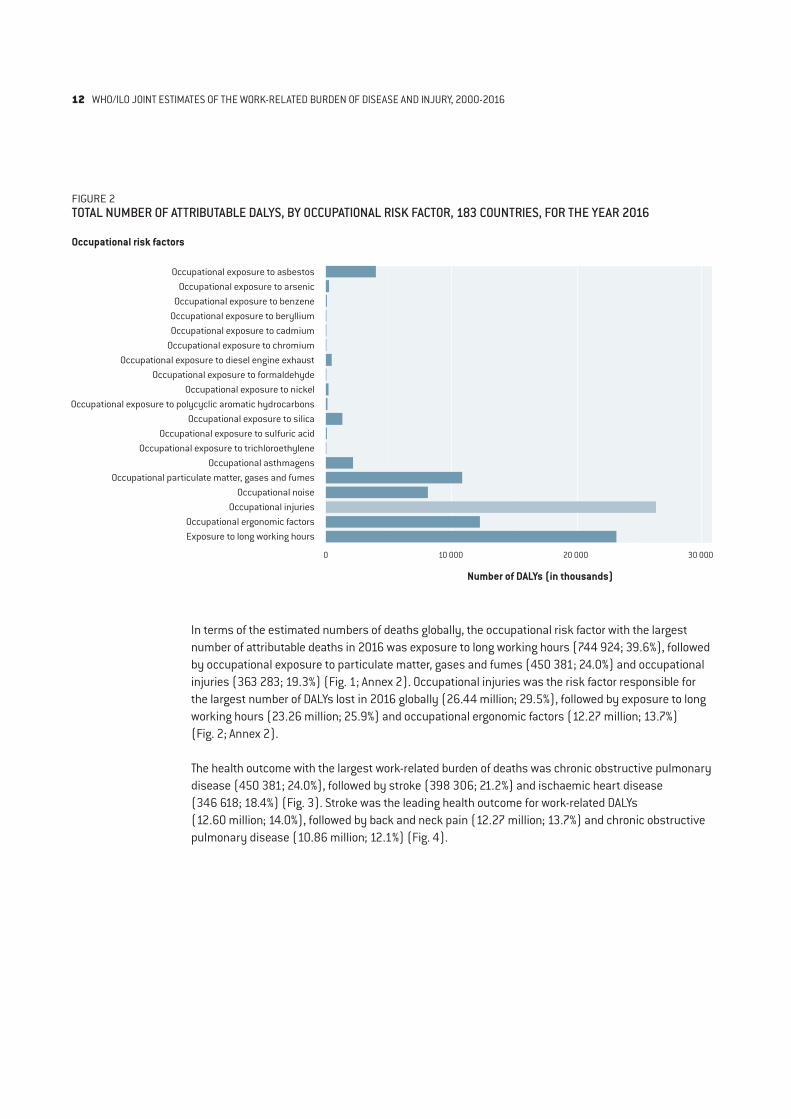
FIGURE 2TOTAL NUMBER OF ATTRIBUTABLE DALYS, BY OCCUPATIONAL RISK FACTOR, 183 COUNTRIES, FOR THE YEAR 2016
Occupational risk factors
Number of DALYs (in thousands)
Occupational exposure to asbestosOccupational exposure to arsenic
Occupational exposure to benzeneOccupational exposure to berylliumOccupational exposure to cadmium
Occupational exposure to chromiumOccupational exposure to diesel engine exhaust
Occupational exposure to formaldehydeOccupational exposure to nickel
Occupational exposure to polycyclic aromatic hydrocarbonsOccupational exposure to silica
Occupational exposure to sulfuric acidOccupational exposure to trichloroethylene
Occupational asthmagensOccupational particulate matter, gases and fumes
Occupational noiseOccupational injuries
Occupational ergonomic factorsExposure to long working hours
0 10 000 20 000 30 000
In terms of the estimated numbers of deaths globally, the occupational risk factor with the largest number of attributable deaths in 2016 was exposure to long working hours (744 924; 39.6%), followed by occupational exposure to particulate matter, gases and fumes (450 381; 24.0%) and occupational injuries (363 283; 19.3%) (Fig. 1; Annex 2). Occupational injuries was the risk factor responsible for the largest number of DALYs lost in 2016 globally (26.44 million; 29.5%), followed by exposure to long working hours (23.26 million; 25.9%) and occupational ergonomic factors (12.27 million; 13.7%) (Fig. 2; Annex 2).
The health outcome with the largest work-related burden of deaths was chronic obstructive pulmonary disease (450 381; 24.0%), followed by stroke (398 306; 21.2%) and ischaemic heart disease (346 618; 18.4%) (Fig. 3). Stroke was the leading health outcome for work-related DALYs (12.60 million; 14.0%), followed by back and neck pain (12.27 million; 13.7%) and chronic obstructive pulmonary disease (10.86 million; 12.1%) (Fig. 4).
12 WHO/ILO JOINT ESTIMATES OF THE WORK-RELATED BURDEN OF DISEASE AND INJURY, 2000-2016
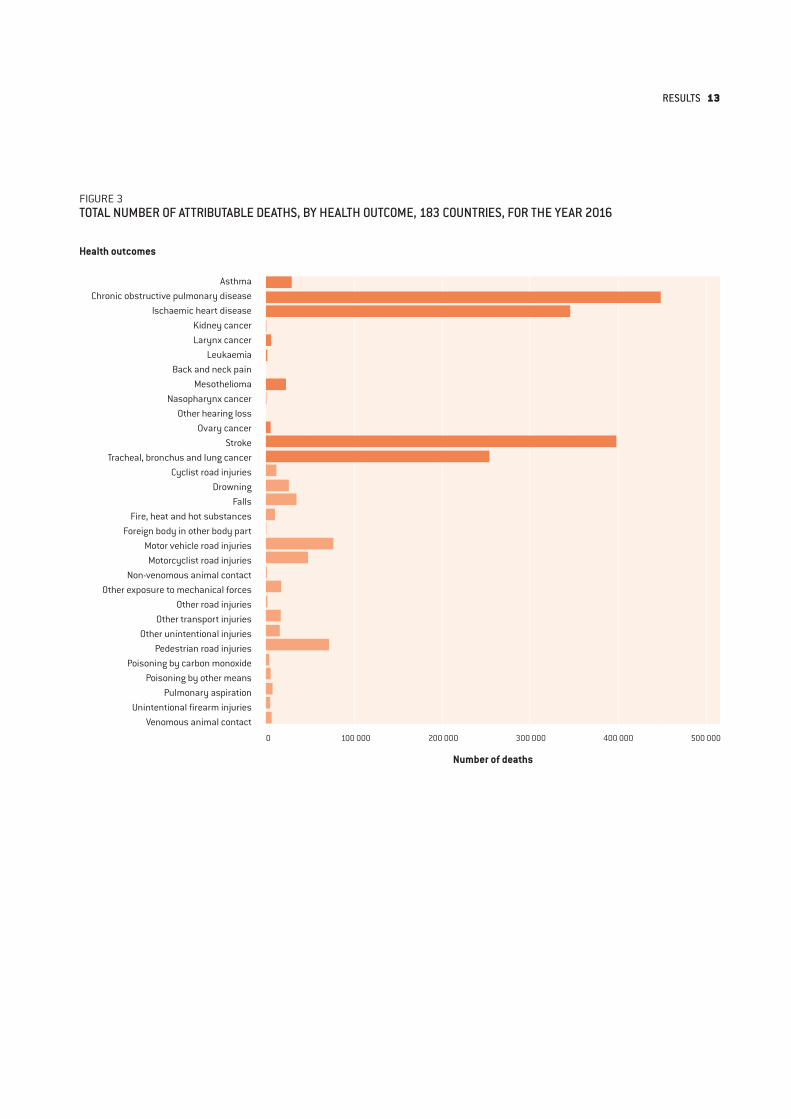
FIGURE 3TOTAL NUMBER OF ATTRIBUTABLE DEATHS, BY HEALTH OUTCOME, 183 COUNTRIES, FOR THE YEAR 2016
Health outcomes
Number of deaths
AsthmaChronic obstructive pulmonary disease
Ischaemic heart diseaseKidney cancerLarynx cancer
LeukaemiaBack and neck pain
MesotheliomaNasopharynx cancer
Other hearing lossOvary cancer
StrokeTracheal, bronchus and lung cancer
Cyclist road injuriesDrowning
FallsFire, heat and hot substances
Foreign body in other body partMotor vehicle road injuriesMotorcyclist road injuries
Non-venomous animal contactOther exposure to mechanical forces
Other road injuriesOther transport injuries
Other unintentional injuriesPedestrian road injuries
Poisoning by carbon monoxidePoisoning by other means
Pulmonary aspirationUnintentional firearm injuries
Venomous animal contact
0 100 000 200 000 300 000 400 000 500 000
RESULTS 13
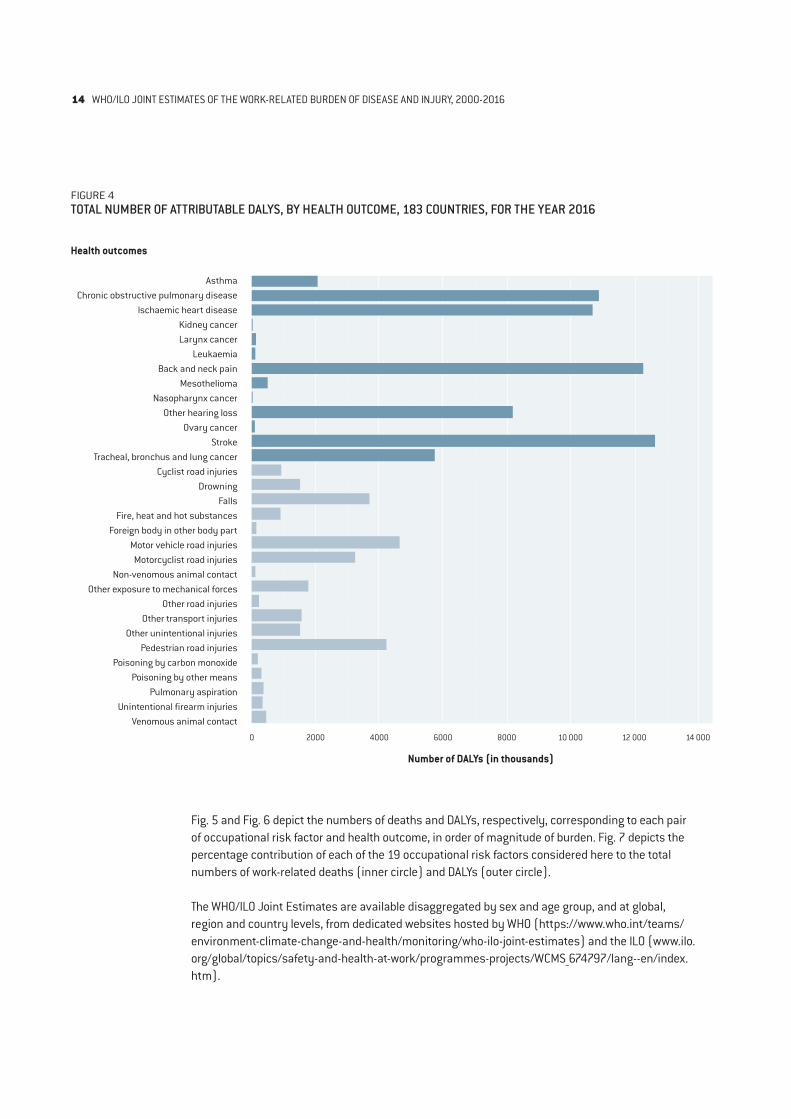
FIGURE 4TOTAL NUMBER OF ATTRIBUTABLE DALYS, BY HEALTH OUTCOME, 183 COUNTRIES, FOR THE YEAR 2016
Health outcomes
Number of DALYs (in thousands)
AsthmaChronic obstructive pulmonary disease
Ischaemic heart diseaseKidney cancerLarynx cancer
LeukaemiaBack and neck pain
MesotheliomaNasopharynx cancer
Other hearing lossOvary cancer
StrokeTracheal, bronchus and lung cancer
Cyclist road injuriesDrowning
FallsFire, heat and hot substances
Foreign body in other body partMotor vehicle road injuriesMotorcyclist road injuries
Non-venomous animal contactOther exposure to mechanical forces
Other road injuriesOther transport injuries
Other unintentional injuriesPedestrian road injuries
Poisoning by carbon monoxidePoisoning by other means
Pulmonary aspirationUnintentional firearm injuries
Venomous animal contact
0 2000 4000 6000 8000 10 000 12 000 14 000
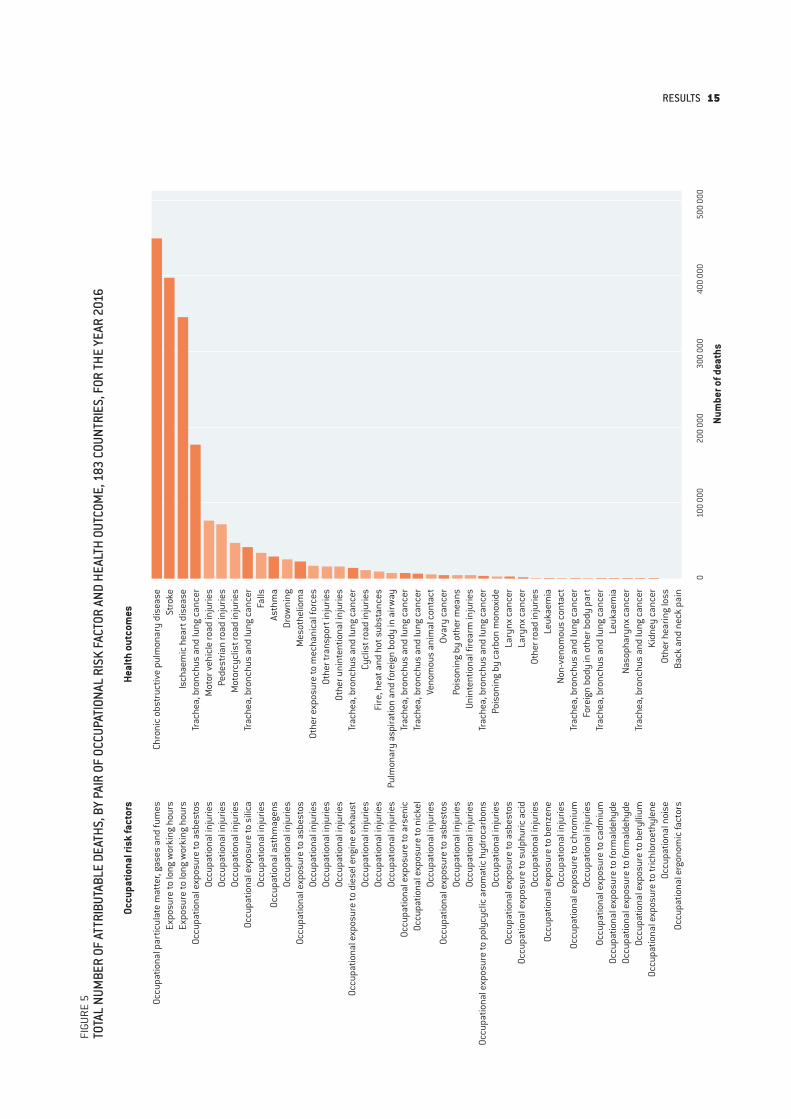
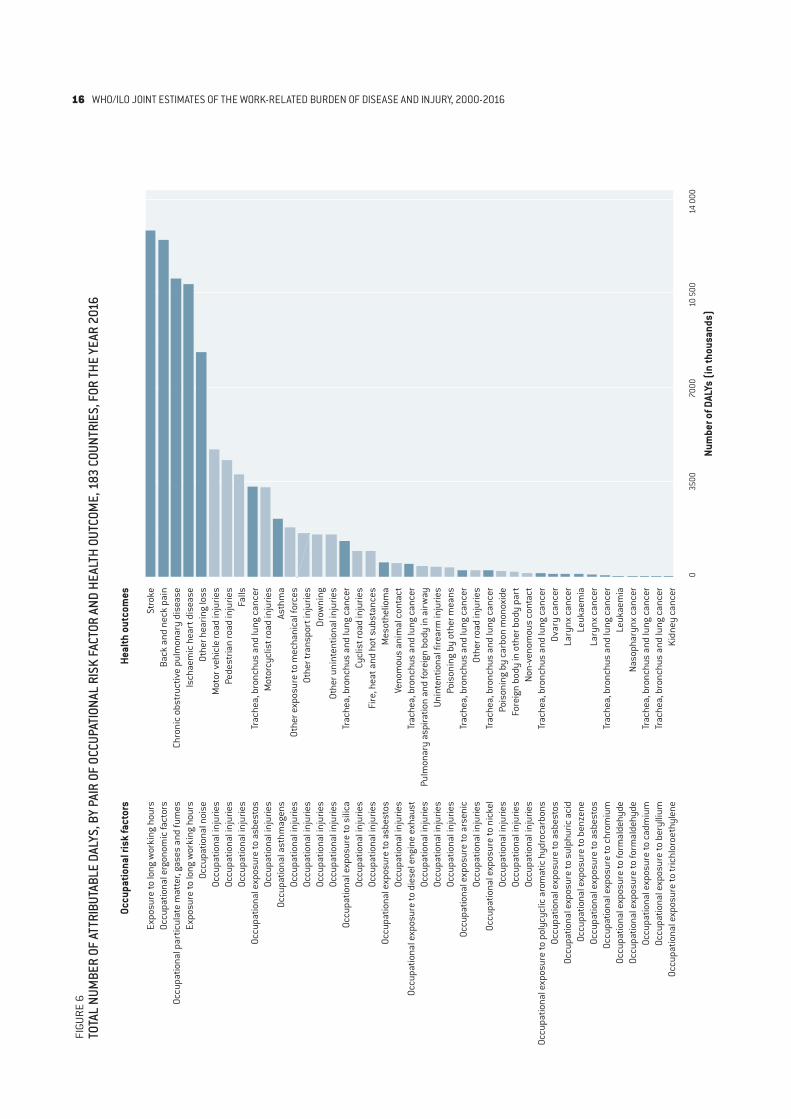
Fig. 5 and Fig. 6 depict the numbers of deaths and DALYs, respectively, corresponding to each pair of occupational risk factor and health outcome, in order of magnitude of burden. Fig. 7 depicts the percentage contribution of each of the 19 occupational risk factors considered here to the total numbers of work-related deaths (inner circle) and DALYs (outer circle).
The WHO/ILO Joint Estimates are available disaggregated by sex and age group, and at global, region and country levels, from dedicated websites hosted by WHO (https://www.who.int/teams/environment-climate-change-and-health/monitoring/who-ilo-joint-estimates) and the ILO (www.ilo.org/global/topics/safety-and-health-at-work/programmes-projects/WCMS_674797/lang--en/index.htm).
14 WHO/ILO JOINT ESTIMATES OF THE WORK-RELATED BURDEN OF DISEASE AND INJURY, 2000-2016
FIGU
RE 5
TOTA
L NU
MBE
R OF
ATT
RIBU
TABL
E DE
ATHS
, BY
PAIR
OF
OCCU
PATI
ONAL
RIS
K FA
CTOR
AND
HEA
LTH
OUTC
OME,
183
COU
NTRI
ES, F
OR TH
E YE
AR 2
016
Occu
patio
nal r
isk
fact
ors
Heal
th o
utco
mes
Num
ber o
f dea
ths
Occu
patio
nal p
artic
ulat
e m
atte
r, ga
ses
and
fum
esEx
posu
re to
long
wor
king
hou
rsEx
posu
re to
long
wor
king
hou
rsOc
cupa
tiona
l exp
osur
e to
asb
esto
sOc
cupa
tiona
l inj
urie
sOc
cupa
tiona
l inj
urie
sOc
cupa
tiona
l inj
urie
sOc
cupa
tiona
l exp
osur
e to
sili
caOc
cupa
tiona
l inj
urie
sOc
cupa
tiona
l ast
hmag
ens
Occu
patio
nal i
njur
ies
Occu
patio
nal e
xpos
ure
to a
sbes
tos
Occu
patio
nal i
njur
ies
Occu
patio
nal i
njur
ies
Occu
patio
nal i
njur
ies
Occu
patio
nal e
xpos
ure
to d
iese
l eng
ine
exha
ust
Occu
patio
nal i
njur
ies
Occu
patio
nal i
njur
ies
Occu
patio
nal i
njur
ies
Occu
patio
nal e
xpos
ure
to a
rsen
ic
Occu
patio
nal e
xpos
ure
to n
icke
lOc
cupa
tiona
l inj
urie
sOc
cupa
tiona
l exp
osur
e to
asb
esto
sOc
cupa
tiona
l inj
urie
sOc
cupa
tiona
l inj
urie
sOc
cupa
tiona
l exp
osur
e to
pol
ycyc
lic a
rom
atic
hyd
roca
rbon
sOc
cupa
tiona
l inj
urie
sOc
cupa
tiona
l exp
osur
e to
asb
esto
sOc
cupa
tiona
l exp
osur
e to
sul
phur
ic a
cid
Occu
patio
nal i
njur
ies
Occu
patio
nal e
xpos
ure
to b
enze
neOc
cupa
tiona
l inj
urie
sOc
cupa
tiona
l exp
osur
e to
chr
omiu
mOc
cupa
tiona
l inj
urie
sOc
cupa
tiona
l exp
osur
e to
cad
miu
mOc
cupa
tiona
l exp
osur
e to
form
alde
hyde
Occu
patio
nal e
xpos
ure
to fo
rmal
dehy
deOc
cupa
tiona
l exp
osur
e to
ber
ylliu
m
Occu
patio
nal e
xpos
ure
to tr
ichl
oroe
thyl
ene
Occu
patio
nal n
oise
Occu
patio
nal e
rgon
omic
fact
ors
Chro
nic
obst
ruct
ive
pulm
onar
y di
seas
eSt
roke
Isch
aem
ic h
eart
dis
ease
Trac
hea,
bro
nchu
s an
d lu
ng c
ance
rM
otor
veh
icle
road
inju
ries
Pede
stria
n ro
ad in
jurie
sM
otor
cycl
ist r
oad
inju
ries
Trac
hea,
bro
nchu
s an
d lu
ng c
ance
rFa
llsAs
thm
aDr
owni
ngM
esot
helio
ma
Othe
r exp
osur
e to
mec
hani
cal f
orce
sOt
her t
rans
port
inju
ries
Othe
r uni
nten
tiona
l inj
urie
sTr
ache
a, b
ronc
hus
and
lung
can
cer
Cycl
ist r
oad
inju
ries
Fire
, hea
t and
hot
sub
stan
ces
Pulm
onar
y as
pira
tion
and
fore
ign
body
in a
irway
Trac
hea,
bro
nchu
s an
d lu
ng c
ance
rTr
ache
a, b
ronc
hus
and
lung
can
cer
Veno
mou
s an
imal
con
tact
Ovar
y ca
ncer
Pois
onin
g by
oth
er m
eans
Unin
tent
iona
l fire
arm
inju
ries
Trac
hea,
bro
nchu
s an
d lu
ng c
ance
rPo
ison
ing
by c
arbo
n m
onox
ide
Lary
nx c
ance
rLa
rynx
can
cer
Othe
r roa
d in
jurie
sLe
ukae
mia
Non-
veno
mou
s co
ntac
tTr
ache
a, b
ronc
hus
and
lung
can
cer
Fore
ign
body
in o
ther
bod
y pa
rtTr
ache
a, b
ronc
hus
and
lung
can
cer
Leuk
aem
iaNa
soph
aryn
x ca
ncer
Trac
hea,
bro
nchu
s an
d lu
ng c
ance
rKi
dney
can
cer
Othe
r hea
ring
loss
Back
and
nec
k pa
in
010
0 00
020
0 00
030
0 00
040
0 00
050
0 00
0
RESULTS 15
FIGU
RE 6
TOTA
L NU
MBE
R OF
ATT
RIBU
TABL
E DA
LYS,
BY
PAIR
OF
OCCU
PATI
ONAL
RIS
K FA
CTOR
AND
HEA
LTH
OUTC
OME,
183
COU
NTRI
ES, F
OR TH
E YE
AR 2
016
Num
ber o
f DAL
Ys (i
n th
ousa
nds)
Expo
sure
to lo
ng w
orki
ng h
ours
Occu
patio
nal e
rgon
omic
fact
ors
Occu
patio
nal p
artic
ulat
e m
atte
r, ga
ses
and
fum
esEx
posu
re to
long
wor
king
hou
rsOc
cupa
tiona
l noi
seOc
cupa
tiona
l inj
urie
sOc
cupa
tiona
l inj
urie
sOc
cupa
tiona
l inj
urie
sOc
cupa
tiona
l exp
osur
e to
asb
esto
sOc
cupa
tiona
l inj
urie
sOc
cupa
tiona
l ast
hmag
ens
Occu
patio
nal i
njur
ies
Occu
patio
nal i
njur
ies
Occu
patio
nal i
njur
ies
Occu
patio
nal i
njur
ies
Occu
patio
nal e
xpos
ure
to s
ilica
Occu
patio
nal i
njur
ies
Occu
patio
nal i
njur
ies
Occu
patio
nal e
xpos
ure
to a
sbes
tos
Occu
patio
nal i
njur
ies
Occu
patio
nal e
xpos
ure
to d
iese
l eng
ine
exha
ust
Occu
patio
nal i
njur
ies
Occu
patio
nal i
njur
ies
Occu
patio
nal i
njur
ies
Occu
patio
nal e
xpos
ure
to a
rsen
ic
Occu
patio
nal i
njur
ies
Occu
patio
nal e
xpos
ure
to n
icke
lOc
cupa
tiona
l inj
urie
sOc
cupa
tiona
l inj
urie
sOc
cupa
tiona
l inj
urie
sOc
cupa
tiona
l exp
osur
e to
pol
ycyc
lic a
rom
atic
hyd
roca
rbon
sOc
cupa
tiona
l exp
osur
e to
asb
esto
sOc
cupa
tiona
l exp
osur
e to
sul
phur
ic a
cid
Occu
patio
nal e
xpos
ure
to b
enze
neOc
cupa
tiona
l exp
osur
e to
asb
esto
sOc
cupa
tiona
l exp
osur
e to
chr
omiu
mOc
cupa
tiona
l exp
osur
e to
form
alde
hyde
Occu
patio
nal e
xpos
ure
to fo
rmal
dehy
deOc
cupa
tiona
l exp
osur
e to
cad
miu
mOc
cupa
tiona
l exp
osur
e to
ber
ylliu
m
Occu
patio
nal e
xpos
ure
to tr
ichl
oroe
thyl
ene
Stro
keBa
ck a
nd n
eck
pain
Chro
nic
obst
ruct
ive
pulm
onar
y di
seas
eIs
chae
mic
hea
rt d
isea
seOt
her h
earin
g lo
ssM
otor
veh
icle
road
inju
ries
Pede
stria
n ro
ad in
jurie
sFa
llsTr
ache
a, b
ronc
hus
and
lung
can
cer
Mot
orcy
clis
t roa
d in
jurie
sAs
thm
aOt
her e
xpos
ure
to m
echa
nica
l for
ces
Othe
r tra
nspo
rt in
jurie
sDr
owni
ngOt
her u
nint
entio
nal i
njur
ies
Trac
hea,
bro
nchu
s an
d lu
ng c
ance
rCy
clis
t roa
d in
jurie
sFi
re, h
eat a
nd h
ot s
ubst
ance
sM
esot
helio
ma
Veno
mou
s an
imal
con
tact
Trac
hea,
bro
nchu
s an
d lu
ng c
ance
rPu
lmon
ary
aspi
ratio
n an
d fo
reig
n bo
dy in
airw
ayUn
inte
ntio
nal f
irear
m in
jurie
sPo
ison
ing
by o
ther
mea
nsTr
ache
a, b
ronc
hus
and
lung
can
cer
Othe
r roa
d in
jurie
sTr
ache
a, b
ronc
hus
and
lung
can
cer
Pois
onin
g by
car
bon
mon
oxid
eFo
reig
n bo
dy in
oth
er b
ody
part
Non-
veno
mou
s co
ntac
tTr
ache
a, b
ronc
hus
and
lung
can
cer
Ovar
y ca
ncer
Lary
nx c
ance
rLe
ukae
mia
Lary
nx c
ance
rTr
ache
a, b
ronc
hus
and
lung
can
cer
Leuk
aem
iaNa
soph
aryn
x ca
ncer
Trac
hea,
bro
nchu
s an
d lu
ng c
ance
rTr
ache
a, b
ronc
hus
and
lung
can
cer
Kidn
ey c
ance
r
035
0070
0010
500
14 0
00
Occu
patio
nal r
isk
fact
ors
Heal
th o
utco
mes
16 WHO/ILO JOINT ESTIMATES OF THE WORK-RELATED BURDEN OF DISEASE AND INJURY, 2000-2016
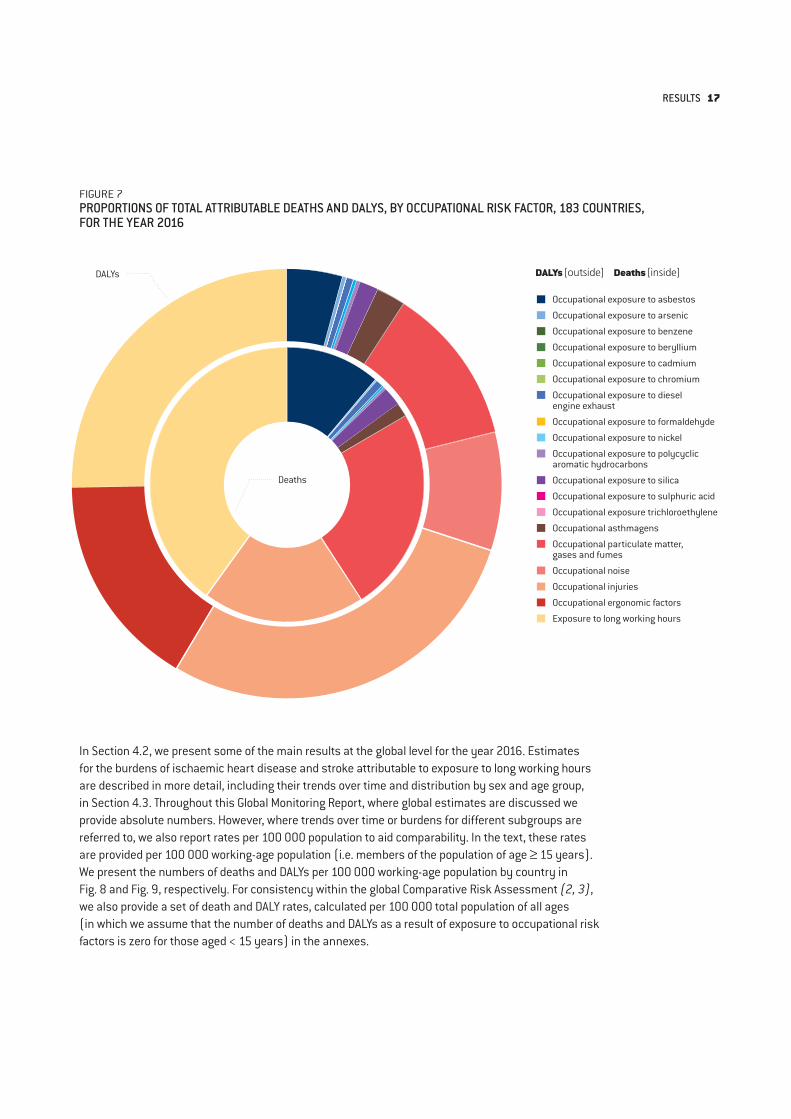
In Section 4.2, we present some of the main results at the global level for the year 2016. Estimates for the burdens of ischaemic heart disease and stroke attributable to exposure to long working hours are described in more detail, including their trends over time and distribution by sex and age group, in Section 4.3. Throughout this Global Monitoring Report, where global estimates are discussed we provide absolute numbers. However, where trends over time or burdens for different subgroups are referred to, we also report rates per 100 000 population to aid comparability. In the text, these rates are provided per 100 000 working-age population (i.e. members of the population of age ≥ 15 years). We present the numbers of deaths and DALYs per 100 000 working-age population by country in Fig. 8 and Fig. 9, respectively. For consistency within the global Comparative Risk Assessment (2, 3), we also provide a set of death and DALY rates, calculated per 100 000 total population of all ages (in which we assume that the number of deaths and DALYs as a result of exposure to occupational risk factors is zero for those aged < 15 years) in the annexes.
FIGURE 7PROPORTIONS OF TOTAL ATTRIBUTABLE DEATHS AND DALYS, BY OCCUPATIONAL RISK FACTOR, 183 COUNTRIES, FOR THE YEAR 2016
DALYs [outside] Deaths [inside]
Occupational exposure to asbestos
Occupational exposure to arsenic
Occupational exposure to benzene
Occupational exposure to beryllium
Occupational exposure to cadmium
Occupational exposure to chromium
Occupational exposure to diesel engine exhaust
Occupational exposure to formaldehyde
Occupational exposure to nickel
Occupational exposure to polycyclic aromatic hydrocarbons
Occupational exposure to silica
Occupational exposure to sulphuric acid
Occupational exposure trichloroethylene
Occupational asthmagens
Occupational particulate matter, gases and fumes
Occupational noise
Occupational injuries
Occupational ergonomic factors
Exposure to long working hours
DALYs
Deaths
RESULTS 17
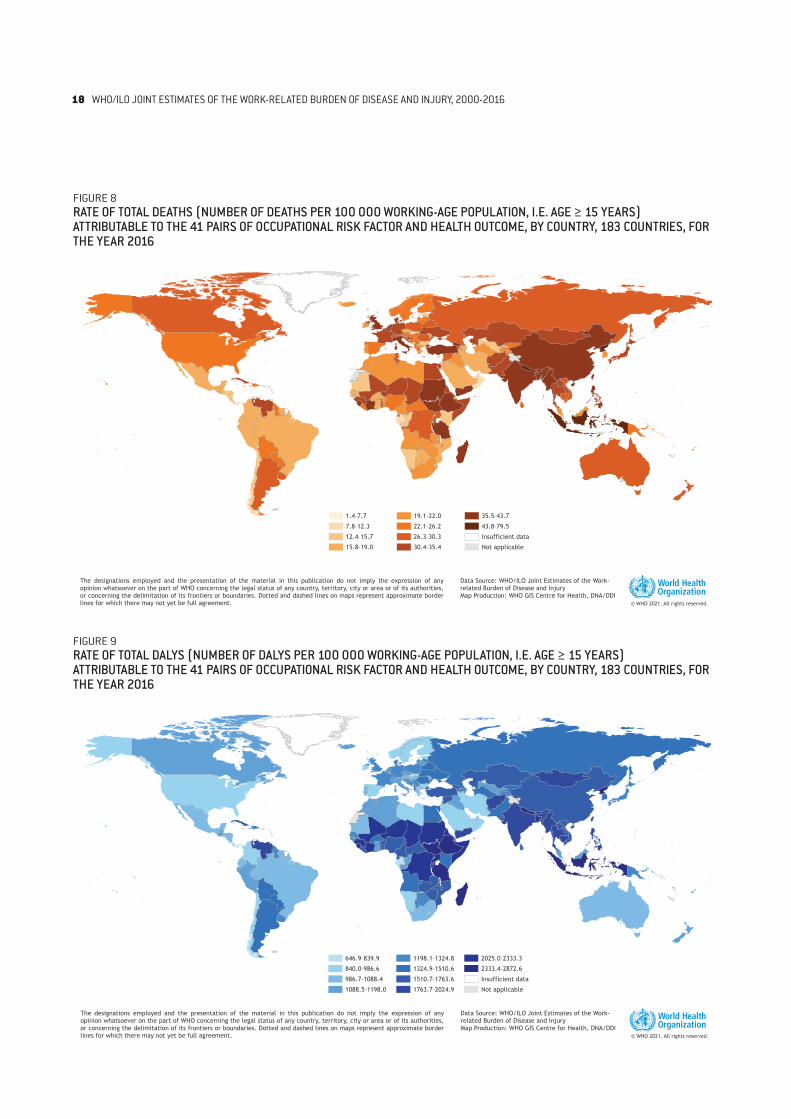
FIGURE 8RATE OF TOTAL DEATHS (NUMBER OF DEATHS PER 100 000 WORKING-AGE POPULATION, I.E. AGE ≥ 15 YEARS) ATTRIBUTABLE TO THE 41 PAIRS OF OCCUPATIONAL RISK FACTOR AND HEALTH OUTCOME, BY COUNTRY, 183 COUNTRIES, FOR THE YEAR 2016
FIGURE 9RATE OF TOTAL DALYS (NUMBER OF DALYS PER 100 000 WORKING-AGE POPULATION, I.E. AGE ≥ 15 YEARS) ATTRIBUTABLE TO THE 41 PAIRS OF OCCUPATIONAL RISK FACTOR AND HEALTH OUTCOME, BY COUNTRY, 183 COUNTRIES, FOR THE YEAR 2016
646.9–839.9
840.0–986.6
986.7–1088.4
1088.5–1198.0
1198.1–1324.8
1324.9–1510.6
1510.7–1763.6
1763.7–2024.9
2025.0–2333.3
2333.4–2872.6
Insufficient data
Not applicable
1.4–7.7
7.8–12.3
12.4–15.7
15.8–19.0
19.1–22.0
22.1–26.2
26.3–30.3
30.4–35.4
35.5–43.7
43.8–79.5
Insufficient data
Not applicable
1.4–7.7
7.8–12.3
12.4–15.7
15.8–19.0
19.1–22.0
22.1–26.2
26.3–30.3
30.4–35.4
35.5–43.7
43.8–79.5
Insufficient data
Not applicable
© WHO 2021. All rights reserved.
Data Source: WHO/ILO Joint Estimates of the Work-related Burden of Disease and InjuryMap Production: WHO GIS Centre for Health, DNA/DDI
The designations employed and the presentation of the material in this publication do not imply the expression of anyopinion whatsoever on the part of WHO concerning the legal status of any country, territory, city or area or of its authorities,or concerning the delimitation of its frontiers or boundaries. Dotted and dashed lines on maps represent approximate borderlines for which there may not yet be full agreement.
646.9–839.9
840.0–986.6
986.7–1088.4
1088.5–1198.0
1198.1–1324.8
1324.9–1510.6
1510.7–1763.6
1763.7–2024.9
2025.0–2333.3
2333.4–2872.6
Insufficient data
Not applicable
© WHO 2021. All rights reserved.
Data Source: WHO/ILO Joint Estimates of the Work-related Burden of Disease and InjuryMap Production: WHO GIS Centre for Health, DNA/DDI
The designations employed and the presentation of the material in this publication do not imply the expression of anyopinion whatsoever on the part of WHO concerning the legal status of any country, territory, city or area or of its authorities,or concerning the delimitation of its frontiers or boundaries. Dotted and dashed lines on maps represent approximate borderlines for which there may not yet be full agreement.
18 WHO/ILO JOINT ESTIMATES OF THE WORK-RELATED BURDEN OF DISEASE AND INJURY, 2000-2016
4.2. Estimates for established pairs
The estimates of number of deaths and DALYs for the 39 established pairs of occupational risk factor and health outcome are listed for the years 2000, 2010 and 2016 in Annex 2. We discuss each occupational risk factor and report its attributable burden of disease, and describe primary preventative interventions, in Sections 4.2.1–4.2.18 below. Thirteen of the occupational risk factors (asbestos, arsenic, benzene, beryllium, cadmium, chromium, diesel engine exhaust, formaldehyde, nickel, polycyclic aromatic hydrocarbons, silica, sulphuric acid and trichloroethylene) are classified as Group 1 carcinogens by the WHO International Agency for Research on Cancer (IARC), meaning there is “sufficient evidence of carcinogenicity in humans”.
To reduce work-related burden of disease, intersectoral action is needed that adopts a population health approach to workers’ health, scales up “efforts to promote healthier and safer workplaces and improve access to occupational health services” (37) and addresses the social determinants of workers’ health to improve health equity (38, 39). For example, the ratification and implementation of occupational health and safety ILO standards (conventions, protocols and recommendations) play a fundamental role in ensuring effective occupational and workers’ health and safety policies and systems that prevent exposure to occupational risk factors and, in turn, prevent work-related burden of disease.
Similarly, the integration of workers’ health in people-centred care and universal health coverage, and dedicated policies and programmes for occupational health services for all workers, are also fundamental, especially to reach some health-disadvantaged workers (e.g. those working in the informal economy). Occupational health services can take the form of periodic occupational health risk assessments, as well as the provision of other health services that prevent exposure to occupational risk factors, from enterprise, sector, community, national, regional to global levels. These can be used to provide early detection of occupational diseases with periodic medical examinations of workers (e.g. screening for lung cancer or testing for exposure to occupational risk factors). For workers such as those in the informal economy, these services may only be delivered to them if provided through primary or community health care systems.
These assessments, policies and programmes should be developed with the active involvement of employers and workers or their representatives. These interventions should be considered as part of a hierarchy of controls (40); ideally, risk factors should be eliminated or less hazardous substitutions used (41). Where this is not possible, engineering controls followed by administrative controls can be introduced (in this order). If all else fails, as a last and least-preferred option in the hierarchy, workers can be protected from exposure to occupational risk factors with personal protective equipment. ILO standards (42) and WHO and ILO guidelines and tools support governments, workers and employers to prevent the burden of disease attributable to exposures to occupational risk factors (43, 44) (see also forthcoming WHO publication Compendium of WHO and other UN guidance on health and environment).
RESULTS 19
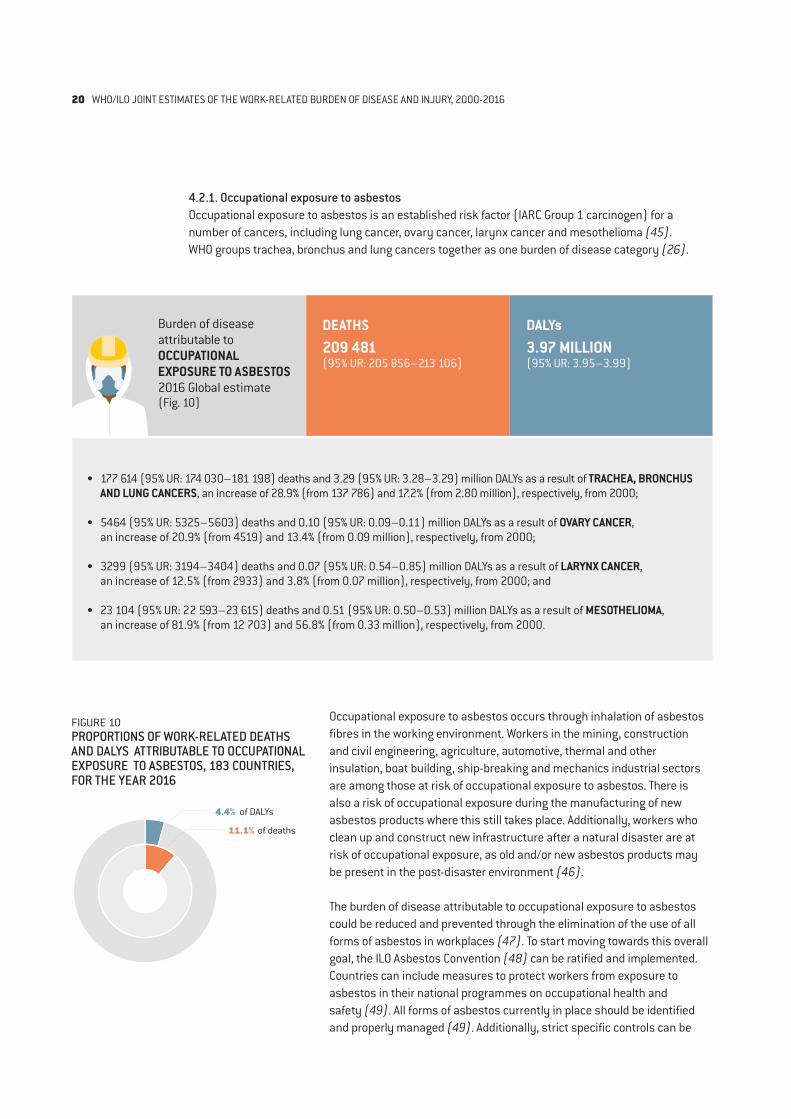
Burden of disease attributable toOCCUPATIONAL EXPOSURE TO ASBESTOS2016 Global estimate(Fig. 10)
DEATHS 209 481 (95% UR: 205 856–213 106)
DALYs 3.97 MILLION(95% UR: 3.95–3.99)
• 177 614 (95% UR: 174 030–181 198) deaths and 3.29 (95% UR: 3.28–3.29) million DALYs as a result of TRACHEA, BRONCHUS AND LUNG CANCERS, an increase of 28.9% (from 137 786) and 17.2% (from 2.80 million), respectively, from 2000;
• 5464 (95% UR: 5325–5603) deaths and 0.10 (95% UR: 0.09–0.11) million DALYs as a result of OVARY CANCER, an increase of 20.9% (from 4519) and 13.4% (from 0.09 million), respectively, from 2000;
• 3299 (95% UR: 3194–3404) deaths and 0.07 (95% UR: 0.54–0.85) million DALYs as a result of LARYNX CANCER, an increase of 12.5% (from 2933) and 3.8% (from 0.07 million), respectively, from 2000; and
• 23 104 (95% UR: 22 593–23 615) deaths and 0.51 (95% UR: 0.50–0.53) million DALYs as a result of MESOTHELIOMA, an increase of 81.9% (from 12 703) and 56.8% (from 0.33 million), respectively, from 2000.
FIGURE 10PROPORTIONS OF WORK-RELATED DEATHS AND DALYS ATTRIBUTABLE TO OCCUPATIONAL EXPOSURE TO ASBESTOS, 183 COUNTRIES, FOR THE YEAR 2016
4.4% of DALYs
11.1% of deaths
4.2.1. Occupational exposure to asbestos Occupational exposure to asbestos is an established risk factor (IARC Group 1 carcinogen) for a number of cancers, including lung cancer, ovary cancer, larynx cancer and mesothelioma (45). WHO groups trachea, bronchus and lung cancers together as one burden of disease category (26).
Occupational exposure to asbestos occurs through inhalation of asbestos fibres in the working environment. Workers in the mining, construction and civil engineering, agriculture, automotive, thermal and other insulation, boat building, ship-breaking and mechanics industrial sectors are among those at risk of occupational exposure to asbestos. There is also a risk of occupational exposure during the manufacturing of new asbestos products where this still takes place. Additionally, workers who clean up and construct new infrastructure after a natural disaster are at risk of occupational exposure, as old and/or new asbestos products may be present in the post-disaster environment (46).
The burden of disease attributable to occupational exposure to asbestos could be reduced and prevented through the elimination of the use of all forms of asbestos in workplaces (47). To start moving towards this overall goal, the ILO Asbestos Convention (48) can be ratified and implemented. Countries can include measures to protect workers from exposure to asbestos in their national programmes on occupational health and safety (49). All forms of asbestos currently in place should be identified and properly managed (49). Additionally, strict specific controls can be
20 WHO/ILO JOINT ESTIMATES OF THE WORK-RELATED BURDEN OF DISEASE AND INJURY, 2000-2016
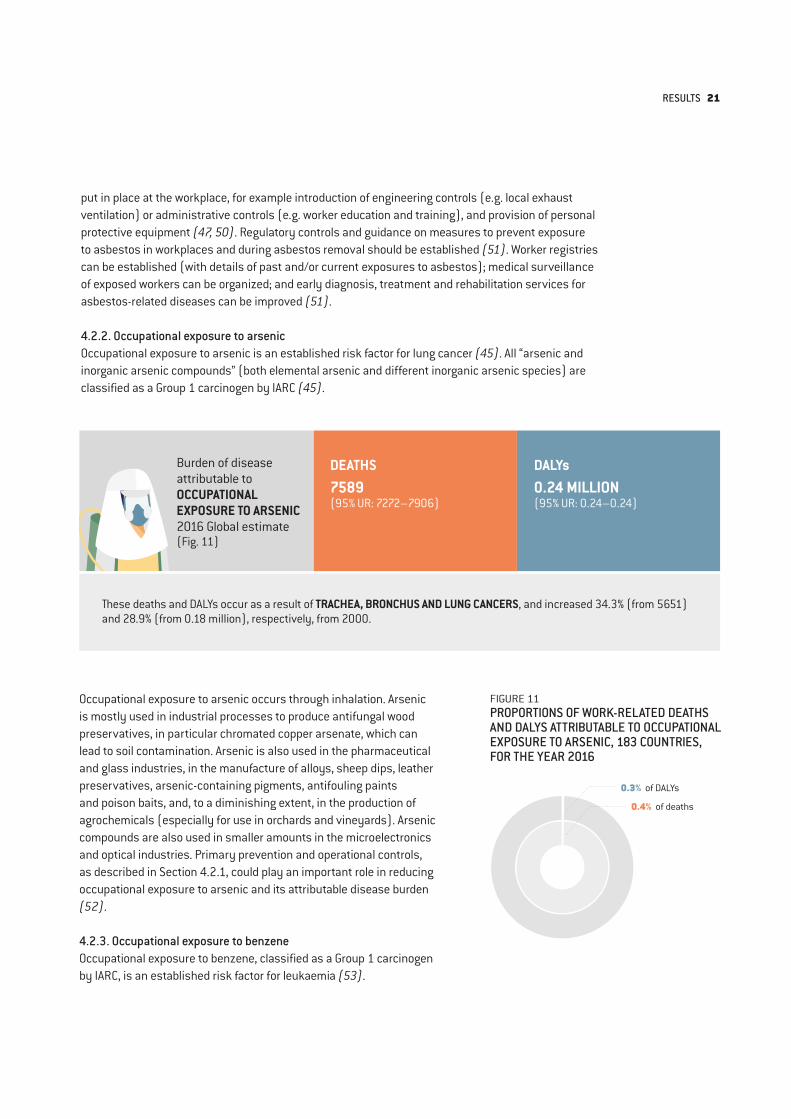
FIGURE 11PROPORTIONS OF WORK-RELATED DEATHS AND DALYS ATTRIBUTABLE TO OCCUPATIONAL EXPOSURE TO ARSENIC, 183 COUNTRIES, FOR THE YEAR 2016
0.3% of DALYs
0.4% of deaths
put in place at the workplace, for example introduction of engineering controls (e.g. local exhaust ventilation) or administrative controls (e.g. worker education and training), and provision of personal protective equipment (47, 50). Regulatory controls and guidance on measures to prevent exposure to asbestos in workplaces and during asbestos removal should be established (51). Worker registries can be established (with details of past and/or current exposures to asbestos); medical surveillance of exposed workers can be organized; and early diagnosis, treatment and rehabilitation services for asbestos-related diseases can be improved (51).
4.2.2. Occupational exposure to arsenic Occupational exposure to arsenic is an established risk factor for lung cancer (45). All “arsenic and inorganic arsenic compounds” (both elemental arsenic and different inorganic arsenic species) are classified as a Group 1 carcinogen by IARC (45).
Occupational exposure to arsenic occurs through inhalation. Arsenic is mostly used in industrial processes to produce antifungal wood preservatives, in particular chromated copper arsenate, which can lead to soil contamination. Arsenic is also used in the pharmaceutical and glass industries, in the manufacture of alloys, sheep dips, leather preservatives, arsenic-containing pigments, antifouling paints and poison baits, and, to a diminishing extent, in the production of agrochemicals (especially for use in orchards and vineyards). Arsenic compounds are also used in smaller amounts in the microelectronics and optical industries. Primary prevention and operational controls, as described in Section 4.2.1, could play an important role in reducing occupational exposure to arsenic and its attributable disease burden (52).
4.2.3. Occupational exposure to benzene Occupational exposure to benzene, classified as a Group 1 carcinogen by IARC, is an established risk factor for leukaemia (53).
Burden of disease attributable toOCCUPATIONAL EXPOSURE TO ARSENIC2016 Global estimate(Fig. 11)
DEATHS 7589 (95% UR: 7272–7906)
DALYs 0.24 MILLION(95% UR: 0.24–0.24)
These deaths and DALYs occur as a result of TRACHEA, BRONCHUS AND LUNG CANCERS, and increased 34.3% (from 5651) and 28.9% (from 0.18 million), respectively, from 2000.
RESULTS 21
Occupational exposure to benzene primarily occurs through inhalation or skin absorption. Workers at risk include automotive mechanics, paper factory workers, carpenters and painters, with adhesive, chemical, petroleum, rubber and shoe/leather industries carrying the greatest risk of exposure. Occupational exposure to benzene continues to occur in medical and research laboratories (pathologic anatomy laboratories), particularly in low- and middle-income countries. ILO Convention No. 136 on benzene (1971) defines the principles and framework to limit exposure to benzene and its implication to workers’ health (54). Primary prevention and operational controls, as described in Section 4.2.1, could play an important role in reducing occupational exposure to benzene and its attributable disease burden. No safe level of exposure to benzene can be recommended (55); use of benzene should therefore be eliminated where possible and educational activities conducted to discourage use of benzene (56, 57). Benzene-exposed workers should also be screened for the associated health effects.
4.2.4. Occupational exposure to beryllium Occupational exposure to beryllium, a Group 1 carcinogen as classified by IARC, is an established risk factor for lung cancer (58).
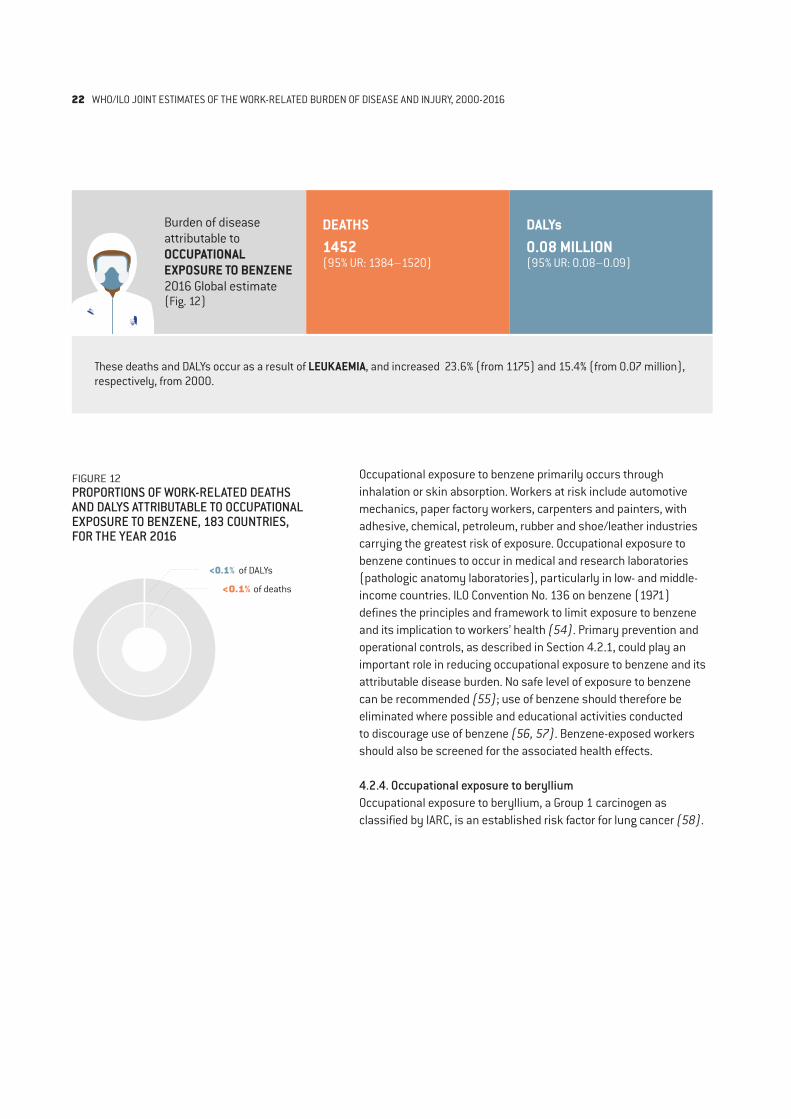
Burden of disease attributable to OCCUPATIONAL EXPOSURE TO BENZENE2016 Global estimate(Fig. 12)
DEATHS 1452 (95% UR: 1384–1520)
DALYs 0.08 MILLION(95% UR: 0.08–0.09)
FIGURE 12PROPORTIONS OF WORK-RELATED DEATHS AND DALYS ATTRIBUTABLE TO OCCUPATIONAL EXPOSURE TO BENZENE, 183 COUNTRIES, FOR THE YEAR 2016
<0.1% of DALYs
<0.1% of deaths
These deaths and DALYs occur as a result of LEUKAEMIA, and increased 23.6% (from 1175) and 15.4% (from 0.07 million), respectively, from 2000.
22 WHO/ILO JOINT ESTIMATES OF THE WORK-RELATED BURDEN OF DISEASE AND INJURY, 2000-2016
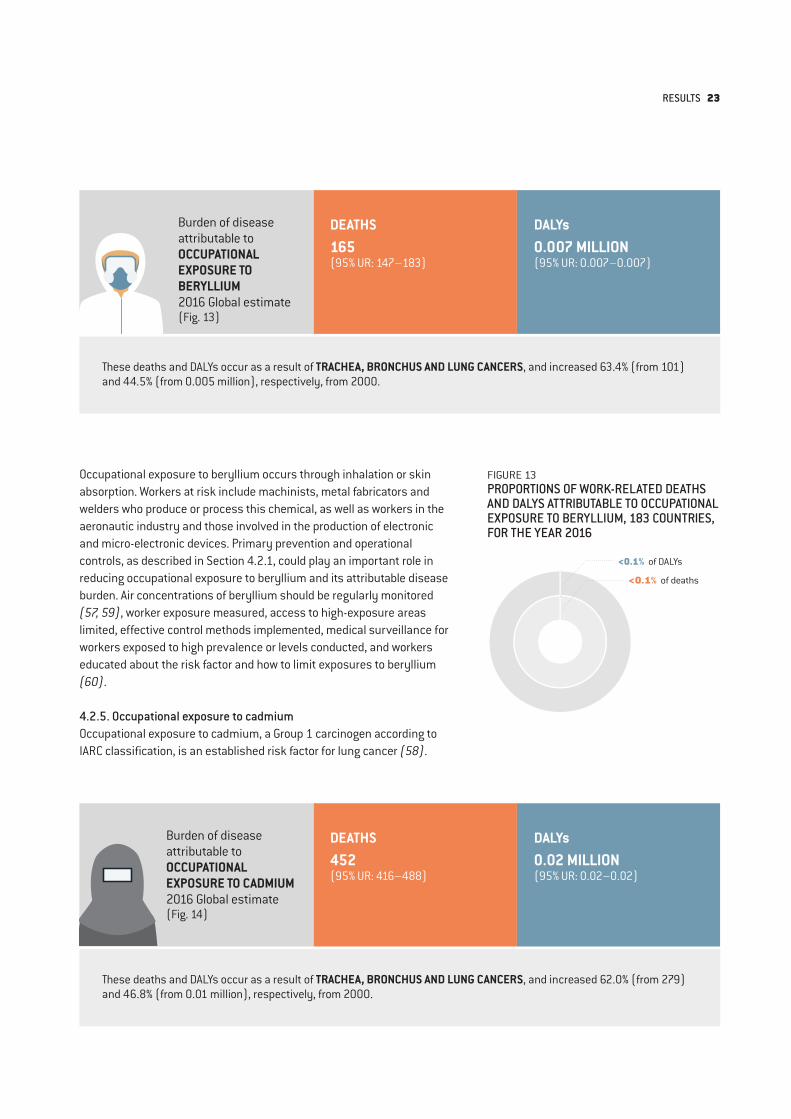
FIGURE 13PROPORTIONS OF WORK-RELATED DEATHS AND DALYS ATTRIBUTABLE TO OCCUPATIONAL EXPOSURE TO BERYLLIUM, 183 COUNTRIES, FOR THE YEAR 2016
<0.1% of DALYs
<0.1% of deaths
Burden of disease attributable toOCCUPATIONAL EXPOSURE TO BERYLLIUM2016 Global estimate(Fig. 13)
Burden of disease attributable toOCCUPATIONAL EXPOSURE TO CADMIUM2016 Global estimate(Fig. 14)
DEATHS 165 (95% UR: 147–183)
DEATHS 452 (95% UR: 416–488)
DALYs 0.007 MILLION(95% UR: 0.007–0.007)
DALYs 0.02 MILLION(95% UR: 0.02–0.02)
Occupational exposure to beryllium occurs through inhalation or skin absorption. Workers at risk include machinists, metal fabricators and welders who produce or process this chemical, as well as workers in the aeronautic industry and those involved in the production of electronic and micro-electronic devices. Primary prevention and operational controls, as described in Section 4.2.1, could play an important role in reducing occupational exposure to beryllium and its attributable disease burden. Air concentrations of beryllium should be regularly monitored (57, 59), worker exposure measured, access to high-exposure areas limited, effective control methods implemented, medical surveillance for workers exposed to high prevalence or levels conducted, and workers educated about the risk factor and how to limit exposures to beryllium (60).
4.2.5. Occupational exposure to cadmium Occupational exposure to cadmium, a Group 1 carcinogen according to IARC classification, is an established risk factor for lung cancer (58).
These deaths and DALYs occur as a result of TRACHEA, BRONCHUS AND LUNG CANCERS, and increased 63.4% (from 101) and 44.5% (from 0.005 million), respectively, from 2000.
These deaths and DALYs occur as a result of TRACHEA, BRONCHUS AND LUNG CANCERS, and increased 62.0% (from 279) and 46.8% (from 0.01 million), respectively, from 2000.
RESULTS 23
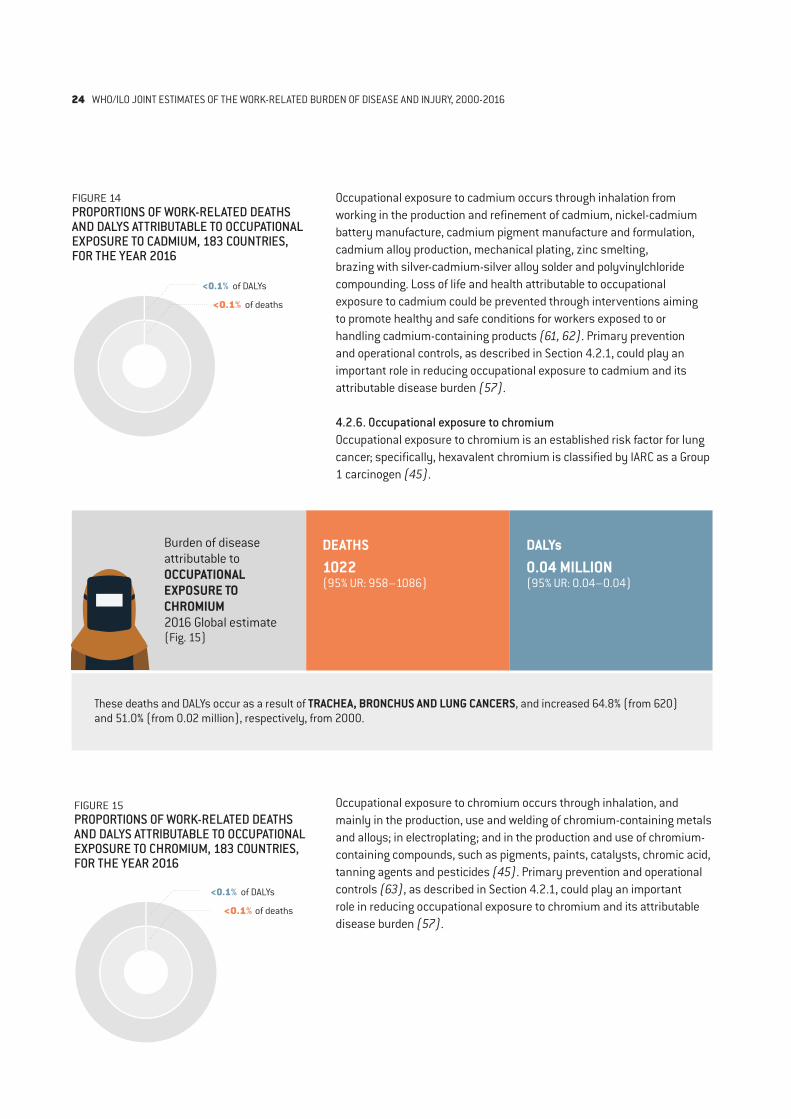
Burden of disease attributable toOCCUPATIONAL EXPOSURE TO CHROMIUM2016 Global estimate(Fig. 15)
DEATHS 1022(95% UR: 958–1086)
DALYs 0.04 MILLION(95% UR: 0.04–0.04)
Occupational exposure to cadmium occurs through inhalation from working in the production and refinement of cadmium, nickel-cadmium battery manufacture, cadmium pigment manufacture and formulation, cadmium alloy production, mechanical plating, zinc smelting, brazing with silver-cadmium-silver alloy solder and polyvinylchloride compounding. Loss of life and health attributable to occupational exposure to cadmium could be prevented through interventions aiming to promote healthy and safe conditions for workers exposed to or handling cadmium-containing products (61, 62). Primary prevention and operational controls, as described in Section 4.2.1, could play an important role in reducing occupational exposure to cadmium and its attributable disease burden (57).
4.2.6. Occupational exposure to chromium Occupational exposure to chromium is an established risk factor for lung cancer; specifically, hexavalent chromium is classified by IARC as a Group 1 carcinogen (45).
FIGURE 15PROPORTIONS OF WORK-RELATED DEATHS AND DALYS ATTRIBUTABLE TO OCCUPATIONAL EXPOSURE TO CHROMIUM, 183 COUNTRIES, FOR THE YEAR 2016
<0.1% of DALYs
<0.1% of deaths
FIGURE 14PROPORTIONS OF WORK-RELATED DEATHS AND DALYS ATTRIBUTABLE TO OCCUPATIONAL EXPOSURE TO CADMIUM, 183 COUNTRIES, FOR THE YEAR 2016
<0.1% of DALYs
<0.1% of deaths
Occupational exposure to chromium occurs through inhalation, and mainly in the production, use and welding of chromium-containing metals and alloys; in electroplating; and in the production and use of chromium-containing compounds, such as pigments, paints, catalysts, chromic acid, tanning agents and pesticides (45). Primary prevention and operational controls (63), as described in Section 4.2.1, could play an important role in reducing occupational exposure to chromium and its attributable disease burden (57).
These deaths and DALYs occur as a result of TRACHEA, BRONCHUS AND LUNG CANCERS, and increased 64.8% (from 620) and 51.0% (from 0.02 million), respectively, from 2000.
24 WHO/ILO JOINT ESTIMATES OF THE WORK-RELATED BURDEN OF DISEASE AND INJURY, 2000-2016
Burden of disease attributable toOCCUPATIONAL EXPOSURE TO DIESEL ENGINE EXHAUST2016 Global estimate(Fig. 16)
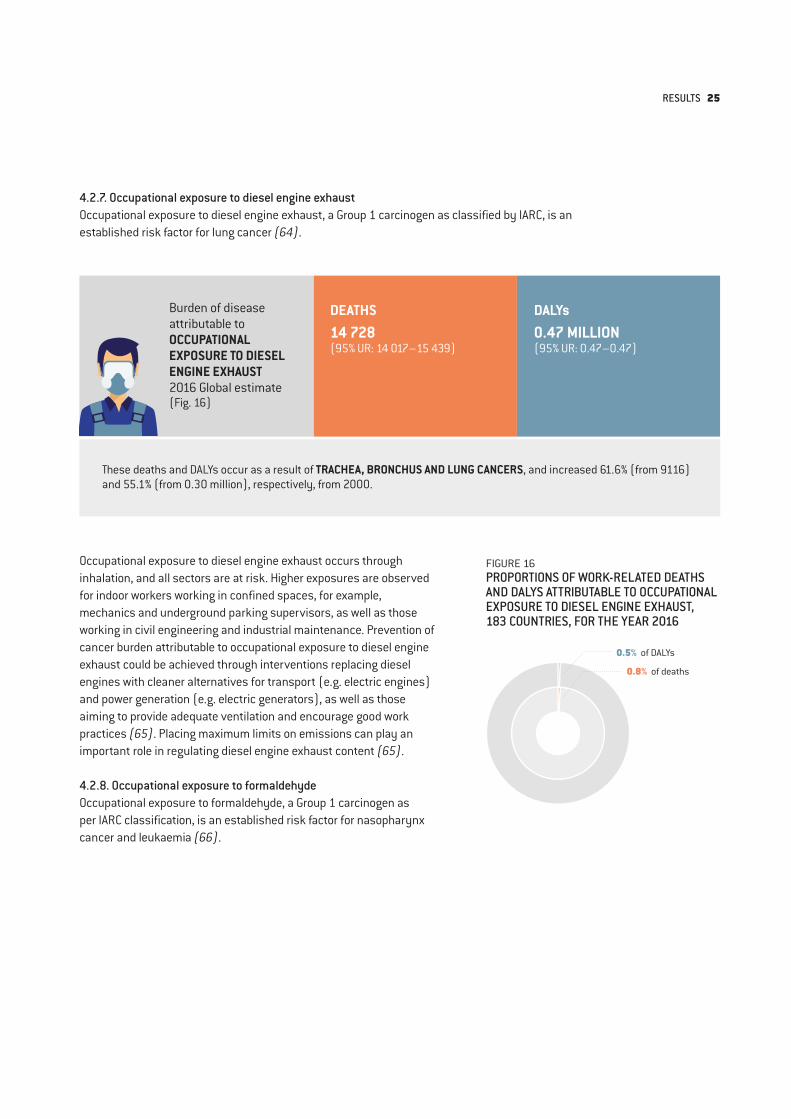
DEATHS 14 728 (95% UR: 14 017–15 439)
DALYs 0.47 MILLION(95% UR: 0.47–0.47)
4.2.7. Occupational exposure to diesel engine exhaust Occupational exposure to diesel engine exhaust, a Group 1 carcinogen as classified by IARC, is an established risk factor for lung cancer (64).
These deaths and DALYs occur as a result of TRACHEA, BRONCHUS AND LUNG CANCERS, and increased 61.6% (from 9116) and 55.1% (from 0.30 million), respectively, from 2000.
FIGURE 16PROPORTIONS OF WORK-RELATED DEATHS AND DALYS ATTRIBUTABLE TO OCCUPATIONAL EXPOSURE TO DIESEL ENGINE EXHAUST, 183 COUNTRIES, FOR THE YEAR 2016
0.5% of DALYs
0.8% of deaths
Occupational exposure to diesel engine exhaust occurs through inhalation, and all sectors are at risk. Higher exposures are observed for indoor workers working in confined spaces, for example, mechanics and underground parking supervisors, as well as those working in civil engineering and industrial maintenance. Prevention of cancer burden attributable to occupational exposure to diesel engine exhaust could be achieved through interventions replacing diesel engines with cleaner alternatives for transport (e.g. electric engines) and power generation (e.g. electric generators), as well as those aiming to provide adequate ventilation and encourage good work practices (65). Placing maximum limits on emissions can play an important role in regulating diesel engine exhaust content (65).
4.2.8. Occupational exposure to formaldehyde Occupational exposure to formaldehyde, a Group 1 carcinogen as per IARC classification, is an established risk factor for nasopharynx cancer and leukaemia (66).
RESULTS 25
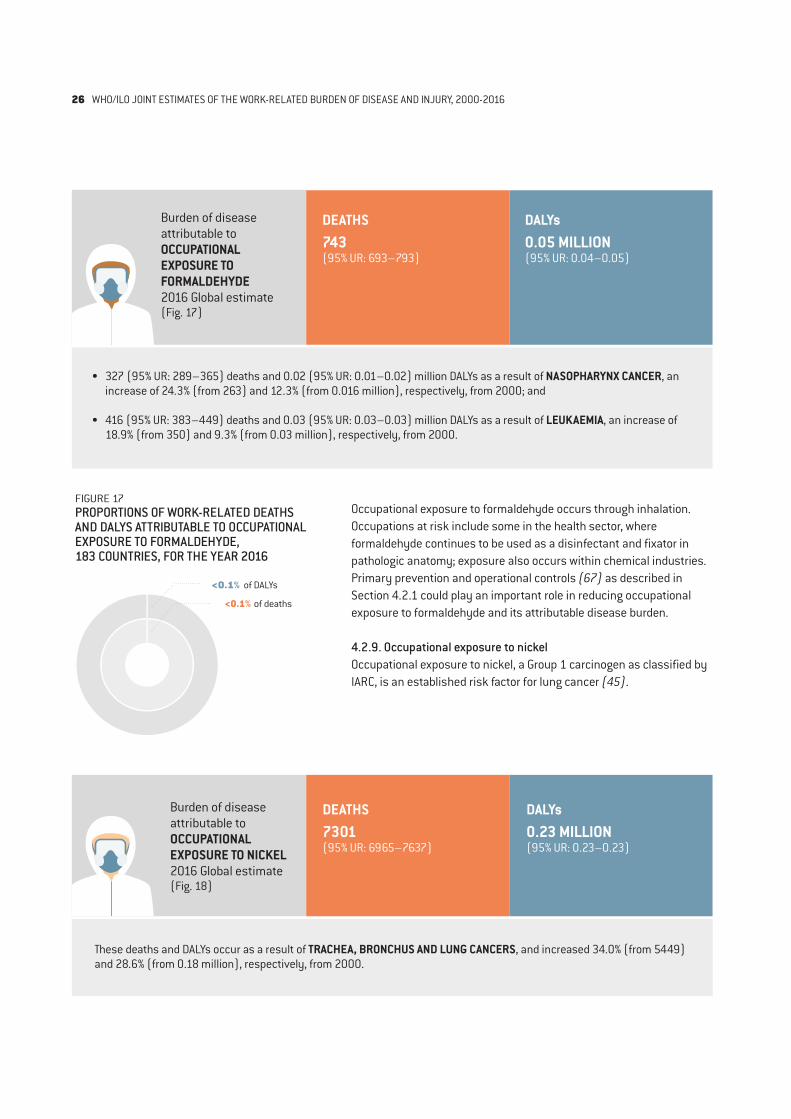
FIGURE 17PROPORTIONS OF WORK-RELATED DEATHS AND DALYS ATTRIBUTABLE TO OCCUPATIONAL EXPOSURE TO FORMALDEHYDE, 183 COUNTRIES, FOR THE YEAR 2016
<0.1% of DALYs
<0.1% of deaths
Burden of disease attributable toOCCUPATIONAL EXPOSURE TO NICKEL2016 Global estimate(Fig. 18)
DEATHS 7301(95% UR: 6965–7637)
DALYs 0.23 MILLION(95% UR: 0.23–0.23)
Occupational exposure to formaldehyde occurs through inhalation. Occupations at risk include some in the health sector, where formaldehyde continues to be used as a disinfectant and fixator in pathologic anatomy; exposure also occurs within chemical industries. Primary prevention and operational controls (67) as described in Section 4.2.1 could play an important role in reducing occupational exposure to formaldehyde and its attributable disease burden.
4.2.9. Occupational exposure to nickel Occupational exposure to nickel, a Group 1 carcinogen as classified by IARC, is an established risk factor for lung cancer (45).
Burden of disease attributable toOCCUPATIONAL EXPOSURE TO FORMALDEHYDE2016 Global estimate(Fig. 17)
DEATHS 743 (95% UR: 693–793)
DALYs 0.05 MILLION(95% UR: 0.04–0.05)
• 327 (95% UR: 289–365) deaths and 0.02 (95% UR: 0.01–0.02) million DALYs as a result of NASOPHARYNX CANCER, an increase of 24.3% (from 263) and 12.3% (from 0.016 million), respectively, from 2000; and
• 416 (95% UR: 383–449) deaths and 0.03 (95% UR: 0.03–0.03) million DALYs as a result of LEUKAEMIA, an increase of 18.9% (from 350) and 9.3% (from 0.03 million), respectively, from 2000.
These deaths and DALYs occur as a result of TRACHEA, BRONCHUS AND LUNG CANCERS, and increased 34.0% (from 5449) and 28.6% (from 0.18 million), respectively, from 2000.
26 WHO/ILO JOINT ESTIMATES OF THE WORK-RELATED BURDEN OF DISEASE AND INJURY, 2000-2016
Occupational exposure to nickel occurs through both inhalation and cutaneous absorption. Occupations at risk include manufacturers of fabricated metal products or machinists and welders. Primary prevention and operational controls, as described in Section 4.2.1, could be of great importance in reducing occupational exposure to nickel and the attributable disease burden. Workers occupationally exposed to nickel and its compounds should undergo periodic health examinations, particularly of the lungs, upper respiratory tract and skin (68).
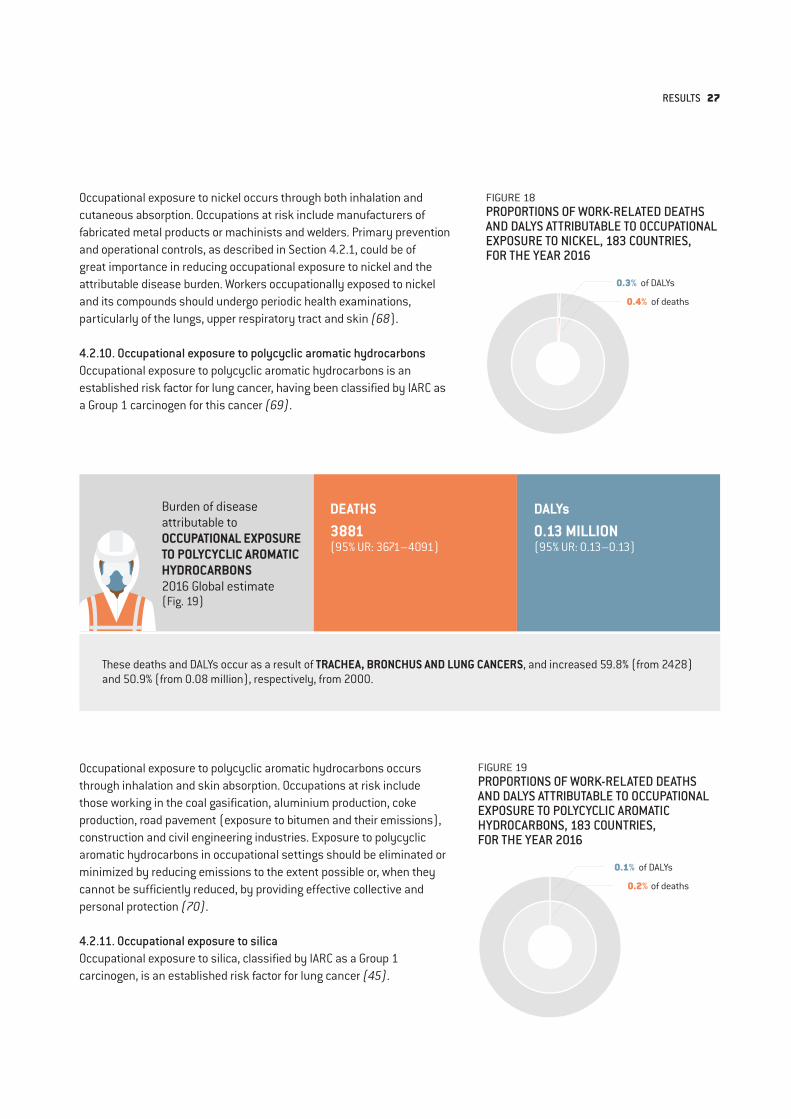
4.2.10. Occupational exposure to polycyclic aromatic hydrocarbons Occupational exposure to polycyclic aromatic hydrocarbons is an established risk factor for lung cancer, having been classified by IARC as a Group 1 carcinogen for this cancer (69).
Burden of disease attributable toOCCUPATIONAL EXPOSURE TO POLYCYCLIC AROMATIC HYDROCARBONS2016 Global estimate(Fig. 19)
DEATHS 3881(95% UR: 3671–4091)
DALYs 0.13 MILLION(95% UR: 0.13–0.13)
Occupational exposure to polycyclic aromatic hydrocarbons occurs through inhalation and skin absorption. Occupations at risk include those working in the coal gasification, aluminium production, coke production, road pavement (exposure to bitumen and their emissions), construction and civil engineering industries. Exposure to polycyclic aromatic hydrocarbons in occupational settings should be eliminated or minimized by reducing emissions to the extent possible or, when they cannot be sufficiently reduced, by providing effective collective and personal protection (70).
4.2.11. Occupational exposure to silica Occupational exposure to silica, classified by IARC as a Group 1 carcinogen, is an established risk factor for lung cancer (45).
These deaths and DALYs occur as a result of TRACHEA, BRONCHUS AND LUNG CANCERS, and increased 59.8% (from 2428) and 50.9% (from 0.08 million), respectively, from 2000.
FIGURE 18PROPORTIONS OF WORK-RELATED DEATHS AND DALYS ATTRIBUTABLE TO OCCUPATIONAL EXPOSURE TO NICKEL, 183 COUNTRIES, FOR THE YEAR 2016
0.3% of DALYs
0.4% of deaths
FIGURE 19PROPORTIONS OF WORK-RELATED DEATHS AND DALYS ATTRIBUTABLE TO OCCUPATIONAL EXPOSURE TO POLYCYCLIC AROMATIC HYDROCARBONS, 183 COUNTRIES, FOR THE YEAR 2016
0.1% of DALYs
0.2% of deaths
RESULTS 27
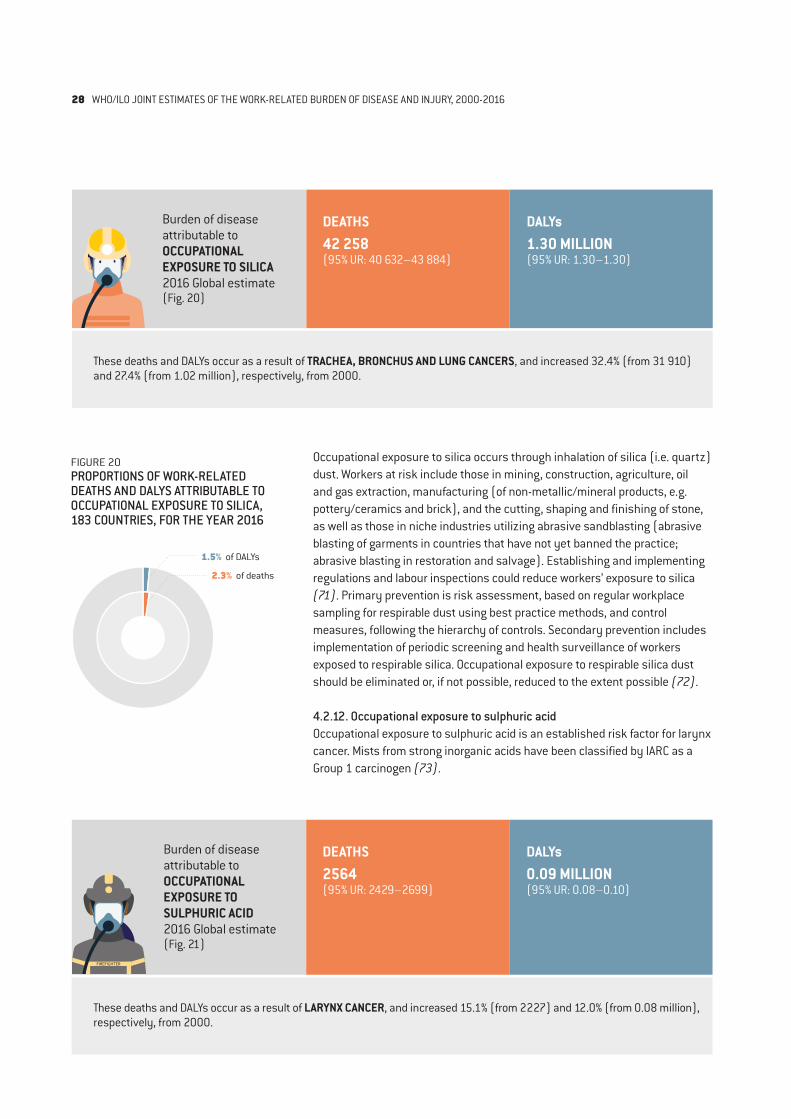
FIGURE 20PROPORTIONS OF WORK-RELATED DEATHS AND DALYS ATTRIBUTABLE TO OCCUPATIONAL EXPOSURE TO SILICA, 183 COUNTRIES, FOR THE YEAR 2016
1.5% of DALYs
2.3% of deaths
Burden of disease attributable toOCCUPATIONAL EXPOSURE TO SULPHURIC ACID2016 Global estimate(Fig. 21)
DEATHS 2564(95% UR: 2429–2699)
DALYs 0.09 MILLION(95% UR: 0.08–0.10)
Burden of disease attributable toOCCUPATIONAL EXPOSURE TO SILICA2016 Global estimate(Fig. 20)
DEATHS 42 258 (95% UR: 40 632–43 884)
DALYs 1.30 MILLION(95% UR: 1.30–1.30)
These deaths and DALYs occur as a result of TRACHEA, BRONCHUS AND LUNG CANCERS, and increased 32.4% (from 31 910) and 27.4% (from 1.02 million), respectively, from 2000.
These deaths and DALYs occur as a result of LARYNX CANCER, and increased 15.1% (from 2227) and 12.0% (from 0.08 million), respectively, from 2000.
Occupational exposure to silica occurs through inhalation of silica (i.e. quartz) dust. Workers at risk include those in mining, construction, agriculture, oil and gas extraction, manufacturing (of non-metallic/mineral products, e.g. pottery/ceramics and brick), and the cutting, shaping and finishing of stone, as well as those in niche industries utilizing abrasive sandblasting (abrasive blasting of garments in countries that have not yet banned the practice; abrasive blasting in restoration and salvage). Establishing and implementing regulations and labour inspections could reduce workers’ exposure to silica (71). Primary prevention is risk assessment, based on regular workplace sampling for respirable dust using best practice methods, and control measures, following the hierarchy of controls. Secondary prevention includes implementation of periodic screening and health surveillance of workers exposed to respirable silica. Occupational exposure to respirable silica dust should be eliminated or, if not possible, reduced to the extent possible (72).
4.2.12. Occupational exposure to sulphuric acid Occupational exposure to sulphuric acid is an established risk factor for larynx cancer. Mists from strong inorganic acids have been classified by IARC as a Group 1 carcinogen (73).
28 WHO/ILO JOINT ESTIMATES OF THE WORK-RELATED BURDEN OF DISEASE AND INJURY, 2000-2016
FIREFIGHTER
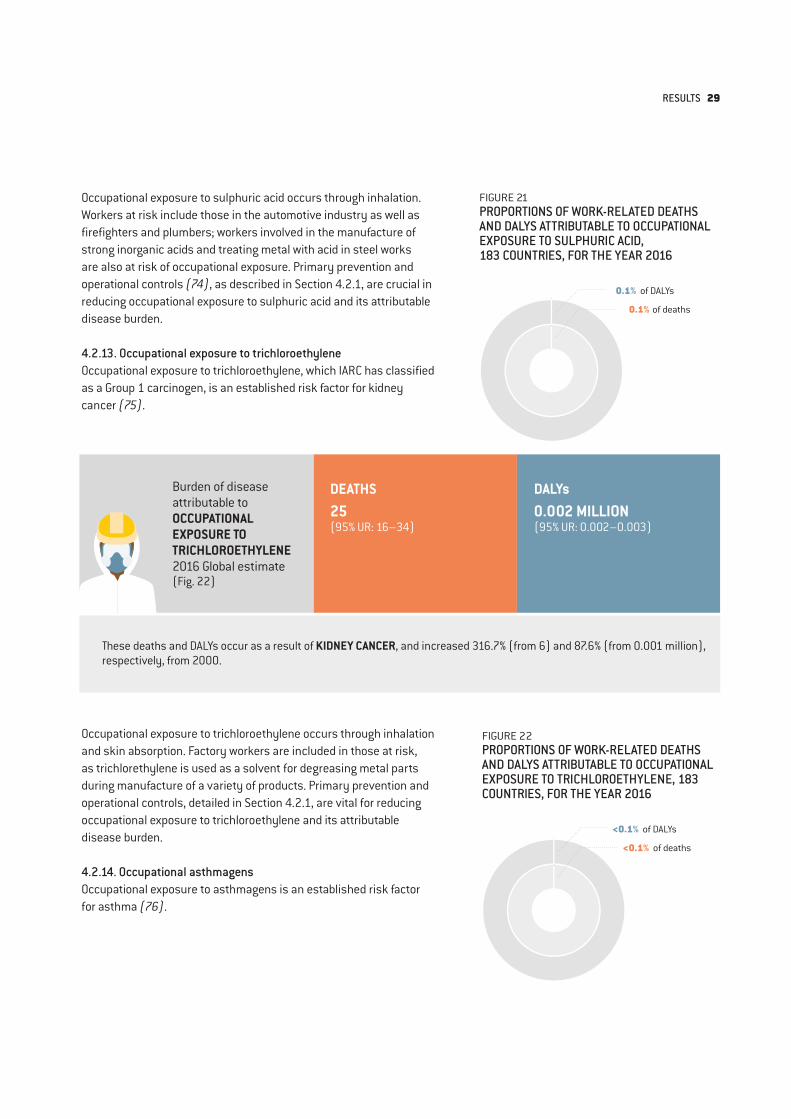
FIGURE 21PROPORTIONS OF WORK-RELATED DEATHS AND DALYS ATTRIBUTABLE TO OCCUPATIONAL EXPOSURE TO SULPHURIC ACID, 183 COUNTRIES, FOR THE YEAR 2016
0.1% of DALYs
0.1% of deaths
Occupational exposure to sulphuric acid occurs through inhalation. Workers at risk include those in the automotive industry as well as firefighters and plumbers; workers involved in the manufacture of strong inorganic acids and treating metal with acid in steel works are also at risk of occupational exposure. Primary prevention and operational controls (74), as described in Section 4.2.1, are crucial in reducing occupational exposure to sulphuric acid and its attributable disease burden.
4.2.13. Occupational exposure to trichloroethylene Occupational exposure to trichloroethylene, which IARC has classified as a Group 1 carcinogen, is an established risk factor for kidney cancer (75).
DEATHS 25(95% UR: 16–34)
DALYs 0.002 MILLION(95% UR: 0.002–0.003)
Occupational exposure to trichloroethylene occurs through inhalation and skin absorption. Factory workers are included in those at risk, as trichlorethylene is used as a solvent for degreasing metal parts during manufacture of a variety of products. Primary prevention and operational controls, detailed in Section 4.2.1, are vital for reducing occupational exposure to trichloroethylene and its attributable disease burden.
4.2.14. Occupational asthmagens Occupational exposure to asthmagens is an established risk factor for asthma (76).
These deaths and DALYs occur as a result of KIDNEY CANCER, and increased 316.7% (from 6) and 87.6% (from 0.001 million),respectively, from 2000.
FIGURE 22PROPORTIONS OF WORK-RELATED DEATHS AND DALYS ATTRIBUTABLE TO OCCUPATIONAL EXPOSURE TO TRICHLOROETHYLENE, 183 COUNTRIES, FOR THE YEAR 2016
<0.1% of DALYs
<0.1% of deaths
Burden of disease attributable toOCCUPATIONAL EXPOSURE TO TRICHLOROETHYLENE2016 Global estimate(Fig. 22)
RESULTS 29
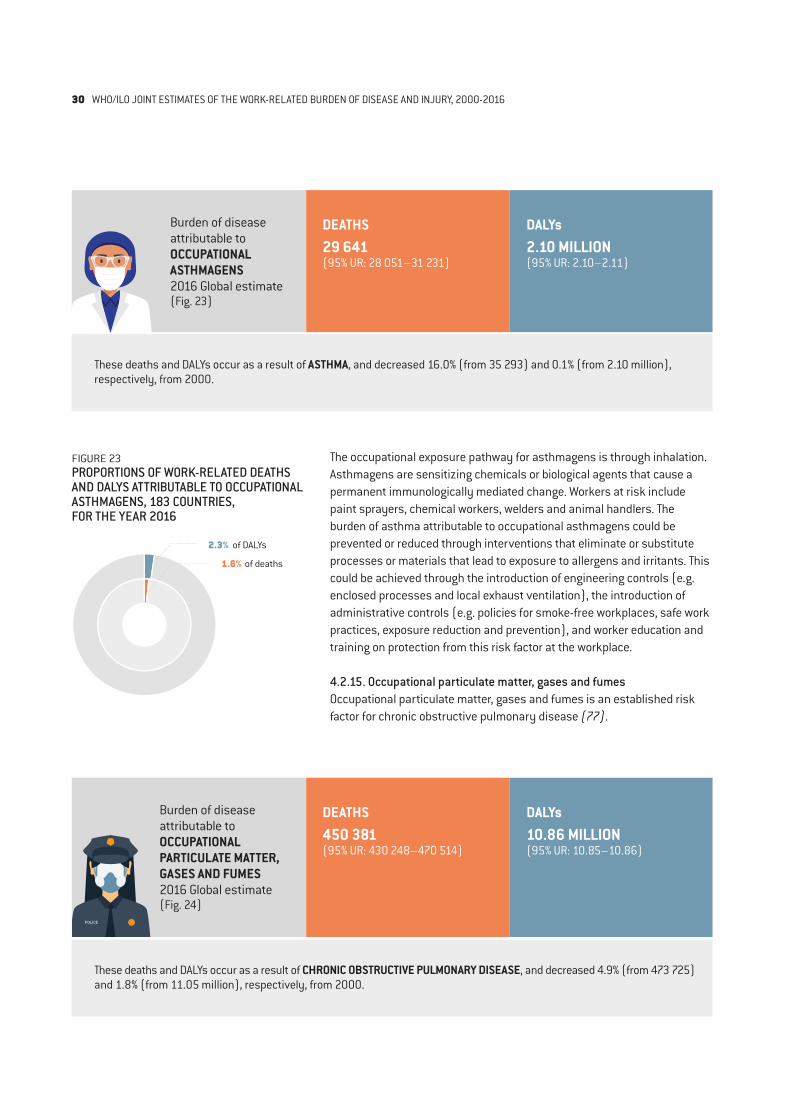
Burden of disease attributable toOCCUPATIONAL PARTICULATE MATTER, GASES AND FUMES2016 Global estimate(Fig. 24)
DEATHS 450 381 (95% UR: 430 248–470 514)
DALYs 10.86 MILLION(95% UR: 10.85–10.86)
FIGURE 23PROPORTIONS OF WORK-RELATED DEATHS AND DALYS ATTRIBUTABLE TO OCCUPATIONAL ASTHMAGENS, 183 COUNTRIES, FOR THE YEAR 2016
2.3% of DALYs
1.6% of deaths
The occupational exposure pathway for asthmagens is through inhalation. Asthmagens are sensitizing chemicals or biological agents that cause a permanent immunologically mediated change. Workers at risk include paint sprayers, chemical workers, welders and animal handlers. The burden of asthma attributable to occupational asthmagens could be prevented or reduced through interventions that eliminate or substitute processes or materials that lead to exposure to allergens and irritants. This could be achieved through the introduction of engineering controls (e.g. enclosed processes and local exhaust ventilation), the introduction of administrative controls (e.g. policies for smoke-free workplaces, safe work practices, exposure reduction and prevention), and worker education and training on protection from this risk factor at the workplace.
4.2.15. Occupational particulate matter, gases and fumes Occupational particulate matter, gases and fumes is an established risk factor for chronic obstructive pulmonary disease (77).
Burden of disease attributable toOCCUPATIONAL ASTHMAGENS2016 Global estimate(Fig. 23)
DEATHS 29 641 (95% UR: 28 051–31 231)
DALYs 2.10 MILLION(95% UR: 2.10–2.11)
These deaths and DALYs occur as a result of ASTHMA, and decreased 16.0% (from 35 293) and 0.1% (from 2.10 million), respectively, from 2000.
These deaths and DALYs occur as a result of CHRONIC OBSTRUCTIVE PULMONARY DISEASE, and decreased 4.9% (from 473 725) and 1.8% (from 11.05 million), respectively, from 2000.
30 WHO/ILO JOINT ESTIMATES OF THE WORK-RELATED BURDEN OF DISEASE AND INJURY, 2000-2016
POLICE
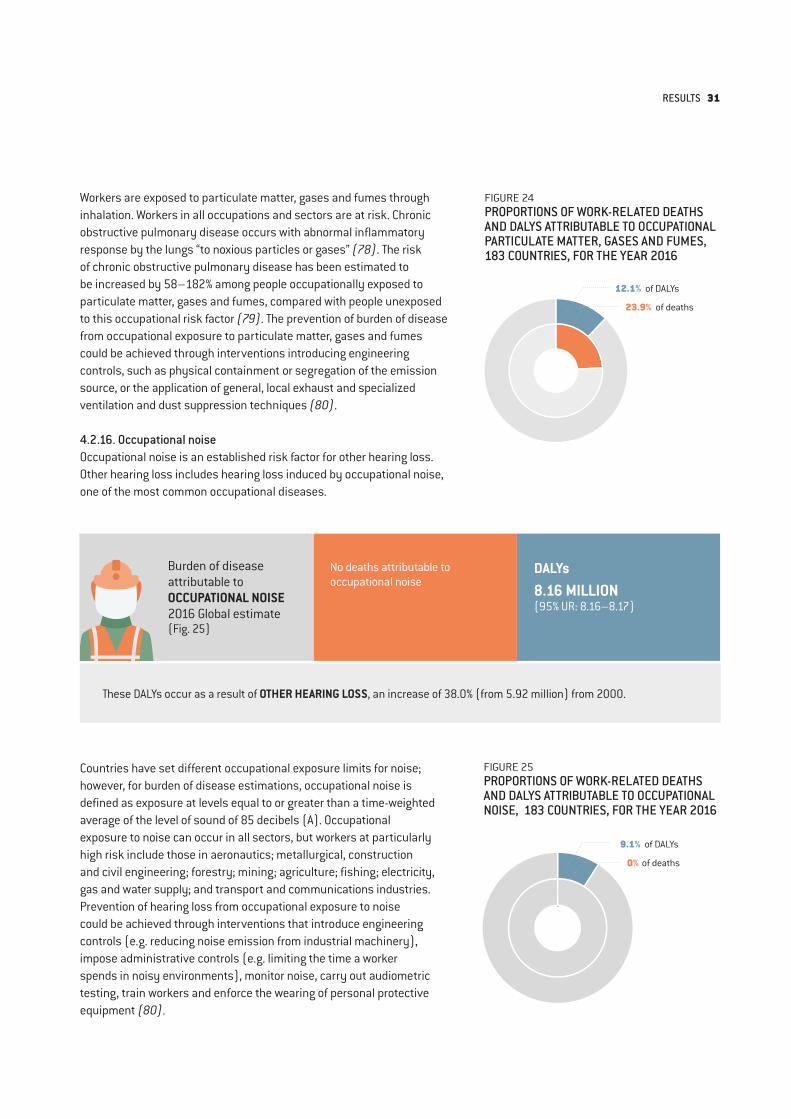
Workers are exposed to particulate matter, gases and fumes through inhalation. Workers in all occupations and sectors are at risk. Chronic obstructive pulmonary disease occurs with abnormal inflammatory response by the lungs “to noxious particles or gases” (78). The risk of chronic obstructive pulmonary disease has been estimated to be increased by 58–182% among people occupationally exposed to particulate matter, gases and fumes, compared with people unexposed to this occupational risk factor (79). The prevention of burden of disease from occupational exposure to particulate matter, gases and fumes could be achieved through interventions introducing engineering controls, such as physical containment or segregation of the emission source, or the application of general, local exhaust and specialized ventilation and dust suppression techniques (80).
4.2.16. Occupational noise Occupational noise is an established risk factor for other hearing loss. Other hearing loss includes hearing loss induced by occupational noise, one of the most common occupational diseases.
Burden of disease attributable toOCCUPATIONAL NOISE2016 Global estimate(Fig. 25)
No deaths attributable to occupational noise
DALYs 8.16 MILLION(95% UR: 8.16–8.17)
Countries have set different occupational exposure limits for noise; however, for burden of disease estimations, occupational noise is defined as exposure at levels equal to or greater than a time-weighted average of the level of sound of 85 decibels (A). Occupational exposure to noise can occur in all sectors, but workers at particularly high risk include those in aeronautics; metallurgical, construction and civil engineering; forestry; mining; agriculture; fishing; electricity, gas and water supply; and transport and communications industries. Prevention of hearing loss from occupational exposure to noise could be achieved through interventions that introduce engineering controls (e.g. reducing noise emission from industrial machinery), impose administrative controls (e.g. limiting the time a worker spends in noisy environments), monitor noise, carry out audiometric testing, train workers and enforce the wearing of personal protective equipment (80).
FIGURE 25PROPORTIONS OF WORK-RELATED DEATHS AND DALYS ATTRIBUTABLE TO OCCUPATIONAL NOISE, 183 COUNTRIES, FOR THE YEAR 2016
9.1% of DALYs
0% of deaths
FIGURE 24PROPORTIONS OF WORK-RELATED DEATHS AND DALYS ATTRIBUTABLE TO OCCUPATIONAL PARTICULATE MATTER, GASES AND FUMES, 183 COUNTRIES, FOR THE YEAR 2016
12.1% of DALYs
23.9% of deaths
These DALYs occur as a result of OTHER HEARING LOSS, an increase of 38.0% (from 5.92 million) from 2000.
RESULTS 31
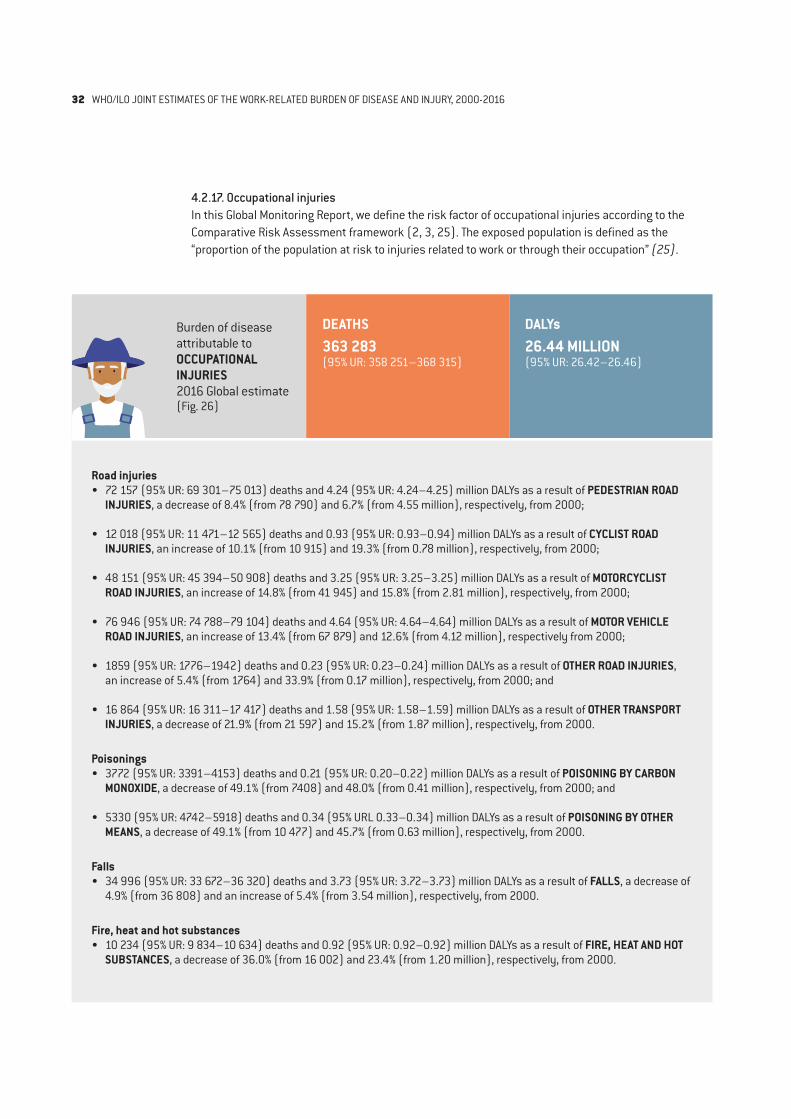
4.2.17. Occupational injuries In this Global Monitoring Report, we define the risk factor of occupational injuries according to the Comparative Risk Assessment framework (2, 3, 25). The exposed population is defined as the “proportion of the population at risk to injuries related to work or through their occupation” (25).
Burden of disease attributable toOCCUPATIONAL INJURIES2016 Global estimate(Fig. 26)
DEATHS 363 283 (95% UR: 358 251–368 315)
DALYs 26.44 MILLION(95% UR: 26.42–26.46)
Road injuries• 72 157 (95% UR: 69 301–75 013) deaths and 4.24 (95% UR: 4.24–4.25) million DALYs as a result of PEDESTRIAN ROAD
INJURIES, a decrease of 8.4% (from 78 790) and 6.7% (from 4.55 million), respectively, from 2000;
• 12 018 (95% UR: 11 471–12 565) deaths and 0.93 (95% UR: 0.93–0.94) million DALYs as a result of CYCLIST ROAD INJURIES, an increase of 10.1% (from 10 915) and 19.3% (from 0.78 million), respectively, from 2000;
• 48 151 (95% UR: 45 394–50 908) deaths and 3.25 (95% UR: 3.25–3.25) million DALYs as a result of MOTORCYCLIST ROAD INJURIES, an increase of 14.8% (from 41 945) and 15.8% (from 2.81 million), respectively, from 2000;
• 76 946 (95% UR: 74 788–79 104) deaths and 4.64 (95% UR: 4.64–4.64) million DALYs as a result of MOTOR VEHICLE ROAD INJURIES, an increase of 13.4% (from 67 879) and 12.6% (from 4.12 million), respectively from 2000;
• 1859 (95% UR: 1776–1942) deaths and 0.23 (95% UR: 0.23–0.24) million DALYs as a result of OTHER ROAD INJURIES, an increase of 5.4% (from 1764) and 33.9% (from 0.17 million), respectively, from 2000; and
• 16 864 (95% UR: 16 311–17 417) deaths and 1.58 (95% UR: 1.58–1.59) million DALYs as a result of OTHER TRANSPORT INJURIES, a decrease of 21.9% (from 21 597) and 15.2% (from 1.87 million), respectively, from 2000.
Poisonings• 3772 (95% UR: 3391–4153) deaths and 0.21 (95% UR: 0.20–0.22) million DALYs as a result of POISONING BY CARBON
MONOXIDE, a decrease of 49.1% (from 7408) and 48.0% (from 0.41 million), respectively, from 2000; and
• 5330 (95% UR: 4742–5918) deaths and 0.34 (95% URL 0.33–0.34) million DALYs as a result of POISONING BY OTHER MEANS, a decrease of 49.1% (from 10 477) and 45.7% (from 0.63 million), respectively, from 2000.
Falls• 34 996 (95% UR: 33 672–36 320) deaths and 3.73 (95% UR: 3.72–3.73) million DALYs as a result of FALLS, a decrease of
4.9% (from 36 808) and an increase of 5.4% (from 3.54 million), respectively, from 2000.
Fire, heat and hot substances• 10 234 (95% UR: 9 834–10 634) deaths and 0.92 (95% UR: 0.92–0.92) million DALYs as a result of FIRE, HEAT AND HOT
SUBSTANCES, a decrease of 36.0% (from 16 002) and 23.4% (from 1.20 million), respectively, from 2000.
32 WHO/ILO JOINT ESTIMATES OF THE WORK-RELATED BURDEN OF DISEASE AND INJURY, 2000-2016
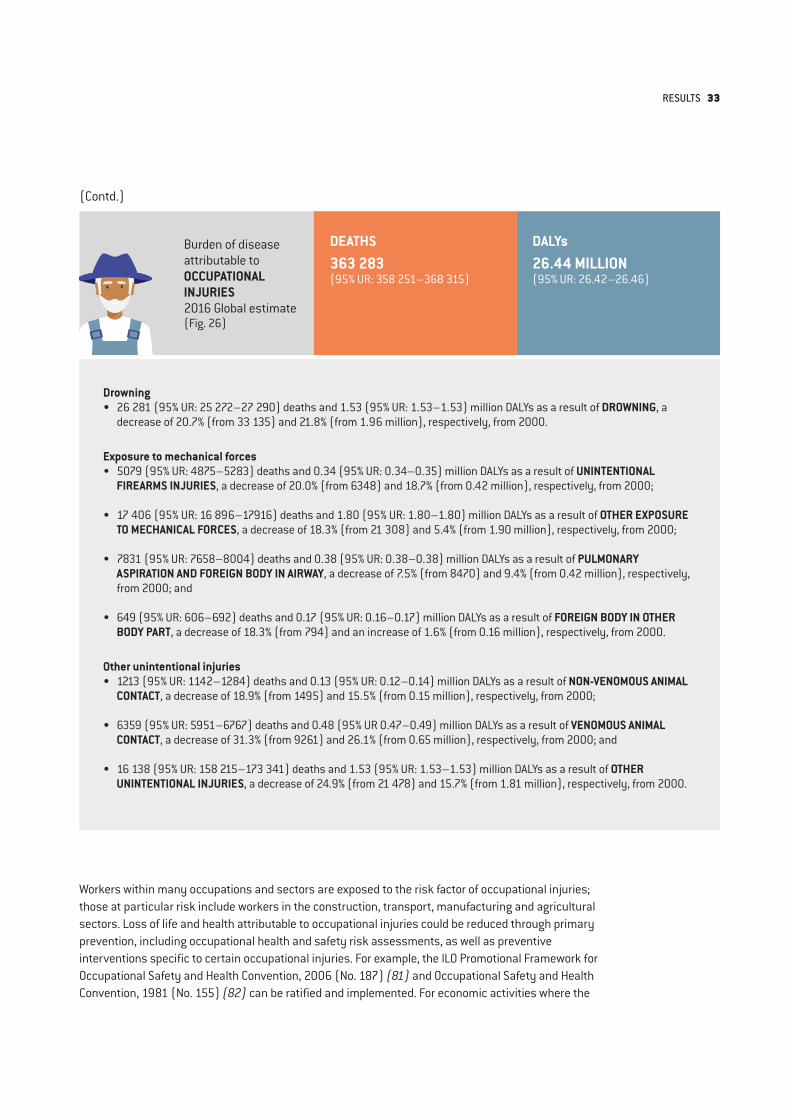
Burden of disease attributable toOCCUPATIONAL INJURIES2016 Global estimate(Fig. 26)
DEATHS 363 283 (95% UR: 358 251–368 315)
DALYs 26.44 MILLION(95% UR: 26.42–26.46)
Drowning• 26 281 (95% UR: 25 272–27 290) deaths and 1.53 (95% UR: 1.53–1.53) million DALYs as a result of DROWNING, a
decrease of 20.7% (from 33 135) and 21.8% (from 1.96 million), respectively, from 2000.
Exposure to mechanical forces• 5079 (95% UR: 4875–5283) deaths and 0.34 (95% UR: 0.34–0.35) million DALYs as a result of UNINTENTIONAL
FIREARMS INJURIES, a decrease of 20.0% (from 6348) and 18.7% (from 0.42 million), respectively, from 2000;
• 17 406 (95% UR: 16 896–17916) deaths and 1.80 (95% UR: 1.80–1.80) million DALYs as a result of OTHER EXPOSURE TO MECHANICAL FORCES, a decrease of 18.3% (from 21 308) and 5.4% (from 1.90 million), respectively, from 2000;
• 7831 (95% UR: 7658–8004) deaths and 0.38 (95% UR: 0.38–0.38) million DALYs as a result of PULMONARY ASPIRATION AND FOREIGN BODY IN AIRWAY, a decrease of 7.5% (from 8470) and 9.4% (from 0.42 million), respectively, from 2000; and
• 649 (95% UR: 606–692) deaths and 0.17 (95% UR: 0.16–0.17) million DALYs as a result of FOREIGN BODY IN OTHER BODY PART, a decrease of 18.3% (from 794) and an increase of 1.6% (from 0.16 million), respectively, from 2000.
Other unintentional injuries• 1213 (95% UR: 1142–1284) deaths and 0.13 (95% UR: 0.12–0.14) million DALYs as a result of NON-VENOMOUS ANIMAL
CONTACT, a decrease of 18.9% (from 1495) and 15.5% (from 0.15 million), respectively, from 2000;
• 6359 (95% UR: 5951–6767) deaths and 0.48 (95% UR 0.47–0.49) million DALYs as a result of VENOMOUS ANIMAL CONTACT, a decrease of 31.3% (from 9261) and 26.1% (from 0.65 million), respectively, from 2000; and
• 16 138 (95% UR: 158 215–173 341) deaths and 1.53 (95% UR: 1.53–1.53) million DALYs as a result of OTHER UNINTENTIONAL INJURIES, a decrease of 24.9% (from 21 478) and 15.7% (from 1.81 million), respectively, from 2000.
(Contd.)
Workers within many occupations and sectors are exposed to the risk factor of occupational injuries; those at particular risk include workers in the construction, transport, manufacturing and agricultural sectors. Loss of life and health attributable to occupational injuries could be reduced through primary prevention, including occupational health and safety risk assessments, as well as preventive interventions specific to certain occupational injuries. For example, the ILO Promotional Framework for Occupational Safety and Health Convention, 2006 (No. 187) (81) and Occupational Safety and Health Convention, 1981 (No. 155) (82) can be ratified and implemented. For economic activities where the
RESULTS 33
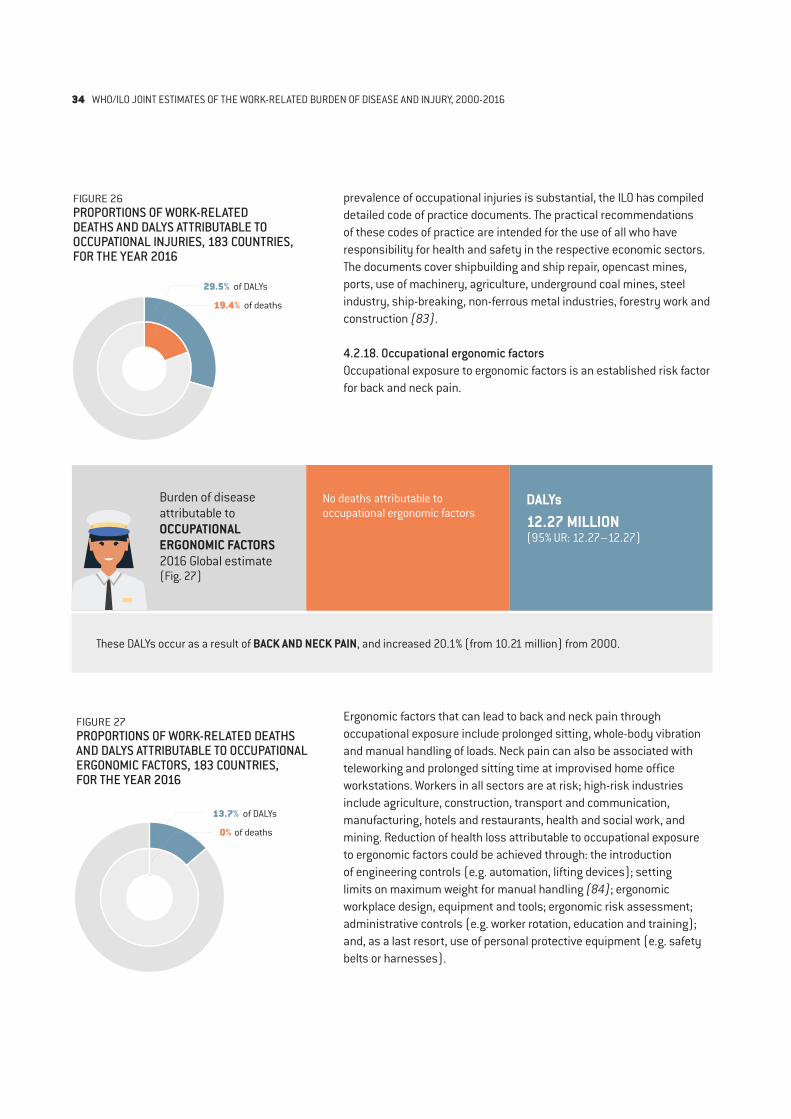
Burden of disease attributable toOCCUPATIONAL ERGONOMIC FACTORS2016 Global estimate(Fig. 27)
No deaths attributable to occupational ergonomic factors
DALYs 12.27 MILLION(95% UR: 12.27–12.27)
FIGURE 27PROPORTIONS OF WORK-RELATED DEATHS AND DALYS ATTRIBUTABLE TO OCCUPATIONAL ERGONOMIC FACTORS, 183 COUNTRIES, FOR THE YEAR 2016
13.7% of DALYs
0% of deaths
Ergonomic factors that can lead to back and neck pain through occupational exposure include prolonged sitting, whole-body vibration and manual handling of loads. Neck pain can also be associated with teleworking and prolonged sitting time at improvised home office workstations. Workers in all sectors are at risk; high-risk industries include agriculture, construction, transport and communication, manufacturing, hotels and restaurants, health and social work, and mining. Reduction of health loss attributable to occupational exposure to ergonomic factors could be achieved through: the introduction of engineering controls (e.g. automation, lifting devices); setting limits on maximum weight for manual handling (84); ergonomic workplace design, equipment and tools; ergonomic risk assessment; administrative controls (e.g. worker rotation, education and training); and, as a last resort, use of personal protective equipment (e.g. safety belts or harnesses).
prevalence of occupational injuries is substantial, the ILO has compiled detailed code of practice documents. The practical recommendations of these codes of practice are intended for the use of all who have responsibility for health and safety in the respective economic sectors. The documents cover shipbuilding and ship repair, opencast mines, ports, use of machinery, agriculture, underground coal mines, steel industry, ship-breaking, non-ferrous metal industries, forestry work and construction (83).
4.2.18. Occupational ergonomic factors Occupational exposure to ergonomic factors is an established risk factor for back and neck pain.
FIGURE 26PROPORTIONS OF WORK-RELATED DEATHS AND DALYS ATTRIBUTABLE TO OCCUPATIONAL INJURIES, 183 COUNTRIES, FOR THE YEAR 2016
29.5% of DALYs
19.4% of deaths
These DALYs occur as a result of BACK AND NECK PAIN, and increased 20.1% (from 10.21 million) from 2000.
34 WHO/ILO JOINT ESTIMATES OF THE WORK-RELATED BURDEN OF DISEASE AND INJURY, 2000-2016
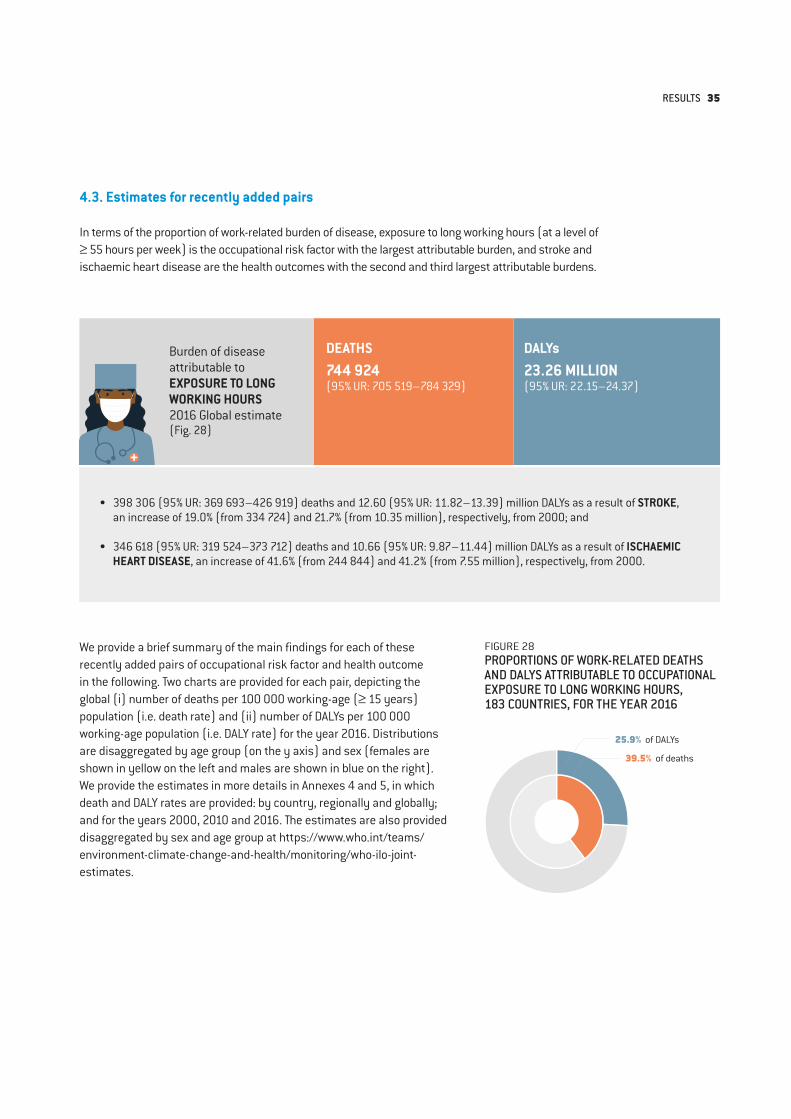
4.3. Estimates for recently added pairs
In terms of the proportion of work-related burden of disease, exposure to long working hours (at a level of ≥ 55 hours per week) is the occupational risk factor with the largest attributable burden, and stroke and ischaemic heart disease are the health outcomes with the second and third largest attributable burdens.
Burden of disease attributable toEXPOSURE TO LONG WORKING HOURS2016 Global estimate(Fig. 28)
DEATHS 744 924 (95% UR: 705 519–784 329)
DALYs 23.26 MILLION(95% UR: 22.15–24.37)
• 398 306 (95% UR: 369 693–426 919) deaths and 12.60 (95% UR: 11.82–13.39) million DALYs as a result of STROKE, an increase of 19.0% (from 334 724) and 21.7% (from 10.35 million), respectively, from 2000; and
• 346 618 (95% UR: 319 524–373 712) deaths and 10.66 (95% UR: 9.87–11.44) million DALYs as a result of ISCHAEMIC HEART DISEASE, an increase of 41.6% (from 244 844) and 41.2% (from 7.55 million), respectively, from 2000.
We provide a brief summary of the main findings for each of these recently added pairs of occupational risk factor and health outcome in the following. Two charts are provided for each pair, depicting the global (i) number of deaths per 100 000 working-age (≥ 15 years) population (i.e. death rate) and (ii) number of DALYs per 100 000 working-age population (i.e. DALY rate) for the year 2016. Distributions are disaggregated by age group (on the y axis) and sex (females are shown in yellow on the left and males are shown in blue on the right). We provide the estimates in more details in Annexes 4 and 5, in which death and DALY rates are provided: by country, regionally and globally; and for the years 2000, 2010 and 2016. The estimates are also provided disaggregated by sex and age group at https://www.who.int/teams/environment-climate-change-and-health/monitoring/who-ilo-joint-estimates.
FIGURE 28PROPORTIONS OF WORK-RELATED DEATHS AND DALYS ATTRIBUTABLE TO OCCUPATIONAL EXPOSURE TO LONG WORKING HOURS, 183 COUNTRIES, FOR THE YEAR 2016
25.9% of DALYs
39.5% of deaths
RESULTS 35
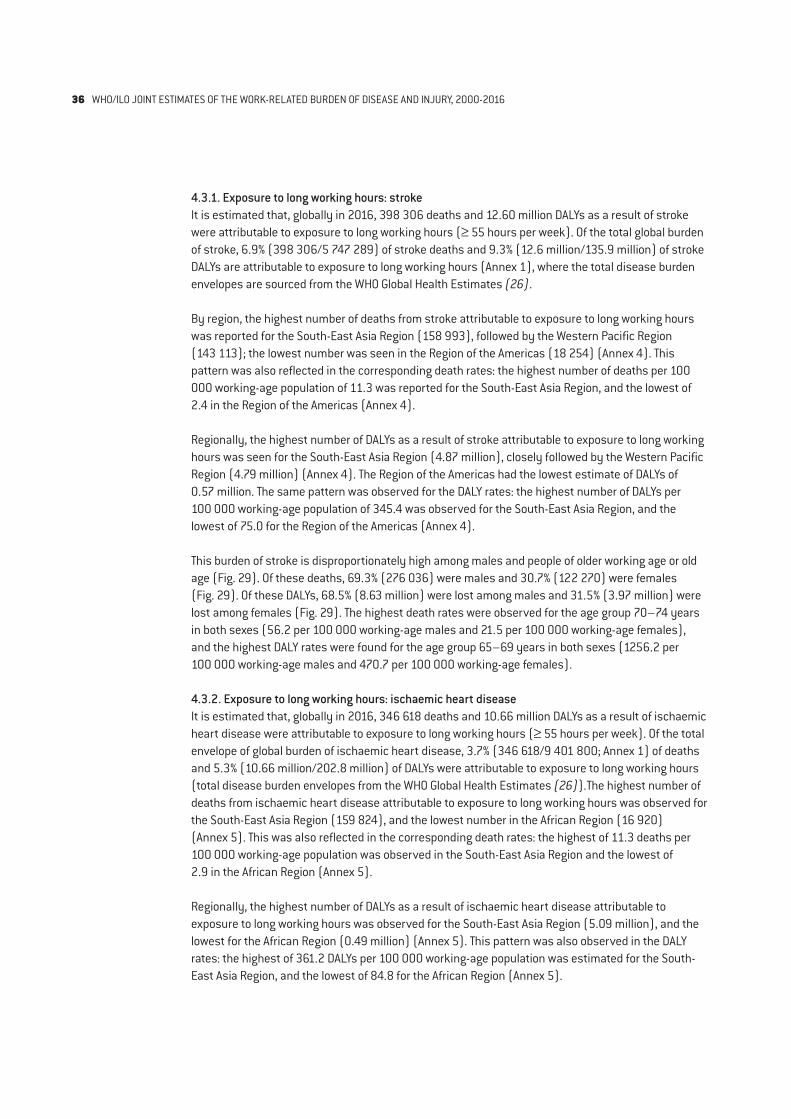
4.3.1. Exposure to long working hours: strokeIt is estimated that, globally in 2016, 398 306 deaths and 12.60 million DALYs as a result of stroke were attributable to exposure to long working hours (≥ 55 hours per week). Of the total global burden of stroke, 6.9% (398 306/5 747 289) of stroke deaths and 9.3% (12.6 million/135.9 million) of stroke DALYs are attributable to exposure to long working hours (Annex 1), where the total disease burden envelopes are sourced from the WHO Global Health Estimates (26).
By region, the highest number of deaths from stroke attributable to exposure to long working hours was reported for the South-East Asia Region (158 993), followed by the Western Pacific Region (143 113); the lowest number was seen in the Region of the Americas (18 254) (Annex 4). This pattern was also reflected in the corresponding death rates: the highest number of deaths per 100 000 working-age population of 11.3 was reported for the South-East Asia Region, and the lowest of 2.4 in the Region of the Americas (Annex 4).
Regionally, the highest number of DALYs as a result of stroke attributable to exposure to long working hours was seen for the South-East Asia Region (4.87 million), closely followed by the Western Pacific Region (4.79 million) (Annex 4). The Region of the Americas had the lowest estimate of DALYs of 0.57 million. The same pattern was observed for the DALY rates: the highest number of DALYs per 100 000 working-age population of 345.4 was observed for the South-East Asia Region, and the lowest of 75.0 for the Region of the Americas (Annex 4).
This burden of stroke is disproportionately high among males and people of older working age or old age (Fig. 29). Of these deaths, 69.3% (276 036) were males and 30.7% (122 270) were females (Fig. 29). Of these DALYs, 68.5% (8.63 million) were lost among males and 31.5% (3.97 million) were lost among females (Fig. 29). The highest death rates were observed for the age group 70–74 years in both sexes (56.2 per 100 000 working-age males and 21.5 per 100 000 working-age females), and the highest DALY rates were found for the age group 65–69 years in both sexes (1256.2 per 100 000 working-age males and 470.7 per 100 000 working-age females).
4.3.2. Exposure to long working hours: ischaemic heart diseaseIt is estimated that, globally in 2016, 346 618 deaths and 10.66 million DALYs as a result of ischaemic heart disease were attributable to exposure to long working hours (≥ 55 hours per week). Of the total envelope of global burden of ischaemic heart disease, 3.7% (346 618/9 401 800; Annex 1) of deaths and 5.3% (10.66 million/202.8 million) of DALYs were attributable to exposure to long working hours (total disease burden envelopes from the WHO Global Health Estimates (26)).The highest number of deaths from ischaemic heart disease attributable to exposure to long working hours was observed for the South-East Asia Region (159 824), and the lowest number in the African Region (16 920) (Annex 5). This was also reflected in the corresponding death rates: the highest of 11.3 deaths per 100 000 working-age population was observed in the South-East Asia Region and the lowest of 2.9 in the African Region (Annex 5).
Regionally, the highest number of DALYs as a result of ischaemic heart disease attributable to exposure to long working hours was observed for the South-East Asia Region (5.09 million), and the lowest for the African Region (0.49 million) (Annex 5). This pattern was also observed in the DALY rates: the highest of 361.2 DALYs per 100 000 working-age population was estimated for the South-East Asia Region, and the lowest of 84.8 for the African Region (Annex 5).
36 WHO/ILO JOINT ESTIMATES OF THE WORK-RELATED BURDEN OF DISEASE AND INJURY, 2000-2016
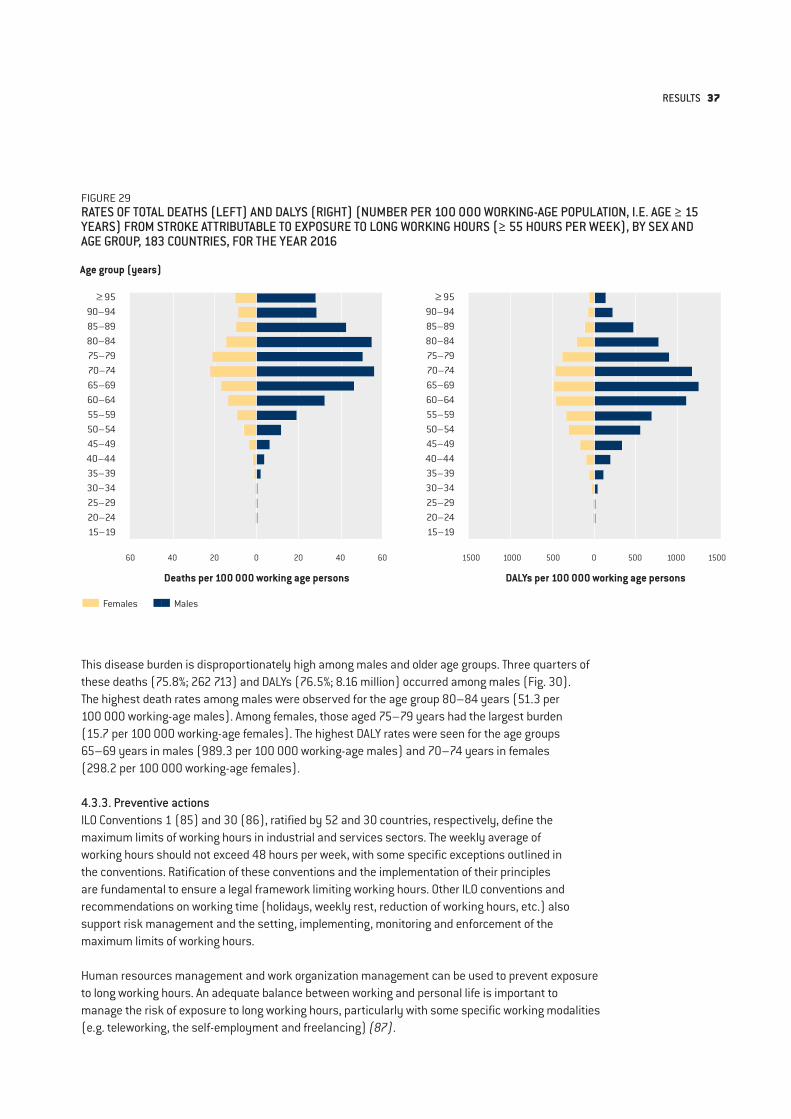
FIGURE 29RATES OF TOTAL DEATHS (LEFT) AND DALYS (RIGHT) (NUMBER PER 100 000 WORKING-AGE POPULATION, I.E. AGE ≥ 15 YEARS) FROM STROKE ATTRIBUTABLE TO EXPOSURE TO LONG WORKING HOURS (≥ 55 HOURS PER WEEK), BY SEX AND AGE GROUP, 183 COUNTRIES, FOR THE YEAR 2016
Age group (years)
Deaths per 100 000 working age persons DALYs per 100 000 working age persons
≥ 9590–9485–8980–8475–7970–7465–6960–6455–5950–5445–4940–4435–3930–3425–2920–2415–19
≥ 9590–9485–8980–8475–7970–7465–6960–6455–5950–5445–4940–4435–3930–3425–2920–2415–19
60 40 20 0 20 40 60 1500 1000 500 0 500 1000 1500
Males Females
This disease burden is disproportionately high among males and older age groups. Three quarters of these deaths (75.8%; 262 713) and DALYs (76.5%; 8.16 million) occurred among males (Fig. 30). The highest death rates among males were observed for the age group 80–84 years (51.3 per 100 000 working-age males). Among females, those aged 75–79 years had the largest burden (15.7 per 100 000 working-age females). The highest DALY rates were seen for the age groups 65–69 years in males (989.3 per 100 000 working-age males) and 70–74 years in females (298.2 per 100 000 working-age females).
4.3.3. Preventive actionsILO Conventions 1 (85) and 30 (86), ratified by 52 and 30 countries, respectively, define the maximum limits of working hours in industrial and services sectors. The weekly average of working hours should not exceed 48 hours per week, with some specific exceptions outlined in the conventions. Ratification of these conventions and the implementation of their principles are fundamental to ensure a legal framework limiting working hours. Other ILO conventions and recommendations on working time (holidays, weekly rest, reduction of working hours, etc.) also support risk management and the setting, implementing, monitoring and enforcement of the maximum limits of working hours.
Human resources management and work organization management can be used to prevent exposure to long working hours. An adequate balance between working and personal life is important to manage the risk of exposure to long working hours, particularly with some specific working modalities (e.g. teleworking, the self-employment and freelancing) (87).
RESULTS 37
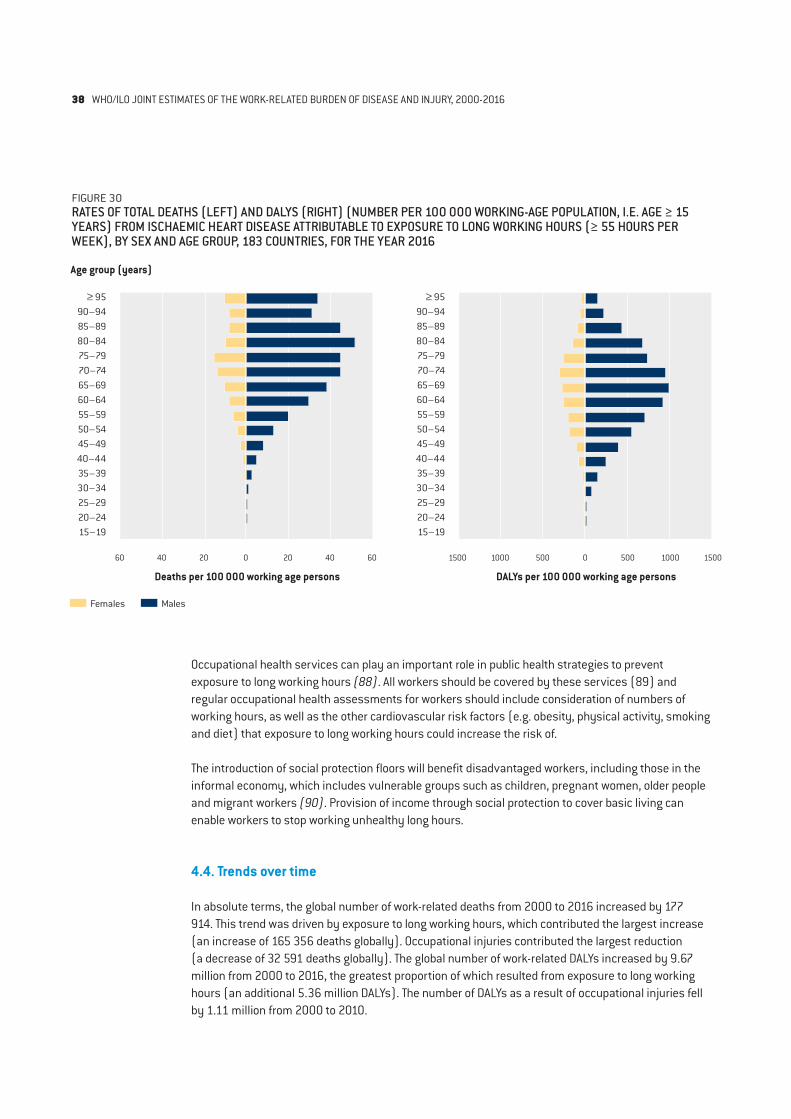
FIGURE 30RATES OF TOTAL DEATHS (LEFT) AND DALYS (RIGHT) (NUMBER PER 100 000 WORKING-AGE POPULATION, I.E. AGE ≥ 15 YEARS) FROM ISCHAEMIC HEART DISEASE ATTRIBUTABLE TO EXPOSURE TO LONG WORKING HOURS (≥ 55 HOURS PER WEEK), BY SEX AND AGE GROUP, 183 COUNTRIES, FOR THE YEAR 2016
Age group (years)
Deaths per 100 000 working age persons DALYs per 100 000 working age persons
≥ 9590–9485–8980–8475–7970–7465–6960–6455–5950–5445–4940–4435–3930–3425–2920–2415–19
≥ 9590–9485–8980–8475–7970–7465–6960–6455–5950–5445–4940–4435–3930–3425–2920–2415–19
60 40 20 0 20 40 60 1500 1000 500 0 500 1000 1500
Occupational health services can play an important role in public health strategies to prevent exposure to long working hours (88). All workers should be covered by these services (89) and regular occupational health assessments for workers should include consideration of numbers of working hours, as well as the other cardiovascular risk factors (e.g. obesity, physical activity, smoking and diet) that exposure to long working hours could increase the risk of.
The introduction of social protection floors will benefit disadvantaged workers, including those in the informal economy, which includes vulnerable groups such as children, pregnant women, older people and migrant workers (90). Provision of income through social protection to cover basic living can enable workers to stop working unhealthy long hours.
4.4. Trends over time
In absolute terms, the global number of work-related deaths from 2000 to 2016 increased by 177 914. This trend was driven by exposure to long working hours, which contributed the largest increase (an increase of 165 356 deaths globally). Occupational injuries contributed the largest reduction (a decrease of 32 591 deaths globally). The global number of work-related DALYs increased by 9.67 million from 2000 to 2016, the greatest proportion of which resulted from exposure to long working hours (an additional 5.36 million DALYs). The number of DALYs as a result of occupational injuries fell by 1.11 million from 2000 to 2010.
Males Females
38 WHO/ILO JOINT ESTIMATES OF THE WORK-RELATED BURDEN OF DISEASE AND INJURY, 2000-2016
However, in terms of rates, between 2000 and 2016 the global rates of total deaths attributable to exposure to occupational risk factors decreased from 39.9 to 34.3 deaths per 100 000 working-age population; this was a decrease of 5.7 deaths per 100 000 working-age population or by 14.2%. Similarly, the global rates of total DALYs attributable to exposure to occupational risk factors decreased from 1878.4 to 1635.9 DALYs per 100 000 working-age population; this was a decrease of 242.5 DALYs per 100 000 working-age population or 12.9%. This shows a substantial reduction in the total work-related burden of disease per head of population over the 16-year period.
The changes (in absolute and relative terms) over the period in terms of pairs of occupational risk factor and health outcome are provided in Sections 4.2 and 4.3 and are derivable from the data in Annex 2. For working-age population death rates, the largest relative increase in rates of 223.8% was seen for occupational exposure to trichloroethylene and kidney cancer (although this was only an absolute increase of 0.0003 deaths per 100 000 working-age population, or only 19 deaths globally). The greatest relative decrease in rates was observed from poisoning by other means attributable to occupational injuries, which fell by 60.5% from 2000 to 2016.
In terms of DALYs, the largest relative increase (by 45.8%) in working-age population rates between 2000 and 2016 was observed for occupational exposure to trichloroethylene and kidney cancer (although only an absolute increase of 0.01 DALYs per 100 000 working-age population). The largest relative decrease was observed in DALYs lost from poisoning by carbon monoxide attributable to occupational injuries, which fell by 59.6%.
4.5. Inequalities in work-related burden of disease
To improve workers’ health equity between and within countries, health inequalities must be monitored. The WHO/ILO Joint Estimates are produced disaggregated by region, allowing monitoring of regional inequalities to address between-region differences (Annex 3). They are also produced disaggregated by sex and age group, allowing monitoring of inequalities in workers’ health by these two variables.
4.5.1 By geographic regionIn absolute terms, the WHO South-East Asia Region and the Western Pacific Region had death rates higher than the global rate, whereas the WHO African Region, Region of the Americas, European Region and the Eastern Mediterranean Region had death rates lower than the global rate. These absolute differences in the rates by WHO region, compared with the global rate, ranged from 10.7 deaths per 100 000 working-age population in South-East Asia to –12.0 deaths per 100 000 working-age population in the Americas (Fig. 31). The relative inequalities (as measured with the ratios of regional rates to the global rate) were highest for South-East Asia (1.3) and lowest for the Americas (0.7; Fig. 31).
For DALYs, in absolute terms, the WHO African Region, South-East Asia Region and Western Pacific Region had DALY rates higher than the global rate (Fig. 32), whereas the WHO Region of the Americas, the European Region and the Eastern Mediterranean Region had rates lower than the global rate. These rate differences by WHO region ranged from 463.3 DALYs per 100 000 working-age population in South-East Asia to –564.1 DALYs per 100 000 working-age population in the Americas (Fig. 32). The rate ratios varied from 1.3 for South-East Asia to 0.7 for the Americas.
RESULTS 39
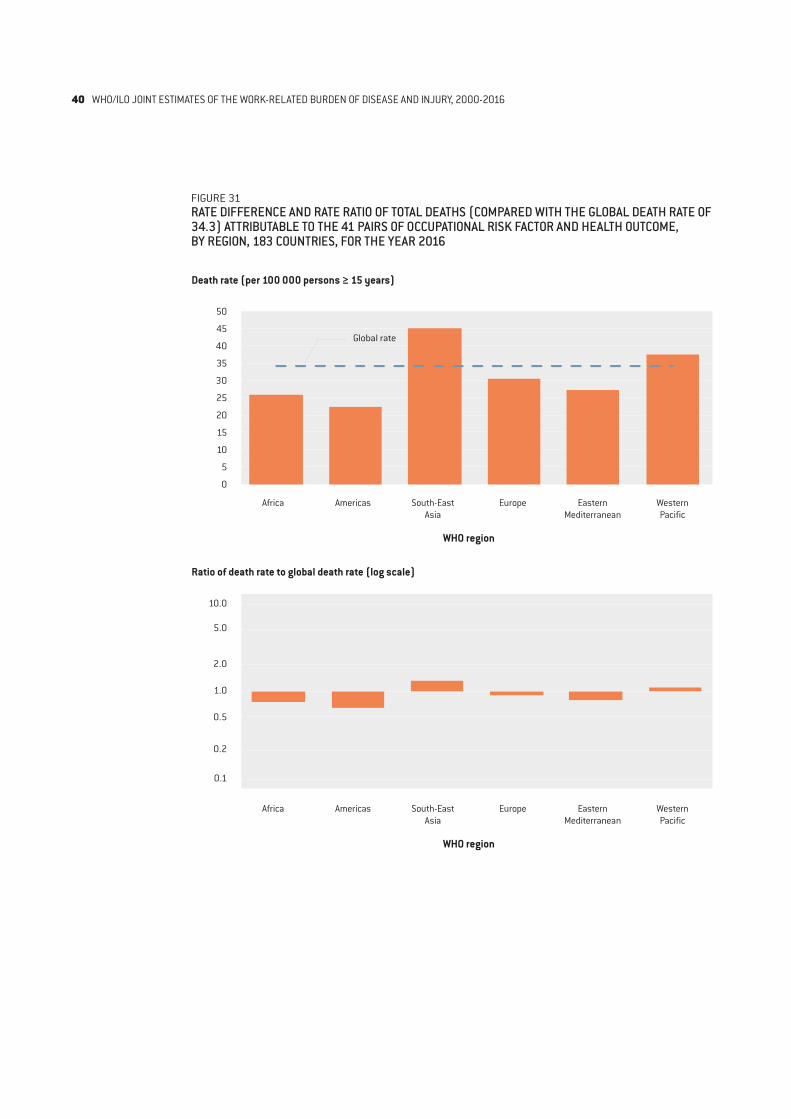
FIGURE 31RATE DIFFERENCE AND RATE RATIO OF TOTAL DEATHS (COMPARED WITH THE GLOBAL DEATH RATE OF 34.3) ATTRIBUTABLE TO THE 41 PAIRS OF OCCUPATIONAL RISK FACTOR AND HEALTH OUTCOME, BY REGION, 183 COUNTRIES, FOR THE YEAR 2016
Death rate (per 100 000 persons ≥ 15 years)
Ratio of death rate to global death rate (log scale)
WHO region
WHO region
50
45
40
35
30
25
20
15
10
5
0
10.0
5.0
2.0
1.0
0.5
0.2
0.1
Africa Americas South-East Asia
Europe Eastern Mediterranean
Western Pacific
Africa Americas South-East Asia
Europe Eastern Mediterranean
Western Pacific
Global rate
40 WHO/ILO JOINT ESTIMATES OF THE WORK-RELATED BURDEN OF DISEASE AND INJURY, 2000-2016
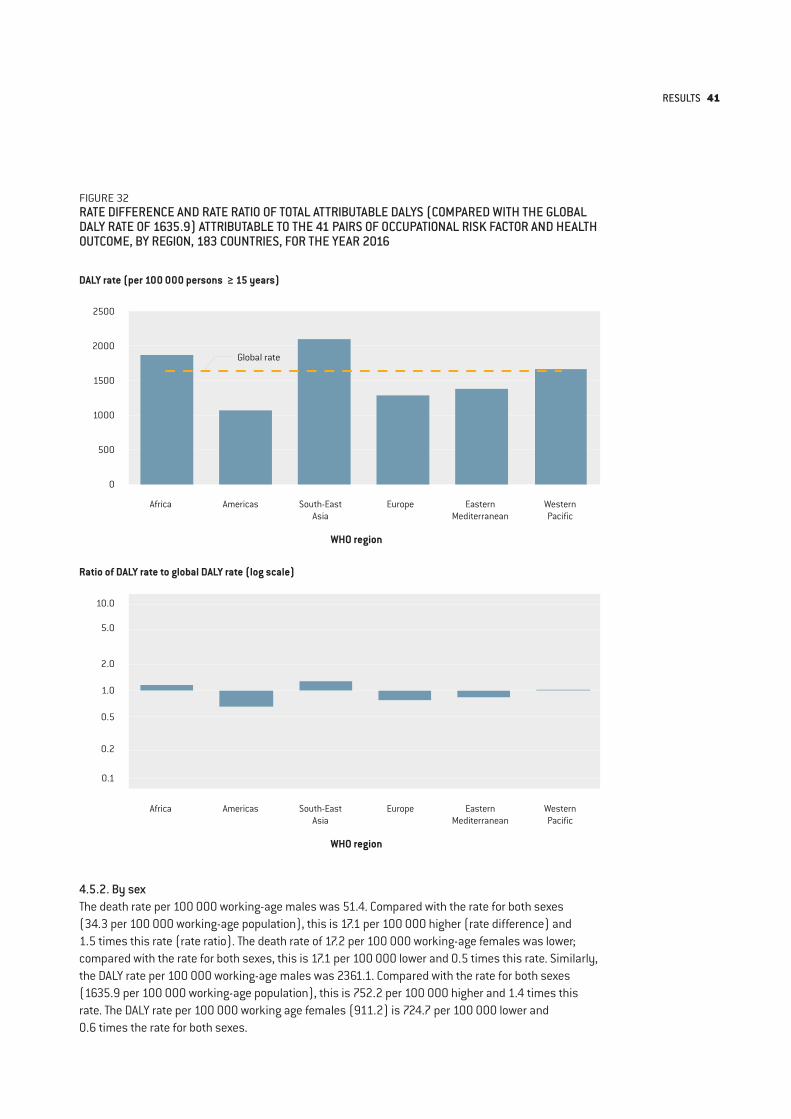
FIGURE 32RATE DIFFERENCE AND RATE RATIO OF TOTAL ATTRIBUTABLE DALYS (COMPARED WITH THE GLOBAL DALY RATE OF 1635.9) ATTRIBUTABLE TO THE 41 PAIRS OF OCCUPATIONAL RISK FACTOR AND HEALTH OUTCOME, BY REGION, 183 COUNTRIES, FOR THE YEAR 2016
DALY rate (per 100 000 persons ≥ 15 years)
Ratio of DALY rate to global DALY rate (log scale)
WHO region
WHO region
2500
2000
1500
1000
500
0
10.0
5.0
2.0
1.0
0.5
0.2
0.1
Africa Americas South-East Asia
Europe Eastern Mediterranean
Western Pacific
Africa Americas South-East Asia
Europe Eastern Mediterranean
Western Pacific
Global rate
4.5.2. By sexThe death rate per 100 000 working-age males was 51.4. Compared with the rate for both sexes (34.3 per 100 000 working-age population), this is 17.1 per 100 000 higher (rate difference) and 1.5 times this rate (rate ratio). The death rate of 17.2 per 100 000 working-age females was lower; compared with the rate for both sexes, this is 17.1 per 100 000 lower and 0.5 times this rate. Similarly, the DALY rate per 100 000 working-age males was 2361.1. Compared with the rate for both sexes (1635.9 per 100 000 working-age population), this is 752.2 per 100 000 higher and 1.4 times this rate. The DALY rate per 100 000 working age females (911.2) is 724.7 per 100 000 lower and 0.6 times the rate for both sexes.
RESULTS 41
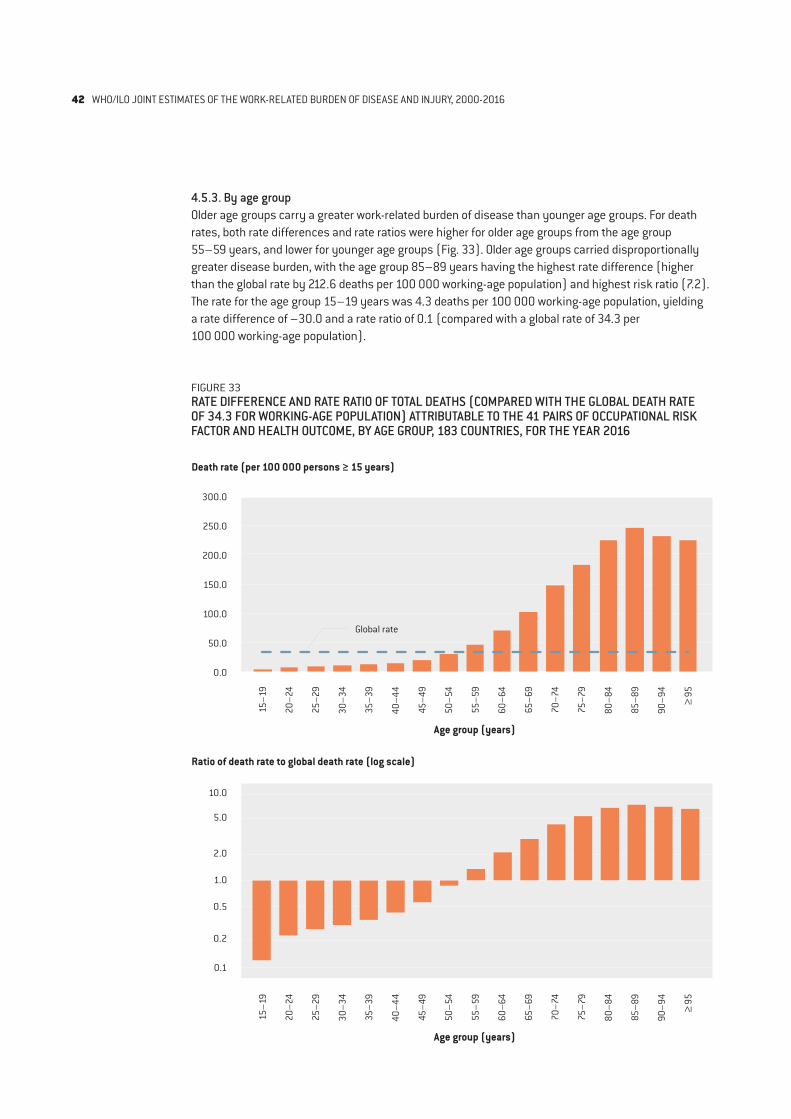
4.5.3. By age groupOlder age groups carry a greater work-related burden of disease than younger age groups. For death rates, both rate differences and rate ratios were higher for older age groups from the age group 55–59 years, and lower for younger age groups (Fig. 33). Older age groups carried disproportionally greater disease burden, with the age group 85–89 years having the highest rate difference (higher than the global rate by 212.6 deaths per 100 000 working-age population) and highest risk ratio (7.2). The rate for the age group 15–19 years was 4.3 deaths per 100 000 working-age population, yielding a rate difference of –30.0 and a rate ratio of 0.1 (compared with a global rate of 34.3 per 100 000 working-age population).
FIGURE 33RATE DIFFERENCE AND RATE RATIO OF TOTAL DEATHS (COMPARED WITH THE GLOBAL DEATH RATE OF 34.3 FOR WORKING-AGE POPULATION) ATTRIBUTABLE TO THE 41 PAIRS OF OCCUPATIONAL RISK FACTOR AND HEALTH OUTCOME, BY AGE GROUP, 183 COUNTRIES, FOR THE YEAR 2016
Death rate (per 100 000 persons ≥ 15 years)
Ratio of death rate to global death rate (log scale)
Age group (years)
Age group (years)
300.0
250.0
200.0
150.0
100.0
50.0
0.0
10.0
5.0
2.0
1.0
0.5
0.2
0.1
Global rate
15–1
9
20–2
4
25–2
9
30–3
4
35–3
9
40–4
4
45–4
9
50–5
4
55–5
9
60–6
4
65–6
9
70–7
4
75–7
9
80–8
4
85–8
9
90–9
4
≥ 95
15–1
9
20–2
4
25–2
9
30–3
4
35–3
9
40–4
4
45–4
9
50–5
4
55–5
9
60–6
4
65–6
9
70–7
4
75–7
9
80–8
4
85–8
9
90–9
4
≥ 95
42 WHO/ILO JOINT ESTIMATES OF THE WORK-RELATED BURDEN OF DISEASE AND INJURY, 2000-2016
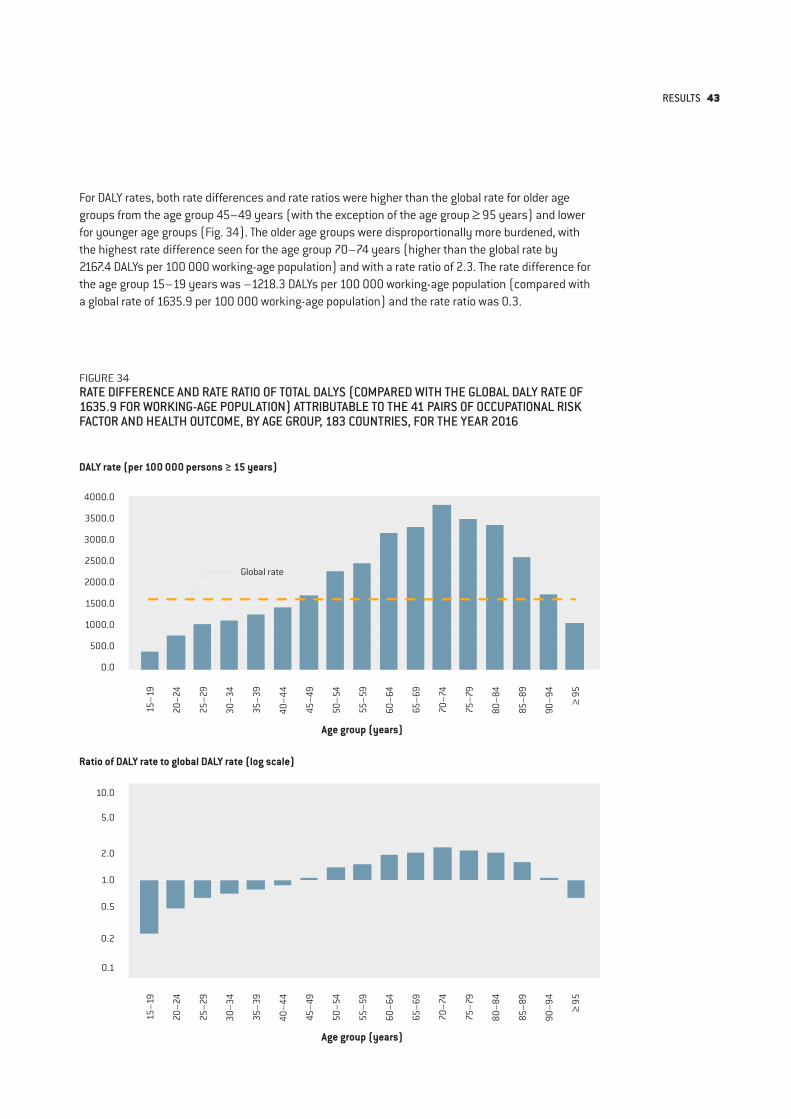
FIGURE 34RATE DIFFERENCE AND RATE RATIO OF TOTAL DALYS (COMPARED WITH THE GLOBAL DALY RATE OF 1635.9 FOR WORKING-AGE POPULATION) ATTRIBUTABLE TO THE 41 PAIRS OF OCCUPATIONAL RISK FACTOR AND HEALTH OUTCOME, BY AGE GROUP, 183 COUNTRIES, FOR THE YEAR 2016
DALY rate (per 100 000 persons ≥ 15 years)
Ratio of DALY rate to global DALY rate (log scale)
Age group (years)
Age group (years)
4000.0
3500.0
3000.0
2500.0
2000.0
1500.0
1000.0
500.0
0.0
10.0
5.0
2.0
1.0
0.5
0.2
0.1
Global rate
For DALY rates, both rate differences and rate ratios were higher than the global rate for older age groups from the age group 45–49 years (with the exception of the age group ≥ 95 years) and lower for younger age groups (Fig. 34). The older age groups were disproportionally more burdened, with the highest rate difference seen for the age group 70–74 years (higher than the global rate by 2167.4 DALYs per 100 000 working-age population) and with a rate ratio of 2.3. The rate difference for the age group 15–19 years was –1218.3 DALYs per 100 000 working-age population (compared with a global rate of 1635.9 per 100 000 working-age population) and the rate ratio was 0.3.
15–1
9
20–2
4
25–2
9
30–3
4
35–3
9
40–4
4
45–4
9
50–5
4
55–5
9
60–6
4
65–6
9
70–7
4
75–7
9
80–8
4
85–8
9
90–9
4
≥ 95
15–1
9
20–2
4
25–2
9
30–3
4
35–3
9
40–4
4
45–4
9
50–5
4
55–5
9
60–6
4
65–6
9
70–7
4
75–7
9
80–8
4
85–8
9
90–9
4
≥ 95
RESULTS 43
5. DISCUSSIONGLOBAL MONITORING REPORT
44
WHO and the ILO have produced the first set of the WHO/ILO Joint Estimates of the Work-related Burden of Disease and Injury (WHO/ILO Joint Estimates). The prevalence of some key occupational risk factors, and the burden of specific health outcomes attributable to these risk factors, has been quantified using multiple data sources from countries, areas and territories across all WHO and ILO regions. The WHO/ILO Joint Estimates of burden of disease are available to users at the global level as well as by region and country, and are available disaggregated by sex and age group. However, these estimates are not available at a subnational level. Additionally, it was not possible to produce disaggregated estimates by occupation, industrial sector and migration status at this stage. As more data become available, estimates with these additional breakdowns could be added if and when feasible.
These estimates are affected by several factors, including the source and quality of input data, and the type and complexity of the models of exposure and health estimates. The various approaches taken to collect and synthesize data have used information from a wide range of sources (e.g. systematic reviews and meta-analyses, and the global databases on exposure to long working hours). Estimates have been included only if the underlying body of evidence was judged to be of sufficient quality and strength. Some of the estimates are based on exposure data from limited sources and from areas of limited country and regional coverage. The estimates of burden of disease attributable to exposure to long working hours use direct measures of exposure data (2324 surveys conducted in 154 countries, areas and territories and 1742 quarterly datasets of Labour Force Surveys conducted in 46 countries), primarily collected by national statistics offices. More large-scale global official datasets of exposure to occupational risk factors, ideally from direct measurement or through strong proxies such as occupation and industrial sector, are needed to further improve the accuracy of estimates of the work-related burden of disease. Similarly, to more accurately quantify risks of health outcomes from exposure to occupational risk factors for the occupational burden of disease estimation, we also need more primary studies to be conducted on the effect of exposure to occupational risk factors on health outcomes, as well as additional and well conducted systematic reviews and meta-analyses (30). In particular, data and evidence from low- and middle-income countries are needed, and will substantially advance work-related burden of disease estimation.
Target 8.8 of the SDGs aims to “Protect labour rights and promote safe and secure working environments for all workers, including migrant workers, in particular women migrants, and those in precarious employment” (4), and indicator 8.8.1 refers to the “frequency rates of fatal and non-fatal occupational injuries”. However, injuries accounted for only 19.3% (363 283/1 798 890) of deaths and 29.5% (26.44 million/89.72 million) of DALYs attributable to occupational risk factors in 2016. From the new WHO/ILO Joint Estimates, an additional, complementary indicator for Target 8.8, quantifying the burden of deaths from diseases attributable to exposure to occupational risk factors, could be produced (91, 92). Estimates can support Member States reporting on indicator 8.8.1, especially where dedicated reporting systems for such deaths may not yet exist.
It must be noted that not all occupational risk factors and attributable burdens of disease have yet been quantified. The production of estimates for some pairs was not possible in this estimation cycle, such as: occupational exposure to biological risk factors and infectious diseases; occupational exposure to psycho-social risk factors and mental health outcomes; and occupational exposure to ambient air pollution and its various health outcomes. The inclusion of such additional pairs during the next round of estimate production will greatly broaden the scope of these estimates and capture more of the work-related burden of disease.
DISCUSSION 45
6. CONCLUSIONGLOBAL MONITORING REPORT
46
This first Global Monitoring Report found that in 2016 1.88 million deaths and 89.72 million DALYs were estimated to be attributable to the 41 selected pairs of occupational risk factor and health outcome covered. Diseases accounted for 80.7% (1.52 million) of the deaths and 70.5% (63.28 million) of the DALYs, and injuries accounted for 19.3% (0.36 million) of the deaths and 29.5% (26.44 million) of the DALYs. The occupational risk factor with the largest number of attributable deaths was exposure to long working hours (≥ 55 hours per week) (744 924 deaths), followed by occupational exposure to particulate matter, gases and fumes (450 381 deaths) and occupational injuries (363 283 deaths). The health outcome with the largest work-related burden of deaths was chronic obstructive pulmonary disease (450 381 deaths), followed by stroke (398 306 deaths) and ischaemic heart disease (346 618 deaths). A disproportionately large work-related burden of disease is observed in the WHO African Region, South-East Asia Region and the Western Pacific Region, males and older age groups.
For the effect of occupational risk factors on various health outcomes to be understood, quantification of the attributable burden of disease is vital. The WHO/ILO Joint Estimates will result in regular and harmonized, interagency monitoring of the work-related burden of disease, at the national, regional and global levels. Countries can benefit from accurate and transparent estimates produced by providers of official statistics, and based on the latest available data. As well as facilitating the detection of trends over time, these sex- and age-disaggregated estimates also enable: the identification of occupational risk factors and diseases to prioritize; the monitoring of between- and within-country inequalities in work-related burden of disease; the evaluation of existing policies and actions; and the development of evidence-based improvements in occupational and workers’ health and safety policy and practices. However, burden of disease estimates should not be used in isolation for prioritization of action.
Through the development of new methodologies for estimating the work-related burden of disease, including systematic reviews on the prioritized additional pairs of occupational risk factor and health outcome, we have widened the scope of the Global Comparative Risk Assessment and strengthened the global capacity for modelling disease burden in occupational health. The WHO/ILO Joint Estimates allow the global monitoring of exposure to occupational risk factors and the work-related burden of disease, enabling policy-makers and health institutions to plan, cost, implement and evaluate actions to prevent exposure to occupational risk factors and their associated burdens of disease and injury.
CONCLUSION 47
REFERENCESGLOBAL MONITORING REPORT
48
1. Basic documents. 49th edition. Geneva: World Health Organization; 2021 (https://apps.who.int/gb/bd/, accessed 29 July 2021).
2. Ezzati M, Lopez AD, Rogers A, Murray CJL, editors. Comparative quantification of health risks: global and regional burden of disease attributable to selected major risk factors. Geneva: World Health Organization; 2004 (https://apps.who.int/iris/handle/10665/42770, accessed 28 July 2021).
3. Ezzati M, Lopez AD, Rodgers A, Vander Hoorn S, Murray CJ; Comparative Risk Assessment Collaborating Group. Selected major risk factors and global and regional burden of disease. Lancet. 2002;360(9343):1347–60. doi:10.1016/S0140-6736(02)11403-6 PMID:12423980
4. United Nations. Transforming our world: The 2030 agenda for Sustainable Development; 2015 (https://sustainabledevelopment.un.org/post2015/transformingourworld/publication, accessed 28 July 2021).
5. Descatha A, Sembajwe G, Baer M, Boccuni F, Di Tecco C, Duret C, et al. WHO/ILO work-related burden of disease and injury: protocol for systematic reviews of exposure to long working hours and of the effect of exposure to long working hours on stroke. Environ Int. 2018;119:366–78. doi:10.1016/j.envint.2018.06.016 PMID:30005185
6. Godderis L, Boonen E, Cabrera Martimbianco AL, Delvaux E, Ivanov ID, Lambrechts MC, et al. WHO/ILO work-related burden of disease and injury: Protocol for systematic reviews of exposure to long working hours and of the effect of exposure to long working hours on alcohol consumption and alcohol use disorders. Environ Int. 2018;120:22–33. doi:10.1016/j.envint.2018.07.025 PMID:30055358
7. Hulshof CTJ, Colosio C, Daams JG, Ivanov ID, KC P, Kuijer PPFM, et al. WHO/ILO work-related burden of disease and injury: Protocol for systematic reviews of exposure to occupational ergonomic risk factors and of the effect of exposure to occupational ergonomic risk factors on osteoarthritis of hip or knee and selected other musculoskeletal diseases. Environ Int. 2019;125:554–66. doi:10.1016/j.envint.2018.09.053 PMID:30583853
8. Li J, Brisson C, Clays E, Ferrario MM, Ivanov ID, Landsbergis P, et al. WHO/ILO work-related burden of disease and injury: protocol for systematic reviews of exposure to long working hours and of the effect of exposure to long working hours on ischaemic heart disease. Environ Int. 2018;119:558–69. doi:10.1016/j.envint.2018.06.022 PMID:30125833
9. Mandrioli D, Schlunssen V, Adam B, Cohen RA, Colosio C, Chen W, et al. WHO/ILO work-related burden of disease and injury: Protocol for systematic reviews of occupational exposure to dusts and/or fibres and of the effect of occupational exposure to dusts and/or fibres on pneumoconiosis. Environ Int. 2018;119:174–85. doi:10.1016/j.envint.2018.06.005 PMID:29958118
10. Paulo MS, Adam B, Akagwu C, Akparibo I, Al-Rifai RH, Bazrafshan S, et al. WHO/ILO work-related burden of disease and injury: Protocol for systematic reviews of occupational exposure to solar ultraviolet radiation and of the effect of occupational exposure to solar ultraviolet radiation on melanoma and non-melanoma skin cancer. Environ Int. 2019;126:804–15. doi:10.1016/j.envint.2018.09.039 PMID:30792021
11. Rugulies R, Ando E, Ayuso-Mateos JL, Bonafede M, Cabello M, Di Tecco C, et al. WHO/ILO work-related burden of disease and injury: Protocol for systematic reviews of exposure to long working hours and of the effect of exposure to long working hours on depression. Environ Int. 2019;125:515–28. doi:10.1016/j.envint.2018.11.011 PMID:30737040
12. Teixeira LR, Azevedo TM, Bortkiewicz A, Correa da Silva DT, de Abreu W, de Almeida MS, et al. WHO/ILO work-related burden of disease and injury: Protocol for systematic reviews of exposure to occupational noise and of the effect of exposure to occupational noise on cardiovascular disease. Environ Int. 2019;125:567–78. doi:10.1016/j.envint.2018.09.040 PMID:30683322
13. Tenkate T, Adam B, Al-Rifai RH, Chou BR, Gobba F, Ivanov ID, et al. WHO/ILO work-related burden of disease and injury: Protocol for systematic reviews of occupational exposure to solar ultraviolet radiation and of the effect of occupational exposure to solar ultraviolet radiation on cataract. Environ Int. 2019;125:542–53. doi:10.1016/j.envint.2018.10.001 PMID:30737039
14. Descatha A, Sembajwe G, Pega F, Ujita Y, Baer M, Boccuni F, et al. The effect of exposure to long working hours on stroke: a systematic review and meta-analysis from the WHO/ILO Joint Estimates of the Work-related Burden of Disease and Injury. Environ Int. 2020;142:105746. doi:10.1016/j.envint.2020.105746 PMID:32505015
15. Li J, Pega F, Ujita Y, Brisson C, Clays E, Descatha A, et al. The effect of exposure to long working hours on ischaemic heart disease: a systematic review and meta-analysis from the WHO/ILO Joint Estimates of the Work-related Burden of Disease and Injury. Environ Int. 2020;142:105739. doi:10.1016/j.envint.2020.105739 PMID:32505014
16. Pachito DV, Pega F, Bakusic J, Boonen E, Clays E, Descatha A, et al. The effect of exposure to long working hours on alcohol consumption, risky drinking and alcohol use disorder: A systematic review and meta-analysis from the WHO/ILO Joint Estimates of the Work-related Burden of Disease and Injury. Environ Int. 2021;146:106205. doi:10.1016/j.envint.2020.106205 PMID:33189992
17. Pega F, Chartres N, Guha N, Modenese A, Morgan RL, Martinez-Silveira MS, et al. The effect of occupational exposure to welding fumes on trachea, bronchus and lung cancer: A protocol for a systematic review and meta-analysis from the WHO/ILO Joint Estimates of the Work-related Burden of Disease and Injury. Environ Int. 2020;145:106089. doi:10.1016/j.envint.2020.106089 PMID:32950789
18. Rugulies R, Sørensen K, Di Tecco C, Bonafede M, Rondinone BM, Ahn S, et al. The effect of exposure to long working hours on depression: A systematic review and meta-analysis from the WHO/ILO Joint Estimates of the Work-Related Burden of Disease and Injury. Environ Int. 2021;155:106629. Epub 2021 Jun 15. doi:10.1016/j.envint.2021.106629 PMID:34144478
REFERENCES 49
19. Teixeira LR, Pega F, de Abreu W, de Almeida MS, de Andrade CAF, Azevedo TM, et al. The prevalence of occupational exposure to noise: A systematic review and meta-analysis from the WHO/ILO Joint Estimates of the Work-related Burden of Disease and Injury. 2021;154:106380. doi:10.1016/j.envint.2021.106380
20. Teixeira LR, Pega F, Dzhambov AM, Bortkiewicz A, da Silva DTC, de Andrade CAF, et al. The effect of occupational exposure to noise on ischaemic heart disease, stroke and hypertension: A systematic review and meta-analysis from the WHO/ILO Joint Estimates of the Work-Related Burden of Disease and Injury. Environ Int. 2021;154:106387. doi:10.1016/j.envint.2021.106387 PMID:33612311
21. Hulshof CTJ, Pega F, Neupane S, van der Molen HF, Colosio C, Daams JG, et al. The prevalence of occupational exposure to ergonomic risk factors: A systematic review and meta-analysis from the WHO/ILO Joint Estimates of the Work-related Burden of Disease and Injury. Environ Int. 2021;146:106157. doi:10.1016/j.envint.2020.106157 PMID:33395953
22. Hulshof CTJ, Pega F, Neupane S, Colosio C, Daams JG, KC P, et al. The effect of occupational exposure to ergonomic risk factors on osteoarthritis of hip or knee and selected other musculoskeletal diseases: A systematic review and meta-analysis from the WHO/ILO Joint Estimates of the Work-related Burden of Disease and Injury. Environ Int. 2021;150:106349. doi:10.1016/j.envint.2020.106349 PMID:33546919
23. Stevens GA, Alkema L, Black RE, Boerma JT, Collins GS, Ezzati M, et al. Guidelines for accurate and transparent health estimates reporting: the GATHER statement. Lancet. 2016;388:e19–e23. doi:10.1016/S0140-6736(16)30388-9 PMID:27371184
24. WHO/ILO Joint Estimates of the Work-related Burden of Disease and Injury, 2000-2016: Technical Report with Data Sources and Methods. Geneva: World Health Organization, Geneva: International Labour Organization; 2021.
25. GBD 2017 Risk Factor Collaborators. Global, regional, and national comparative risk assessment of 84 behavioural, environmental and occupational, and metabolic risks or clusters of risks for 195 countries and territories, 1990–2017: a systematic analysis for the Global Burden of Disease Study 2017. Lancet. 2018;392(10159):1923–94. doi:10.1016/S0140-6736(18)32225-6 PMID:30496105
26. Global Health Estimates. Geneva: World Health Organization; 2018 (https://www.who.int/data/global-health-estimates, accessed 17 June 2021).
27. Thirteenth International Conference of Labour Statisticians (Geneva, 18-29 October 1982). Geneva: International Labour Office; 1982 (https://labordoc.ilo.org/discovery/fulldisplay?docid=alma992208263402676&context=L&vid=41ILO_INST:41ILO_V2&lang=en&adaptor=Local%20Search%20Engine, accessed 29 July 2021).
28. Sixteenth International Conference of Labour Statisticians, Geneva, 6-15 October 1998. Geneva: International Labour Organization; 1998 (https://ilo.primo.exlibrisgroup.com/discovery/fulldisplay?docid=alma993316683402676&context=L&vid=41ILO_INST:41ILO_V2&lang=en&adaptor=Local%20Search%20Engine, accessed 29 July 2021).
29. Global Health Data Exchange (GHDx). Seattle, WA: Institute for Health Metrics and Evaluation, University of Washington; 2020 (http://ghdx.healthdata.org/, accessed 29 July 2021).
30. Pega F, Momen NC, Ujita Y, Driscoll T, Whaley P. Systematic reviews and meta-analyses for the WHO/ILO Joint Estimates of the Work-related Burden of Disease and Injury. Environ Int. 2021;155:106605. doi:10.1016/j.envint.2021.106605 PMID:34051644
31. Pega F, Norris SL, Backes C, Bero LA, Descatha A, Gagliardi D, et al. RoB-SPEO: A tool for assessing risk of bias in studies estimating the prevalence of exposure to occupational risk factors from the WHO/ILO Joint Estimates of the Work-related Burden of Disease and Injury. Environ Int. 2020;135:105039. doi:10.1016/j.envint.2019.105039 PMID:31864023
32. Pega F, Náfrádi B, Momen NC, Ujita Y, Streicher KN, Prüss-Üstün AM, et al. Global, regional, and national burdens of ischemic heart disease and stroke attributable to exposure to long working hours for 194 countries, 2000-2016: a systematic analysis from the WHO/ILO Joint Estimates of the Work-related Burden of Disease and Injury. Environ Int. 2021;154:106595. Epub 2010 May 17. doi:10.1016/j.envint.2021.106595 PMID:34011457
33. Leyland AH, Goldstein H. Multilevel modelling of health statistics. Chicester: Wiley; 2001.
34. Wolf J, Bonjour S, Prüss-Üstün A. An exploration of multilevel modeling for estimating access to drinking-water and sanitation. J Water Health. 2013;11:64–77. doi:10.2166/wh.2012.107 PMID:23428550
35. Bonjour S, Adair-Rohani H, Wolf J, Bruce NG, Mehta S, Prüss-Üstün A, et al. Solid fuel use for household cooking: country and regional estimates for 1980-2010. Environ Health Perspect. 2013;121:784–90. doi:10.1289/ehp.1205987 PMID:23674502
36. Handbook on health inequality monitoring with a special focus on low- and middle-income countries. Geneva, World Health Organization; 2013 (https://www.who.int/docs/default-source/gho-documents/health-equity/handbook-on-health-inequality-monitoring/handbook-on-health-inequality-monitoring.pdf?sfvrsn=d27f8211_2, accessed 29 July 2021).
37. Political declaration of the high-level meeting on universal health coverage. New York: United Nations (https://www.un.org/pga/73/wp-content/uploads/sites/53/2019/07/FINAL-draft-UHC-Political-Declaration.pdf, accessed 28 July 2021).
38. Closing the gap in a generation: health equity through action on the social determinants of health. Final Report of the Commission on Social Determinants of Health. Geneva: World Health Organization; 2008 (https://www.who.int/publications/i/item/WHO-IER-CSDH-08.1, accessed 28 July 2021).
50 WHO/ILO JOINT ESTIMATES OF THE WORK-RELATED BURDEN OF DISEASE AND INJURY, 2000-2016
39. C161 - Occupational Health Services Convention (No. 161). Geneva: International Labour Organization; 1985 (https://www.ilo.org/dyn/normlex/en/f?p=NORMLEXPUB:12100:0::NO::P12100_ILO_CODE:C161, accessed 28 July 2021).
40. National Institute of Occupational Safety and Health. Hierarchy of controls. Atlanta: Centers for Disease Control and Prevention; 2015 (https://www.cdc.gov/niosh/topics/hierarchy/default.html, accessed 28 July 2021).
41. C170 - Chemicals Convention (No. 170). Geneva: International Labour Organization; 1990 (http://www.ilo.org/dyn/normlex/en/f?p=NORMLEXPUB:12100:0::NO::p12100_instrument_id:312315, accessed 29 July 2021).
42. Safety and health at work. Normative instruments. Geneva: International Labour Organization; 2021 (https://www.ilo.org/global/topics/safety-and-health-at-work/normative-instruments/lang--en/index.htm, accessed 29 July 2021).
43. Occupational health. Geneva: World Health Organization; 2021 (https://www.who.int/health-topics/occupational-health, accessed 5 August 2021)
44. Occupational safety and health. Geneva: International Labour Organization; 2021 (https://www.ilo.org/safework/lang--en/index.htm, accessed 5 August 2021)
45. IARC. Arsenic, metals, fibres, and dusts. IARC Monogr Eval Carcinog Risks Hum, 2009;100C. Lyon: International Agency for Research on Cancer (http://publications.iarc.fr/120, accessed 29 July 2021).
46. Asbestos - hazards and safe practice for clear-up after tsunami. Geneva: World Health Organization; 2006 (https://www.who.int/publications/m/item/asbestos---hazards-and-safe-practice-for-clear-up-after-tsunami, accessed 29 July 2021).
47. Chrysotile asbestos. Geneva: World Health Organization; 2014 (https://www.who.int/ipcs/assessment/public_health/chrysotile_asbestos_summary.pdf, accessed 29 July 2021).
48. C162 - Asbestos Convention (No. 162). Geneva: International Labour Organization; 1986 (https://www.ilo.org/dyn/normlex/en/f?p=1000:12100:::NO:12100:P12100_INSTRUMENT_ID:312307, accessed 29 July 2021).
49. Outline for the development of national programmes for elimination of asbestos-related diseases. Geneva: World Health Organization; Geneva: International Labour Organization; 2007 (https://www.who.int/publications/i/item/WHO-SDE-PHE-07-02, accessed 29 July 2021).
50. Wolf J, Prüss-Ustün A, Ivanonv I, Mugdal S, Corvalán C, Bos R, et al. Preventing disease through a healthier and safer workplace. Geneva: World Health Organization; 2018 (https://apps.who.int/iris/handle/10665/272980, accessed 29 July 2021).
51. Asbestos: elimination of asbestos-related diseases. Geneva: World Health Organization; 2018 (https://www.who.int/news-room/fact-sheets/detail/asbestos-elimination-of-asbestos-related-diseases, accessed 29 July 2021).
52. Inorganic arsenic compounds other than arsine: health and safety guide no. 70. International Programme on Chemical Safety. Geneva: World Health Organization; 1992 (https://apps.who.int/iris/handle/10665/39580, accessed 29 July 2021).
53. IARC. Benzene. IARC Monogr Eval Carcinog Risks Hum, 2018;120. Lyon: International Agency for Research on Cancer (http://publications.iarc.fr/576, accessed 29 July 2021).
54. C136 - Benzene Convention (No. 136). Geneva: International Labour Organization; 1971 (https://www.ilo.org/dyn/normlex/en/f?p=NORMLEXPUB:12100:0::NO::P12100_ILO_CODE:C136, accessed 29 July 2021).
55. Air quality guidelines for Europe. Geneva: World Health Organization; 2000 (https://www.euro.who.int/__data/assets/pdf_file/0005/74732/E71922.pdf, accessed 29 July 2021).
56. Preventing disease through healthy environments: exposure to benzene: a major public health concern. Geneva: World Health Organization; 2019 (https://apps.who.int/iris/handle/10665/329481, accessed 29 July 2021).
57. Chemicals road map. Geneva: World Health Organization; 2017 (https://www.who.int/publications/i/item/WHO-FWC-PHE-EPE-17.03, accessed 29 July 2021).
58. IARC. Beryllium, cadmium, mercury, and exposures in the glass manufacturing industry. IARC Monogr Eval Carcinog Risks Hum, 1993;58. Lyon: International Agency for Research on Cancer (http://publications.iarc.fr/76, accessed 29 July 2021).
59. Beryllium: Environmental health criteria 106. International Programme on Chemical Safety. United Nations Environment Programme; World Health Organization; International Labour Organization (https://wedocs.unep.org/handle/20.500.11822/29434, accessed 29 July 2021).
60. OSHA Fact Sheet. Protecting workers for exposure to beryllium and beryllium compounds: Final rule overview. Washington: Occupational Safety and Health Administration (https://www.osha.gov/sites/default/files/publications/OSHA3821.pdf, accessed 29 July 2021).
61. Preventing disease through healthy environments: Action is needed on chemicals of major public health concern. Geneva: World Health Organization; 2010 (https://www.who.int/ipcs/features/10chemicals_en.pdf, accessed 29 July 2021).
62. Preventing disease through healthy environments: exposure to cadmium: a major public health concern. Geneva: World Health Organization; 2019 (https://apps.who.int/iris/bitstream/handle/10665/329480/WHO-CED-PHE-EPE-19.4.3-eng.pdf, accessed 29 July 2021).
REFERENCES 51
63. International Chemical Safety Card Number 1194 - Chromium(VI) Oxide. Geneva: International Labour Organization; Geneva: World Health Organization; 2021 (https://www.ilo.org/dyn/icsc/showcard.display?p_lang=en&p_card_id=1194&p_version=2, accessed 29 July 2021).
64. IARC. Diesel and gasoline engine exhausts and some nitroarenes. IARC Monogr Eval Carcinog Risks Hum, 2014;105. Lyon: International Agency for Research on Cancer (http://publications.iarc.fr/129, accessed 29 July 2021).
65. Environmental health criteria 171: diesel fuel and exhaust emissions. International Programme on Chemical Safety. Geneva: World Health Organization; 1996 (https://apps.who.int/iris/bitstream/handle/10665/41865/9241571713-eng.pdf?sequence=1, accessed 29 July 2021).
66. IARC. Formaldehyde, 2-butoxyethanol and 1-tert-butoxypropan-2-ol. IARC Monogr Eval Carcinog Risks Hum, 2006;88. Lyon: International Agency for Research on Cancer (http://publications.iarc.fr/106, accessed 29 July 2021).
67. Formaldehyde. Health and safety guide. International Programme on Chemical Safety. United Nations Environment Programme; World Health Organization; International Labour Organization; 1991 (https://wedocs.unep.org/handle/20.500.11822/29583, accessed 29 July 2021).
68. Nickel, nickel carobonyl, and some nickel compounds. Health and safety guide. International Programme on Chemical Safety. United Nations Environment Programme; World Health Organization; International Labour Organization; 1991 (https://wedocs.unep.org/handle/20.500.11822/29609, accessed 29 July 2021).
69. IARC. Some non-heterocyclic polycyclic aromatic hydrocarbons and some related exposures. IARC Monogr Eval Carcinog Risks Hum, 2010;92. Lyon: International Agency for Research on Cancer (http://publications.iarc.fr/110, accessed 29 July 2021).
70. Selected non-heterocyclic policyclic aromatic hydrocarbons. International Programme on Chemical Safety. Geneva: World Health Organization; 1998 (https://apps.who.int/iris/handle/10665/41958, accessed 29 July 2021).
71. C176 - Safety and Health in Mines Convention (No. 176). Geneva: International Labour Organization; 1995 (https://www.ilo.org/dyn/normlex/en/f?p=NORMLEXPUB:12100:0::NO:12100:P12100_INSTRUMENT_ID:312321:NO, accessed 29 July 2021).
72. Crystalline silica, quartz. Concise International Chemical Assessment document no. 24. International Programme on Chemical Safety. Geneva: World Health Organization (https://www.who.int/ipcs/publications/cicad/en/cicad24.pdf, accessed 29 July 2021).
73. IARC. Chemical agents and related occupations. IARC Monogr Eval Carcinog Risks Hum, 2012;100F. Lyon: International Agency for Research on Cancer (http://publications.iarc.fr/123, accessed 29 July 2021).
74. International Chemical Safety Card Number 362: Sulfuric Acid, concentrated (> 51% and < 100%). Geneva: International Labour Organization; Geneva: World Health Organization; 2021 (https://www.ilo.org/dyn/icsc/showcard.display?p_lang=en&p_card_id=0362&p_version=2, accessed 29 July 2021).
75. IARC. Trichloroethylene, tetrachloroethylene, and some other chlorinated agents. IARC Monogr Eval Carcinog Risks Hum, 2014;106. Lyon: International Agency for Research on Cancer (http://publications.iarc.fr/130, accessed 29 July 2021).
76. Karjalainen A, Kurppa K, Martikainen R, Klaukka T, Karjalainen J. Work is related to a substantial portion of adult-onset asthma incidence in the Finnish population. Am J Respir Crit Care Med. 2001;164:565–8. doi:10.1164/ajrccm.164.4.2012146 PMID:11520716
77. Driscoll T, Steenland K, Nelson D, James L. Occupational airborne particulates: assessing the environmental burden of disease at national and local levels. Environmental Burden of Disease Series, No. 7. Geneva: World Health Organization (https://apps.who.int/iris/handle/10665/42994, accessed 29 July 2021).
78. Vestbo J, Hurd SS, Agustí AG, Jones PW, Vogelmeier C, Anzueto A, et al. Global strategy for the diagnosis, management, and prevention of chronic obstructive pulmonary disease: GOLD executive summary. Am J Respir Crit Care Med. 2013;187(4):349–65. doi:10.1164/rccm.201204-0596PP PMID:22878278
79. Blanc PD, Iribarren C, Trupin L, Earnest G, Katz PP, Balmes J, et al. Occupational exposures and the risk of COPD: dusty trades revisited. Thorax. 2009;64:6–12. doi:10.1136/thx.2008.099390 PMID:18678700
80. C148 - Working Environment (Air Pollution, Noise and Vibration) Convention (No. 148). Geneva: International Labour Organization; 1977 (https://www.ilo.org/dyn/normlex/en/f?p=NORMLEXPUB:12100:0::NO::P12100_ILO_CODE:C148, accessed 29 July 2021).
81. C187 - Promotional Framework for Occupational Safety and Health Convention (No. 187). Geneva: International Labour Organization; 2006 (https://www.ilo.org/dyn/normlex/en/f?p=NORMLEXPUB:12100:0::NO::P12100_ILO_CODE:C187, accessed 29 July 2021).
82. C155 - Occupational Safety and Health Convention (No. 155). Geneva: International Labour Organization; 1981 (https://www.ilo.org/dyn/normlex/en/f?p=NORMLEXPUB:12100:0::NO::P12100_ILO_CODE:C155, accessed 29 July 2021).
83. Code of Practice. Geneva: International Labour Organization; 2021 (https://www.ilo.org/global/topics/safety-and-health-at-work/normative-instruments/code-of-practice/lang--en/index.htm, accessed 29 July 2021).
84. C127 - Maximum Weight Convention (No. 127). Geneva: International Labour Organization; 1967 (https://www.ilo.org/dyn/normlex/en/f?p=NORMLEXPUB:12100:0::NO::P12100_ILO_CODE:C127, accessed 29 July 2021).
85. C001 - Hours of Work (Industry) Convention (No. 1). Geneva: International Labour Organization; 1919 (https://www.ilo.org/dyn/normlex/en/f?p=NORMLEXPUB:12100:0::NO::P12100_ILO_CODE:C001, accessed 29 July 2021).
52 WHO/ILO JOINT ESTIMATES OF THE WORK-RELATED BURDEN OF DISEASE AND INJURY, 2000-2016
86. C030 - Hours of Work (Commerce and Offices) Convention (No. 30). Geneva: International Labour Organization; 1930 (https://www.ilo.org/dyn/normlex/en/f?p=NORMLEXPUB:12100:0::NO::P12100_ILO_CODE:C030, accessed 29 July 2021).
87. Guide to developing balanced working time arrangements. Geneva: International Labour Organization; 2019 (https://www.ilo.org/travail/info/publications/WCMS_706159/lang--en/index.htm, accessed 29 July 2021).
88. Good practice in occupational health services: a contribution to workplace health. Geneva: World Health Organization; 2002 (https://apps.who.int/iris/handle/10665/107448, accessed 29 July 2021).
89. Workers’ health: Global plan of action. Sixtieth World Health Assembly. Geneva: World Health Organization; 2007 (https://www.who.int/occupational_health/WHO_health_assembly_en_web.pdf, accessed 29 July 2021).
90. Social determinants of health. Geneva: World Health Organization; 2021 (https://www.who.int/health-topics/social-determinants-of-health#tab=tab_1, accessed 29 July 2021).
91. Indicator proposal: Indicator 8.8.3: Mortality rate from diseases attributed to occupational risk factors, by disease, risk factor, sex, and age group. Submission to the Inter-agency and Expert Group on SDG Indicators. Geneva: World Health Organization, Geneva: International Labour Organization.
92. EU strategic framework on health and safety at work 2012–2027. Occupational safety and health in a changing world of work. Brussels: European Commission (https://www.europeansources.info/record/eu-strategic-framework-on-health-and-safety-at-work-2021-2027-occupational-safety-and-health-in-a-changing-world-of-work/, accessed 28 July 2021).
REFERENCES 53
ANNEXESGLOBAL MONITORING REPORT
54
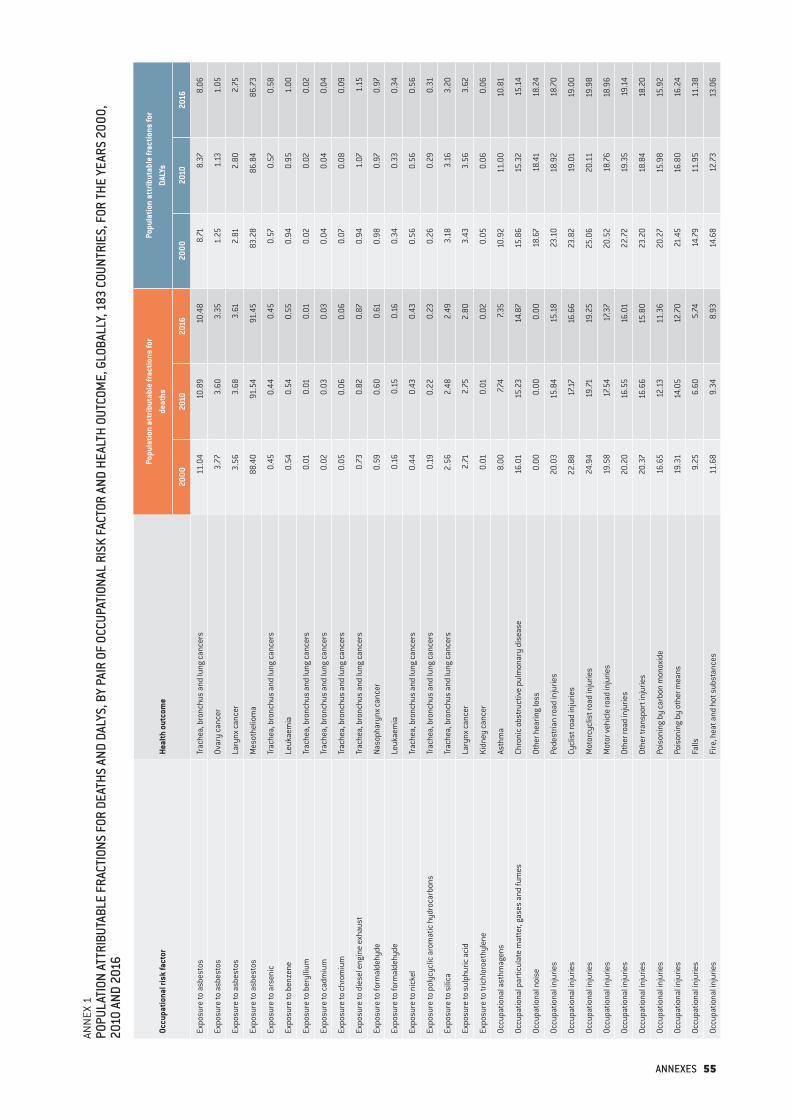
ANN
EX 1
POPU
LATI
ON A
TTRI
BUTA
BLE
FRAC
TION
S FO
R DE
ATHS
AND
DAL
YS, B
Y PA
IR O
F OC
CUPA
TION
AL R
ISK
FACT
OR A
ND H
EALT
H OU
TCOM
E, G
LOBA
LLY,
183
COU
NTRI
ES, F
OR TH
E YE
ARS
2000
, 20
10 A
ND 2
016
Occu
patio
nal r
isk
fact
orHe
alth
out
com
e
Popu
latio
n at
trib
utab
le fr
actio
ns fo
r de
aths
Popu
latio
n at
trib
utab
le fr
actio
ns fo
r DA
LYs
2000
2010
2016
2000
2010
2016
Expo
sure
to a
sbes
tos
Trac
hea,
bro
nchu
s an
d lu
ng ca
ncer
s11
.04
10.8
910
.48
8.71
8.37
8.06
Expo
sure
to a
sbes
tos
Ovar
y ca
ncer
3.77
3.60
3.35
1.25
1.13
1.05
Expo
sure
to a
sbes
tos
Lary
nx ca
ncer
3.56
3.68
3.61
2.81
2.80
2.75
Expo
sure
to a
sbes
tos
Mes
othe
liom
a88
.40
91.5
491
.45
83.2
886
.84
86.7
3
Expo
sure
to a
rsen
ic
Trac
hea,
bro
nchu
s an
d lu
ng ca
ncer
s0.
450.
440.
450.
570.
570.
58
Expo
sure
to b
enze
neLe
ukae
mia
0.54
0.54
0.55
0.94
0.95
1.00
Expo
sure
to b
eryl
lium
Tr
ache
a, b
ronc
hus
and
lung
canc
ers
0.01
0.01
0.01
0.02
0.02
0.02
Expo
sure
to ca
dmiu
mTr
ache
a, b
ronc
hus
and
lung
canc
ers
0.02
0.03
0.03
0.04
0.04
0.04
Expo
sure
to c
hrom
ium
Trac
hea,
bro
nchu
s an
d lu
ng ca
ncer
s0.
050.
060.
060.
070.
080.
09
Expo
sure
to d
iese
l eng
ine
exha
ust
Trac
hea,
bro
nchu
s an
d lu
ng ca
ncer
s0.
730.
820.
870.
941.
071.
15
Expo
sure
to fo
rmal
dehy
deNa
soph
aryn
x ca
ncer
0.59
0.60
0.61
0.98
0.97
0.97
Expo
sure
to fo
rmal
dehy
deLe
ukae
mia
0.16
0.15
0.16
0.34
0.33
0.34
Expo
sure
to n
icke
lTr
ache
a, b
ronc
hus
and
lung
canc
ers
0.44
0.43
0.43
0.56
0.56
0.56
Expo
sure
to p
olyc
yclic
aro
mat
ic h
ydro
carb
ons
Trac
hea,
bro
nchu
s an
d lu
ng ca
ncer
s0.
190.
220.
230.
260.
290.
31
Expo
sure
to s
ilica
Trac
hea,
bro
nchu
s an
d lu
ng ca
ncer
s2.
562.
482.
493.
183.
163.
20
Expo
sure
to s
ulph
uric
aci
dLa
rynx
canc
er2.
712.
752.
803.
433.
563.
62
Expo
sure
to tr
ichl
oroe
thyl
ene
Kidn
ey ca
ncer
0.01
0.01
0.02
0.05
0.06
0.06
Occu
patio
nal a
sthm
agen
sAs
thm
a8.
007.7
47.3
510
.92
11.0
010
.81
Occu
patio
nal p
artic
ulat
e m
atte
r, ga
ses
and
fum
esCh
roni
c ob
stru
ctiv
e pu
lmon
ary
dise
ase
16.0
115
.23
14.8
715
.86
15.3
215
.14
Occu
patio
nal n
oise
Othe
r hea
ring
loss
0.00
0.00
0.00
18.6
718
.41
18.2
4
Occu
patio
nal i
njur
ies
Pede
stria
n ro
ad in
jurie
s20
.03
15.8
415
.18
23.1
018
.92
18.7
0
Occu
patio
nal i
njur
ies
Cycl
ist r
oad
inju
ries
22.8
817
.1716
.66
23.8
219
.01
19.0
0
Occu
patio
nal i
njur
ies
Mot
orcy
clis
t roa
d in
jurie
s24
.94
19.71
19.2
525
.06
20.1
119
.98
Occu
patio
nal i
njur
ies
Mot
or v
ehic
le ro
ad in
jurie
s19
.58
17.5
417
.37
20.5
218
.76
18.9
6
Occu
patio
nal i
njur
ies
Othe
r roa
d in
jurie
s20
.20
16.5
516
.01
22.7
219
.35
19.1
4
Occu
patio
nal i
njur
ies
Othe
r tra
nspo
rt in
jurie
s20
.37
16.6
615
.80
23.2
018
.84
18.2
0
Occu
patio
nal i
njur
ies
Pois
onin
g by
carb
on m
onox
ide
16.6
512
.13
11.3
620
.27
15.9
815
.92
Occu
patio
nal i
njur
ies
Pois
onin
g by
oth
er m
eans
19.3
114
.05
12.7
021
.45
16.8
016
.24
Occu
patio
nal i
njur
ies
Falls
9.25
6.60
5.74
14.7
911
.95
11.3
8
Occu
patio
nal i
njur
ies
Fire
, hea
t and
hot
sub
stan
ces
11.6
89.
348.
9314
.68
12.7
313
.06
ANNEXES 55
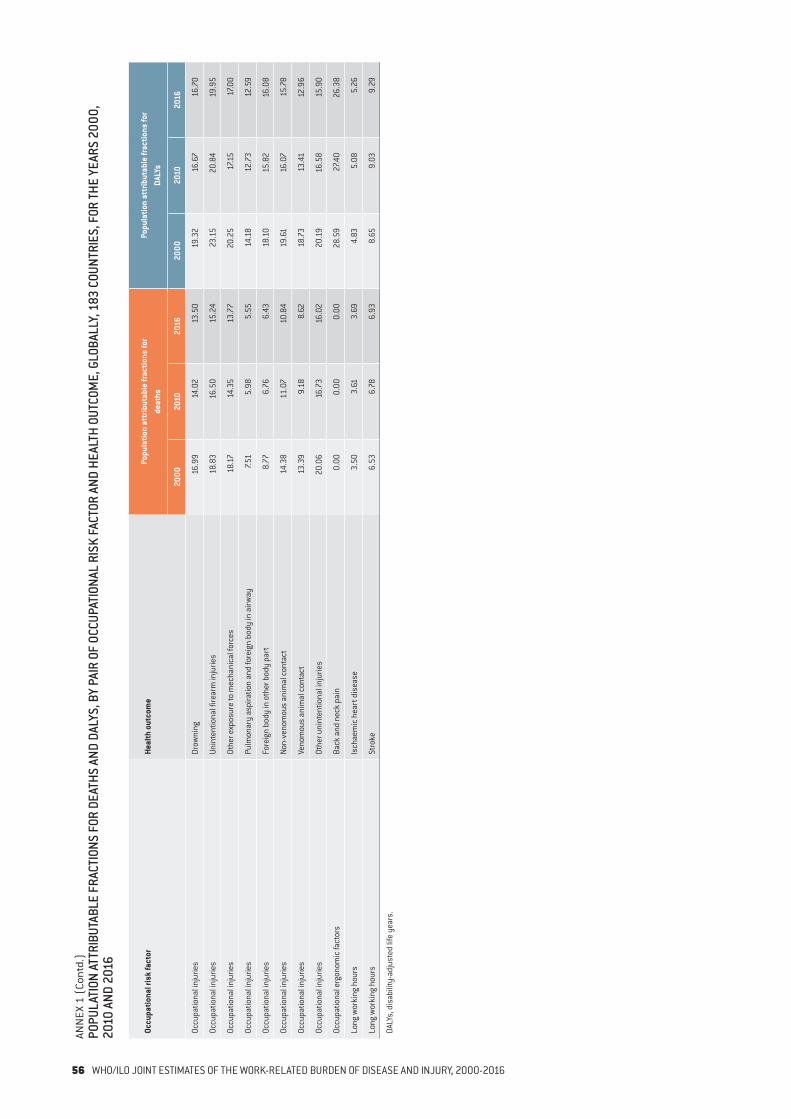
Occu
patio
nal r
isk
fact
orHe
alth
out
com
ePo
pula
tion
attr
ibut
able
frac
tions
for
deat
hsPo
pula
tion
attr
ibut
able
frac
tions
for
DALY
s
2000
2010
2016
2000
2010
2016
Occu
patio
nal i
njur
ies
Drow
ning
16.9
914
.02
13.5
019
.32
16.6
716
.70
Occu
patio
nal i
njur
ies
Unin
tent
iona
l fire
arm
inju
ries
18.8
316
.50
15.2
423
.15
20.8
419
.95
Occu
patio
nal i
njur
ies
Othe
r exp
osur
e to
mec
hani
cal f
orce
s18
.1714
.35
13.7
720
.25
17.1
517
.00
Occu
patio
nal i
njur
ies
Pulm
onar
y as
pira
tion
and
fore
ign
body
in a
irway
7.51
5.98
5.55
14.1
812
.73
12.5
9
Occu
patio
nal i
njur
ies
Fore
ign
body
in o
ther
bod
y pa
rt8.
776.
766.
4318
.10
15.8
216
.08
Occu
patio
nal i
njur
ies
Non-
veno
mou
s an
imal
con
tact
14.3
811
.07
10.8
419
.61
16.0
715
.78
Occu
patio
nal i
njur
ies
Veno
mou
s an
imal
con
tact
13.3
99.
188.
6218
.73
13.4
112
.96
Occu
patio
nal i
njur
ies
Othe
r uni
nten
tiona
l inj
urie
s20
.06
16.7
316
.02
20.1
916
.58
15.9
0
Occu
patio
nal e
rgon
omic
fact
ors
Back
and
nec
k pa
in0.
000.
000.
0028
.59
27.4
026
.38
Long
wor
king
hou
rsIs
chae
mic
hea
rt d
isea
se3.
503.
613.
694.
835.
085.
26
Long
wor
king
hou
rsSt
roke
6.53
6.78
6.93
8.65
9.03
9.29
DALY
s, d
isab
ility
-adj
uste
d lif
e ye
ars.
ANN
EX 1
(Co
ntd.
)PO
PULA
TION
ATT
RIBU
TABL
E FR
ACTI
ONS
FOR
DEAT
HS A
ND D
ALYS
, BY
PAIR
OF
OCCU
PATI
ONAL
RIS
K FA
CTOR
AND
HEA
LTH
OUTC
OME,
GLO
BALL
Y, 1
83 C
OUNT
RIES
, FOR
THE
YEAR
S 20
00,
2010
AND
201
6
56 WHO/ILO JOINT ESTIMATES OF THE WORK-RELATED BURDEN OF DISEASE AND INJURY, 2000-2016
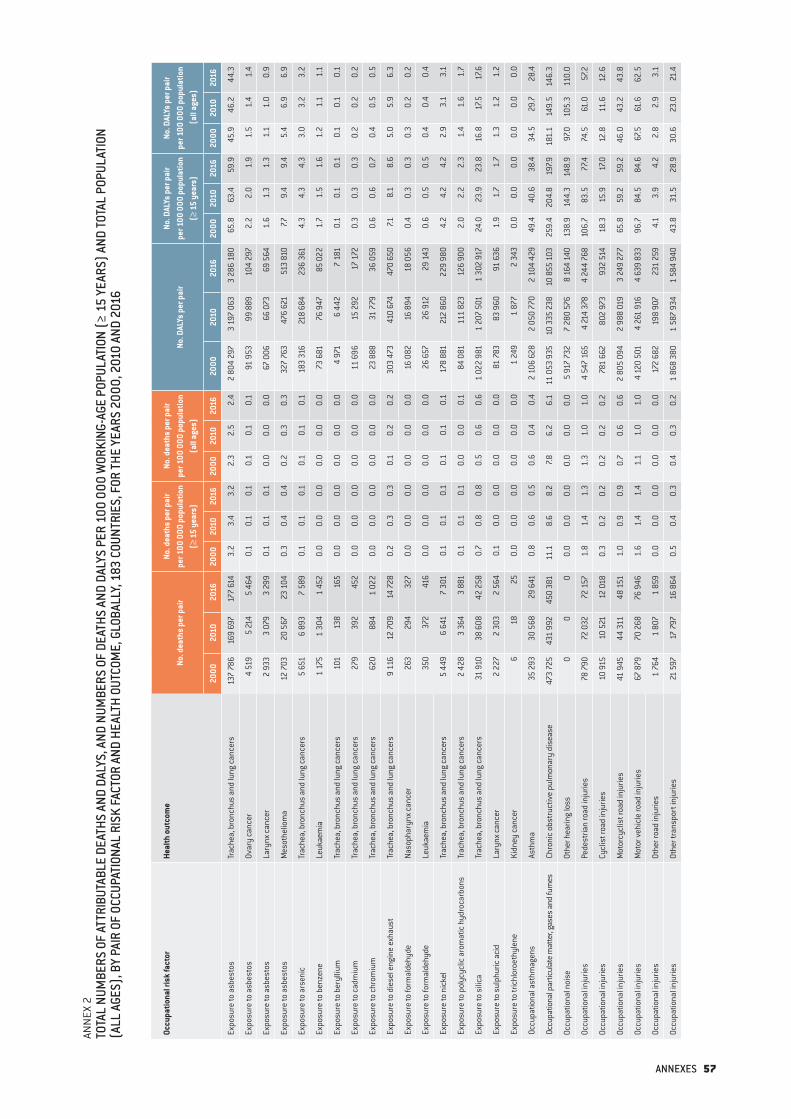
ANN
EX 2
TOTA
L NU
MBE
RS O
F AT
TRIB
UTAB
LE D
EATH
S AN
D DA
LYS,
AND
NUM
BERS
OF
DEAT
HS A
ND D
ALYS
PER
100
000
WOR
KING
-AGE
POP
ULAT
ION
(≥ 1
5 YE
ARS)
AND
TOTA
L PO
PULA
TION
(A
LL A
GES)
, BY
PAIR
OF
OCCU
PATI
ONAL
RIS
K FA
CTOR
AND
HEA
LTH
OUTC
OME,
GLO
BALL
Y, 1
83 C
OUNT
RIES
, FOR
THE
YEAR
S 20
00, 2
010
AND
2016
Occu
patio
nal r
isk
fact
orHe
alth
out
com
eNo
. dea
ths
per p
air
No. d
eath
s pe
r pai
r pe
r 100
000
pop
ulat
ion
(≥ 1
5 ye
ars)
No. d
eath
s pe
r pai
r pe
r 100
000
pop
ulat
ion
(all
ages
)No
. DAL
Ys p
er p
air
No. D
ALYs
per
pai
r pe
r 100
000
pop
ulat
ion
(≥ 1
5 ye
ars)
No. D
ALYs
per
pai
r pe
r 100
000
pop
ulat
ion
(all
ages
)
2000
2010
2016
2000
2010
2016
2000
2010
2016
2000
2010
2016
2000
2010
2016
2000
2010
2016
Expo
sure
to a
sbes
tos
Trac
hea,
bro
nchu
s an
d lu
ng ca
ncer
s13
7 78
616
9 69
717
7 61
43.
23.
43.
22.
32.
52.
42
804
297
3 19
7 06
33
286
180
65.8
63.4
59.9
45.9
46.2
44.3
Expo
sure
to a
sbes
tos
Ovar
y ca
ncer
4 51
95
214
5 46
40.
10.
10.
10.
10.
10.
191
953
99 8
8910
4 29
72.
22.
01.
91.
51.
41.
4
Expo
sure
to a
sbes
tos
Lary
nx ca
ncer
2 93
33
079
3 29
90.
10.
10.
10.
00.
00.
067
006
66 0
7369
564
1.6
1.3
1.3
1.1
1.0
0.9
Expo
sure
to a
sbes
tos
Mes
othe
liom
a12
703
20 5
6723
104
0.3
0.4
0.4
0.2
0.3
0.3
327
763
476
621
513
810
7.79.
49.
45.
46.
96.
9
Expo
sure
to a
rsen
ic
Trac
hea,
bro
nchu
s an
d lu
ng ca
ncer
s5
651
6 89
37
589
0.1
0.1
0.1
0.1
0.1
0.1
183
316
218
684
236
361
4.3
4.3
4.3
3.0
3.2
3.2
Expo
sure
to b
enze
neLe
ukae
mia
1 17
51
304
1 45
20.
00.
00.
00.
00.
00.
073
681
76 9
4785
022
1.7
1.5
1.6
1.2
1.1
1.1
Expo
sure
to b
eryl
lium
Tr
ache
a, b
ronc
hus
and
lung
canc
ers
101
138
165
0.0
0.0
0.0
0.0
0.0
0.0
4 97
16
442
7 18
10.
10.
10.
10.
10.
10.
1
Expo
sure
to ca
dmiu
mTr
ache
a, b
ronc
hus
and
lung
canc
ers
279
392
452
0.0
0.0
0.0
0.0
0.0
0.0
11 6
9615
292
17 1
720.
30.
30.
30.
20.
20.
2
Expo
sure
to c
hrom
ium
Trac
hea,
bro
nchu
s an
d lu
ng ca
ncer
s62
088
41
022
0.0
0.0
0.0
0.0
0.0
0.0
23 8
8831
779
36 0
590.
60.
60.
70.
40.
50.
5
Expo
sure
to d
iese
l eng
ine
exha
ust
Trac
hea,
bro
nchu
s an
d lu
ng ca
ncer
s9
116
12 7
0914
728
0.2
0.3
0.3
0.1
0.2
0.2
303
473
410
674
470
650
7.18.
18.
65.
05.
96.
3
Expo
sure
to fo
rmal
dehy
deNa
soph
aryn
x ca
ncer
263
294
327
0.0
0.0
0.0
0.0
0.0
0.0
16 0
8216
894
18 0
560.
40.
30.
30.
30.
20.
2
Expo
sure
to fo
rmal
dehy
deLe
ukae
mia
350
372
416
0.0
0.0
0.0
0.0
0.0
0.0
26 6
5726
912
29 1
430.
60.
50.
50.
40.
40.
4
Expo
sure
to n
icke
lTr
ache
a, b
ronc
hus
and
lung
canc
ers
5 44
96
641
7 30
10.
10.
10.
10.
10.
10.
1 1
78 8
8121
2 86
022
9 98
04.
24.
24.
22.
93.
13.
1
Expo
sure
to p
olyc
yclic
aro
mat
ic h
ydro
carb
ons
Trac
hea,
bro
nchu
s an
d lu
ng ca
ncer
s2
428
3 36
43
881
0.1
0.1
0.1
0.0
0.0
0.1
84 0
8111
1 82
312
6 90
02.
02.
22.
31.
41.
61.
7
Expo
sure
to s
ilica
Trac
hea,
bro
nchu
s an
d lu
ng ca
ncer
s31
910
38 6
0842
258
0.7
0.8
0.8
0.5
0.6
0.6
1 02
2 98
11
207
501
1 30
2 91
724
.023
.923
.816
.817
.517
.6
Expo
sure
to s
ulph
uric
aci
dLa
rynx
canc
er2
227
2 30
32
564
0.1
0.0
0.0
0.0
0.0
0.0
81 7
8383
960
91 6
361.
91.
71.
71.
31.
21.
2
Expo
sure
to tr
ichl
oroe
thyl
ene
Kidn
ey ca
ncer
618
250.
00.
00.
00.
00.
00.
01
249
1 87
72
343
0.0
0.0
0.0
0.0
0.0
0.0
Occu
patio
nal a
sthm
agen
sAs
thm
a35
293
30 5
6829
641
0.8
0.6
0.5
0.6
0.4
0.4
2 10
6 62
82
050
770
2 10
4 42
949
.440
.638
.434
.529
.728
.4
Occu
patio
nal p
artic
ulat
e m
atte
r, gas
es a
nd fu
mes
Chro
nic
obst
ruct
ive
pulm
onar
y di
seas
e47
3 72
543
1 99
245
0 38
111
.18.
68.
27.8
6.2
6.1
11 0
53 9
3510
335
238
10 8
55 1
0325
9.4
204.
819
7.918
1.1
149.
514
6.3
Occu
patio
nal n
oise
Othe
r hea
ring
loss
00
00.
00.
00.
00.
00.
00.
05
917
732
7 28
0 57
68
164
140
138.
914
4.3
148.
997
.010
5.3
110.
0
Occu
patio
nal i
njur
ies
Pede
stria
n ro
ad in
jurie
s78
790
72 0
3272
157
1.8
1.4
1.3
1.3
1.0
1.0
4 54
7 16
54
214
378
4 24
4 76
810
6.7
83.5
77.4
74.5
61.0
57.2
Occu
patio
nal i
njur
ies
Cycl
ist r
oad
inju
ries
10 9
1510
521
12 0
180.
30.
20.
20.
20.
20.
278
1 66
280
2 97
393
2 51
418
.315
.917
.012
.811
.612
.6
Occu
patio
nal i
njur
ies
Mot
orcy
clis
t roa
d in
jurie
s41
945
44 3
1148
151
1.0
0.9
0.9
0.7
0.6
0.6
2 80
5 09
42
988
019
3 24
9 27
765
.859
.259
.246
.043
.243
.8
Occu
patio
nal i
njur
ies
Mot
or v
ehic
le ro
ad in
jurie
s67
879
70 2
6876
946
1.6
1.4
1.4
1.1
1.0
1.0
4 12
0 50
14
261
916
4 63
9 83
396
.784
.584
.667
.561
.662
.5
Occu
patio
nal i
njur
ies
Othe
r roa
d in
jurie
s1
764
1 80
71
859
0.0
0.0
0.0
0.0
0.0
0.0
172
682
198
907
231
259
4.1
3.9
4.2
2.8
2.9
3.1
Occu
patio
nal i
njur
ies
Othe
r tra
nspo
rt in
jurie
s21
597
17 7
9716
864
0.5
0.4
0.3
0.4
0.3
0.2
1 86
8 38
01
587
934
1 58
4 94
043
.831
.528
.930
.623
.021
.4
ANNEXES 57
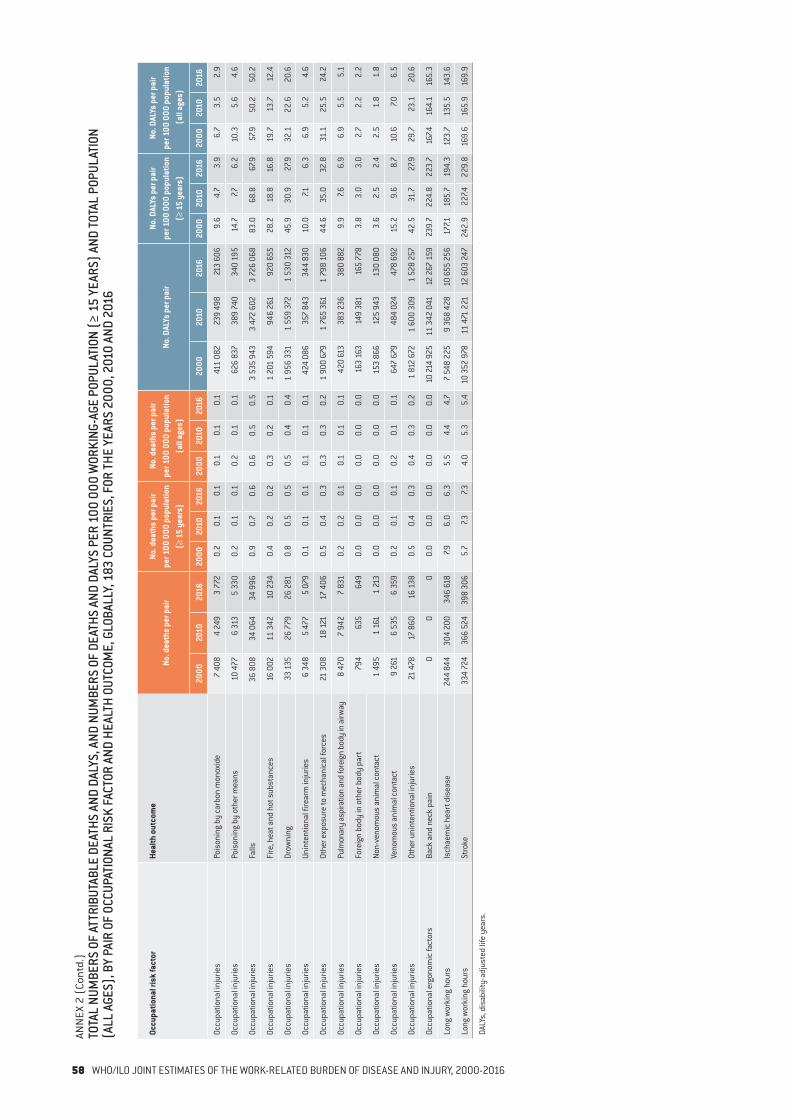
Occu
patio
nal r
isk
fact
orHe
alth
out
com
eNo
. dea
ths
per p
air
No. d
eath
s pe
r pai
r pe
r 100
000
pop
ulat
ion
(≥ 1
5 ye
ars)
No. d
eath
s pe
r pai
r pe
r 100
000
pop
ulat
ion
(all
ages
)No
. DAL
Ys p
er p
air
No. D
ALYs
per
pai
r pe
r 100
000
pop
ulat
ion
(≥ 1
5 ye
ars)
No. D
ALYs
per
pai
r pe
r 100
000
pop
ulat
ion
(all
ages
)
2000
2010
2016
2000
2010
2016
2000
2010
2016
2000
2010
2016
2000
2010
2016
2000
2010
2016
Occu
patio
nal i
njur
ies
Pois
onin
g by
carb
on m
onox
ide
7 40
84
249
3 77
20.
20.
10.
10.
10.
10.
141
1 08
223
9 49
821
3 60
69.
64.
73.
96.
73.
52.
9
Occu
patio
nal i
njur
ies
Pois
onin
g by
oth
er m
eans
10 4
776
313
5 33
00.
20.
10.
10.
20.
10.
162
6 83
738
9 74
034
0 19
514
.77.7
6.2
10.3
5.6
4.6
Occu
patio
nal i
njur
ies
Falls
36 8
0834
064
34 9
960.
90.
70.
60.
60.
50.
53
535
943
3 47
2 60
23
726
068
83.0
68.8
67.9
57.9
50.2
50.2
Occu
patio
nal i
njur
ies
Fire
, hea
t and
hot
sub
stan
ces
16 0
0211
342
10 2
340.
40.
20.
20.
30.
20.
11
201
594
946
261
920
655
28.2
18.8
16.8
19.7
13.7
12.4
Occu
patio
nal i
njur
ies
Drow
ning
33 1
3526
779
26 2
810.
80.
50.
50.
50.
40.
41
956
331
1 55
9 37
21
530
312
45.9
30.9
27.9
32.1
22.6
20.6
Occu
patio
nal i
njur
ies
Unin
tent
iona
l fire
arm
inju
ries
6 34
85
477
5 07
90.
10.
10.
10.
10.
10.
142
4 08
635
7 84
334
4 83
010
.07.1
6.3
6.9
5.2
4.6
Occu
patio
nal i
njur
ies
Othe
r exp
osur
e to
mec
hani
cal f
orce
s21
308
18 1
2117
406
0.5
0.4
0.3
0.3
0.3
0.2
1 90
0 67
91
765
361
1 79
8 10
644
.635
.032
.831
.125
.524
.2
Occu
patio
nal i
njur
ies
Pulm
onar
y as
pira
tion
and
fore
ign
body
in a
irway
8 47
07
942
7 83
10.
20.
20.
10.
10.
10.
142
0 61
338
3 23
638
0 88
29.
97.6
6.9
6.9
5.5
5.1
Occu
patio
nal i
njur
ies
Fore
ign
body
in o
ther
bod
y pa
rt79
463
564
90.
00.
00.
00.
00.
00.
016
3 16
314
9 38
116
5 77
83.
83.
03.
02.
72.
22.
2
Occu
patio
nal i
njur
ies
Non-
veno
mou
s an
imal
con
tact
1 49
51
161
1 21
30.
00.
00.
00.
00.
00.
015
3 86
612
5 94
313
0 08
03.
62.
52.
42.
51.
81.
8
Occu
patio
nal i
njur
ies
Veno
mou
s an
imal
con
tact
9 26
16
535
6 35
90.
20.
10.
10.
20.
10.
164
7 67
948
4 02
447
8 69
215
.29.
68.
710
.67.0
6.5
Occu
patio
nal i
njur
ies
Othe
r uni
nten
tiona
l inj
urie
s21
478
17 8
6016
138
0.5
0.4
0.3
0.4
0.3
0.2
1 81
2 67
21
600
309
1 52
8 25
742
.531
.727
.929
.723
.120
.6
Occu
patio
nal e
rgon
omic
fact
ors
Back
and
nec
k pa
in0
00
0.0
0.0
0.0
0.0
0.0
0.0
10 21
4 92
511
342
041
12 2
67 1
5923
9.7
224.
822
3.7
167.4
164.
116
5.3
Long
wor
king
hou
rsIs
chae
mic
hea
rt d
isea
se24
4 84
430
4 20
034
6 61
87.9
6.0
6.3
5.5
4.4
4.7
7 54
8 22
59
368
428
10 6
55 2
5617
7.118
5.7
194.
312
3.7
135.
514
3.6
Long
wor
king
hou
rsSt
roke
334
724
366
524
398
306
5.7
7.37.3
4.0
5.3
5.4
10 3
52 9
7811
471
221
12 6
03 2
4724
2.9
227.4
229.
816
9.6
165.
916
9.9
DALY
s, d
isab
ility
-adj
uste
d lif
e ye
ars.
ANN
EX 2
(Co
ntd.
)TO
TAL
NUM
BERS
OF
ATTR
IBUT
ABLE
DEA
THS
AND
DALY
S, A
ND N
UMBE
RS O
F DE
ATHS
AND
DAL
YS P
ER 1
00 0
00 W
ORKI
NG-A
GE P
OPUL
ATIO
N (≥
15
YEAR
S) A
ND TO
TAL
POPU
LATI
ON
(ALL
AGE
S), B
Y PA
IR O
F OC
CUPA
TION
AL R
ISK
FACT
OR A
ND H
EALT
H OU
TCOM
E, G
LOBA
LLY,
183
COU
NTRI
ES, F
OR TH
E YE
ARS
2000
, 201
0 AN
D 20
16
58 WHO/ILO JOINT ESTIMATES OF THE WORK-RELATED BURDEN OF DISEASE AND INJURY, 2000-2016
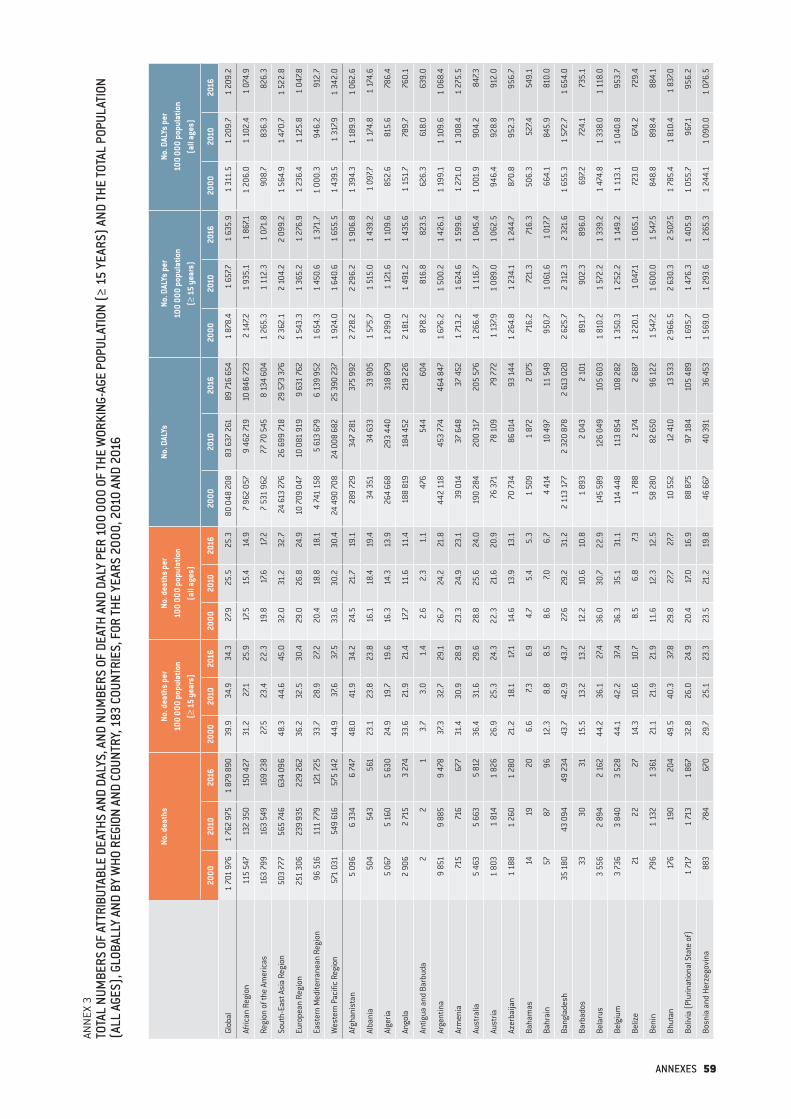
ANN
EX 3
TOTA
L NU
MBE
RS O
F AT
TRIB
UTAB
LE D
EATH
S AN
D DA
LYS,
AND
NUM
BERS
OF
DEAT
H AN
D DA
LY P
ER 1
00 0
00 O
F TH
E W
ORKI
NG-A
GE P
OPUL
ATIO
N (≥
15
YEAR
S) A
ND TH
E TO
TAL
POPU
LATI
ON
(ALL
AGE
S), G
LOBA
LLY
AND
BY W
HO R
EGIO
N AN
D CO
UNTR
Y, 1
83 C
OUNT
RIES
, FOR
THE
YEAR
S 20
00, 2
010
AND
2016
No. d
eath
sNo
. dea
ths
per
100
000
popu
latio
n
(≥ 1
5 ye
ars)
No. d
eath
s pe
r 10
0 00
0 po
pula
tion
(a
ll ag
es)
No. D
ALYs
No. D
ALYs
per
10
0 00
0 po
pula
tion
(≥
15
year
s)
No. D
ALYs
per
10
0 00
0 po
pula
tion
(a
ll ag
es)
2000
2010
2016
2000
2010
2016
2000
2010
2016
2000
2010
2016
2000
2010
2016
2000
2010
2016
Glob
al1
701
976
1 76
2 97
51
879
890
39.9
34.9
34.3
27.9
25.5
25.3
80 0
48 2
0883
637
261
89 71
6 65
41
878.
41
657.7
1 63
5.9
1 31
1.5
1 20
9.7
1 20
9.2
Afric
an R
egio
n11
5 54
713
2 35
015
0 42
731
.227
.125
.917
.515
.414
.97
962
057
9 46
2 71
910
846
723
2 14
7.21
935.
11
867.1
1 20
6.0
1 10
2.4
1 07
4.9
Regi
on o
f the
Am
eric
as16
3 79
916
3 54
916
9 23
827
.523
.422
.319
.817
.617
.27
531
962
77 7
0 54
58
134
604
1 26
5.3
1 11
2.3
1 07
1.8
908
.783
6.3
826.
3
Sout
h-Ea
st A
sia
Regi
on50
3 77
756
5 74
663
4 09
648
.344
.645
.032
.031
.232
.724
613
276
26 6
99 71
829
573
376
2 36
2.1
2 10
4.2
2 09
9.2
1 56
4.9
1 47
0.7
1 52
2.8
Euro
pean
Reg
ion
251
306
239
935
229
262
36.2
32.5
30.4
29.0
26.8
24.9
10 7
09 0
4710
081
919
9 63
1 76
21
543.
31
365.
21
276.
91
236.
41
125.
81
047.8
East
ern
Med
iterr
anea
n Re
gion
96 5
1611
1 77
912
1 72
533
.728
.927
.220
.418
.818
.14
741
158
5 61
3 67
96
139
952
1 65
4.3
1 45
0.6
1 37
1.7
1 00
0.3
946.
291
2.7
Wes
tern
Pac
ific
Regi
on57
1 03
154
9 61
657
5 14
244
.937
.637
.533
.630
.230
.424
490
708
24 0
08 6
8225
390
237
1 92
4.0
1 64
0.6
1 65
5.5
1 43
9.5
1 31
7.91
342.
0
Afgh
anis
tan
5 09
66
334
6 74
748
.041
.934
.224
.521
.719
.128
9 72
934
7 28
137
5 99
22
728.
22
296.
21
906.
81
394.
31
189.
91
062.
6
Alba
nia
504
543
561
23.1
23.8
23.8
16.1
18.4
19.4
34 3
5134
633
33 9
051
575.
71
515.
01
439.
21
097.7
1 17
4.8
1 17
4.6
Alge
ria5
067
5 16
05
630
24.9
19.7
19.6
16.3
14.3
13.9
264
668
293
440
318
879
1 29
9.0
1 12
1.6
1 10
9.6
852.
681
5.6
786.
4
Ango
la2
906
2 71
53
274
33.6
21.9
21.4
17.7
11.6
11.4
188
819
184
452
219
226
2 18
1.2
1 49
1.2
1 43
5.6
1 15
1.7
789.
776
0.1
Antig
ua a
nd B
arbu
da2
21
3.7
3.0
1.4
2.6
2.3
1.1
476
544
604
878
.281
6.8
823.
562
6.3
618.
063
9.0
Arge
ntin
a9
851
9 88
59
478
37.3
32.7
29.1
26.7
24.2
21.8
442
118
453
774
464
847
1 67
6.2
1 50
0.2
1 42
6.1
1 19
9.1
1 10
9.6
1 06
8.4
Arm
enia
715
716
677
31.4
30.9
28.9
23.3
24.9
23.1
39 0
1437
648
37 4
521
713.
21
624.
61
599.
61
271.
01
308.
41
275.
5
Aust
ralia
5 46
35
663
5 81
236
.431
.629
.628
.825
.624
.019
0 28
420
0 31
720
5 57
61
266.
41
116.
71
045.
41
001.
990
4.2
847.3
Aust
ria1
803
1 81
41
826
26.9
25.3
24.3
22.3
21.6
20.9
76 3
7178
109
79 7
721
137.9
1 08
9.0
1 06
2.5
946.
492
8.8
912.
0
Azer
baija
n1
188
1 26
01
280
21.2
18.1
17.1
14.6
13.9
13.1
70 7
3486
014
93 1
441
264.
81
234.
11
244.
787
0.8
952.
395
6.7
Baha
mas
1419
206.
67.3
6.9
4.7
5.4
5.3
1 50
91
872
2 07
571
6.2
721.
371
6.3
506.
352
7.454
9.1
Bahr
ain
5787
9612
.38.
88.
58.
67.0
6.7
4 41
410
497
11 5
4995
0.7
1 06
1.6
1 01
7.766
4.1
845.
981
0.0
Bang
lade
sh35
180
43 0
9449
234
43.7
42.9
43.7
27.6
29.2
31.2
2 11
3 17
72
320
878
2 61
3 02
02
625.
72
312.
32
321.
61
655.
31
572.
71
654.
0
Barb
ados
3330
3115
.513
.213
.212
.210
.610
.81
893
2 04
32
101
891.
790
2.3
896.
069
7.272
4.1
735.
1
Bela
rus
3 55
62
894
2 16
244
.236
.127
.436
.030
.722
.914
5 58
912
6 04
910
5 60
31
810.
21
572.
21
339.
21
474.
81
338.
01
118.
0
Belg
ium
3 73
63
840
3 52
844
.142
.237
.436
.335
.131
.111
4 44
811
3 85
410
8 28
21
350.
31
252.
21
149.
21
113.
11
040.
895
3.7
Beliz
e21
2227
14.3
10.6
10.7
8.5
6.8
7.31
788
2 17
42
687
1 22
0.1
1 04
7.11
065.
172
3.0
674.
272
9.4
Beni
n79
61
132
1 3
6121
.121
.921
.911
.612
.312
.558
280
82 6
5096
122
1 54
7.21
600.
01
547.5
848.
889
8.4
884.
1
Bhut
an17
619
020
449
.540
.337
.829
.827
.727
.710
552
12 4
1013
533
2 96
6.5
2 63
0.3
2 50
7.51
785.
41
810.
41
837.0
Boliv
ia (P
lurin
atio
nal S
tate
of)
1 71
71
713
1 86
732
.826
.024
.920
.417
.016
.988
875
97 1
8410
5 48
91
695.
71
476.
31
405.
91
055.
796
7.195
6.2
Bosn
ia a
nd H
erze
govi
na88
378
467
029
.725
.123
.323
.521
.219
.846
667
40 3
91 3
6 45
31
569.
01
293.
61
265.
31
244.
11
090.
01
076.
5
ANNEXES 59
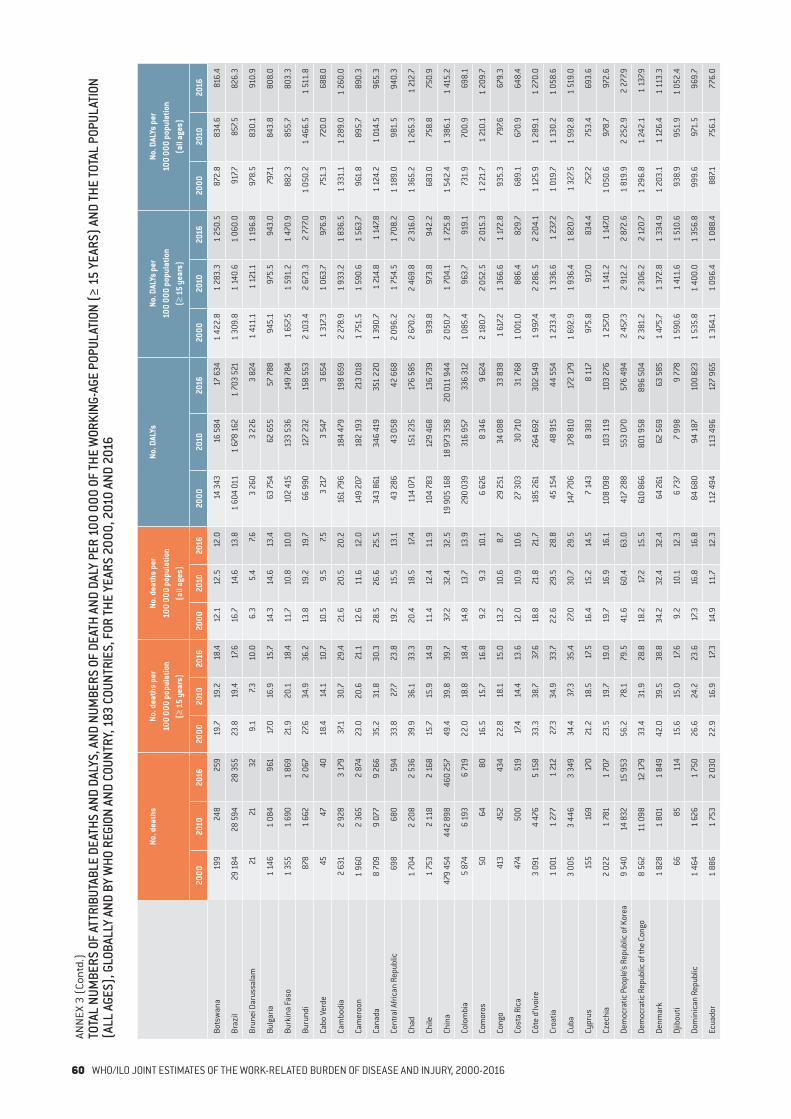
ANN
EX 3
(Co
ntd.
)TO
TAL
NUM
BERS
OF
ATTR
IBUT
ABLE
DEA
THS
AND
DALY
S, A
ND N
UMBE
RS O
F DE
ATH
AND
DALY
PER
100
000
OF
THE
WOR
KING
-AGE
POP
ULAT
ION
(≥ 1
5 YE
ARS)
AND
THE
TOTA
L PO
PULA
TION
(A
LL A
GES)
, GLO
BALL
Y AN
D BY
WHO
REG
ION
AND
COUN
TRY,
183
COU
NTRI
ES, F
OR TH
E YE
ARS
2000
, 201
0 AN
D 20
16
No. d
eath
sNo
. dea
ths
per
100
000
popu
latio
n
(≥ 1
5 ye
ars)
No. d
eath
s pe
r 10
0 00
0 po
pula
tion
(a
ll ag
es)
No. D
ALYs
No. D
ALYs
per
10
0 00
0 po
pula
tion
(≥
15
year
s)
No. D
ALYs
per
10
0 00
0 po
pula
tion
(a
ll ag
es)
2000
2010
2016
2000
2010
2016
2000
2010
2016
2000
2010
2016
2000
2010
2016
2000
2010
2016
Bots
wan
a19
924
825
919
.719
.218
.412
.112
.512
.014
343
16 5
8417
634
1 42
2.8
1 28
3.3
1 25
0.5
872.
883
4.6
816.
4
Braz
il29
184
28 5
9428
355
23.8
19.4
17.6
16.7
14.6
13.8
1 60
4 01
11
678
162
1 70
3 52
11
309.
81
140.
61
060.
091
7.785
7.582
6.3
Brun
ei D
arus
sala
m21
2132
9.1
7.310
.06.
35.
47.6
3 26
03
226
3 82
41
411.
11
121.
11
196.
897
8.5
830.
191
0.9
Bulg
aria
1 14
61
084
961
17.0
16.9
15.7
14.3
14.6
13.4
63 7
5462
655
57 7
8894
5.1
975.
594
3.0
797.1
843.
880
8.0
Burk
ina
Faso
1 35
51
690
1 86
921
.920
.118
.411
.710
.810
.010
2 41
513
3 53
614
9 78
41
657.5
1 59
1.2
1 47
0.9
882.
385
5.7
803.
3
Buru
ndi
878
1 66
22
067
27.6
34.9
36.2
13.8
19.2
19.7
66 9
9012
7 23
215
8 55
32
103.
42
673.
32
777.0
1 05
0.2
1 46
6.5
1 51
1.8
Cabo
Ver
de45
4740
18.4
14.1
10.7
10.5
9.5
7.53
217
3 54
73
654
1 31
7.31
063.
7 9
76.9
751.
372
0.0
688.
0
Cam
bodi
a2
631
2 92
83
179
37.1
30.7
29.4
21.6
20.5
20.2
161
796
184
479
198
659
2 27
8.9
1 93
3.2
1 83
6.5
1 33
1.1
1 28
9.0
1 26
0.0
Cam
eroo
n1
960
2 36
52
874
23.0
20.6
21.1
12.6
11.6
12.0
149
207
182
193
213
018
1 75
1.5
1 59
0.6
1 56
3.7
961.
889
5.7
890.
3
Cana
da8
709
9 07
79
266
35.2
31.8
30.3
28.5
26.6
25.5
343
861
346
419
351
220
1 39
0.7
1 21
4.8
1 14
7.81
124.
21
014.
596
5.3
Cent
ral A
frica
n Re
publ
ic69
868
059
433
.827
.723
.819
.215
.513
.143
286
43
058
42 6
682
096.
21
754.
51
708.
21
189.
098
1.5
940.
3
Chad
1 70
42
208
2 53
639
.936
.133
.320
.418
.517
.411
4 07
115
1 23
517
6 58
52
670.
22
469.
82
316.
01
365.
21
265.
31
212.
7
Chile
1 75
32
118
2 16
815
.715
.914
.911
.412
.411
.910
4 78
312
9 46
813
6 73
993
9.8
973.
894
2.2
683.
075
8.8
750.
9
Chin
a47
9 45
444
2 89
846
0 25
749
.439
.839
.737
.232
.432
.519
905
168
18 9
73 3
5820
011
944
2 05
0.7
1 70
4.1
1 72
5.8
1 54
2.4
1 38
6.1
1 41
5.2
Colo
mbi
a5
874
6 19
36
719
22.0
18.8
18.4
14.8
13.7
13.9
290
039
316
957
336
312
1 08
5.4
963.
791
9.1
731.
970
0.9
698.
1
Com
oros
5064
8016
.515
.716
.89.
29.
310
.16
626
8 34
69
624
2 18
0.7
2 05
2.5
2 01
5.3
1 22
1.7
1 21
0.1
1 20
9.7
Cong
o41
345
243
422
.818
.115
.013
.210
.68.
729
251
34 0
8833
838
1 61
7.21
366.
61
172.
893
5.3
797.6
679.
3
Cost
a Ri
ca47
450
051
917
.414
.413
.612
.010
.910
.627
303
30 71
031
768
1 00
1.0
886
.4 8
29.7
689.
167
0.9
648.
4
Côte
d’Iv
oire
3 09
14
476
5 15
833
.338
.737
.618
.821
.821
.718
5 26
126
4 69
230
2 54
91
997.4
2 28
6.5
2 20
4.1
1 12
5.9
1 28
9.1
1 27
0.0
Croa
tia1
001
1 27
71
212
27.3
34.9
33.7
22.6
29.5
28.8
45 1
5448
915
44 5
541
233.
41
336.
61
237.2
1 01
9.7
1 13
0.2
1 05
8.6
Cuba
3 00
53
446
3 34
934
.437
.335
.427
.030
.729
.514
7 70
617
8 81
017
2 17
91
692.
91
936.
41
820.
71
327.5
1 59
2.8
1 51
9.0
Cypr
us15
516
917
021
.218
.517
.516
.415
.214
.57
143
8 38
38
117
975.
891
7.083
4.4
757.2
753.
469
3.6
Czec
hia
2 02
21
781
1 70
723
.519
.719
.019
.716
.916
.110
8 09
810
3 11
910
3 27
61
257.0
1 14
1.2
1 14
7.01
050.
697
8.7
972.
6
Dem
ocra
tic P
eopl
e’s R
epub
lic o
f Kor
ea9
540
14 8
3215
953
56.2
78.1
79.5
41.6
60.4
63.0
417
288
553
070
576
494
2 45
7.32
912.
22
872.
61
819.
92
252.
92
277.9
Dem
ocra
tic R
epub
lic o
f the
Con
go8
562
11 0
9812
179
33.4
31.9
28.8
18.2
17.2
15.5
610
866
801
958
896
504
2 38
1.2
2 30
6.2
2 12
0.7
1 29
6.8
1 24
2.1
1 13
7.9
Denm
ark
1 82
81
801
1 84
942
.039
.538
.834
.232
.432
.464
261
62 5
6963
585
1 47
5.7
1 37
2.8
1 33
4.9
1 20
3.1
1 12
6.4
1 11
3.3
Djib
outi
6685
114
15.6
15.0
17.6
9.2
10.1
12.3
6 73
77
998
9 77
81
590.
61
411.
61
510.
693
8.9
951.
91
052.
4
Dom
inic
an R
epub
lic1
464
1 62
61
750
26.6
24.2
23.6
17.3
16.8
16.8
84 6
8094
187
100
823
1 53
5.8
1 40
0.0
1 35
6.8
999.
697
1.5
969.
7
Ecua
dor
1 88
61
753
2 03
022
.916
.917
.314
.911
.712
.311
2 49
411
3 49
612
7 96
51
364.
11
096.
41
088.
488
7.175
6.1
776.
0
60 WHO/ILO JOINT ESTIMATES OF THE WORK-RELATED BURDEN OF DISEASE AND INJURY, 2000-2016
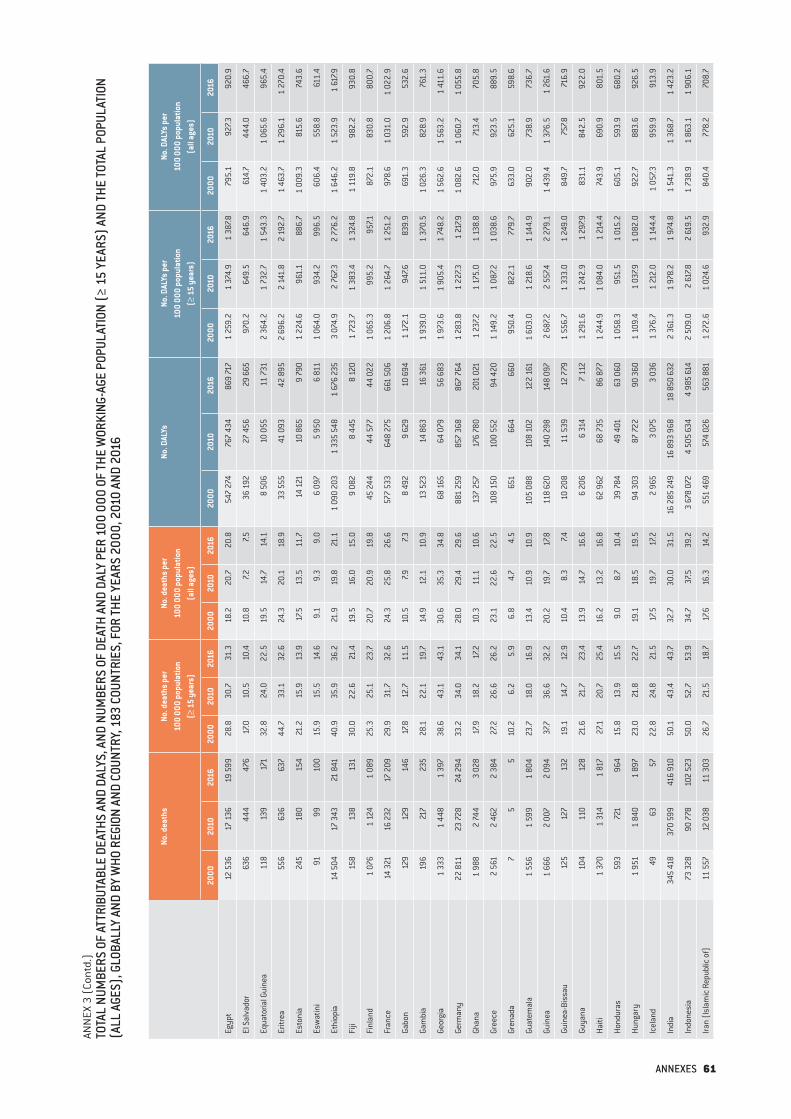
ANN
EX 3
(Co
ntd.
)TO
TAL
NUM
BERS
OF
ATTR
IBUT
ABLE
DEA
THS
AND
DALY
S, A
ND N
UMBE
RS O
F DE
ATH
AND
DALY
PER
100
000
OF
THE
WOR
KING
-AGE
POP
ULAT
ION
(≥ 1
5 YE
ARS)
AND
THE
TOTA
L PO
PULA
TION
(A
LL A
GES)
, GLO
BALL
Y AN
D BY
WHO
REG
ION
AND
COUN
TRY,
183
COU
NTRI
ES, F
OR TH
E YE
ARS
2000
, 201
0 AN
D 20
16
No. d
eath
sNo
. dea
ths
per
100
000
popu
latio
n
(≥ 1
5 ye
ars)
No. d
eath
s pe
r 10
0 00
0 po
pula
tion
(a
ll ag
es)
No. D
ALYs
No. D
ALYs
per
10
0 00
0 po
pula
tion
(≥
15
year
s)
No. D
ALYs
per
10
0 00
0 po
pula
tion
(a
ll ag
es)
2000
2010
2016
2000
2010
2016
2000
2010
2016
2000
2010
2016
2000
2010
2016
2000
2010
2016
Egyp
t12
536
17 1
3619
599
28.8
30.7
31.3
18.2
20.7
20.8
547
274
767
434
869
717
1 25
9.2
1 37
4.9
1 38
7.879
5.1
927.3
920.
9
El S
alva
dor
636
444
476
17.0
10.5
10.4
10.8
7.27.5
36 1
9227
456
29 6
6597
0.2
649.
564
6.9
614.
744
4.0
466.
7
Equa
toria
l Gui
nea
118
139
171
32.8
24.0
22.5
19.5
14.7
14.1
8 50
610
055
11 7
312
364.
21
732.
71
543.
31
403.
21
065.
696
5.4
Eritr
ea55
663
663
744
.733
.132
.624
.320
.118
.933
555
41 0
9342
895
2 69
6.2
2 14
1.8
2 19
2.7
1 46
3.7
1 29
6.1
1 27
0.4
Esto
nia
245
180
154
21.2
15.9
13.9
17.5
13.5
11.7
14 1
2110
865
9 7
901
224.
696
1.1
886.
71
009.
381
5.6
743.
6
Esw
atin
i91
9910
015
.915
.514
.69.
19.
39.
06
097
5 95
06
811
1 06
4.0
934.
299
6.5
606
.455
8.8
611.
4
Ethi
opia
14 5
0417
343
21 8
4140
.935
.936
.221
.919
.821
.11
090
203
1 33
5 54
81
676
235
3 07
4.9
2 76
7.32
776.
21
646.
21
523.
91
617.9
Fiji
158
138
131
30.0
22.6
21.4
19.5
16.0
15.0
9 08
28
445
8 12
01
723.
71
383.
41
324.
81
119.
898
2.2
930.
8
Finl
and
1 07
61
124
1 08
925
.325
.123
.720
.720
.919
.845
244
44 5
7744
022
1 06
5.3
995.
2 9
57.1
872.
183
0.8
800.
7
Fran
ce14
321
16 2
3217
209
29.9
31.7
32.6
24.3
25.8
26.6
577
533
648
275
661
506
1 20
6.8
1 26
4.7
1 25
1.2
978.
61
031.
01
022.
9
Gabo
n12
912
914
617
.812
.711
.510
.57.9
7.38
492
9 62
910
694
1 17
2.1
947.6
839.
969
1.3
592.
953
2.6
Gam
bia
196
217
235
28.1
22.1
19.7
14.9
12.1
10.9
13 5
2314
863
16 3
611
939.
01
511.
01
370.
51
026.
382
8.9
761.
3
Geor
gia
1 33
31
448
1 39
738
.643
.143
.130
.635
.334
.868
165
64 0
7956
683
1 97
3.6
1 90
5.4
1 74
8.2
1 56
2.6
1 56
3.2
1 41
1.6
Germ
any
22 8
1123
728
24 2
9433
.234
.034
.128
.029
.429
.688
1 25
985
7 36
886
7 76
41
283.
81
227.3
1 21
7.91
082.
61
060.
71
055.
8
Ghan
a1
988
2 74
43
028
17.9
18.2
17.2
10.3
11.1
10.6
137
257
176
780
201
021
1 23
7.21
175.
01
138.
871
2.0
713.
470
5.8
Gree
ce2
561
2 46
22
384
27.2
26.6
26.2
23.1
22.6
22.5
108
150
100
552
94 4
201
149.
21
087.2
1 03
8.6
975.
992
3.5
889.
5
Gren
ada
75
510
.26.
25.
96.
84.
74.
565
166
4 6
6095
0.4
822.
177
9.7
633.
062
5.1
598.
6
Guat
emal
a1
556
1 59
91
804
23.7
18.0
16.9
13.4
10.9
10.9
105
088
108
102
122
161
1 60
3.0
1 21
8.6
1 14
4.9
902.
073
8.9
736.
7
Guin
ea1
666
2 00
72
094
37.7
36.6
32.2
20.2
19.7
17.8
118
620
140
298
148
097
2 68
7.22
557.4
2 27
9.1
1 43
9.4
1 37
6.5
1 26
1.6
Guin
ea-B
issa
u12
512
713
219
.114
.712
.910
.48.
37.4
10 2
0811
539
12 7
791
556.
71
333.
01
249.
084
9.7
757.8
716.
9
Guya
na10
411
012
821
.621
.723
.413
.914
.716
.66
206
6 31
47
112
1 29
1.6
1 24
2.9
1 29
7.983
1.1
842.
592
2.0
Haiti
1 37
01
314
1 81
727
.120
.725
.416
.213
.216
.862
962
68
735
86 8
771
244.
91
084.
01
214.
474
3.9
690.
980
1.5
Hond
uras
593
721
964
15.8
13.9
15.5
9.0
8.7
10.4
39 7
8449
401
63 0
601
058.
395
1.5
1 01
5.2
605.
159
3.9
680.
2
Hung
ary
1 95
11
840
1 89
723
.021
.822
.719
.118
.519
.594
303
87
722
90 3
601
109.
41
037.9
1 08
2.0
922.
788
3.6
926.
5
Icel
and
4963
5722
.824
.821
.517
.519
.717
.22
965
3 07
53
036
1 37
6.7
1 21
2.0
1 14
4.4
1 05
7.395
9.9
913.
9
Indi
a34
5 41
837
0 59
941
6 91
050
.143
.443
.732
.730
.031
.516
285
249
16 8
93 9
6818
850
632
2 36
1.3
1 97
8.2
1 97
4.8
1 54
1.3
1 36
8.7
1 42
3.2
Indo
nesi
a73
328
90 7
7810
2 52
350
.052
.753
.934
.737
.539
.23
678
072
4 50
5 63
44
985
614
2 50
9.0
2 61
7.82
619.
51
738.
91
863.
11
906.
1
Iran
(Isl
amic
Rep
ublic
of)
11 5
5712
038
11 3
0326
.721
.518
.717
.616
.314
.255
1 46
957
4 02
656
3 88
11
272.
61
024.
693
2.9
840.
477
8.2
708.
7
ANNEXES 61
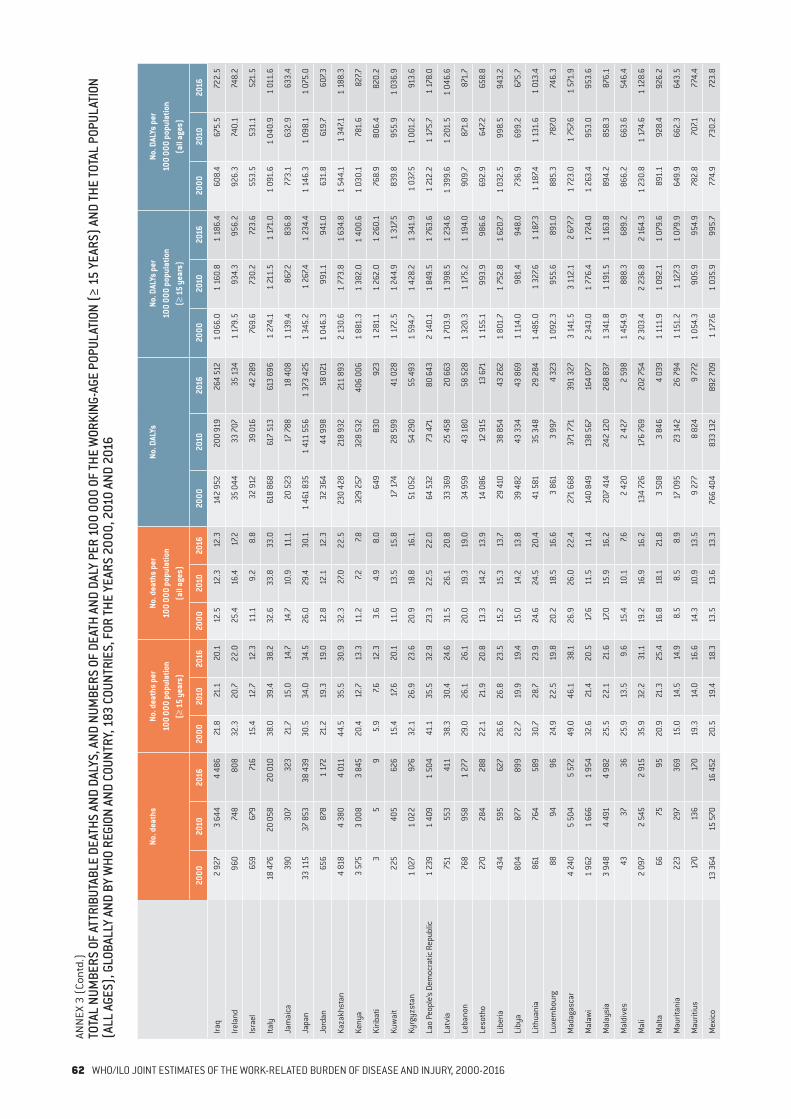
ANN
EX 3
(Co
ntd.
)TO
TAL
NUM
BERS
OF
ATTR
IBUT
ABLE
DEA
THS
AND
DALY
S, A
ND N
UMBE
RS O
F DE
ATH
AND
DALY
PER
100
000
OF
THE
WOR
KING
-AGE
POP
ULAT
ION
(≥ 1
5 YE
ARS)
AND
THE
TOTA
L PO
PULA
TION
(A
LL A
GES)
, GLO
BALL
Y AN
D BY
WHO
REG
ION
AND
COUN
TRY,
183
COU
NTRI
ES, F
OR TH
E YE
ARS
2000
, 201
0 AN
D 20
16
No. d
eath
sNo
. dea
ths
per
100
000
popu
latio
n
(≥ 1
5 ye
ars)
No. d
eath
s pe
r 10
0 00
0 po
pula
tion
(a
ll ag
es)
No. D
ALYs
No. D
ALYs
per
10
0 00
0 po
pula
tion
(≥
15
year
s)
No. D
ALYs
per
10
0 00
0 po
pula
tion
(a
ll ag
es)
2000
2010
2016
2000
2010
2016
2000
2010
2016
2000
2010
2016
2000
2010
2016
2000
2010
2016
Iraq
2 92
73
644
4 48
621
.821
.120
.112
.512
.312
.314
2 95
220
0 91
926
4 51
21
066.
01
160.
81
186.
460
8.4
675.
572
2.5
Irela
nd96
074
880
832
.320
.722
.025
.416
.417
.235
044
33
707
35 1
341
179.
593
4.3
956.
292
6.3
740.
174
8.2
Isra
el65
967
971
615
.412
.712
.311
.19.
28.
832
912
39 0
1642
289
769.
673
0.2
723.
655
3.5
531.
152
1.5
Italy
18 4
7620
058
20 0
1038
.039
.438
.232
.633
.833
.061
8 86
861
7 51
361
3 69
61
274.
11
211.
51
171.
01
091.
61
040.
91
011.
6
Jam
aica
390
307
323
21.7
15.0
14.7
14.7
10.9
11.1
20
523
17 7
8818
408
1 13
9.4
867.2
836.
877
3.1
632.
963
3.4
Japa
n33
115
37 8
5338
439
30.5
34.0
34.5
26.0
29.4
30.1
1 46
1 83
51
411
556
1 37
3 42
51
345.
21
267.4
1 23
4.4
1 14
6.3
1 09
8.1
1 07
5.0
Jord
an65
687
81
172
21.2
19.3
19.0
12.8
12.1
12.3
32 3
6444
998
58 0
211
046.
3 9
91.1
941.
063
1.8
619.
760
7.3
Kaza
khst
an4
818
4 38
04
011
44.5
35.5
30.9
32.3
27.0
22.5
230
428
218
932
211
893
2 13
0.6
1 77
3.8
1 63
4.8
1 54
4.1
1 34
7.11
188.
3
Keny
a3
575
3 00
83
845
20.4
12.7
13.3
11.2
7.27.8
329
257
328
532
406
006
1 88
1.3
1 38
2.0
1 40
0.6
1 03
0.1
781.
682
7.7
Kirib
ati
35
95.
97.6
12.3
3.6
4.9
8.0
649
830
923
1 28
1.1
1 26
2.0
1 26
0.1
768.
980
6.4
820.
2
Kuw
ait
225
405
626
15.4
17.6
20.1
11.0
13.5
15.8
17 1
7428
599
41 0
281
172.
51
244.
91
317.5
839.
895
5.9
1 03
6.9
Kyrg
yzst
an1
027
1 02
297
632
.126
.923
.620
.918
.816
.151
052
54 2
9055
493
1 59
4.7
1 42
8.2
1 34
1.9
1 03
7.51
001.
291
3.6
Lao
Peop
le’s
Dem
ocra
tic R
epub
lic1
239
1 40
91
504
41.1
35.5
32.9
23.3
22.5
22.0
64 5
3273
471
80 6
432
140.
11
849.
51
763.
61
212.
21
175.
71
178.
0
Latv
ia75
155
341
138
.330
.424
.631
.526
.120
.833
369
25 4
5820
663
1 70
3.9
1 39
8.5
1 23
4.6
1 39
9.6
1 20
1.5
1 04
6.6
Leba
non
768
958
1 27
729
.026
.126
.120
.019
.319
.034
959
43 1
8058
528
1 32
0.3
1 17
5.2
1 19
4.0
909.
787
1.8
871.
7
Leso
tho
270
284
288
22.1
21.9
20.8
13.3
14.2
13.9
14 0
8612
915
13 6
711
155.
199
3.9
986.
669
2.9
647.2
658.
8
Libe
ria43
459
562
726
.626
.823
.515
.215
.313
.729
410
38 8
5443
262
1 80
1.7
1 75
2.8
1 62
0.7
1 03
2.5
998.
594
3.2
Liby
a80
487
789
922
.719
.919
.415
.014
.213
.839
482
43 3
3443
869
1 11
4.0
981.
494
8.0
736.
969
9.2
675.
7
Lith
uani
a86
176
458
930
.728
.723
.924
.624
.520
.441
581
35 3
4829
284
1 48
5.0
1 32
7.61
187.3
1 18
7.41
131.
61
013.
4
Luxe
mbo
urg
8894
9624
.922
.519
.820
.218
.516
.63
861
3 9
974
323
1 09
2.3
955
.689
1.0
885.
378
7.074
6.3
Mad
agas
car
4 24
05
504
5 57
249
.046
.138
.126
.926
.022
.427
1 66
837
1 77
139
1 32
73
141.
53
112.
12
677.7
1 72
3.0
1 75
7.61
571.
9
Mal
awi
1 96
21
666
1 95
432
.621
.420
.517
.611
.511
.414
0 84
913
8 56
716
4 07
72
343.
01
776.
41
724.
01
263.
495
3.0
953.
6
Mal
aysi
a3
948
4 49
14
982
25.5
22.1
21.6
17.0
15.9
16.2
207
414
242
120
268
837
1 34
1.8
1 19
1.5
1 16
3.8
894.
285
8.3
876.
1
Mal
dive
s43
3736
25.9
13.5
9.6
15.4
10.1
7.6 2
420
2 42
72
598
1 45
4.9
888.
3 6
89.2
866.
266
3.6
546.
4
Mal
i2
097
2 54
52
915
35.9
32.2
31.1
19.2
16.9
16.2
134
726
176
769
202
754
2 30
3.4
2 23
6.8
2 16
4.3
1 23
0.8
1 17
4.6
1 12
8.6
Mal
ta66
7595
20.9
21.3
25.4
16.8
18.1
21.8
3 50
8 3
846
4 03
91
111.
91
092.
11
079.
689
1.1
928.
492
6.2
Mau
ritan
ia22
329
736
915
.014
.514
.98.
58.
58.
917
095
23 1
4226
794
1 15
1.2
1 12
7.31
079.
964
9.9
662.
364
3.5
Mau
ritiu
s17
013
617
019
.314
.016
.614
.310
.913
.59
277
8 82
49
772
1 05
4.3
905.
995
4.9
782.
870
7.177
4.4
Mex
ico
13 3
6415
570
16 4
5220
.519
.418
.313
.513
.613
.376
6 40
483
3 13
289
2 70
91
177.6
1 03
5.9
995.
777
4.9
730.
272
3.8
62 WHO/ILO JOINT ESTIMATES OF THE WORK-RELATED BURDEN OF DISEASE AND INJURY, 2000-2016
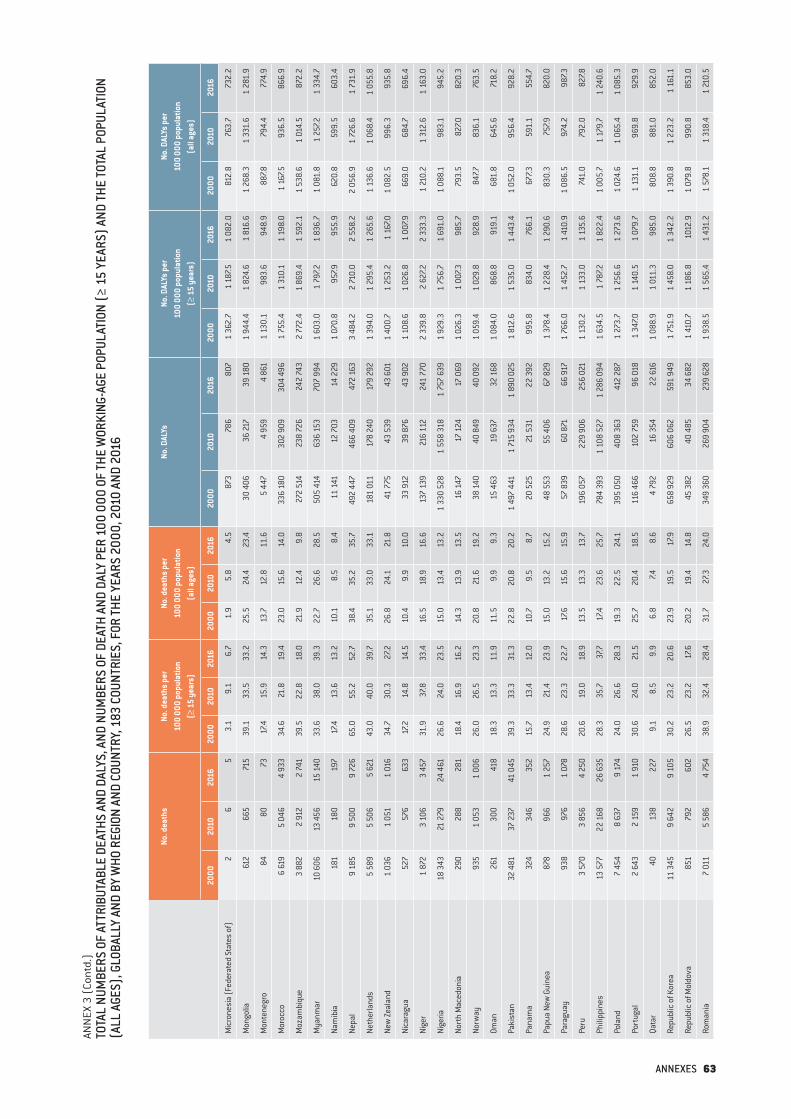
ANN
EX 3
(Co
ntd.
)TO
TAL
NUM
BERS
OF
ATTR
IBUT
ABLE
DEA
THS
AND
DALY
S, A
ND N
UMBE
RS O
F DE
ATH
AND
DALY
PER
100
000
OF
THE
WOR
KING
-AGE
POP
ULAT
ION
(≥ 1
5 YE
ARS)
AND
THE
TOTA
L PO
PULA
TION
(A
LL A
GES)
, GLO
BALL
Y AN
D BY
WHO
REG
ION
AND
COUN
TRY,
183
COU
NTRI
ES, F
OR TH
E YE
ARS
2000
, 201
0 AN
D 20
16
No. d
eath
sNo
. dea
ths
per
100
000
popu
latio
n
(≥ 1
5 ye
ars)
No. d
eath
s pe
r 10
0 00
0 po
pula
tion
(a
ll ag
es)
No. D
ALYs
No. D
ALYs
per
10
0 00
0 po
pula
tion
(≥
15
year
s)
No. D
ALYs
per
10
0 00
0 po
pula
tion
(a
ll ag
es)
2000
2010
2016
2000
2010
2016
2000
2010
2016
2000
2010
2016
2000
2010
2016
2000
2010
2016
Mic
rone
sia
(Fed
erat
ed S
tate
s of
)2
65
3.1
9.1
6.7
1.9
5.8
4.5
873
786
807
1 36
2.7
1 18
7.51
082.
081
2.8
763.
773
2.2
Mon
golia
612
665
715
39.1
33.5
33.2
25.5
24.4
23.4
30 4
0636
217
39 1
801
944.
41
824.
61
816.
61
268.
31
331.
61
281.
9
Mon
tene
gro
8480
7317
.415
.914
.313
.712
.811
.65
447
4 95
94
861
1 13
0.1
983.
694
8.9
887.8
794.
477
4.9
Mor
occo
6 61
95
046
4 93
334
.621
.819
.423
.015
.614
.033
6 18
030
2 90
930
4 49
61
755.
41
310.
11
198.
01
167.5
936.
586
6.9
Moz
ambi
que
3 88
22
912
2 74
139
.522
.818
.021
.912
.49.
827
2 51
423
8 72
624
2 74
32
772.
41
869.
41
592.
11
538.
61
014.
587
2.2
Mya
nmar
10 6
0613
456
15 1
4033
.638
.039
.322
.726
.628
.550
5 41
463
6 15
370
7 99
41
603.
01
797.2
1 83
6.7
1 08
1.8
1 25
7.21
334.
7
Nam
ibia
181
180
197
17.4
13.6
13.2
10.1
8.5
8.4
11 1
4112
703
14 2
291
070.
895
7.995
5.9
620.
859
9.5
603.
4
Nepa
l9
185
9 50
09
726
65.0
55.2
52.7
38.4
35.2
35.7
492
447
466
409
472
163
3 48
4.2
2 71
0.0
2 55
8.2
2 05
6.9
1 72
6.6
1 73
1.9
Neth
erla
nds
5 58
95
506
5 62
143
.040
.039
.735
.133
.033
.118
1 01
117
8 24
017
9 29
21
394.
01
295.
41
265.
61
136.
61
068.
41
055.
8
New
Zeal
and
1 03
61
051
1 01
634
.730
.327
.226
.824
.121
.841
775
43 5
3943
601
1 40
0.7
1 25
3.2
1 16
7.01
082.
599
6.3
935.
8
Nica
ragu
a52
757
663
317
.214
.814
.510
.49.
910
.033
912
39 8
7643
902
1 10
8.6
1 02
6.8
1 00
7.966
9.0
684.
769
6.4
Nige
r1
872
3 10
63
457
31.9
37.8
33.4
16.5
18.9
16.6
137
139
216
112
241
770
2 33
9.8
2 62
7.22
333.
31
210.
21
312.
61
163.
0
Nige
ria18
343
21 2
7924
461
26.6
24.0
23.5
15.0
13.4
13.2
1 33
0 52
81
558
318
1 75
7 63
91
929.
31
756.
71
691.
01
088.
198
3.1
945.
2
Nort
h M
aced
onia
290
288
281
18.4
16.9
16.2
14.3
13.9
13.5
16 1
4717
124
17 0
691
026.
31
007.3
985.
779
3.5
827.0
820.
3
Norw
ay93
51
053
1 00
626
.026
.523
.320
.821
.619
.238
140
40 8
4940
092
1 05
9.4
1 02
9.8
928.
984
7.783
6.1
763.
5
Oman
261
300
418
18.3
13.3
11.9
11.5
9.9
9.3
15 4
6319
637
32 1
681
084.
086
8.8
919.
168
1.8
645.
671
8.2
Paki
stan
32 4
8137
237
41 0
4539
.333
.331
.322
.820
.820
.21
497
441
1 71
5 93
41
890
025
1 81
2.6
1 53
5.0
1 44
3.4
1 05
2.0
956.
492
8.2
Pana
ma
324
346
352
15.7
13.4
12.0
10.7
9.5
8.7
20 5
2521
531
22 3
9299
5.8
834.
076
6.1
677.3
591.
155
4.7
Papu
a Ne
w G
uine
a87
896
61
257
24.9
21.4
23.9
15.0
13.2
15.2
48 5
5355
406
67 8
291
378.
41
228.
41
290.
683
0.3
757.9
820.
0
Para
guay
938
976
1 07
828
.623
.322
.717
.615
.615
.957
839
60 8
7166
917
1 76
6.0
1 45
2.7
1 41
0.9
1 08
6.5
974.
298
7.3
Peru
3 57
03
856
4 25
020
.619
.018
.913
.513
.313
.719
6 05
722
9 90
625
6 02
11
130.
21
133.
01
135.
674
1.0
792.
082
7.8
Phili
ppin
es13
577
22 1
6826
635
28.3
35.7
37.7
17.4
23.6
25.7
784
393
1 10
8 52
71
286
094
1 63
4.5
1 78
7.21
822.
41
005.
71
179.
71
240.
6
Pola
nd7
454
8 63
79
174
24.0
26.6
28.3
19.3
22.5
24.1
395
050
408
363
412
287
1 27
3.7
1 25
6.6
1 27
3.6
1 02
4.6
1 06
5.4
1 08
5.3
Port
ugal
2 64
3 2
159
1 91
030
.624
.021
.525
.720
.418
.511
6 46
610
2 75
996
018
1 34
7.01
140.
51
079.
71
131.
196
9.8
929.
9
Qata
r40
138
227
9.1
8.5
9.9
6.8
7.48.
64
792
16 3
5422
616
1 08
8.9
1 01
1.3
985.
080
8.8
881.
085
2.0
Repu
blic
of K
orea
11 3
459
642
9 10
530
.223
.220
.623
.919
.517
.965
8 92
960
6 06
259
1 94
91
751.
91
458.
01
342.
21
390.
81
223.
21
161.
1
Repu
blic
of M
oldo
va85
179
260
226
.523
.217
.620
.219
.414
.845
382
40 4
8534
682
1 41
0.7
1 18
6.8
1012
.91
079.
899
0.8
853.
0
Rom
ania
7 01
15
586
4 75
438
.932
.428
.431
.727
.324
.034
9 36
026
9 90
423
9 62
81
938.
51
565.
41
431.
21
578.
11
318.
41
210.
5
ANNEXES 63
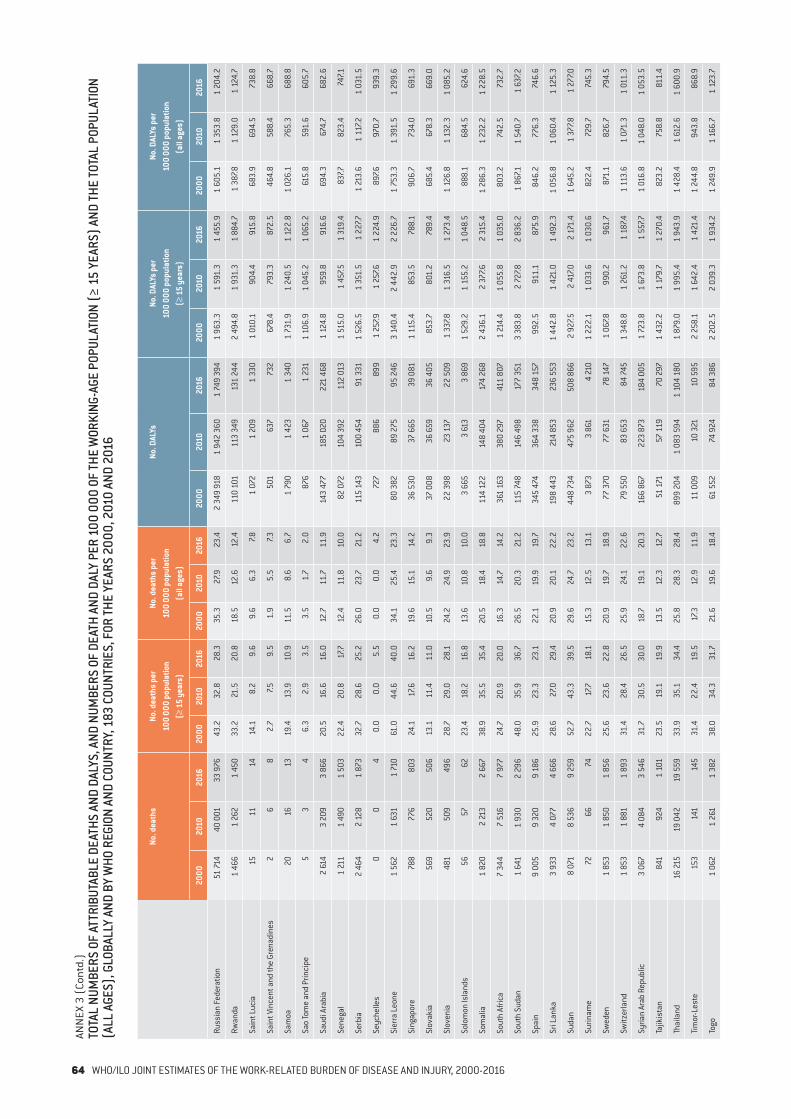
ANN
EX 3
(Co
ntd.
)TO
TAL
NUM
BERS
OF
ATTR
IBUT
ABLE
DEA
THS
AND
DALY
S, A
ND N
UMBE
RS O
F DE
ATH
AND
DALY
PER
100
000
OF
THE
WOR
KING
-AGE
POP
ULAT
ION
(≥ 1
5 YE
ARS)
AND
THE
TOTA
L PO
PULA
TION
(A
LL A
GES)
, GLO
BALL
Y AN
D BY
WHO
REG
ION
AND
COUN
TRY,
183
COU
NTRI
ES, F
OR TH
E YE
ARS
2000
, 201
0 AN
D 20
16
No. d
eath
sNo
. dea
ths
per
100
000
popu
latio
n
(≥ 1
5 ye
ars)
No. d
eath
s pe
r 10
0 00
0 po
pula
tion
(a
ll ag
es)
No. D
ALYs
No. D
ALYs
per
10
0 00
0 po
pula
tion
(≥
15
year
s)
No. D
ALYs
per
10
0 00
0 po
pula
tion
(a
ll ag
es)
2000
2010
2016
2000
2010
2016
2000
2010
2016
2000
2010
2016
2000
2010
2016
2000
2010
2016
Russ
ian
Fede
ratio
n51
714
40 0
0133
976
43.2
32.8
28.3
35.3
27.9
23.4
2 34
9 91
81
942
360
1 74
9 39
41
963.
31
591.
31
455.
91
605.
11
353.
81
204.
2
Rwan
da1
466
1 26
21
450
33.2
21.5
20.8
18.5
12.6
12.4
110
101
113
349
131
244
2 49
4.8
1 93
1.3
1 88
4.7
1 38
7.81
129.
01
124.
7
Sain
t Luc
ia15
1114
14.1
8.2
9.6
9.6
6.3
7.81
072
1 20
91
330
1 01
0.1
904.
491
5.8
683.
969
4.5
738.
8
Sain
t Vin
cent
and
the
Gren
adin
es2
68
2.7
7.59.
51.
95.
57.3
501
637
732
678
.4 7
93.3
872.
546
4.8
588.
466
8.7
Sam
oa20
1613
19.4
13.9
10.9
11.5
8.6
6.7
1 79
01
423
1 34
01
731.
91
240.
51
122.
81
026.
176
5.3
688.
8
Sao
Tom
e an
d Pr
inci
pe5
34
6.3
2.9
3.5
3.5
1.7
2.0
876
1 06
71
231
1 10
6.9
1 04
5.2
1 06
5.2
615.
859
1.6
605.
7
Saud
i Ara
bia
2 61
43
209
3 86
620
.516
.616
.012
.711
.711
.914
3 47
718
5 02
022
1 46
81
124.
895
9.8
916.
669
4.3
674.
768
2.6
Sene
gal
1 21
11
490
1 50
322
.420
.817
.712
.411
.810
.082
072
104
392
112
013
1 51
5.0
1 45
7.51
319.
483
7.782
3.4
747.1
Serb
ia2
464
2 12
81
873
32.7
28.6
25.2
26.0
23.7
21.2
115
143
100
454
91 3
311
526.
51
351.
51
227.7
1 21
3.6
1 11
7.21
031.
5
Seyc
helle
s0
04
0.0
0.0
5.5
0.0
0.0
4.2
727
886
899
1 25
7.91
257.6
1 22
4.9
897.6
970.
793
9.3
Sier
ra L
eone
1 56
21
631
1 71
061
.044
.640
.034
.125
.423
.380
382
89 2
7595
246
3 14
0.4
2 44
2.9
2 22
6.7
1 75
3.3
1 39
1.5
1 29
9.6
Sing
apor
e78
877
680
324
.117
.616
.219
.615
.114
.236
530
37 6
6539
081
1 11
5.4
853.
578
8.1
906.
773
4.0
691.
3
Slov
akia
569
520
506
13.1
11.4
11.0
10.5
9.6
9.3
37 0
0836
659
36 4
0585
3.7
801.
278
9.4
685.
467
8.3
669.
0
Slov
enia
481
509
496
28.7
29.0
28.1
24.2
24.9
23.9
22 3
9823
137
22 5
091
337.8
1 31
6.5
1 27
3.4
1 12
6.8
1 13
2.3
1 08
5.2
Solo
mon
Isla
nds
5657
6223
.418
.216
.813
.610
.810
.03
665
3 61
3 3
869
1 52
9.2
1 15
5.2
1 04
8.5
888.
168
4.5
624.
6
Som
alia
1 82
02
213
2 66
738
.935
.535
.420
.518
.418
.811
4 12
214
8 40
4 1
74 2
682
436.
12
377.6
2 31
5.4
1 28
6.3
1 23
2.2
1 22
8.5
Sout
h Af
rica
7 34
47
516
7 97
724
.720
.920
.016
.314
.714
.236
1 16
338
0 29
7 4
11 8
071
214.
41
055.
81
035.
080
3.2
742.
573
2.7
Sout
h Su
dan
1 64
11
930
2 29
648
.035
.936
.726
.520
.321
.211
5 74
814
6 49
817
7 35
13
383.
82
727.8
2 83
6.2
1 86
7.11
540.
71
637.2
Spai
n9
005
9 32
09
186
25.9
23.3
23.1
22.1
19.9
19.7
345
474
364
338
348
157
992.
591
1.1
875.
984
6.2
776.
374
6.6
Sri L
anka
3 93
34
077
4 66
628
.627
.029
.420
.920
.122
.219
8 44
321
4 85
323
6 55
31
442.
81
421.
01
492.
31
056.
81
060.
41
125.
3
Suda
n8
071
8 53
69
259
52.7
43.3
39.5
29.6
24.7
23.2
448
734
475
962
508
866
2 92
7.52
417.0
2 17
1.4
1 64
5.2
1 37
7.81
277.0
Surin
ame
7266
7422
.717
.718
.115
.312
.513
.13
873
3 86
14
210
1 22
2.1
1 03
3.6
1 03
0.6
822.
472
9.7
745.
3
Swed
en1
853
1 85
01
856
25.6
23.6
22.8
20.9
19.7
18.9
77 3
7077
631
78 1
471
067.8
990.
296
1.7
871.
182
6.7
794.
5
Switz
erla
nd1
853
1 88
11
893
31.4
28.4
26.5
25.9
24.1
22.6
79 5
5083
653
84 7
451
348.
81
261.
21
187.4
1 11
3.6
1 07
1.3
1 01
1.3
Syria
n Ar
ab R
epub
lic3
067
4 08
43
546
31.7
30.5
30.0
18.7
19.1
20.3
166
867
223
873
184
005
1 72
3.8
1 67
3.8
1 55
7.71
016.
81
048.
01
053.
5
Tajik
ista
n84
192
41
101
23.5
19.1
19.9
13.5
12.3
12.7
51 1
7157
119
70 2
971
432.
21
179.
71
270.
482
3.2
758.
881
1.4
Thai
land
16 21
519
042
19 5
5933
.935
.134
.425
.828
.328
.489
9 20
41
083
594
1 10
4 18
01
879.
01
995.
41
943.
91
428.
41
612.
61
600.
9
Tim
or-L
este
153
141
145
31.4
22.4
19.5
17.3
12.9
11.9
11 0
0910
321
10 5
952
258.
11
642.
41
421.
41
244.
894
3.8
868.
9
Togo
1 06
21
261
1 38
238
.034
.331
.721
.619
.618
.461
552
74 9
2484
386
2 20
2.5
2 03
9.3
1 93
4.2
1 24
9.9
1 16
6.7
1 12
3.7
64 WHO/ILO JOINT ESTIMATES OF THE WORK-RELATED BURDEN OF DISEASE AND INJURY, 2000-2016
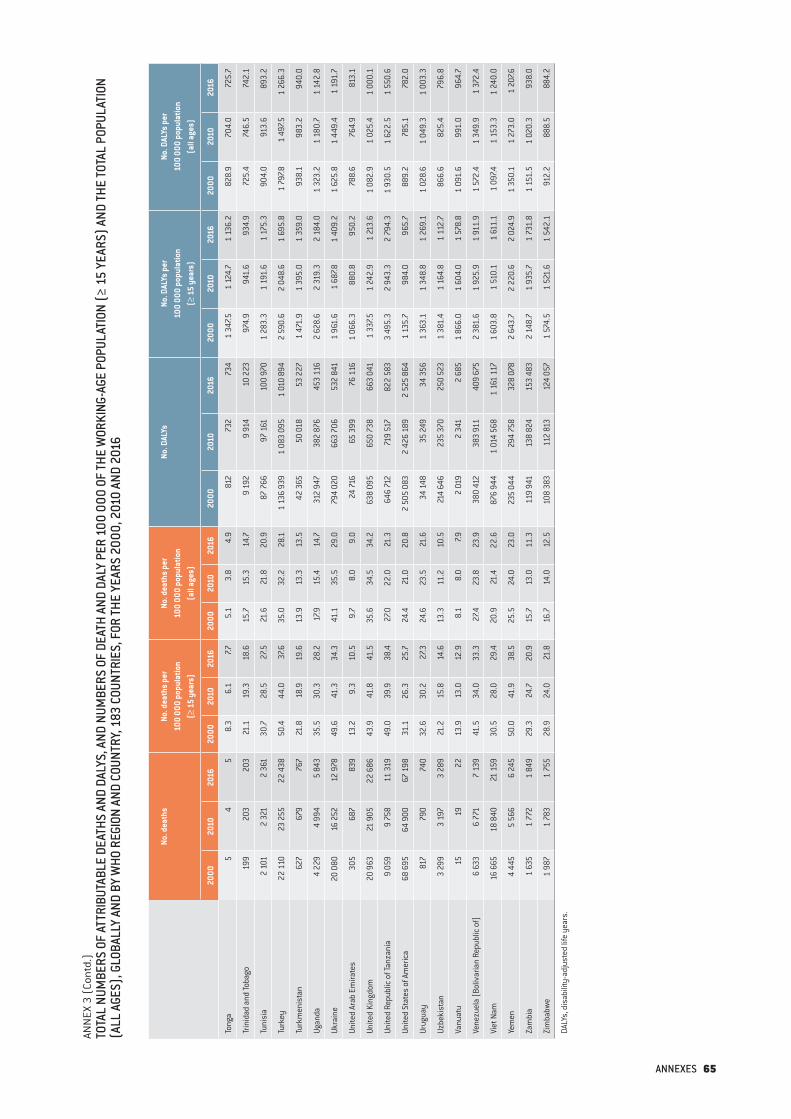
ANN
EX 3
(Co
ntd.
)TO
TAL
NUM
BERS
OF
ATTR
IBUT
ABLE
DEA
THS
AND
DALY
S, A
ND N
UMBE
RS O
F DE
ATH
AND
DALY
PER
100
000
OF
THE
WOR
KING
-AGE
POP
ULAT
ION
(≥ 1
5 YE
ARS)
AND
THE
TOTA
L PO
PULA
TION
(A
LL A
GES)
, GLO
BALL
Y AN
D BY
WHO
REG
ION
AND
COUN
TRY,
183
COU
NTRI
ES, F
OR TH
E YE
ARS
2000
, 201
0 AN
D 20
16
No. d
eath
sNo
. dea
ths
per
100
000
popu
latio
n
(≥ 1
5 ye
ars)
No. d
eath
s pe
r 10
0 00
0 po
pula
tion
(a
ll ag
es)
No. D
ALYs
No. D
ALYs
per
10
0 00
0 po
pula
tion
(≥
15
year
s)
No. D
ALYs
per
10
0 00
0 po
pula
tion
(a
ll ag
es)
2000
2010
2016
2000
2010
2016
2000
2010
2016
2000
2010
2016
2000
2010
2016
2000
2010
2016
Tong
a5
45
8.3
6.1
7.75.
13.
84.
981
273
273
41
347.5
1 12
4.7
1 13
6.2
828.
970
4.0
725.
7
Trin
idad
and
Toba
go19
920
320
321
.119
.318
.615
.715
.314
.79
192
9 91
410
223
974.
994
1.6
934.
972
5.4
746.
574
2.1
Tuni
sia
2 10
12
321
2 36
130
.728
.527
.521
.621
.820
.987
766
97 1
6110
0 97
01
283.
31
191.
61
175.
390
4.0
913.
689
3.2
Turk
ey22
110
23 2
5522
438
50.4
44.0
37.6
35.0
32.2
28.1
1 13
6 93
91
083
095
1 01
0 89
42
590.
62
048.
61
695.
81
797.8
1 49
7.51
266.
3
Turk
men
ista
n62
767
976
721
.818
.919
.613
.913
.313
.542
365
50 0
1853
227
1 47
1.9
1 39
5.0
1 35
9.0
938.
198
3.2
940.
0
Ugan
da4
229
4 99
45
843
35.5
30.3
28.2
17.9
15.4
14.7
312
947
382
876
453
116
2 62
8.6
2 31
9.3
2 18
4.0
1 32
3.2
1 18
0.7
1 14
2.8
Ukra
ine
20 0
8016
252
12 9
7849
.641
.334
.341
.135
.529
.079
4 02
066
3 70
653
2 84
11
961.
61
687.8
1 40
9.2
1 62
5.8
1 44
9.4
1 19
1.7
Unite
d Ar
ab E
mira
tes
305
687
839
13.2
9.3
10.5
9.7
8.0
9.0
24 71
665
399
76 1
161
066.
388
0.8
950.
278
8.6
764.
981
3.1
Unite
d Ki
ngdo
m20
963
21 9
0522
686
43.9
41.8
41.5
35.6
34.5
34.2
638
095
650
738
663
041
1 33
7.51
242.
91
213.
61
082.
91
025.
41
000.
1
Unite
d Re
publ
ic o
f Tan
zani
a9
059
9 75
811
319
49.0
39.9
38.4
27.0
22.0
21.3
646
712
719
517
822
583
3 49
5.3
2 94
3.3
2 79
4.3
1 93
0.5
1 62
2.5
1 55
0.6
Unite
d St
ates
of A
mer
ica
68 6
9564
900
67 1
9831
.126
.325
.724
.421
.020
.82
505
083
2 42
6 18
92
525
864
1 13
5.7
984.
096
5.7
889.
278
5.1
782.
0
Urug
uay
817
790
740
32.6
30.2
27.3
24.6
23.5
21.6
34 1
4835
249
34 3
561
363.
11
348.
81
269.
11
028.
61
049.
31
003.
3
Uzbe
kist
an3
299
3 19
73
289
21.2
15.8
14.6
13.3
11.2
10.5
214
646
235
370
250
523
1 38
1.4
1 16
4.8
1 11
2.7
866.
682
5.4
796.
8
Vanu
atu
1519
2213
.913
.012
.98.
18.
07.9
2 01
92
341
2 68
51
866.
01
604.
01
578.
81
091.
699
1.0
964.
7
Vene
zuel
a (B
oliv
aria
n Re
publ
ic o
f)6
633
6 77
17
139
41.5
34.0
33.3
27.4
23.8
23.9
380
412
383
911
409
675
2 38
1.6
1 92
5.9
1 91
1.9
1 57
2.4
1 34
9.9
1 37
2.4
Viet
Nam
16 6
6518
840
21 1
5930
.528
.029
.420
.921
.422
.687
6 94
41
014
568
1 16
1 11
71
603.
81
510.
11
611.
11
097.4
1 15
3.3
1 24
0.0
Yem
en4
445
5 56
66
245
50.0
41.9
38.5
25.5
24.0
23.0
235
044
294
758
328
078
2 64
3.7
2 22
0.6
2 02
4.9
1 35
0.1
1 27
3.0
1 20
7.6
Zam
bia
1 63
51
772
1 84
929
.324
.720
.915
.713
.011
.311
9 94
113
8 82
415
3 48
32
148.
71
935.
71
731.
81
151.
51
020.
393
8.0
Zim
babw
e1
987
1 78
31
755
28.9
24.0
21.8
16.7
14.0
12.5
108
383
112
813
124
057
1 57
4.5
1 52
1.6
1 54
2.1
912.
288
8.5
884.
2
DALY
s, d
isab
ility
-adj
uste
d lif
e ye
ars.
ANNEXES 65
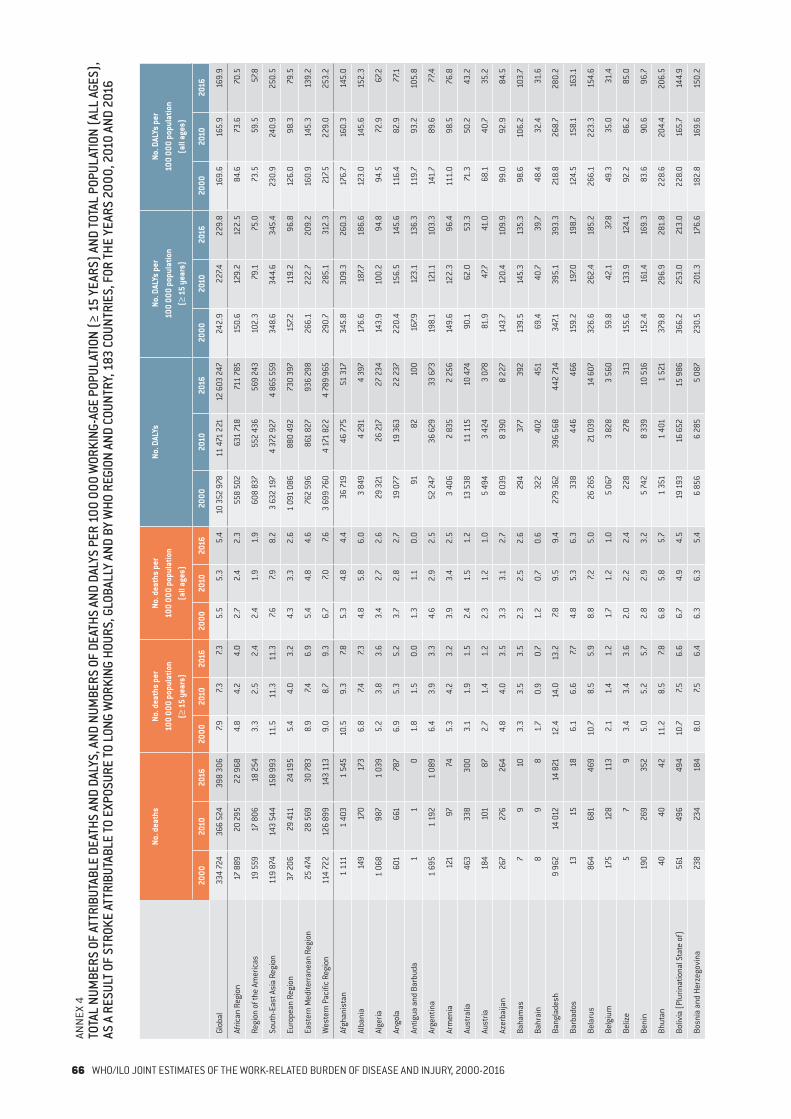
ANN
EX 4
TOTA
L NU
MBE
RS O
F AT
TRIB
UTAB
LE D
EATH
S AN
D DA
LYS,
AND
NUM
BERS
OF
DEAT
HS A
ND D
ALYS
PER
100
000
WOR
KING
-AGE
POP
ULAT
ION
(≥ 1
5 YE
ARS)
AND
TOTA
L PO
PULA
TION
(ALL
AGE
S),
AS A
RES
ULT O
F ST
ROKE
ATT
RIBU
TABL
E TO
EXP
OSUR
E TO
LON
G W
ORKI
NG H
OURS
, GLO
BALL
Y AN
D BY
WHO
REG
ION
AND
COUN
TRY,
183
COU
NTRI
ES, F
OR TH
E YE
ARS
2000
, 201
0 AN
D 20
16
No. d
eath
sNo
. dea
ths
per
100
000
popu
latio
n
(≥ 1
5 ye
ars)
No. d
eath
s pe
r 10
0 00
0 po
pula
tion
(a
ll ag
es)
No. D
ALYs
No. D
ALYs
per
10
0 00
0 po
pula
tion
(≥
15
year
s)
No. D
ALYs
per
10
0 00
0 po
pula
tion
(a
ll ag
es)
2000
2010
2016
2000
2010
2016
2000
2010
2016
2000
2010
2016
2000
2010
2016
2000
2010
2016
Glob
al33
4 72
436
6 52
439
8 30
67.9
7.37.3
5.5
5.3
5.4
10 3
52 9
7811
471
221
12 6
03 2
4724
2.9
227.4
229.
816
9.6
165.
916
9.9
Afric
an R
egio
n17
889
20 2
9522
968
4.8
4.2
4.0
2.7
2.4
2.3
558
502
631
718
711
785
150.
612
9.2
122.
584
.673
.670
.5
Regi
on o
f the
Am
eric
as19
559
17 8
0618
254
3.3
2.5
2.4
2.4
1.9
1.9
608
837
552
436
569
243
102.
379
.175
.073
.559
.557
.8
Sout
h-Ea
st A
sia
Regi
on11
9 87
414
3 54
415
8 99
311
.511
.311
.37.6
7.98.
23
632
197
4 37
2 92
74
865
559
348.
634
4.6
345.
423
0.9
240.
925
0.5
Euro
pean
Reg
ion
37 2
0629
411
24 1
955.
44.
03.
24.
33.
32.
61
091
086
880
492
730
397
157.2
119.
296
.812
6.0
98.3
79.5
East
ern
Med
iterr
anea
n Re
gion
25 4
7428
569
30 7
838.
97.4
6.9
5.4
4.8
4.6
762
596
861
827
936
298
266.
122
2.7
209.
216
0.9
145.
313
9.2
Wes
tern
Pac
ific
Regi
on11
4 72
212
6 89
914
3 11
39.
08.
79.
36.
77.0
7.63
699
760
4 17
1 82
24
789
965
290.
728
5.1
312.
321
7.522
9.0
253.
2
Afgh
anis
tan
1 11
11
403
1 54
510
.59.
37.8
5.3
4.8
4.4
36 71
946
775
51 3
1734
5.8
309.
326
0.3
176.
716
0.3
145.
0
Alba
nia
149
170
173
6.8
7.47.3
4.8
5.8
6.0
3 84
94
291
4 39
717
6.6
187.7
186.
612
3.0
145.
615
2.3
Alge
ria1
068
987
1 03
95.
23.
83.
63.
42.
72.
629
321
26 21
727
234
143.
910
0.2
94.8
94.5
72.9
67.2
Ango
la60
166
178
76.
95.
35.
23.
72.
82.
719
077
19 3
6322
237
220.
415
6.5
145.
611
6.4
82.9
77.1
Antig
ua a
nd B
arbu
da1
10
1.8
1.5
0.0
1.3
1.1
0.0
9182
100
167.9
123.
113
6.3
119.
793
.210
5.8
Arge
ntin
a1
695
1 19
21
089
6.4
3.9
3.3
4.6
2.9
2.5
52 2
4736
629
33 6
7319
8.1
121.
110
3.3
141.
789
.677
.4
Arm
enia
121
9774
5.3
4.2
3.2
3.9
3.4
2.5
3 40
62
835
2 25
614
9.6
122.
396
.411
1.0
98.5
76.8
Aust
ralia
463
338
300
3.1
1.9
1.5
2.4
1.5
1.2
13 5
3811
115
10 4
7490
.162
.053
.371
.350
.243
.2
Aust
ria18
410
187
2.7
1.4
1.2
2.3
1.2
1.0
5 4
943
424
3 07
881
.947
.741
.068
.140
.735
.2
Azer
baija
n26
727
626
44.
84.
03.
53.
33.
12.
7 8
039
8 39
08
227
143.
712
0.4
109.
999
.092
.984
.5
Baha
mas
79
103.
33.
53.
52.
32.
52.
629
437
739
213
9.5
145.
313
5.3
98.6
106.
210
3.7
Bahr
ain
89
81.
70.
90.
71.
20.
70.
632
240
245
169
.440
.739
.748
.432
.431
.6
Bang
lade
sh9
962
14 0
1214
821
12.4
14.0
13.2
7.89.
59.
427
9 36
239
6 56
844
2 71
434
7.139
5.1
393.
321
8.8
268.
728
0.2
Barb
ados
1315
186.
16.
67.7
4.8
5.3
6.3
338
446
466
159.
219
7.019
8.7
124.
515
8.1
163.
1
Bela
rus
864
681
469
10.7
8.5
5.9
8.8
7.25.
026
265
21 0
3914
607
326.
626
2.4
185.
226
6.1
223.
315
4.6
Belg
ium
175
128
113
2.1
1.4
1.2
1.7
1.2
1.0
5 06
7 3
828
3 56
059
.842
.137
.849
.335
.031
.4
Beliz
e5
79
3.4
3.4
3.6
2.0
2.2
2.4
228
278
313
155.
613
3.9
124.
192
.286
.285
.0
Beni
n19
026
935
25.
05.
25.
72.
82.
93.
25
742
8 33
910
516
152.
416
1.4
169.
383
.690
.696
.7
Bhut
an40
4042
11.2
8.5
7.86.
85.
85.
71
351
1 40
11
521
379.
829
6.9
281.
822
8.6
204.
420
6.5
Boliv
ia (P
lurin
atio
nal S
tate
of)
561
496
494
10.7
7.56.
66.
74.
94.
519
193
16 6
5215
986
366.
225
3.0
213.
022
8.0
165.
714
4.9
Bosn
ia a
nd H
erze
govi
na23
823
418
48.
07.5
6.4
6.3
6.3
5.4
6 85
66
285
5 08
723
0.5
201.
317
6.6
182.
816
9.6
150.
2
66 WHO/ILO JOINT ESTIMATES OF THE WORK-RELATED BURDEN OF DISEASE AND INJURY, 2000-2016

ANN
EX 4
(Co
ntd.
)TO
TAL
NUM
BERS
OF
ATTR
IBUT
ABLE
DEA
THS
AND
DALY
S, A
ND N
UMBE
RS O
F DE
ATHS
AND
DAL
YS P
ER 1
00 0
00 W
ORKI
NG-A
GE P
OPUL
ATIO
N (≥
15
YEAR
S) A
ND TO
TAL
POPU
LATI
ON (A
LL A
GES)
, AS
A R
ESUL
T OF
STRO
KE A
TTRI
BUTA
BLE
TO E
XPOS
URE
TO L
ONG
WOR
KING
HOU
RS, G
LOBA
LLY
AND
BY W
HO R
EGIO
N AN
D CO
UNTR
Y, 1
83 C
OUNT
RIES
, FOR
THE
YEAR
S 20
00, 2
010
AND
2016
No. d
eath
sNo
. dea
ths
per
100
000
popu
latio
n
(≥ 1
5 ye
ars)
No. d
eath
s pe
r 10
0 00
0 po
pula
tion
(a
ll ag
es)
No. D
ALYs
No. D
ALYs
per
10
0 00
0 po
pula
tion
(≥
15
year
s)
No. D
ALYs
per
10
0 00
0 po
pula
tion
(a
ll ag
es)
2000
2010
2016
2000
2010
2016
2000
2010
2016
2000
2010
2016
2000
2010
2016
2000
2010
2016
Bots
wan
a46
6272
4.6
4.8
5.1
2.8
3.1
3.3
1 36
61
689
1 86
613
5.5
130.
713
2.3
83.1
85.0
86.4
Braz
il5
823
4 76
84
164
4.8
3.2
2.6
3.3
2.4
2.0
179
999
142
453
124
987
147.0
96.8
77.8
103.
072
.860
.6
Brun
ei D
arus
sala
m5
912
2.2
3.1
3.8
1.5
2.3
2.9
303
349
494
131.
212
1.3
154.
690
.989
.811
7.7
Bulg
aria
272
174
136
4.0
2.7
2.2
3.4
2.3
1.9
7 67
94
867
3 76
711
3.8
75.8
61.5
96.0
65.5
52.7
Burk
ina
Faso
238
325
380
3.9
3.9
3.7
2.1
2.1
2.0
7 37
710
245
12 0
5511
9.4
122.
111
8.4
63.6
65.7
64.7
Buru
ndi
181
221
248
5.7
4.6
4.3
2.8
2.5
2.4
5 40
16
924
8 01
116
9.6
145.
514
0.3
84.7
79.8
76.4
Cabo
Ver
de15
1614
6.1
4.8
3.7
3.5
3.2
2.6
437
433
400
178.
912
9.9
106.
910
2.1
87.9
75.3
Cam
bodi
a1
024
1 14
71
238
14.4
12.0
11.4
8.4
8.0
7.931
563
34 8
2837
564
444.
636
5.0
347.3
259.
724
3.3
238.
3
Cam
eroo
n25
339
156
83.
03.
44.
21.
61.
92.
49
101
13 4
3418
690
106.
811
7.313
7.258
.766
.078
.1
Cana
da41
934
532
51.
71.
21.
11.
41.
00.
914
548
13 4
9413
558
58.8
47.3
44.3
47.6
39.5
37.3
Cent
ral A
frica
n Re
publ
ic21
922
018
710
.69.
07.5
6.0
5.0
4.1
6 48
2 6
727
5 63
631
3.9
274.
122
5.6
178.
115
3.3
124.
2
Chad
304
384
429
7.16.
35.
63.
63.
22.
99
829
12 9
9114
814
230.
121
2.2
194.
311
7.610
8.7
101.
7
Chile
385
404
379
3.5
3.0
2.6
2.5
2.4
2.1
11 0
9111
344
10 9
5799
.585
.375
.572
.366
.560
.2
Chin
a89
567
98 2
3211
3 47
79.
28.
89.
86.
97.2
8.0
2 93
2 19
73
251
669
3 82
0 21
130
2.1
292.
132
9.4
227.2
237.6
270.
2
Colo
mbi
a1
381
1 33
01
453
5.2
4.0
4.0
3.5
2.9
3.0
40 5
3838
935
43 0
5915
1.7
118.
411
7.710
2.3
86.1
89.4
Com
oros
77
92.
31.
71.
91.
31.
01.
127
432
940
790
.280
.985
.250
.547
.751
.2
Cong
o79
7579
4.4
3.0
2.7
2.5
1.8
1.6
2 65
72
456
2 46
514
6.9
98.5
85.4
85.0
57.5
49.5
Cost
a Ri
ca78
8393
2.9
2.4
2.4
2.0
1.8
1.9
2 22
42
385
2 78
281
.568
.872
.756
.152
.156
.8
Côte
d’Iv
oire
857
1 25
71
475
9.2
10.9
10.7
5.2
6.1
6.2
27 4
7942
793
50 4
5029
6.3
369.
736
7.516
7.020
8.4
211.
8
Croa
tia14
584
544.
02.
31.
53.
31.
91.
34
176
2 33
51
565
114.
163
.843
.594
.353
.937
.2
Cuba
560
593
570
6.4
6.4
6.0
5.0
5.3
5.0
15 8
6216
173
15 7
5818
1.8
175.
116
6.6
142.
614
4.1
139.
0
Cypr
us12
98
1.6
1.0
0.8
1.3
0.8
0.7
388
334
263
53.0
36.5
27.0
41.1
30.0
22.5
Czec
hia
242
130
942.
81.
41.
02.
41.
20.
97
508
4 43
43
310
87.3
49.1
36.8
73.0
42.1
31.2
Dem
ocra
tic P
eopl
e's
Repu
blic
of K
orea
2 96
45
214
5 63
217
.527
.528
.112
.921
.222
.393
765
151
651
158
569
552.
279
8.5
790.
140
8.9
617.8
626.
6
Dem
ocra
tic R
epub
lic o
f the
Con
go1
050
1 24
71
426
4.1
3.6
3.4
2.2
1.9
1.8
33 9
0338
967
43 8
9913
2.2
112.
110
3.8
72.0
60.4
55.7
Denm
ark
8267
521.
91.
51.
11.
51.
20.
92
473
2 10
71
764
56.8
46.2
37.0
46.3
37.9
30.9
Djib
outi
2932
386.
85.
65.
94.
03.
84.
11
004
1 00
61
269
237.0
177.6
196.
013
9.9
119.
713
6.6
Dom
inic
an R
epub
lic33
538
743
76.
15.
85.
94.
04.
04.
210
758
12 1
3113
961
195.
118
0.3
187.9
127.0
125.
113
4.3
ANNEXES 67
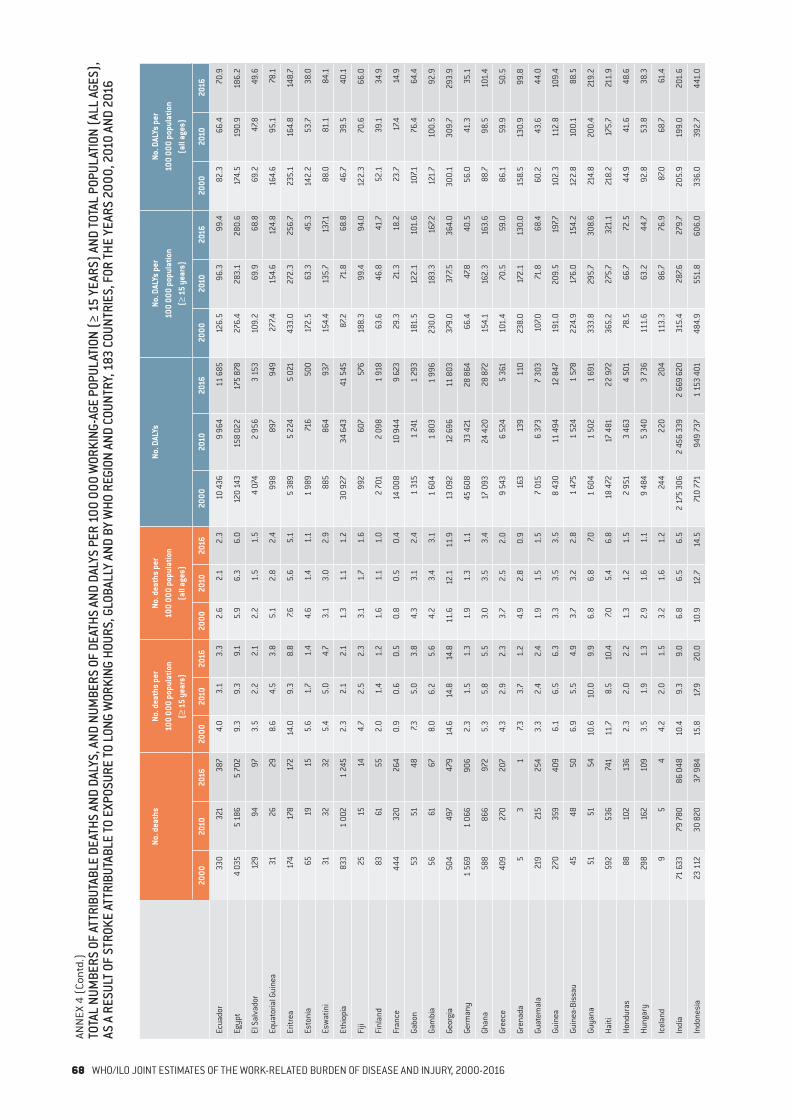
ANN
EX 4
(Co
ntd.
)TO
TAL
NUM
BERS
OF
ATTR
IBUT
ABLE
DEA
THS
AND
DALY
S, A
ND N
UMBE
RS O
F DE
ATHS
AND
DAL
YS P
ER 1
00 0
00 W
ORKI
NG-A
GE P
OPUL
ATIO
N (≥
15
YEAR
S) A
ND TO
TAL
POPU
LATI
ON (A
LL A
GES)
, AS
A R
ESUL
T OF
STRO
KE A
TTRI
BUTA
BLE
TO E
XPOS
URE
TO L
ONG
WOR
KING
HOU
RS, G
LOBA
LLY
AND
BY W
HO R
EGIO
N AN
D CO
UNTR
Y, 1
83 C
OUNT
RIES
, FOR
THE
YEAR
S 20
00, 2
010
AND
2016
No. d
eath
sNo
. dea
ths
per
100
000
popu
latio
n
(≥ 1
5 ye
ars)
No. d
eath
s pe
r 10
0 00
0 po
pula
tion
(a
ll ag
es)
No. D
ALYs
No. D
ALYs
per
10
0 00
0 po
pula
tion
(≥
15
year
s)
No. D
ALYs
per
10
0 00
0 po
pula
tion
(a
ll ag
es)
2000
2010
2016
2000
2010
2016
2000
2010
2016
2000
2010
2016
2000
2010
2016
2000
2010
2016
Ecua
dor
330
321
387
4.0
3.1
3.3
2.6
2.1
2.3
10 4
369
964
11 6
8512
6.5
96.3
99.4
82.3
66.4
70.9
Egyp
t4
035
5 18
65
702
9.3
9.3
9.1
5.9
6.3
6.0
120
143
158
022
175
878
276.
428
3.1
280.
617
4.5
190.
918
6.2
El S
alva
dor
129
9497
3.5
2.2
2.1
2.2
1.5
1.5
4 07
42
956
3 1
5310
9.2
69.9
68.8
69.2
47.8
49.6
Equa
toria
l Gui
nea
3126
298.
64.
53.
85.
12.
82.
499
889
794
927
7.415
4.6
124.
816
4.6
95.1
78.1
Eritr
ea17
417
817
214
.09.
38.
87.6
5.6
5.1
5 38
95
224
5 02
143
3.0
272.
325
6.7
235.
116
4.8
148.
7
Esto
nia
6519
155.
61.
71.
44.
61.
41.
11
989
716
500
172.
563
.345
.314
2.2
53.7
38.0
Esw
atin
i31
3232
5.4
5.0
4.7
3.1
3.0
2.9
885
864
937
154.
413
5.7
137.1
88.0
81.1
84.1
Ethi
opia
833
1 00
21
245
2.3
2.1
2.1
1.3
1.1
1.2
30 9
2734
643
41 5
4587
.271
.868
.846
.739
.540
.1
Fiji
2515
144.
72.
52.
33.
11.
71.
699
260
757
618
8.3
99.4
94.0
122.
370
.666
.0
Finl
and
8361
552.
01.
41.
21.
61.
11.
02
701
2 09
81
918
63.6
46.8
41.7
52.1
39.1
34.9
Fran
ce44
432
026
40.
90.
60.
50.
80.
50.
414
008
10 9
449
623
29.3
21.3
18.2
23.7
17.4
14.9
Gabo
n53
5148
7.35.
03.
84.
33.
12.
41
315
1 2
411
293
181.
512
2.1
101.
610
7.176
.464
.4
Gam
bia
5661
678.
06.
25.
64.
23.
43.
11
604
1 80
31
996
230.
018
3.3
167.2
121.
710
0.5
92.9
Geor
gia
504
497
479
14.6
14.8
14.8
11.6
12.1
11.9
13 0
9212
696
11 8
0337
9.0
377.5
364.
030
0.1
309.
729
3.9
Germ
any
1 56
91
066
906
2.3
1.5
1.3
1.9
1.3
1.1
45 6
0833
421
28 8
6466
.447
.840
.556
.041
.335
.1
Ghan
a58
886
697
25.
35.
85.
53.
03.
53.
417
093
24 4
2028
872
154.
116
2.3
163.
688
.798
.510
1.4
Gree
ce40
927
020
74.
32.
92.
33.
72.
52.
0 9
543
6 52
45
361
101.
470
.559
.086
.159
.950
.5
Gren
ada
53
17.3
3.7
1.2
4.9
2.8
0.9
163
139
110
238.
017
2.1
130.
015
8.5
130.
999
.8
Guat
emal
a21
921
525
43.
32.
42.
41.
91.
51.
57
015
6 37
37
303
107.0
71.8
68.4
60.2
43.6
44.0
Guin
ea27
035
940
96.
16.
56.
33.
33.
53.
58
430
11 4
9412
847
191.
020
9.5
197.7
102.
311
2.8
109.
4
Guin
ea-B
issa
u45
4850
6.9
5.5
4.9
3.7
3.2
2.8
1 47
51
524
1 57
822
4.9
176.
015
4.2
122.
810
0.1
88.5
Guya
na51
5154
10.6
10.0
9.9
6.8
6.8
7.01
604
1 50
21
691
333.
829
5.7
308.
621
4.8
200.
421
9.2
Haiti
592
536
741
11.7
8.5
10.4
7.05.
46.
818
472
17 4
8122
972
365.
227
5.7
321.
121
8.2
175.
721
1.9
Hond
uras
8810
213
62.
32.
02.
21.
31.
21.
52
951
3 46
34
501
78.5
66.7
72.5
44.9
41.6
48.6
Hung
ary
298
162
109
3.5
1.9
1.3
2.9
1.6
1.1
9 48
45
340
3 73
611
1.6
63.2
44.7
92.8
53.8
38.3
Icel
and
95
44.
22.
01.
53.
21.
61.
224
422
020
411
3.3
86.7
76.9
87.0
68.7
61.4
Indi
a71
633
79 7
8086
048
10.4
9.3
9.0
6.8
6.5
6.5
2 17
5 30
62
456
339
2 66
9 62
031
5.4
287.6
279.
720
5.9
199.
020
1.6
Indo
nesi
a23
112
30 8
2037
984
15.8
17.9
20.0
10.9
12.7
14.5
710
771
949
737
1 15
3 40
148
4.9
551.
860
6.0
336.
039
2.7
441.
0
68 WHO/ILO JOINT ESTIMATES OF THE WORK-RELATED BURDEN OF DISEASE AND INJURY, 2000-2016
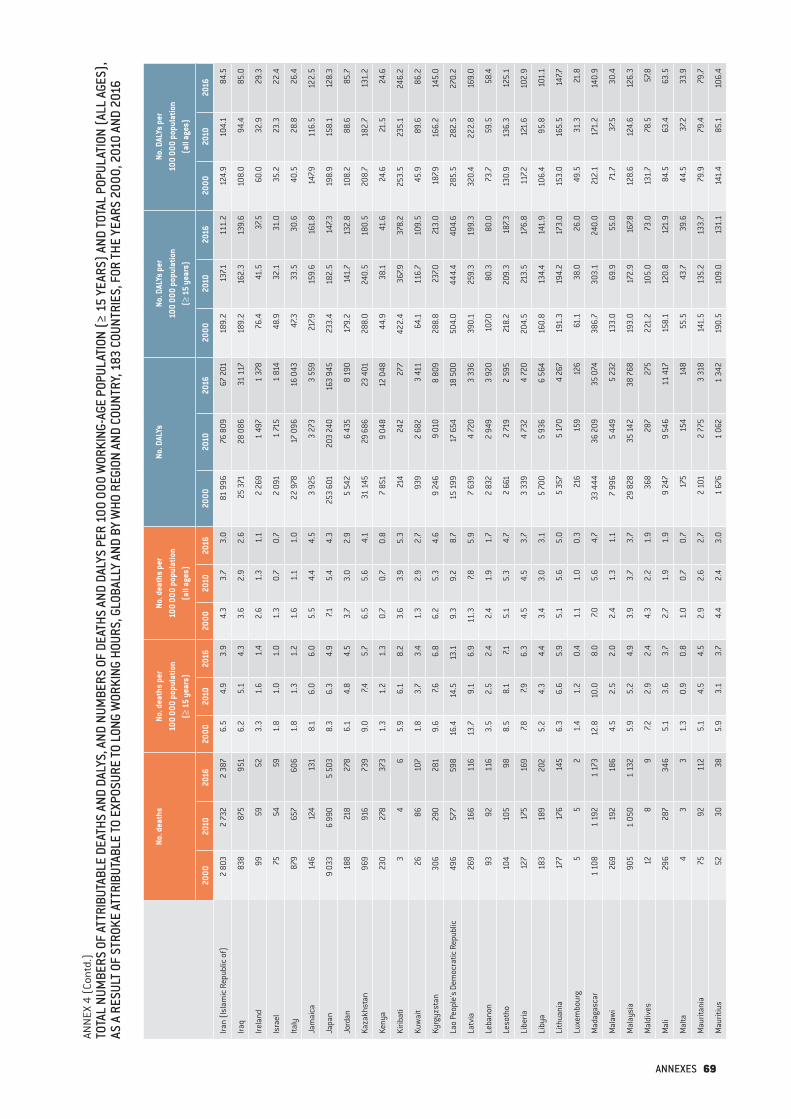
ANN
EX 4
(Co
ntd.
)TO
TAL
NUM
BERS
OF
ATTR
IBUT
ABLE
DEA
THS
AND
DALY
S, A
ND N
UMBE
RS O
F DE
ATHS
AND
DAL
YS P
ER 1
00 0
00 W
ORKI
NG-A
GE P
OPUL
ATIO
N (≥
15
YEAR
S) A
ND TO
TAL
POPU
LATI
ON (A
LL A
GES)
, AS
A R
ESUL
T OF
STRO
KE A
TTRI
BUTA
BLE
TO E
XPOS
URE
TO L
ONG
WOR
KING
HOU
RS, G
LOBA
LLY
AND
BY W
HO R
EGIO
N AN
D CO
UNTR
Y, 1
83 C
OUNT
RIES
, FOR
THE
YEAR
S 20
00, 2
010
AND
2016
No. d
eath
sNo
. dea
ths
per
100
000
popu
latio
n
(≥ 1
5 ye
ars)
No. d
eath
s pe
r 10
0 00
0 po
pula
tion
(a
ll ag
es)
No. D
ALYs
No. D
ALYs
per
10
0 00
0 po
pula
tion
(≥
15
year
s)
No. D
ALYs
per
10
0 00
0 po
pula
tion
(a
ll ag
es)
2000
2010
2016
2000
2010
2016
2000
2010
2016
2000
2010
2016
2000
2010
2016
2000
2010
2016
Iran
(Isl
amic
Rep
ublic
of)
2 80
32
732
2 38
76.
54.
93.
94.
33.
73.
081
996
76 8
0967
201
189.
213
7.111
1.2
124.
910
4.1
84.5
Iraq
838
875
951
6.2
5.1
4.3
3.6
2.9
2.6
25 3
7128
086
31 1
1718
9.2
162.
313
9.6
108.
094
.485
.0
Irela
nd99
5952
3.3
1.6
1.4
2.6
1.3
1.1
2 26
91
497
1 37
876
.441
.537
.560
.032
.929
.3
Isra
el75
5459
1.8
1.0
1.0
1.3
0.7
0.7
2 09
11
715
1 81
448
.932
.131
.035
.223
.322
.4
Italy
879
657
606
1.8
1.3
1.2
1.6
1.1
1.0
22 9
7817
096
16 0
4347
.333
.530
.640
.528
.826
.4
Jam
aica
146
124
131
8.1
6.0
6.0
5.5
4.4
4.5
3 92
53
273
3 55
921
7.915
9.6
161.
814
7.911
6.5
122.
5
Japa
n9
033
6 99
05
503
8.3
6.3
4.9
7.15.
44.
325
3 60
120
3 24
016
3 94
523
3.4
182.
514
7.319
8.9
158.
112
8.3
Jord
an18
821
827
86.
14.
84.
53.
73.
02.
95
542
6 43
58
190
179.
214
1.7
132.
810
8.2
88.6
85.7
Kaza
khst
an96
991
673
99.
07.4
5.7
6.5
5.6
4.1
31 1
4529
686
23
401
288.
024
0.5
180.
520
8.7
182.
713
1.2
Keny
a23
027
837
31.
31.
21.
30.
70.
70.
87
851
9 0
48 1
2 04
844
.938
.141
.624
.621
.524
.6
Kirib
ati
34
65.
96.
18.
23.
63.
95.
321
424
227
742
2.4
367.9
378.
225
3.5
235.
124
6.2
Kuw
ait
2686
107
1.8
3.7
3.4
1.3
2.9
2.7
939
2 68
23
411
64.1
116.
710
9.5
45.9
89.6
86.2
Kyrg
yzst
an30
629
028
19.
67.6
6.8
6.2
5.3
4.6
9 24
69
010
8 80
928
8.8
237.0
213.
018
7.916
6.2
145.
0
Lao
Peop
le's
Dem
ocra
tic R
epub
lic49
657
759
816
.414
.513
.19.
39.
28.
715
199
17 6
5418
500
504.
044
4.4
404.
628
5.5
282.
527
0.2
Latv
ia26
916
611
613
.79.
16.
911
.37.8
5.9
7 63
94
720
3 33
639
0.1
259.
319
9.3
320.
422
2.8
169.
0
Leba
non
9392
116
3.5
2.5
2.4
2.4
1.9
1.7
2 83
22
949
3 92
010
7.080
.380
.073
.759
.558
.4
Leso
tho
104
105
988.
58.
17.1
5.1
5.3
4.7
2 66
12
719
2 59
521
8.2
209.
318
7.313
0.9
136.
312
5.1
Libe
ria12
717
516
97.8
7.96.
34.
54.
53.
7 3
339
4 73
24
720
204.
521
3.5
176.
811
7.212
1.6
102.
9
Liby
a18
318
920
25.
24.
34.
43.
43.
03.
15
700
5 93
66
564
160.
813
4.4
141.
910
6.4
95.8
101.
1
Lith
uani
a17
717
614
56.
36.
65.
95.
15.
65.
05
357
5 17
04
267
191.
319
4.2
173.
015
3.0
165.
514
7.7
Luxe
mbo
urg
55
21.
41.
20.
41.
11.
00.
321
615
912
661
.138
.026
.049
.531
.321
.8
Mad
agas
car
1 10
81
192
1 17
312
.810
.08.
07.0
5.6
4.7
33 4
4436
209
35 0
7438
6.7
303.
124
0.0
212.
117
1.2
140.
9
Mal
awi
269
192
186
4.5
2.5
2.0
2.4
1.3
1.1
7 99
65
449
5 23
213
3.0
69.9
55.0
71.7
37.5
30.4
Mal
aysi
a90
51
050
1 13
25.
95.
24.
93.
93.
73.
729
828
35 1
4238
768
193.
017
2.9
167.8
128.
612
4.6
126.
3
Mal
dive
s12
89
7.22.
92.
44.
32.
21.
936
828
727
522
1.2
105.
073
.013
1.7
78.5
57.8
Mal
i29
628
734
65.
13.
63.
72.
71.
91.
99
247
9 54
611
417
158.
112
0.8
121.
984
.563
.463
.5
Mal
ta4
33
1.3
0.9
0.8
1.0
0.7
0.7
175
154
148
55.5
43.7
39.6
44.5
37.2
33.9
Mau
ritan
ia75
9211
25.
14.
54.
52.
92.
62.
72
101
2 77
53
318
141.
513
5.2
133.
779
.979
.479
.7
Mau
ritiu
s52
3038
5.9
3.1
3.7
4.4
2.4
3.0
1 67
61
062
1 34
219
0.5
109.
013
1.1
141.
485
.110
6.4
ANNEXES 69
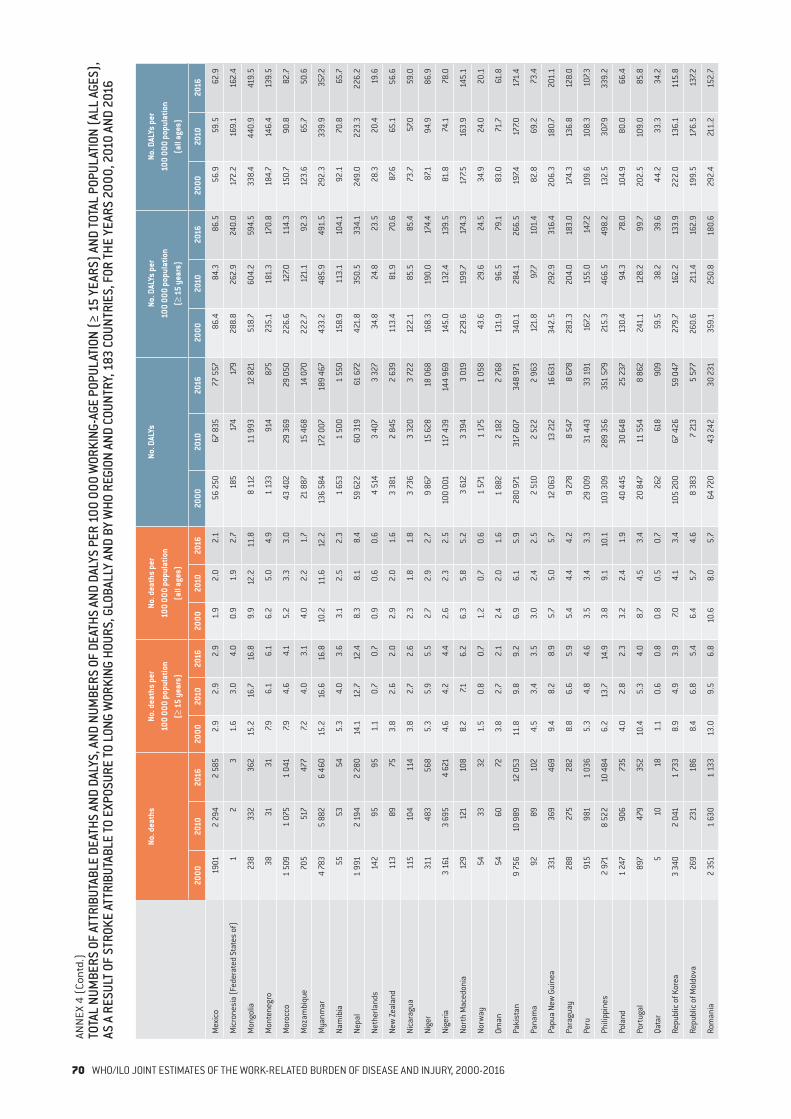
ANN
EX 4
(Co
ntd.
)TO
TAL
NUM
BERS
OF
ATTR
IBUT
ABLE
DEA
THS
AND
DALY
S, A
ND N
UMBE
RS O
F DE
ATHS
AND
DAL
YS P
ER 1
00 0
00 W
ORKI
NG-A
GE P
OPUL
ATIO
N (≥
15
YEAR
S) A
ND TO
TAL
POPU
LATI
ON (A
LL A
GES)
, AS
A R
ESUL
T OF
STRO
KE A
TTRI
BUTA
BLE
TO E
XPOS
URE
TO L
ONG
WOR
KING
HOU
RS, G
LOBA
LLY
AND
BY W
HO R
EGIO
N AN
D CO
UNTR
Y, 1
83 C
OUNT
RIES
, FOR
THE
YEAR
S 20
00, 2
010
AND
2016
No. d
eath
sNo
. dea
ths
per
100
000
popu
latio
n
(≥ 1
5 ye
ars)
No. d
eath
s pe
r 10
0 00
0 po
pula
tion
(a
ll ag
es)
No. D
ALYs
No. D
ALYs
per
10
0 00
0 po
pula
tion
(≥
15
year
s)
No. D
ALYs
per
10
0 00
0 po
pula
tion
(a
ll ag
es)
2000
2010
2016
2000
2010
2016
2000
2010
2016
2000
2010
2016
2000
2010
2016
2000
2010
2016
Mex
ico
1901
2 29
42
585
2.9
2.9
2.9
1.9
2.0
2.1
56 2
5067
835
77 5
5786
.484
.386
.556
.959
.562
.9
Mic
rone
sia
(Fed
erat
ed S
tate
s of
)1
23
1.6
3.0
4.0
0.9
1.9
2.7
185
174
179
288.
826
2.9
240.
017
2.2
169.
116
2.4
Mon
golia
238
332
362
15.2
16.7
16.8
9.9
12.2
11.8
8 11
211
993
12 8
2151
8.7
604.
259
4.5
338.
444
0.9
419.
5
Mon
tene
gro
3831
317.9
6.1
6.1
6.2
5.0
4.9
1 13
391
487
523
5.1
181.
317
0.8
184.
714
6.4
139.
5
Mor
occo
1 50
91
075
1 04
17.9
4.6
4.1
5.2
3.3
3.0
43 4
0229
369
29 0
5022
6.6
127.0
114.
315
0.7
90.8
82.7
Moz
ambi
que
705
517
477
7.24.
03.
14.
02.
21.
721
887
15 4
6814
070
222.
712
1.1
92.3
123.
665
.750
.6
Mya
nmar
4 78
35
882
6 46
015
.216
.616
.810
.211
.612
.213
6 58
417
2 00
718
9 46
743
3.2
485.
949
1.5
292.
333
9.9
357.2
Nam
ibia
5553
545.
34.
03.
63.
12.
52.
31
653
1 50
01
550
158.
911
3.1
104.
192
.170
.865
.7
Nepa
l1
991
2 19
42
280
14.1
12.7
12.4
8.3
8.1
8.4
59 6
2260
319
61 6
7242
1.8
350.
533
4.1
249.
022
3.3
226.
2
Neth
erla
nds
142
9595
1.1
0.7
0.7
0.9
0.6
0.6
4 51
43
407
3 32
734
.824
.823
.528
.320
.419
.6
New
Zeal
and
113
8975
3.8
2.6
2.0
2.9
2.0
1.6
3 38
12
845
2 63
911
3.4
81.9
70.6
87.6
65.1
56.6
Nica
ragu
a11
510
411
43.
82.
72.
62.
31.
81.
83
736
3 32
03
722
122.
185
.585
.473
.757
.059
.0
Nige
r31
148
356
85.
35.
95.
52.
72.
92.
79
867
15 6
2818
068
168.
319
0.0
174.
487
.194
.986
.9
Nige
ria3
161
3 69
54
621
4.6
4.2
4.4
2.6
2.3
2.5
100
001
117
439
144
969
145.
013
2.4
139.
581
.874
.178
.0
Nort
h M
aced
onia
129
121
108
8.2
7.16.
26.
35.
85.
23
612
3 39
43
019
229.
619
9.7
174.
317
7.516
3.9
145.
1
Norw
ay54
3332
1.5
0.8
0.7
1.2
0.7
0.6
1 57
11
175
1 05
843
.629
.624
.534
.924
.020
.1
Oman
5460
723.
82.
72.
12.
42.
01.
61
882
2 18
22
768
131.
996
.579
.183
.071
.761
.8
Paki
stan
9 75
610
989
12 0
5311
.89.
89.
26.
96.
15.
928
0 97
131
7 60
734
8 97
134
0.1
284.
126
6.5
197.4
177.0
171.
4
Pana
ma
9289
102
4.5
3.4
3.5
3.0
2.4
2.5
2 51
02
522
2 96
312
1.8
97.7
101.
482
.869
.273
.4
Papu
a Ne
w G
uine
a33
136
946
99.
48.
28.
95.
75.
05.
712
063
13 21
216
631
342.
529
2.9
316.
420
6.3
180.
720
1.1
Para
guay
288
275
282
8.8
6.6
5.9
5.4
4.4
4.2
9 27
88
547
8 67
828
3.3
204.
018
3.0
174.
313
6.8
128.
0
Peru
915
981
1 03
65.
34.
84.
63.
53.
43.
329
009
31 4
4333
191
167.2
155.
014
7.210
9.6
108.
310
7.3
Phili
ppin
es2
971
8 52
210
484
6.2
13.7
14.9
3.8
9.1
10.1
103
309
289
356
351
579
215.
346
6.5
498.
213
2.5
307.9
339.
2
Pola
nd1
247
906
735
4.0
2.8
2.3
3.2
2.4
1.9
40 4
4530
648
25 2
3713
0.4
94.3
78.0
104.
980
.066
.4
Port
ugal
897
479
352
10.4
5.3
4.0
8.7
4.5
3.4
20 8
4711
554
8 86
224
1.1
128.
299
.720
2.5
109.
085
.8
Qata
r5
1018
1.1
0.6
0.8
0.8
0.5
0.7
262
618
909
59.5
38.2
39.6
44.2
33.3
34.2
Repu
blic
of K
orea
3 34
02
041
1 73
38.
94.
93.
97.0
4.1
3.4
105
200
67 4
2659
047
279.
716
2.2
133.
922
2.0
136.
111
5.8
Repu
blic
of M
oldo
va26
923
118
68.
46.
85.
46.
45.
74.
68
383
7 21
35
577
260.
621
1.4
162.
919
9.5
176.
513
7.2
Rom
ania
2 35
11
630
1 13
313
.09.
56.
810
.68.
05.
764
720
43 2
4230
231
359.
125
0.8
180.
629
2.4
211.
215
2.7
70 WHO/ILO JOINT ESTIMATES OF THE WORK-RELATED BURDEN OF DISEASE AND INJURY, 2000-2016
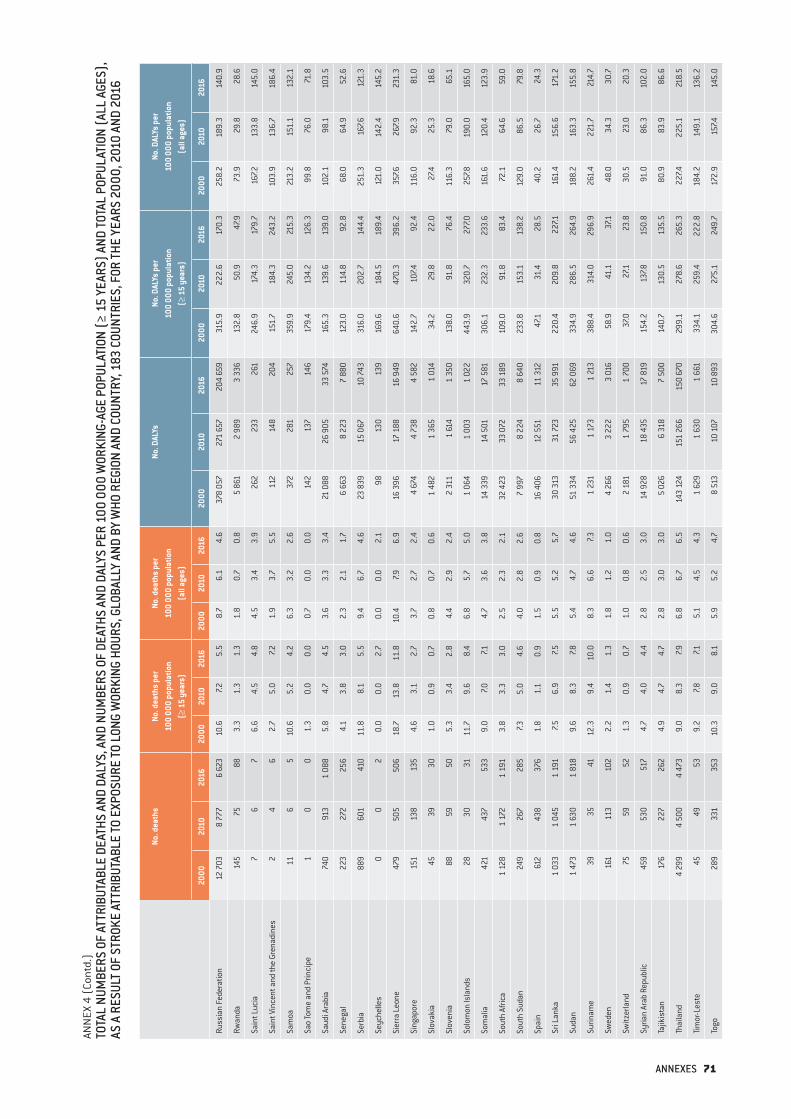
ANN
EX 4
(Co
ntd.
)TO
TAL
NUM
BERS
OF
ATTR
IBUT
ABLE
DEA
THS
AND
DALY
S, A
ND N
UMBE
RS O
F DE
ATHS
AND
DAL
YS P
ER 1
00 0
00 W
ORKI
NG-A
GE P
OPUL
ATIO
N (≥
15
YEAR
S) A
ND TO
TAL
POPU
LATI
ON (A
LL A
GES)
, AS
A R
ESUL
T OF
STRO
KE A
TTRI
BUTA
BLE
TO E
XPOS
URE
TO L
ONG
WOR
KING
HOU
RS, G
LOBA
LLY
AND
BY W
HO R
EGIO
N AN
D CO
UNTR
Y, 1
83 C
OUNT
RIES
, FOR
THE
YEAR
S 20
00, 2
010
AND
2016
No. d
eath
sNo
. dea
ths
per
100
000
popu
latio
n
(≥ 1
5 ye
ars)
No. d
eath
s pe
r 10
0 00
0 po
pula
tion
(a
ll ag
es)
No. D
ALYs
No. D
ALYs
per
10
0 00
0 po
pula
tion
(≥
15
year
s)
No. D
ALYs
per
10
0 00
0 po
pula
tion
(a
ll ag
es)
2000
2010
2016
2000
2010
2016
2000
2010
2016
2000
2010
2016
2000
2010
2016
2000
2010
2016
Russ
ian
Fede
ratio
n12
703
8 77
76
623
10.6
7.25.
58.
76.
14.
637
8 05
727
1 65
720
4 65
931
5.9
222.
617
0.3
258.
218
9.3
140.
9
Rwan
da14
575
883.
31.
31.
31.
80.
70.
85
861
2 98
93
336
132.
850
.947
.973
.929
.828
.6
Sain
t Luc
ia7
67
6.6
4.5
4.8
4.5
3.4
3.9
262
233
261
246.
917
4.3
179.
716
7.213
3.8
145.
0
Sain
t Vin
cent
and
the
Gren
adin
es2
46
2.7
5.0
7.21.
93.
75.
511
214
820
415
1.7
184.
324
3.2
103.
913
6.7
186.
4
Sam
oa11
65
10.6
5.2
4.2
6.3
3.2
2.6
372
281
257
359.
924
5.0
215.
321
3.2
151.
113
2.1
Sao
Tom
e an
d Pr
inci
pe1
00
1.3
0.0
0.0
0.7
0.0
0.0
142
137
146
179.
413
4.2
126.
399
.876
.071
.8
Saud
i Ara
bia
740
913
1 08
85.
84.
74.
53.
63.
33.
421
088
26 9
0533
574
165.
313
9.6
139.
010
2.1
98.1
103.
5
Sene
gal
223
272
256
4.1
3.8
3.0
2.3
2.1
1.7
6 66
38
223
7 88
012
3.0
114.
892
.868
.064
.952
.6
Serb
ia88
960
141
011
.88.
15.
59.
46.
74.
623
839
15 0
6710
743
316.
020
2.7
144.
425
1.3
167.6
121.
3
Seyc
helle
s0
02
0.0
0.0
2.7
0.0
0.0
2.1
9813
013
916
9.6
184.
518
9.4
121.
014
2.4
145.
2
Sier
ra L
eone
479
505
506
18.7
13.8
11.8
10.4
7.96.
916
396
17 1
8816
949
640.
647
0.3
396.
235
7.626
7.923
1.3
Sing
apor
e15
113
813
54.
63.
12.
73.
72.
72.
44
674
4 73
84
582
142.
710
7.492
.411
6.0
92.3
81.0
Slov
akia
4539
301.
00.
90.
70.
80.
70.
61
482
1 36
51
014
34.2
29.8
22.0
27.4
25.3
18.6
Slov
enia
8859
505.
33.
42.
84.
42.
92.
42
311
1 61
41
350
138.
091
.876
.411
6.3
79.0
65.1
Solo
mon
Isla
nds
2830
3111
.79.
68.
46.
85.
75.
01
064
1 00
31
022
443.
932
0.7
277.0
257.8
190.
016
5.0
Som
alia
421
437
533
9.0
7.07.1
4.7
3.6
3.8
14 3
3914
501
17 5
8130
6.1
232.
323
3.6
161.
612
0.4
123.
9
Sout
h Af
rica
1 12
81
172
1 19
13.
83.
33.
02.
52.
32.
132
423
33 0
7233
189
109.
091
.883
.472
.164
.659
.0
Sout
h Su
dan
249
267
285
7.35.
04.
64.
02.
82.
67
997
8 22
48
640
233.
815
3.1
138.
212
9.0
86.5
79.8
Spai
n61
243
837
61.
81.
10.
91.
50.
90.
816
406
12 5
5111
312
47.1
31.4
28.5
40.2
26.7
24.3
Sri L
anka
1 03
31
045
1 19
17.5
6.9
7.55.
55.
25.
730
313
31 7
2335
991
220.
420
9.8
227.1
161.
415
6.6
171.
2
Suda
n1
473
1 63
01
818
9.6
8.3
7.85.
44.
74.
651
334
56 4
2562
069
334.
928
6.5
264.
918
8.2
163.
315
5.8
Surin
ame
3935
4112
.39.
410
.08.
36.
67.3
1 23
11
173
1 21
338
8.4
314.
029
6.9
261.
422
1.7
214.
7
Swed
en16
111
310
22.
21.
41.
31.
81.
21.
04
266
3 22
23
016
58.9
41.1
37.1
48.0
34.3
30.7
Switz
erla
nd75
5952
1.3
0.9
0.7
1.0
0.8
0.6
2 18
11
795
1 70
037
.027
.123
.830
.523
.020
.3
Syria
n Ar
ab R
epub
lic45
953
051
74.
74.
04.
42.
82.
53.
014
928
18 4
3517
819
154.
213
7.815
0.8
91.0
86.3
102.
0
Tajik
ista
n17
622
726
24.
94.
74.
72.
83.
03.
05
026
6 31
87
500
140.
713
0.5
135.
580
.983
.986
.6
Thai
land
4 29
94
500
4 47
39.
08.
37.9
6.8
6.7
6.5
143
124
151
266
150
670
299.
127
8.6
265.
322
7.422
5.1
218.
5
Tim
or-L
este
4549
539.
27.8
7.15.
14.
54.
31
629
1 63
01
661
334.
125
9.4
222.
818
4.2
149.
113
6.2
Togo
289
331
353
10.3
9.0
8.1
5.9
5.2
4.7
8 51
310
107
10 8
9330
4.6
275.
124
9.7
172.
915
7.414
5.0
ANNEXES 71
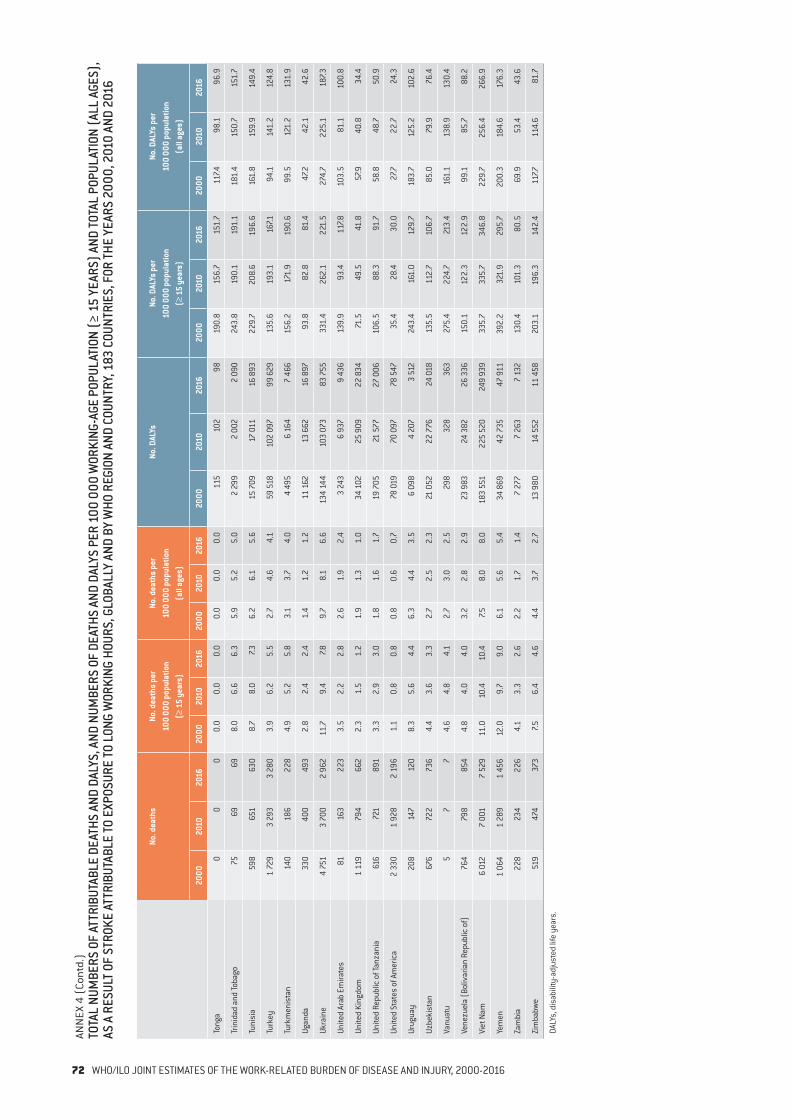
ANN
EX 4
(Co
ntd.
)TO
TAL
NUM
BERS
OF
ATTR
IBUT
ABLE
DEA
THS
AND
DALY
S, A
ND N
UMBE
RS O
F DE
ATHS
AND
DAL
YS P
ER 1
00 0
00 W
ORKI
NG-A
GE P
OPUL
ATIO
N (≥
15
YEAR
S) A
ND TO
TAL
POPU
LATI
ON (A
LL A
GES)
, AS
A R
ESUL
T OF
STRO
KE A
TTRI
BUTA
BLE
TO E
XPOS
URE
TO L
ONG
WOR
KING
HOU
RS, G
LOBA
LLY
AND
BY W
HO R
EGIO
N AN
D CO
UNTR
Y, 1
83 C
OUNT
RIES
, FOR
THE
YEAR
S 20
00, 2
010
AND
2016
No. d
eath
sNo
. dea
ths
per
100
000
popu
latio
n
(≥ 1
5 ye
ars)
No. d
eath
s pe
r 10
0 00
0 po
pula
tion
(a
ll ag
es)
No. D
ALYs
No. D
ALYs
per
10
0 00
0 po
pula
tion
(≥
15
year
s)
No. D
ALYs
per
10
0 00
0 po
pula
tion
(a
ll ag
es)
2000
2010
2016
2000
2010
2016
2000
2010
2016
2000
2010
2016
2000
2010
2016
2000
2010
2016
Tong
a0
00
0.0
0.0
0.0
0.0
0.0
0.0
115
102
9819
0.8
156.
715
1.7
117.4
98.1
96.9
Trin
idad
and
Toba
go75
6969
8.0
6.6
6.3
5.9
5.2
5.0
2 29
92
002
2 09
024
3.8
190.
119
1.1
181.
415
0.7
151.
7
Tuni
sia
598
651
630
8.7
8.0
7.36.
26.
15.
615
709
17 0
1116
893
229.
720
8.6
196.
616
1.8
159.
914
9.4
Turk
ey1
729
3 29
33
280
3.9
6.2
5.5
2.7
4.6
4.1
59 5
1810
2 09
799
629
135.
619
3.1
167.1
94.1
141.
212
4.8
Turk
men
ista
n14
018
622
84.
95.
25.
83.
13.
74.
04
495
6 16
47
466
156.
217
1.9
190.
699
.512
1.2
131.
9
Ugan
da33
040
049
32.
82.
42.
41.
41.
21.
211
162
13 6
6216
897
93.8
82.8
81.4
47.2
42.1
42.6
Ukra
ine
4 75
13
700
2 96
211
.79.
47.8
9.7
8.1
6.6
134
144
103
073
83 7
5533
1.4
262.
122
1.5
274.
722
5.1
187.3
Unite
d Ar
ab E
mira
tes
8116
322
33.
52.
22.
82.
61.
92.
43
243
6 93
79
436
139.
993
.411
7.810
3.5
81.1
100.
8
Unite
d Ki
ngdo
m1
119
794
662
2.3
1.5
1.2
1.9
1.3
1.0
34 1
0225
909
22 8
3471
.549
.541
.857
.940
.834
.4
Unite
d Re
publ
ic o
f Tan
zani
a61
672
189
13.
32.
93.
01.
81.
61.
719
705
21 5
7727
006
106.
588
.391
.758
.848
.750
.9
Unite
d St
ates
of A
mer
ica
2 33
01
928
2 19
61.
10.
80.
80.
80.
60.
778
019
70 0
9778
547
35.4
28.4
30.0
27.7
22.7
24.3
Urug
uay
208
147
120
8.3
5.6
4.4
6.3
4.4
3.5
6 09
84
207
3 51
224
3.4
161.
012
9.7
183.
712
5.2
102.
6
Uzbe
kist
an67
672
273
64.
43.
63.
32.
72.
52.
321
052
22 7
7624
018
135.
511
2.7
106.
785
.079
.976
.4
Vanu
atu
57
74.
64.
84.
12.
73.
02.
529
832
836
327
5.4
224.
721
3.4
161.
113
8.9
130.
4
Vene
zuel
a (B
oliv
aria
n Re
publ
ic o
f)76
479
885
44.
84.
04.
03.
22.
82.
923
983
24 3
8226
336
150.
112
2.3
122.
999
.185
.788
.2
Viet
Nam
6 01
27
001
7 52
911
.010
.410
.47.5
8.0
8.0
183
551
225
520
249
939
335.
733
5.7
346.
822
9.7
256.
426
6.9
Yem
en1
064
1 28
91
456
12.0
9.7
9.0
6.1
5.6
5.4
34 8
6942
735
47 9
1139
2.2
321.
929
5.7
200.
318
4.6
176.
3
Zam
bia
228
234
226
4.1
3.3
2.6
2.2
1.7
1.4
7 27
77
263
7 13
213
0.4
101.
380
.569
.953
.443
.6
Zim
babw
e51
947
437
37.5
6.4
4.6
4.4
3.7
2.7
13 9
8014
552
11 4
5820
3.1
196.
314
2.4
117.7
114.
681
.7
DALY
s, d
isab
ility
-adj
uste
d lif
e ye
ars.
72 WHO/ILO JOINT ESTIMATES OF THE WORK-RELATED BURDEN OF DISEASE AND INJURY, 2000-2016
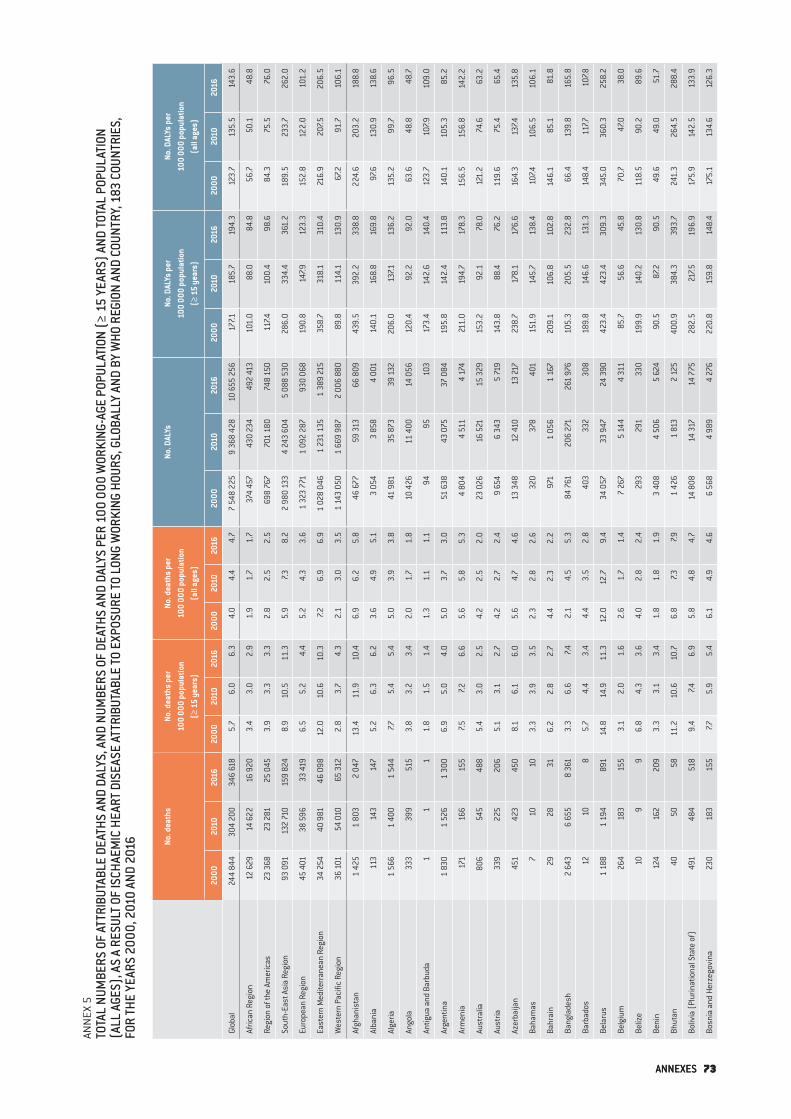
ANN
EX 5
TOTA
L NU
MBE
RS O
F AT
TRIB
UTAB
LE D
EATH
S AN
D DA
LYS,
AND
NUM
BERS
OF
DEAT
HS A
ND D
ALYS
PER
100
000
WOR
KING
-AGE
POP
ULAT
ION
(≥ 1
5 YE
ARS)
AND
TOTA
L PO
PULA
TION
(A
LL A
GES)
, AS
A RE
SULT
OF
ISCH
AEM
IC H
EART
DIS
EASE
ATT
RIBU
TABL
E TO
EXP
OSUR
E TO
LON
G W
ORKI
NG H
OURS
, GLO
BALL
Y AN
D BY
WHO
REG
ION
AND
COUN
TRY,
183
COU
NTRI
ES,
FOR
THE
YEAR
S 20
00, 2
010
AND
2016 No
. dea
ths
No. d
eath
s pe
r 10
0 00
0 po
pula
tion
(≥
15
year
s)
No. d
eath
s pe
r 10
0 00
0 po
pula
tion
(a
ll ag
es)
No. D
ALYs
No. D
ALYs
per
10
0 00
0 po
pula
tion
(≥
15
year
s)
No. D
ALYs
per
10
0 00
0 po
pula
tion
(a
ll ag
es)
2000
2010
2016
2000
2010
2016
2000
2010
2016
2000
2010
2016
2000
2010
2016
2000
2010
2016
Glob
al24
4 84
430
4 20
034
6 61
85.
76.
06.
34.
04.
44.
77
548
225
9 36
8 42
810
655
256
177.1
185.
719
4.3
123.
713
5.5
143.
6
Afric
an R
egio
n12
629
14 6
2216
920
3.4
3.0
2.9
1.9
1.7
1.7
374
457
430
234
492
413
101.
088
.084
.856
.750
.148
.8
Regi
on o
f the
Am
eric
as23
368
23 2
8125
045
3.9
3.3
3.3
2.8
2.5
2.5
698
767
701
180
748
150
117.4
100.
498
.684
.375
.576
.0
Sout
h-Ea
st A
sia
Regi
on93
091
132
710
159
824
8.9
10.5
11.3
5.9
7.38.
22
980
133
4 24
3 60
45
088
530
286.
033
4.4
361.
218
9.5
233.
726
2.0
Euro
pean
Reg
ion
45 4
0138
596
33 4
196.
55.
24.
45.
24.
33.
61
323
771
1 09
2 28
793
0 06
819
0.8
147.9
123.
315
2.8
122.
010
1.2
East
ern
Med
iterr
anea
n Re
gion
34 2
5440
981
46 0
9812
.010
.610
.37.2
6.9
6.9
1 02
8 04
61
231
135
1 38
9 21
535
8.7
318.
131
0.4
216.
920
7.520
6.5
Wes
tern
Pac
ific
Regi
on36
101
54 0
1065
312
2.8
3.7
4.3
2.1
3.0
3.5
1 14
3 05
01
669
987
2 00
6 88
089
.811
4.1
130.
967
.291
.710
6.1
Afgh
anis
tan
1 42
51
803
2 04
713
.411
.910
.46.
96.
25.
846
677
59 3
1366
809
439.
539
2.2
338.
822
4.6
203.
218
8.8
Alba
nia
113
143
147
5.2
6.3
6.2
3.6
4.9
5.1
3 05
43
858
4 00
114
0.1
168.
816
9.8
97.6
130.
913
8.6
Alge
ria1
566
1 40
01
544
7.75.
45.
45.
03.
93.
841
981
35 8
7339
132
206.
013
7.113
6.2
135.
299
.796
.5
Ango
la33
339
951
53.
83.
23.
42.
01.
71.
810
426
11 4
0014
056
120.
492
.292
.063
.648
.848
.7
Antig
ua a
nd B
arbu
da1
11
1.8
1.5
1.4
1.3
1.1
1.1
9495
103
173.
414
2.6
140.
412
3.7
107.9
109.
0
Arge
ntin
a1
830
1 52
61
300
6.9
5.0
4.0
5.0
3.7
3.0
51 6
3843
075
37 0
8419
5.8
142.
411
3.8
140.
110
5.3
85.2
Arm
enia
171
166
155
7.57.2
6.6
5.6
5.8
5.3
4 80
44
511
4 17
421
1.0
194.
717
8.3
156.
515
6.8
142.
2
Aust
ralia
806
545
488
5.4
3.0
2.5
4.2
2.5
2.0
23 0
2616
521
15 3
2915
3.2
92.1
78.0
121.
274
.663
.2
Aust
ria33
922
520
65.
13.
12.
74.
22.
72.
49
654
6 34
35
719
143.
888
.476
.211
9.6
75.4
65.4
Azer
baija
n45
142
345
08.
16.
16.
05.
64.
74.
613
348
12 4
1013
217
238.
717
8.1
176.
616
4.3
137.4
135.
8
Baha
mas
710
103.
33.
93.
52.
32.
82.
632
037
840
115
1.9
145.
713
8.4
107.4
106.
510
6.1
Bahr
ain
2928
316.
22.
82.
74.
42.
32.
297
11
056
1 16
720
9.1
106.
810
2.8
146.
185
.181
.8
Bang
lade
sh2
643
6 65
58
361
3.3
6.6
7.42.
14.
55.
384
761
206
271
261
976
105.
320
5.5
232.
866
.413
9.8
165.
8
Barb
ados
1210
85.
74.
43.
44.
43.
52.
840
333
230
818
9.8
146.
613
1.3
148.
411
7.710
7.8
Bela
rus
1 18
81
194
891
14.8
14.9
11.3
12.0
12.7
9.4
34 0
5733
947
24 3
9042
3.4
423.
430
9.3
345.
036
0.3
258.
2
Belg
ium
264
183
155
3.1
2.0
1.6
2.6
1.7
1.4
7 2
675
144
4 31
185
.756
.645
.870
.747
.038
.0
Beliz
e10
99
6.8
4.3
3.6
4.0
2.8
2.4
293
291
330
199.
914
0.2
130.
811
8.5
90.2
89.6
Beni
n12
416
220
93.
33.
13.
41.
81.
81.
93
408
4 50
65
624
90.5
87.2
90.5
49.6
49.0
51.7
Bhut
an40
5058
11.2
10.6
10.7
6.8
7.37.9
1 4
26 1
813
2 12
540
0.9
384.
339
3.7
241.
326
4.5
288.
4
Boliv
ia (P
lurin
atio
nal S
tate
of)
491
484
518
9.4
7.46.
95.
84.
84.
714
808
14 3
1714
775
282.
521
7.519
6.9
175.
914
2.5
133.
9
Bosn
ia a
nd H
erze
govi
na23
018
315
57.7
5.9
5.4
6.1
4.9
4.6
6 56
84
989
4 27
622
0.8
159.
814
8.4
175.
113
4.6
126.
3
ANNEXES 73 ANNEXES 73
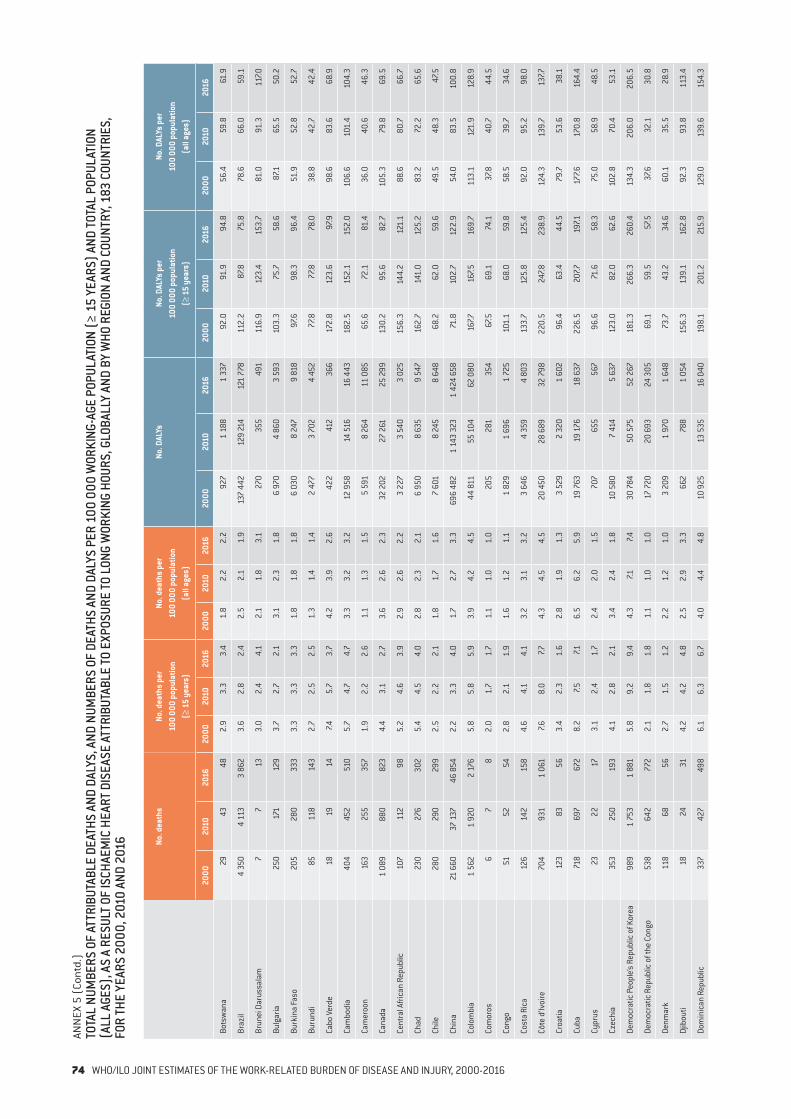
ANN
EX 5
(Co
ntd.
)TO
TAL
NUM
BERS
OF
ATTR
IBUT
ABLE
DEA
THS
AND
DALY
S, A
ND N
UMBE
RS O
F DE
ATHS
AND
DAL
YS P
ER 1
00 0
00 W
ORKI
NG-A
GE P
OPUL
ATIO
N (≥
15
YEAR
S) A
ND TO
TAL
POPU
LATI
ON
(ALL
AGE
S), A
S A
RESU
LT O
F IS
CHAE
MIC
HEA
RT D
ISEA
SE A
TTRI
BUTA
BLE
TO E
XPOS
URE
TO L
ONG
WOR
KING
HOU
RS, G
LOBA
LLY
AND
BY W
HO R
EGIO
N AN
D CO
UNTR
Y, 1
83 C
OUNT
RIES
, FO
R TH
E YE
ARS
2000
, 201
0 AN
D 20
16 No. d
eath
sNo
. dea
ths
per
100
000
popu
latio
n
(≥ 1
5 ye
ars)
No. d
eath
s pe
r 10
0 00
0 po
pula
tion
(a
ll ag
es)
No. D
ALYs
No. D
ALYs
per
10
0 00
0 po
pula
tion
(≥
15
year
s)
No. D
ALYs
per
10
0 00
0 po
pula
tion
(a
ll ag
es)
2000
2010
2016
2000
2010
2016
2000
2010
2016
2000
2010
2016
2000
2010
2016
2000
2010
2016
Bots
wan
a29
4348
2.9
3.3
3.4
1.8
2.2
2.2
927
1 18
81
337
92.0
91.9
94.8
56.4
59.8
61.9
Braz
il4
350
4 11
33
862
3.6
2.8
2.4
2.5
2.1
1.9
137
442
129
214
121
778
112.
287
.875
.878
.666
.059
.1
Brun
ei D
arus
sala
m7
713
3.0
2.4
4.1
2.1
1.8
3.1
270
355
491
116.
912
3.4
153.
781
.091
.311
7.0
Bulg
aria
250
171
129
3.7
2.7
2.1
3.1
2.3
1.8
6 97
04
860
3 59
310
3.3
75.7
58.6
87.1
65.5
50.2
Burk
ina
Faso
205
280
333
3.3
3.3
3.3
1.8
1.8
1.8
6 03
08
247
9 81
897
.698
.396
.451
.952
.852
.7
Buru
ndi
8511
814
32.
72.
52.
51.
31.
41.
42
477
3 70
24
452
77.8
77.8
78.0
38.8
42.7
42.4
Cabo
Ver
de18
1914
7.45.
73.
74.
23.
92.
642
241
236
617
2.8
123.
697
.998
.683
.668
.9
Cam
bodi
a40
445
251
05.
74.
74.
73.
33.
23.
212
958
14 5
1616
443
182.
515
2.1
152.
010
6.6
101.
410
4.3
Cam
eroo
n16
325
535
71.
92.
22.
61.
11.
31.
55
591
8 26
411
085
65.6
72.1
81.4
36.0
40.6
46.3
Cana
da1
089
880
823
4.4
3.1
2.7
3.6
2.6
2.3
32 2
0227
261
25 2
9913
0.2
95.6
82.7
105.
379
.869
.5
Cent
ral A
frica
n Re
publ
ic10
711
298
5.2
4.6
3.9
2.9
2.6
2.2
3 22
73
540
3 02
515
6.3
144.
212
1.1
88.6
80.7
66.7
Chad
230
276
302
5.4
4.5
4.0
2.8
2.3
2.1
6 95
08
635
9 54
716
2.7
141.
012
5.2
83.2
72.2
65.6
Chile
280
290
299
2.5
2.2
2.1
1.8
1.7
1.6
7 60
18
245
8 64
868
.262
.059
.649
.548
.347
.5
Chin
a21
660
37 1
3746
854
2.2
3.3
4.0
1.7
2.7
3.3
696
482
1 14
3 32
31
424
658
71.8
102.
712
2.9
54.0
83.5
100.
8
Colo
mbi
a1
562
1 92
02
176
5.8
5.8
5.9
3.9
4.2
4.5
44 8
1155
104
62 0
8016
7.716
7.516
9.7
113.
112
1.9
128.
9
Com
oros
67
82.
01.
71.
71.
11.
01.
020
528
135
467
.569
.174
.137
.840
.744
.5
Cong
o51
5254
2.8
2.1
1.9
1.6
1.2
1.1
1 82
91
696
1 72
510
1.1
68.0
59.8
58.5
39.7
34.6
Cost
a Ri
ca12
614
215
84.
64.
14.
13.
23.
13.
23
646
4 35
94
803
133.
712
5.8
125.
492
.095
.298
.0
Côte
d’Iv
oire
704
931
1 06
17.6
8.0
7.74.
34.
54.
520
450
28 6
8932
798
220.
524
7.823
8.9
124.
313
9.7
137.7
Croa
tia12
383
563.
42.
31.
62.
81.
91.
33
529
2 32
01
602
96.4
63.4
44.5
79.7
53.6
38.1
Cuba
718
697
672
8.2
7.57.1
6.5
6.2
5.9
19
763
19 1
7618
637
226.
520
7.719
7.117
7.617
0.8
164.
4
Cypr
us23
2217
3.1
2.4
1.7
2.4
2.0
1.5
707
655
567
96.6
71.6
58.3
75.0
58.9
48.5
Czec
hia
353
250
193
4.1
2.8
2.1
3.4
2.4
1.8
10 5
807
414
5 63
712
3.0
82.0
62.6
102.
870
.453
.1
Dem
ocra
tic P
eopl
e’s R
epub
lic o
f Kor
ea98
91
753
1 88
15.
89.
29.
44.
37.1
7.430
784
50 5
7552
267
181.
326
6.3
260.
413
4.3
206.
020
6.5
Dem
ocra
tic R
epub
lic o
f the
Con
go53
864
277
22.
11.
81.
81.
11.
01.
017
720
20 6
9324
305
69.1
59.5
57.5
37.6
32.1
30.8
Denm
ark
118
6856
2.7
1.5
1.2
2.2
1.2
1.0
3 20
91
970
1 64
873
.743
.234
.660
.135
.528
.9
Djib
outi
1824
314.
24.
24.
82.
52.
93.
366
278
81
054
156.
313
9.1
162.
892
.393
.811
3.4
Dom
inic
an R
epub
lic33
742
749
86.
16.
36.
74.
04.
44.
810
925
13 5
3516
040
198.
120
1.2
215.
912
9.0
139.
615
4.3
74 WHO/ILO JOINT ESTIMATES OF THE WORK-RELATED BURDEN OF DISEASE AND INJURY, 2000-2016
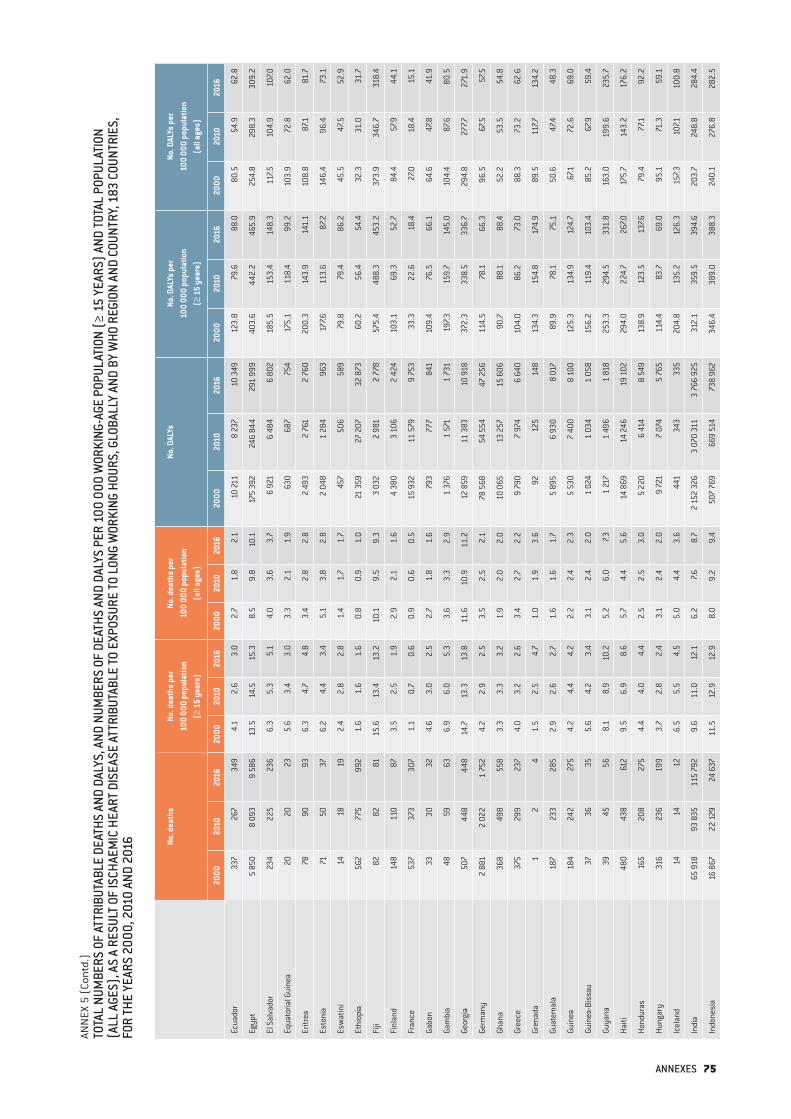
ANN
EX 5
(Co
ntd.
)TO
TAL
NUM
BERS
OF
ATTR
IBUT
ABLE
DEA
THS
AND
DALY
S, A
ND N
UMBE
RS O
F DE
ATHS
AND
DAL
YS P
ER 1
00 0
00 W
ORKI
NG-A
GE P
OPUL
ATIO
N (≥
15
YEAR
S) A
ND TO
TAL
POPU
LATI
ON
(ALL
AGE
S), A
S A
RESU
LT O
F IS
CHAE
MIC
HEA
RT D
ISEA
SE A
TTRI
BUTA
BLE
TO E
XPOS
URE
TO L
ONG
WOR
KING
HOU
RS, G
LOBA
LLY
AND
BY W
HO R
EGIO
N AN
D CO
UNTR
Y, 1
83 C
OUNT
RIES
, FO
R TH
E YE
ARS
2000
, 201
0 AN
D 20
16 No. d
eath
sNo
. dea
ths
per
100
000
popu
latio
n
(≥ 1
5 ye
ars)
No. d
eath
s pe
r 10
0 00
0 po
pula
tion
(a
ll ag
es)
No. D
ALYs
No. D
ALYs
per
10
0 00
0 po
pula
tion
(≥
15
year
s)
No. D
ALYs
per
10
0 00
0 po
pula
tion
(a
ll ag
es)
2000
2010
2016
2000
2010
2016
2000
2010
2016
2000
2010
2016
2000
2010
2016
2000
2010
2016
Ecua
dor
337
267
349
4.1
2.6
3.0
2.7
1.8
2.1
10 21
18
237
10 3
4912
3.8
79.6
88.0
80.5
54.9
62.8
Egyp
t5
850
8 09
39
586
13.5
14.5
15.3
8.5
9.8
10.1
175
392
246
844
291
999
403.
644
2.2
465.
925
4.8
298.
330
9.2
El S
alva
dor
234
225
236
6.3
5.3
5.1
4.0
3.6
3.7
6 9
21 6
484
6 80
218
5.5
153.
414
8.3
117.5
104.
910
7.0
Equa
toria
l Gui
nea
2020
235.
63.
43.
03.
32.
11.
963
068
775
417
5.1
118.
499
.210
3.9
72.8
62.0
Eritr
ea78
9093
6.3
4.7
4.8
3.4
2.8
2.8
2 49
32
761
2 76
020
0.3
143.
914
1.1
108.
887
.181
.7
Esto
nia
7150
376.
24.
43.
45.
13.
82.
8 2
048
1 28
496
317
7.611
3.6
87.2
146.
496
.473
.1
Esw
atin
i14
1819
2.4
2.8
2.8
1.4
1.7
1.7
457
506
589
79.8
79.4
86.2
45.5
47.5
52.9
Ethi
opia
562
775
992
1.6
1.6
1.6
0.8
0.9
1.0
21 3
5927
207
32 8
7360
.256
.454
.432
.331
.031
.7
Fiji
8282
8115
.613
.413
.210
.19.
59.
33
032
2 98
12
778
575.
448
8.3
453.
237
3.9
346.
731
8.4
Finl
and
148
110
873.
52.
51.
92.
92.
11.
64
380
3 10
62
424
103.
169
.352
.784
.457
.944
.1
Fran
ce53
737
330
71.
10.
70.
60.
90.
60.
515
932
11 5
799
753
33.3
22.6
18.4
27.0
18.4
15.1
Gabo
n33
3032
4.6
3.0
2.5
2.7
1.8
1.6
793
777
841
109.
476
.566
.164
.647
.841
.9
Gam
bia
4859
636.
96.
05.
33.
63.
32.
91
376
1 57
11
731
197.3
159.
714
5.0
104.
487
.680
.5
Geor
gia
507
448
448
14.7
13.3
13.8
11.6
10.9
11.2
12 8
5911
383
10 9
1837
2.3
338.
533
6.7
294.
827
7.727
1.9
Germ
any
2 88
12
022
1 75
24.
22.
92.
53.
52.
52.
178
568
54 5
5447
256
114.
578
.166
.396
.567
.557
.5
Ghan
a36
849
855
83.
33.
33.
21.
92.
02.
010
065
13 2
5715
606
90.7
88.1
88.4
52.2
53.5
54.8
Gree
ce37
529
923
74.
03.
22.
63.
42.
72.
29
790
7 97
46
640
104.
086
.273
.088
.373
.262
.6
Gren
ada
12
41.
52.
54.
71.
01.
93.
692
125
148
134.
315
4.8
174.
989
.511
7.713
4.2
Guat
emal
a18
723
328
52.
92.
62.
71.
61.
61.
75
895
6 93
08
017
89.9
78.1
75.1
50.6
47.4
48.3
Guin
ea18
424
227
54.
24.
44.
22.
22.
42.
35
530
7 40
08
100
125.
313
4.9
124.
767
.172
.669
.0
Guin
ea-B
issa
u37
3635
5.6
4.2
3.4
3.1
2.4
2.0
1 02
41
034
1 05
815
6.2
119.
410
3.4
85.2
67.9
59.4
Guya
na39
4556
8.1
8.9
10.2
5.2
6.0
7.31
217
1 49
61
818
253.
329
4.5
331.
816
3.0
199.
623
5.7
Haiti
480
438
612
9.5
6.9
8.6
5.7
4.4
5.6
14
869
14 2
4619
102
294.
022
4.7
267.0
175.
714
3.2
176.
2
Hond
uras
165
208
275
4.4
4.0
4.4
2.5
2.5
3.0
5 22
06
414
8 54
913
8.9
123.
513
7.679
.477
.192
.2
Hung
ary
316
236
199
3.7
2.8
2.4
3.1
2.4
2.0
9 72
17
074
5 7
6511
4.4
83.7
69.0
95.1
71.3
59.1
Icel
and
1414
126.
55.
54.
55.
04.
43.
644
134
333
520
4.8
135.
212
6.3
157.3
107.1
100.
8
Indi
a65
918
93 8
3511
5 79
29.
611
.012
.16.
27.6
8.7
2 15
2 32
63
070
311
3 76
6 92
531
2.1
359.
539
4.6
203.
724
8.8
284.
4
Indo
nesi
a16
867
22 1
2924
637
11.5
12.9
12.9
8.0
9.2
9.4
507
769
669
514
738
962
346.
438
9.0
388.
324
0.1
276.
828
2.5
ANNEXES 75

ANN
EX 5
(Co
ntd.
)TO
TAL
NUM
BERS
OF
ATTR
IBUT
ABLE
DEA
THS
AND
DALY
S, A
ND N
UMBE
RS O
F DE
ATHS
AND
DAL
YS P
ER 1
00 0
00 W
ORKI
NG-A
GE P
OPUL
ATIO
N (≥
15
YEAR
S) A
ND TO
TAL
POPU
LATI
ON
(ALL
AGE
S), A
S A
RESU
LT O
F IS
CHAE
MIC
HEA
RT D
ISEA
SE A
TTRI
BUTA
BLE
TO E
XPOS
URE
TO L
ONG
WOR
KING
HOU
RS, G
LOBA
LLY
AND
BY W
HO R
EGIO
N AN
D CO
UNTR
Y, 1
83 C
OUNT
RIES
, FO
R TH
E YE
ARS
2000
, 201
0 AN
D 20
16 No. d
eath
sNo
. dea
ths
per
100
000
popu
latio
n
(≥ 1
5 ye
ars)
No. d
eath
s pe
r 10
0 00
0 po
pula
tion
(a
ll ag
es)
No. D
ALYs
No. D
ALYs
per
10
0 00
0 po
pula
tion
(≥
15
year
s)
No. D
ALYs
per
10
0 00
0 po
pula
tion
(a
ll ag
es)
2000
2010
2016
2000
2010
2016
2000
2010
2016
2000
2010
2016
2000
2010
2016
2000
2010
2016
Iran
(Isl
amic
Rep
ublic
of)
4 74
54
544
4 1
6210
.98.
16.
97.2
6.2
5.2
137
015
124
141
109
657
316.
222
1.6
181.
420
8.8
168.
313
7.8
Iraq
1 20
71
327
1 51
19.
07.7
6.8
5.1
4.5
4.1
34 8
3739
959
46 4
4125
9.8
230.
920
8.3
148.
313
4.4
126.
9
Irela
nd19
611
810
46.
63.
32.
85.
22.
62.
24
598
2 70
32
406
154.
874
.965
.512
1.5
59.4
51.2
Isra
el11
271
652.
61.
31.
11.
91.
00.
83
041
1 9
731
898
71.1
36.9
32.5
51.1
26.9
23.4
Italy
1 07
877
374
82.
21.
51.
41.
91.
31.
229
477
20 7
6820
006
60.7
40.7
38.2
52.0
35.0
33.0
Jam
aica
6756
613.
72.
72.
82.
52.
02.
11
844
1 52
61
690
102.
474
.476
.869
.554
.358
.2
Japa
n4
326
4 22
13
636
4.0
3.8
3.3
3.4
3.3
2.8
121
138
113
631
97 5
8611
1.5
102.
087
.795
.088
.476
.4
Jord
an24
432
143
67.9
7.17.1
4.8
4.4
4.6
7 54
09
828
13 5
4124
3.8
216.
521
9.6
147.2
135.
314
1.7
Kaza
khst
an1
083
1 01
287
810
.08.
26.
87.3
6.2
4.9
33 9
2731
244
26 0
8031
3.7
253.
120
1.2
227.4
192.
214
6.3
Keny
a98
139
194
0.6
0.6
0.7
0.3
0.3
0.4
3 62
14
817
6 62
120
.720
.322
.811
.311
.513
.5
Kirib
ati
01
30.
01.
54.
10.
01.
02.
711
714
216
523
1.0
215.
922
5.3
138.
613
8.0
146.
6
Kuw
ait
9415
525
76.
46.
78.
34.
65.
26.
53
388
5 32
69
015
231.
323
1.8
289.
516
5.7
178.
022
7.8
Kyrg
yzst
an21
027
829
46.
67.3
7.14.
35.
14.
85
950
7 70
88
021
185.
920
2.8
194.
012
0.9
142.
213
2.0
Lao
Peop
le's
Dem
ocra
tic R
epub
lic31
137
440
210
.39.
48.
85.
86.
05.
99
393
11 2
3712
155
311.
528
2.9
265.
817
6.4
179.
817
7.6
Latv
ia25
118
912
612
.810
.47.5
10.5
8.9
6.4
7 11
15
047
3 35
136
3.1
277.3
200.
229
8.3
238.
216
9.7
Leba
non
414
533
709
15.6
14.5
14.5
10.8
10.8
10.6
10 5
9513
580
18 5
3240
0.1
369.
637
8.1
275.
727
4.2
276.
0
Leso
tho
4249
463.
43.
83.
32.
12.
52.
21
134
1 25
61
226
93.0
96.7
88.5
55.8
62.9
59.1
Libe
ria10
113
813
46.
26.
25.
03.
53.
52.
92
512
3 50
13
468
153.
915
7.912
9.9
88.2
90.0
75.6
Liby
a36
939
942
910
.49.
09.
36.
96.
46.
610
813
11 6
2412
891
305.
126
3.2
278.
620
1.8
187.6
198.
6
Lith
uani
a26
826
621
49.
610
.08.
77.7
8.5
7.47
395
7 25
35
626
264.
127
2.4
228.
121
1.2
232.
219
4.7
Luxe
mbo
urg
76
62.
01.
41.
21.
61.
21.
024
117
619
368
.242
.139
.855
.334
.733
.3
Mad
agas
car
434
473
468
5.0
4.0
3.2
2.8
2.2
1.9
12 0
0813
444
13 2
6613
8.9
112.
590
.876
.263
.653
.3
Mal
awi
194
148
150
3.2
1.9
1.6
1.7
1.0
0.9
5 86
04
321
4 21
097
.555
.444
.252
.629
.724
.5
Mal
aysi
a1
083
1 40
71
577
7.06.
96.
84.
75.
05.
133
221
43 9
9749
958
214.
921
6.5
216.
314
3.2
156.
016
2.8
Mal
dive
s19
1817
11.4
6.6
4.5
6.8
4.9
3.6
551
480
452
331.
317
5.7
119.
919
7.213
1.2
95.1
Mal
i19
218
522
23.
32.
32.
41.
81.
21.
25
378
5 53
46
654
91.9
70.0
71.0
49.1
36.8
37.0
Mal
ta8
98
2.5
2.6
2.1
2.0
2.2
1.8
322
267
275
102.
175
.873
.581
.864
.563
.1
Mau
ritan
ia78
9711
55.
34.
74.
63.
02.
82.
82
078
2 65
13
170
139.
912
9.1
127.8
79.0
75.9
76.1
Mau
ritiu
s47
3837
5.3
3.9
3.6
4.0
3.0
2.9
1 64
41
308
1 24
718
6.8
134.
312
1.9
138.
710
4.8
98.8
76 WHO/ILO JOINT ESTIMATES OF THE WORK-RELATED BURDEN OF DISEASE AND INJURY, 2000-2016
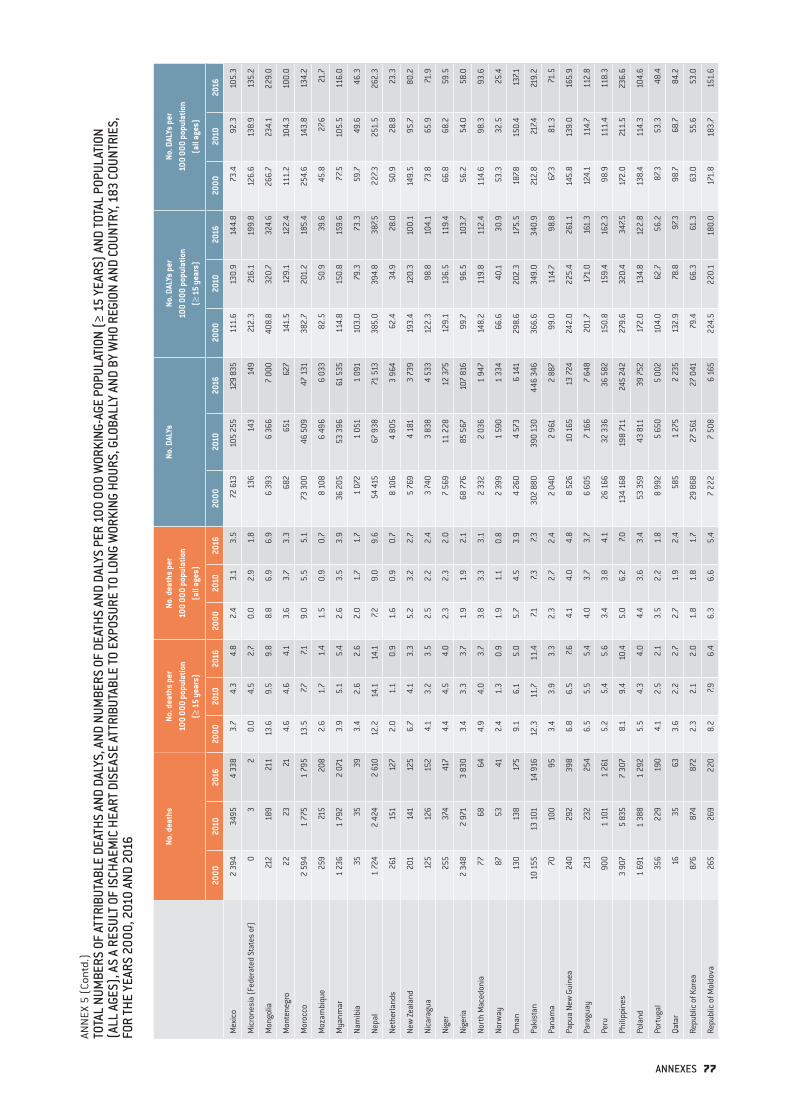
ANN
EX 5
(Co
ntd.
)TO
TAL
NUM
BERS
OF
ATTR
IBUT
ABLE
DEA
THS
AND
DALY
S, A
ND N
UMBE
RS O
F DE
ATHS
AND
DAL
YS P
ER 1
00 0
00 W
ORKI
NG-A
GE P
OPUL
ATIO
N (≥
15
YEAR
S) A
ND TO
TAL
POPU
LATI
ON
(ALL
AGE
S), A
S A
RESU
LT O
F IS
CHAE
MIC
HEA
RT D
ISEA
SE A
TTRI
BUTA
BLE
TO E
XPOS
URE
TO L
ONG
WOR
KING
HOU
RS, G
LOBA
LLY
AND
BY W
HO R
EGIO
N AN
D CO
UNTR
Y, 1
83 C
OUNT
RIES
, FO
R TH
E YE
ARS
2000
, 201
0 AN
D 20
16 No. d
eath
sNo
. dea
ths
per
100
000
popu
latio
n
(≥ 1
5 ye
ars)
No. d
eath
s pe
r 10
0 00
0 po
pula
tion
(a
ll ag
es)
No. D
ALYs
No. D
ALYs
per
10
0 00
0 po
pula
tion
(≥
15
year
s)
No. D
ALYs
per
10
0 00
0 po
pula
tion
(a
ll ag
es)
2000
2010
2016
2000
2010
2016
2000
2010
2016
2000
2010
2016
2000
2010
2016
2000
2010
2016
Mex
ico
2 39
434
954
338
3.7
4.3
4.8
2.4
3.1
3.5
72 61
310
5 25
512
9 83
511
1.6
130.
914
4.8
73.4
92.3
105.
3
Mic
rone
sia
(Fed
erat
ed S
tate
s of
)0
32
0.0
4.5
2.7
0.0
2.9
1.8
136
143
149
212.
321
6.1
199.
812
6.6
138.
913
5.2
Mon
golia
212
189
211
13.6
9.5
9.8
8.8
6.9
6.9
6 39
36
366
7 00
040
8.8
320.
732
4.6
266.
723
4.1
229.
0
Mon
tene
gro
2223
214.
64.
64.
13.
63.
73.
368
265
162
714
1.5
129.
112
2.4
111.
210
4.3
100.
0
Mor
occo
2 59
41
775
1 79
513
.57.7
7.19.
05.
55.
173
300
46 5
0947
131
382.
720
1.2
185.
425
4.6
143.
813
4.2
Moz
ambi
que
259
215
208
2.6
1.7
1.4
1.5
0.9
0.7
8 10
86
496
6 0
3382
.550
.939
.645
.827
.621
.7
Mya
nmar
1 23
61
792
2 07
13.
95.
15.
42.
63.
53.
936
205
53 3
9661
535
114.
815
0.8
159.
677
.510
5.5
116.
0
Nam
ibia
3535
393.
42.
62.
62.
01.
71.
71
072
1 05
11
091
103.
079
.373
.359
.749
.646
.3
Nepa
l1
724
2 42
42
610
12.2
14.1
14.1
7.29.
09.
654
415
67 9
3871
513
385.
039
4.8
387.5
227.3
251.
526
2.3
Neth
erla
nds
261
151
127
2.0
1.1
0.9
1.6
0.9
0.7
8 10
64
805
3 96
462
.434
.928
.050
.928
.823
.3
New
Zeal
and
201
141
125
6.7
4.1
3.3
5.2
3.2
2.7
5 76
94
181
3 73
919
3.4
120.
310
0.1
149.
595
.780
.2
Nica
ragu
a12
512
615
24.
13.
23.
52.
52.
22.
43
740
3 83
84
533
122.
398
.810
4.1
73.8
65.9
71.9
Nige
r25
537
441
74.
44.
54.
02.
32.
32.
07
569
11 2
2812
375
129.
113
6.5
119.
466
.868
.259
.5
Nige
ria2
348
2 97
13
830
3.4
3.3
3.7
1.9
1.9
2.1
68 7
7685
567
107
816
99.7
96.5
103.
756
.254
.058
.0
Nort
h M
aced
onia
7768
644.
94.
03.
73.
83.
33.
12
332
2 03
61
947
148.
211
9.8
112.
411
4.6
98.3
93.6
Norw
ay87
5341
2.4
1.3
0.9
1.9
1.1
0.8
2 39
91
590
1 33
466
.640
.130
.953
.332
.525
.4
Oman
130
138
175
9.1
6.1
5.0
5.7
4.5
3.9
4 26
04
573
6 14
129
8.6
202.
317
5.5
187.8
150.
413
7.1
Paki
stan
10 1
5513
101
14 9
1612
.311
.711
.47.1
7.37.3
302
880
390
130
446
346
366.
634
9.0
340.
921
2.8
217.4
219.
2
Pana
ma
7010
095
3.4
3.9
3.3
2.3
2.7
2.4
2 04
02
961
2 88
799
.011
4.7
98.8
67.3
81.3
71.5
Papu
a Ne
w G
uine
a24
029
239
86.
86.
57.6
4.1
4.0
4.8
8 52
610
165
13 7
2424
2.0
225.
426
1.1
145.
813
9.0
165.
9
Para
guay
213
232
254
6.5
5.5
5.4
4.0
3.7
3.7
6 60
5 7
166
7 64
820
1.7
171.
016
1.3
124.
111
4.7
112.
8
Peru
900
1 10
11
261
5.2
5.4
5.6
3.4
3.8
4.1
26 1
6632
336
36 5
8215
0.8
159.
416
2.3
98.9
111.
411
8.3
Phili
ppin
es3
907
5 83
57
307
8.1
9.4
10.4
5.0
6.2
7.013
4 16
819
8 71
124
5 24
227
9.6
320.
434
7.517
2.0
211.
523
6.6
Pola
nd1
691
1 38
81
292
5.5
4.3
4.0
4.4
3.6
3.4
53 3
5943
811
39 7
5217
2.0
134.
812
2.8
138.
411
4.3
104.
6
Port
ugal
356
229
190
4.1
2.5
2.1
3.5
2.2
1.8
8 99
25
650
5 00
210
4.0
62.7
56.2
87.3
53.3
48.4
Qata
r16
3563
3.6
2.2
2.7
2.7
1.9
2.4
585
1 27
52
235
132.
978
.897
.398
.768
.784
.2
Repu
blic
of K
orea
876
874
872
2.3
2.1
2.0
1.8
1.8
1.7
29 8
6827
561
27 0
4179
.466
.361
.363
.055
.653
.0
Repu
blic
of M
oldo
va26
526
922
08.
27.9
6.4
6.3
6.6
5.4
7 22
27
508
6 16
522
4.5
220.
118
0.0
171.
818
3.7
151.
6
ANNEXES 77
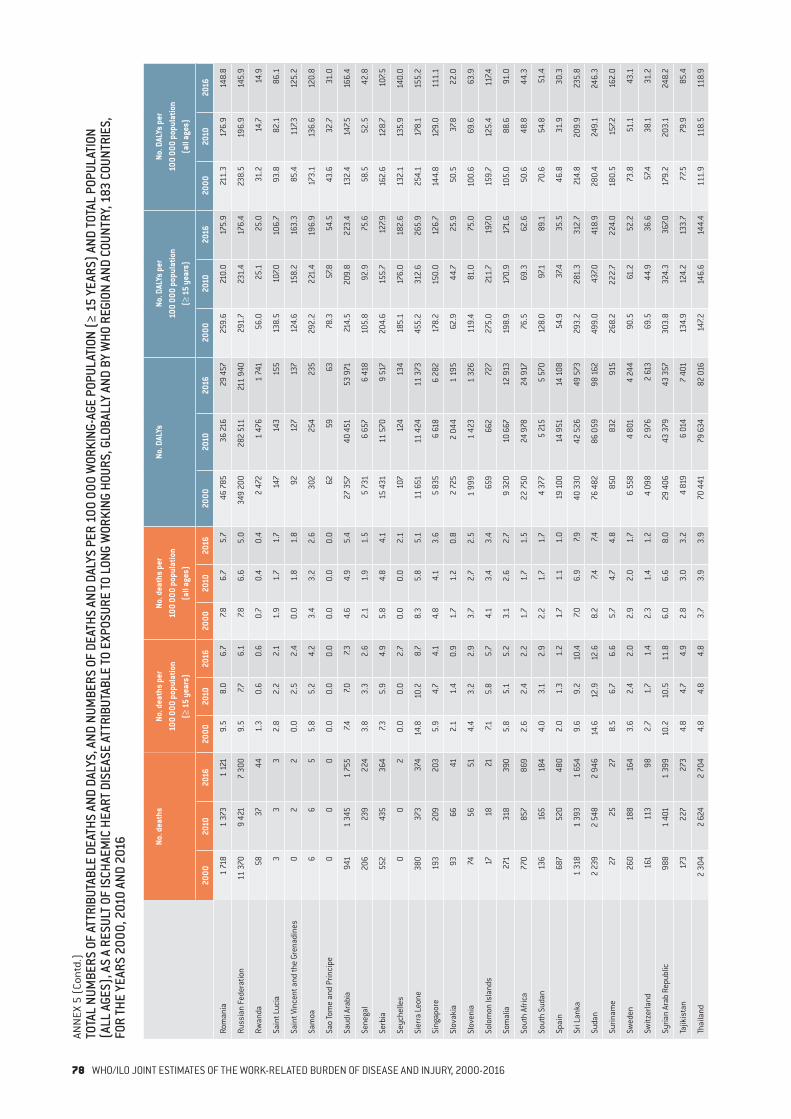
ANN
EX 5
(Co
ntd.
)TO
TAL
NUM
BERS
OF
ATTR
IBUT
ABLE
DEA
THS
AND
DALY
S, A
ND N
UMBE
RS O
F DE
ATHS
AND
DAL
YS P
ER 1
00 0
00 W
ORKI
NG-A
GE P
OPUL
ATIO
N (≥
15
YEAR
S) A
ND TO
TAL
POPU
LATI
ON
(ALL
AGE
S), A
S A
RESU
LT O
F IS
CHAE
MIC
HEA
RT D
ISEA
SE A
TTRI
BUTA
BLE
TO E
XPOS
URE
TO L
ONG
WOR
KING
HOU
RS, G
LOBA
LLY
AND
BY W
HO R
EGIO
N AN
D CO
UNTR
Y, 1
83 C
OUNT
RIES
, FO
R TH
E YE
ARS
2000
, 201
0 AN
D 20
16 No. d
eath
sNo
. dea
ths
per
100
000
popu
latio
n
(≥ 1
5 ye
ars)
No. d
eath
s pe
r 10
0 00
0 po
pula
tion
(a
ll ag
es)
No. D
ALYs
No. D
ALYs
per
10
0 00
0 po
pula
tion
(≥
15
year
s)
No. D
ALYs
per
10
0 00
0 po
pula
tion
(a
ll ag
es)
2000
2010
2016
2000
2010
2016
2000
2010
2016
2000
2010
2016
2000
2010
2016
2000
2010
2016
Rom
ania
1 71
81
373
1 12
19.
58.
06.
77.8
6.7
5.7
46 7
8536
216
29 4
5725
9.6
210.
017
5.9
211.
317
6.9
148.
8
Russ
ian
Fede
ratio
n11
370
9 42
17
300
9.5
7.76.
17.8
6.6
5.0
349
200
282
511
211
940
291.
723
1.4
176.
423
8.5
196.
914
5.9
Rwan
da58
3744
1.3
0.6
0.6
0.7
0.4
0.4
2 47
21
476
1 74
156
.025
.125
.031
.214
.714
.9
Sain
t Luc
ia3
33
2.8
2.2
2.1
1.9
1.7
1.7
147
143
155
138.
510
7.010
6.7
93.8
82.1
86.1
Sain
t Vin
cent
and
the
Gren
adin
es0
22
0.0
2.5
2.4
0.0
1.8
1.8
9212
713
712
4.6
158.
216
3.3
85.4
117.3
125.
2
Sam
oa6
65
5.8
5.2
4.2
3.4
3.2
2.6
302
254
235
292.
222
1.4
196.
917
3.1
136.
612
0.8
Sao
Tom
e an
d Pr
inci
pe0
00
0.0
0.0
0.0
0.0
0.0
0.0
6259
6378
.357
.854
.543
.632
.731
.0
Saud
i Ara
bia
941
1 34
51
755
7.47.0
7.34.
64.
95.
427
357
40 4
5153
971
214.
520
9.8
223.
413
2.4
147.5
166.
4
Sene
gal
206
239
224
3.8
3.3
2.6
2.1
1.9
1.5
5 73
16
657
6 41
810
5.8
92.9
75.6
58.5
52.5
42.8
Serb
ia55
243
536
47.3
5.9
4.9
5.8
4.8
4.1
15 4
3111
570
9 51
720
4.6
155.
712
7.916
2.6
128.
710
7.5
Seyc
helle
s0
02
0.0
0.0
2.7
0.0
0.0
2.1
107
124
134
185.
117
6.0
182.
613
2.1
135.
914
0.0
Sier
ra L
eone
380
373
374
14.8
10.2
8.7
8.3
5.8
5.1
11 6
5111
424
11 3
7345
5.2
312.
626
5.9
254.
117
8.1
155.
2
Sing
apor
e19
320
920
35.
94.
74.
14.
84.
13.
65
835
6 61
86
282
178.
215
0.0
126.
714
4.8
129.
011
1.1
Slov
akia
9366
412.
11.
40.
91.
71.
20.
82
725
2 04
41
195
62.9
44.7
25.9
50.5
37.8
22.0
Slov
enia
7456
514.
43.
22.
93.
72.
72.
51
999
1 42
31
326
119.
481
.075
.010
0.6
69.6
63.9
Solo
mon
Isla
nds
1718
217.1
5.8
5.7
4.1
3.4
3.4
659
662
727
275.
021
1.7
197.0
159.
712
5.4
117.4
Som
alia
271
318
390
5.8
5.1
5.2
3.1
2.6
2.7
9 32
010
667
12 9
1319
8.9
170.
917
1.6
105.
088
.691
.0
Sout
h Af
rica
770
857
869
2.6
2.4
2.2
1.7
1.7
1.5
22 7
5024
978
24 9
1776
.569
.362
.650
.648
.844
.3
Sout
h Su
dan
136
165
184
4.0
3.1
2.9
2.2
1.7
1.7
4 37
75
215
5 57
012
8.0
97.1
89.1
70.6
54.8
51.4
Spai
n68
752
048
02.
01.
31.
21.
71.
11.
019
100
14 9
5114
108
54.9
37.4
35.5
46.8
31.9
30.3
Sri L
anka
1 31
81
393
1 65
49.
69.
210
.47.0
6.9
7.940
330
42 5
2649
573
293.
228
1.3
312.
721
4.8
209.
923
5.8
Suda
n2
239
2 54
82
946
14.6
12.9
12.6
8.2
7.47.4
76 4
8286
059
98 1
6249
9.0
437.0
418.
928
0.4
249.
124
6.3
Surin
ame
2725
278.
56.
76.
65.
74.
74.
885
083
2 9
1526
8.2
222.
722
4.0
180.
515
7.216
2.0
Swed
en26
018
816
43.
62.
42.
02.
92.
01.
76
558
4 80
14
244
90.5
61.2
52.2
73.8
51.1
43.1
Switz
erla
nd16
111
398
2.7
1.7
1.4
2.3
1.4
1.2
4 09
82
976
2 61
369
.544
.936
.657
.438
.131
.2
Syria
n Ar
ab R
epub
lic98
81
401
1 39
910
.210
.511
.86.
06.
68.
029
406
43 3
7943
357
303.
832
4.3
367.0
179.
220
3.1
248.
2
Tajik
ista
n17
322
727
34.
84.
74.
92.
83.
03.
24
819
6 01
47
401
134.
912
4.2
133.
777
.579
.985
.4
Thai
land
2 30
42
624
2 70
44.
84.
84.
83.
73.
93.
970
441
79 6
3482
016
147.2
146.
614
4.4
111.
911
8.5
118.
9
78 WHO/ILO JOINT ESTIMATES OF THE WORK-RELATED BURDEN OF DISEASE AND INJURY, 2000-2016
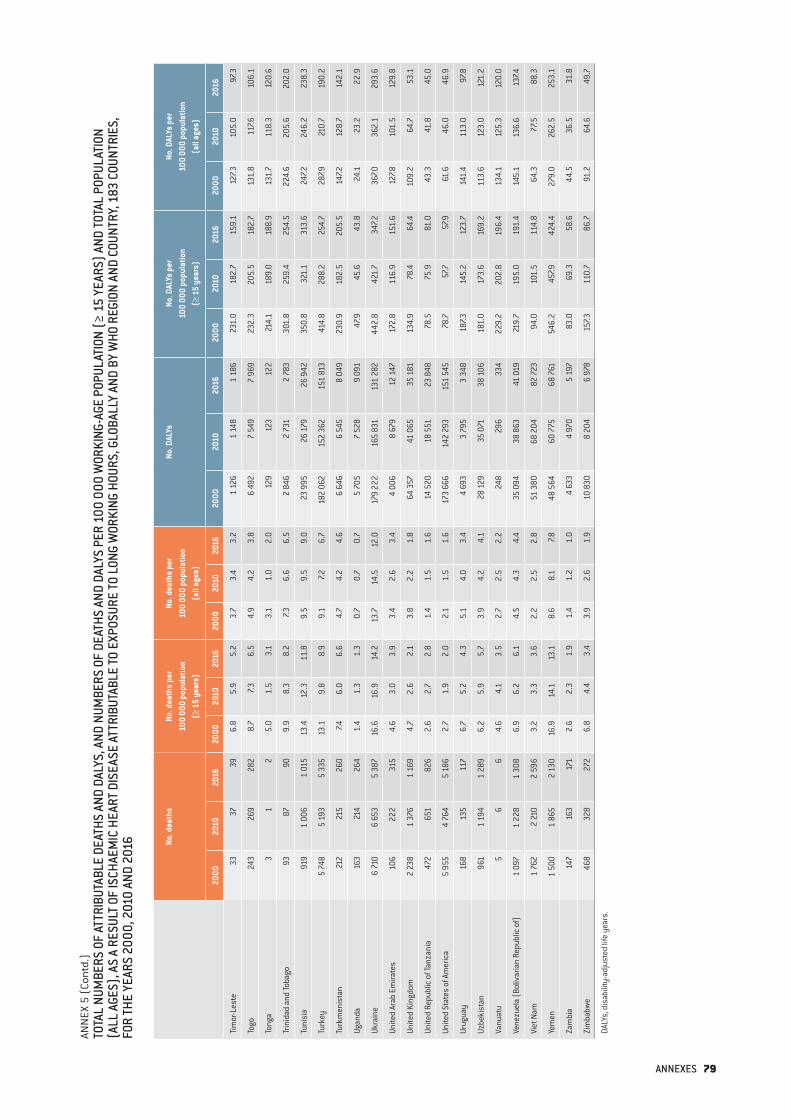
ANN
EX 5
(Co
ntd.
)TO
TAL
NUM
BERS
OF
ATTR
IBUT
ABLE
DEA
THS
AND
DALY
S, A
ND N
UMBE
RS O
F DE
ATHS
AND
DAL
YS P
ER 1
00 0
00 W
ORKI
NG-A
GE P
OPUL
ATIO
N (≥
15
YEAR
S) A
ND TO
TAL
POPU
LATI
ON
(ALL
AGE
S), A
S A
RESU
LT O
F IS
CHAE
MIC
HEA
RT D
ISEA
SE A
TTRI
BUTA
BLE
TO E
XPOS
URE
TO L
ONG
WOR
KING
HOU
RS, G
LOBA
LLY
AND
BY W
HO R
EGIO
N AN
D CO
UNTR
Y, 1
83 C
OUNT
RIES
, FO
R TH
E YE
ARS
2000
, 201
0 AN
D 20
16 No. d
eath
sNo
. dea
ths
per
100
000
popu
latio
n
(≥ 1
5 ye
ars)
No. d
eath
s pe
r 10
0 00
0 po
pula
tion
(a
ll ag
es)
No. D
ALYs
No. D
ALYs
per
10
0 00
0 po
pula
tion
(≥
15
year
s)
No. D
ALYs
per
10
0 00
0 po
pula
tion
(a
ll ag
es)
2000
2010
2016
2000
2010
2016
2000
2010
2016
2000
2010
2016
2000
2010
2016
2000
2010
2016
Tim
or-L
este
3337
396.
85.
95.
23.
73.
43.
21
126
1 14
81
186
231.
018
2.7
159.
112
7.310
5.0
97.3
Togo
243
269
282
8.7
7.36.
54.
94.
23.
86
492
7 54
97
969
232.
320
5.5
182.
713
1.8
117.6
106.
1
Tong
a3
12
5.0
1.5
3.1
3.1
1.0
2.0
129
123
122
214.
118
9.0
188.
913
1.7
118.
312
0.6
Trin
idad
and
Toba
go93
8790
9.9
8.3
8.2
7.36.
66.
52
846
2 73
12
783
301.
825
9.4
254.
522
4.6
205.
620
2.0
Tuni
sia
919
1 00
61
015
13.4
12.3
11.8
9.5
9.5
9.0
23 9
9526
179
26 9
4235
0.8
321.
131
3.6
247.2
246.
223
8.3
Turk
ey5
748
5 19
35
335
13.1
9.8
8.9
9.1
7.26.
718
2 06
215
2 36
215
1 81
341
4.8
288.
225
4.7
287.9
210.
719
0.2
Turk
men
ista
n21
221
526
07.4
6.0
6.6
4.7
4.2
4.6
6 6
466
545
8 04
923
0.9
182.
520
5.5
147.2
128.
714
2.1
Ugan
da16
321
426
41.
41.
31.
30.
70.
70.
75
705
7 52
89
091
47.9
45.6
43.8
24.1
23.2
22.9
Ukra
ine
6 71
06
653
5 38
716
.616
.914
.213
.714
.512
.017
9 22
216
5 83
113
1 28
244
2.8
421.
734
7.236
7.036
2.1
293.
6
Unite
d Ar
ab E
mira
tes
106
222
315
4.6
3.0
3.9
3.4
2.6
3.4
4 00
68
679
12 1
4717
2.8
116.
915
1.6
127.8
101.
512
9.8
Unite
d Ki
ngdo
m2
238
1 37
61
169
4.7
2.6
2.1
3.8
2.2
1.8
64 3
5741
065
35 1
8113
4.9
78.4
64.4
109.
264
.753
.1
Unite
d Re
publ
ic o
f Tan
zani
a47
265
182
62.
62.
72.
81.
41.
51.
614
520
18 5
5123
848
78.5
75.9
81.0
43.3
41.8
45.0
Unite
d St
ates
of A
mer
ica
5 95
54
764
5 18
62.
71.
92.
02.
11.
51.
617
3 66
614
2 29
315
1 54
578
.757
.757
.961
.646
.046
.9
Urug
uay
168
135
117
6.7
5.2
4.3
5.1
4.0
3.4
4 69
33
795
3 34
818
7.314
5.2
123.
714
1.4
113.
097
.8
Uzbe
kist
an96
11
194
1 28
96.
25.
95.
73.
94.
24.
128
129
35 0
7138
106
181.
017
3.6
169.
211
3.6
123.
012
1.2
Vanu
atu
56
64.
64.
13.
52.
72.
52.
224
829
633
422
9.2
202.
819
6.4
134.
112
5.3
120.
0
Vene
zuel
a (B
oliv
aria
n Re
publ
ic o
f)1
097
1 22
81
308
6.9
6.2
6.1
4.5
4.3
4.4
35 0
9438
863
41 0
1921
9.7
195.
019
1.4
145.
113
6.6
137.4
Viet
Nam
1 76
22
210
2 59
63.
23.
33.
62.
22.
52.
851
380
68 2
0482
723
94.0
101.
511
4.8
64.3
77.5
88.3
Yem
en1
500
1 86
52
130
16.9
14.1
13.1
8.6
8.1
7.848
564
60 7
7568
761
546.
245
7.942
4.4
279.
026
2.5
253.
1
Zam
bia
147
163
171
2.6
2.3
1.9
1.4
1.2
1.0
4 63
34
970
5 19
783
.069
.358
.644
.536
.531
.8
Zim
babw
e46
832
827
26.
84.
43.
43.
92.
61.
910
830
8 20
46
978
157.3
110.
786
.791
.264
.649
.7
DALY
s, d
isab
ility
-adj
uste
d lif
e ye
ars.
ANNEXES 79


For further information please contact:
Department of Environment, Climate Change and HealthWorld Health Organization20 avenue AppiaCH-1211 Geneva 27Switzerland
[email protected]://www.who.int/teams/environment-climate-change-and-health/monitoring/who-ilo-joint-estimates
Governance and Tripartism DepartmentInternational Labour Organization 4 route des MorillonsCH-1211 Geneva 22Switzerland
[email protected]://www.ilo.org/global/topics/safety-and-health-at-work/programmes-projects/WCMS_674797/lang--en/index.htm


