© 1999-2003 Luc Anselin, All Rights Reserved
GIS and Spatial Analysis
Luc AnselinSpatial Analysis Laboratory
Dept. Agricultural and Consumer EconomicsUniversity of Illinois, Urbana-Champaign
http://sal.agecon.uiuc.edu
© 1999-2003 Luc Anselin, All Rights Reserved
Outline
ÿGIS and Spatial AnalysisÿSpatial DataÿSpatial Data Analysis:
Some Examples

© 1999-2003 Luc Anselin, All Rights Reserved
GIS and Spatial Analysis
© 1999-2003 Luc Anselin, All Rights Reserved
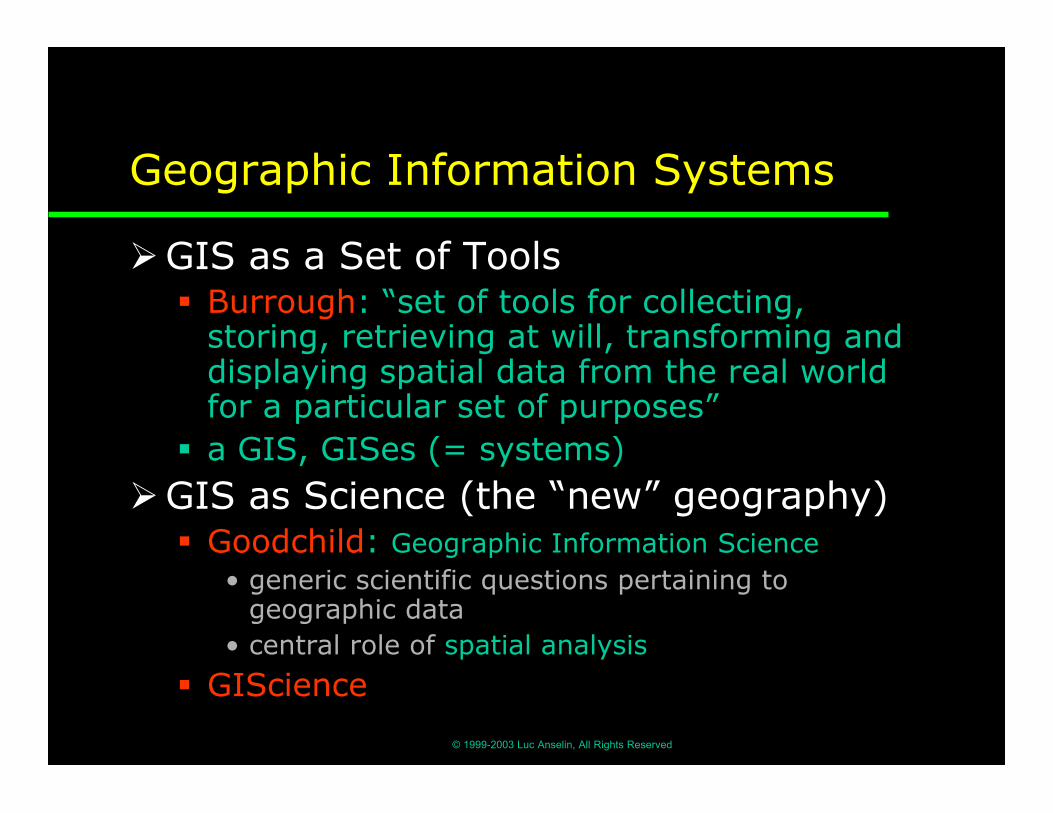
Geographic Information Systems
ÿGIS as a Set of Toolsß Burrough: “set of tools for collecting,
storing, retrieving at will, transforming anddisplaying spatial data from the real worldfor a particular set of purposesӧ a GIS, GISes (= systems)
ÿGIS as Science (the “new” geography)ß Goodchild: Geographic Information Science
• generic scientific questions pertaining togeographic data
• central role of spatial analysis
ß GIScience
© 1999-2003 Luc Anselin, All Rights Reserved
GIS Functions
ÿMany Different TaxonomiesÿAnselin-Getis 92 (and others)ß four broad sets of functionsß Inputß Storageß Analysisß Output
© 1999-2003 Luc Anselin, All Rights Reserved
What is Spatial Analysis
ÿFrom Data to Informationß beyond mapping: added valueß transformations, manipulations and
application of analytical methods to spatial(geographic) data
ÿ Lack of Locational Invarianceß analyses where the outcome changes when
the locations of the objects under studychanges• median center, clusters, spatial autocorrelation
ß where matters

spatial analysis avant la lettre Dr. Snow’smap of cholera deaths in London
© 1999-2003 Luc Anselin, All Rights Reserved
Categories of Spatial Analysis
ÿDifferent Taxonomiesß six categories (Longley et al 2001)
• queries and reasoning• measurements• transformations• descriptive summaries• optimization• hypothesis testing
ß others• analytical cartography (Tobler)• cartographic modeling (Tomlin)
© 1999-2003 Luc Anselin, All Rights Reserved
Components of Spatial Analysis
ÿExploratory Spatial Data Analysisß Finding interesting patterns
ÿVisualizationß Showing interesting patterns
ÿSpatial Modeling, Regressionß Explaining interesting patterns
© 1999-2003 Luc Anselin, All Rights Reserved
Implementation of Spatial Analysis
ÿBeyond GISÿAnalytical functionality not part of
typical commercial GISÿExploration requires interactive
approachÿSpatial modeling requires specialized
statistical methodsß Explicit treatment of spatial autocorrelationß Space-time is not space + time
© 1999-2003 Luc Anselin, All Rights Reserved
Spatial Data
© 1999-2003 Luc Anselin, All Rights Reserved
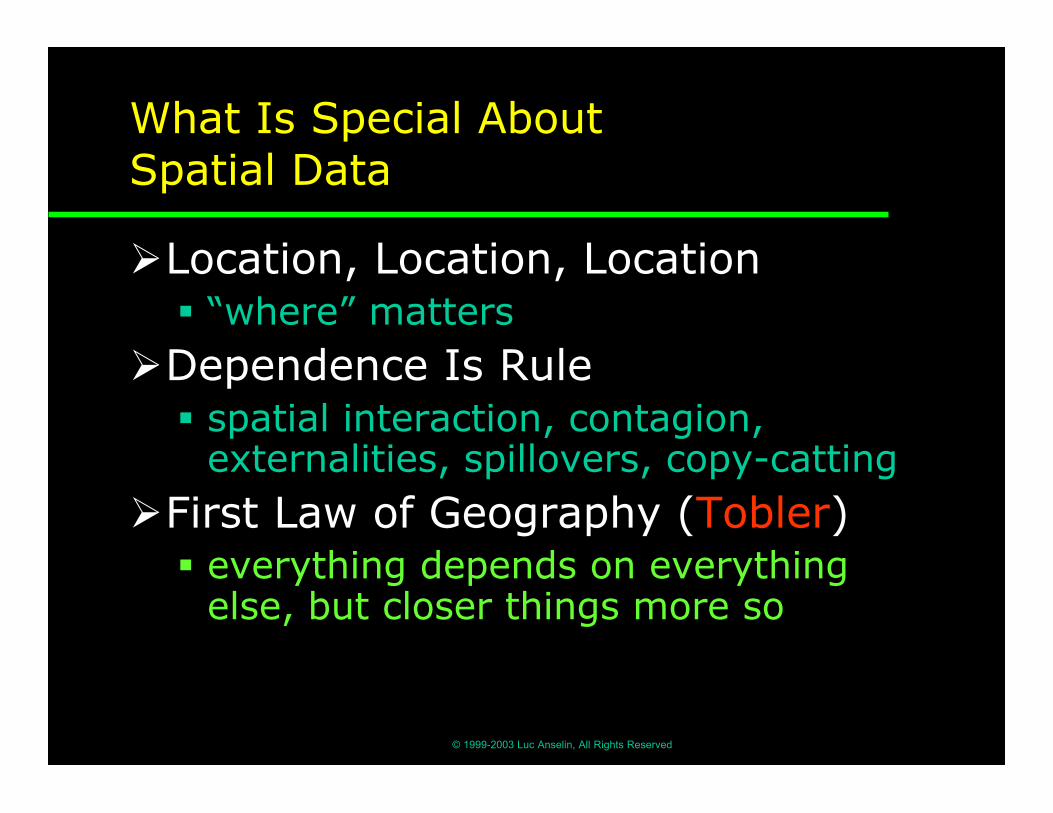
What Is Special AboutSpatial Data
ÿLocation, Location, Locationß “where” matters
ÿDependence Is Ruleß spatial interaction, contagion,
externalities, spillovers, copy-cattingÿFirst Law of Geography (Tobler)ß everything depends on everything
else, but closer things more so
© 1999-2003 Luc Anselin, All Rights Reserved
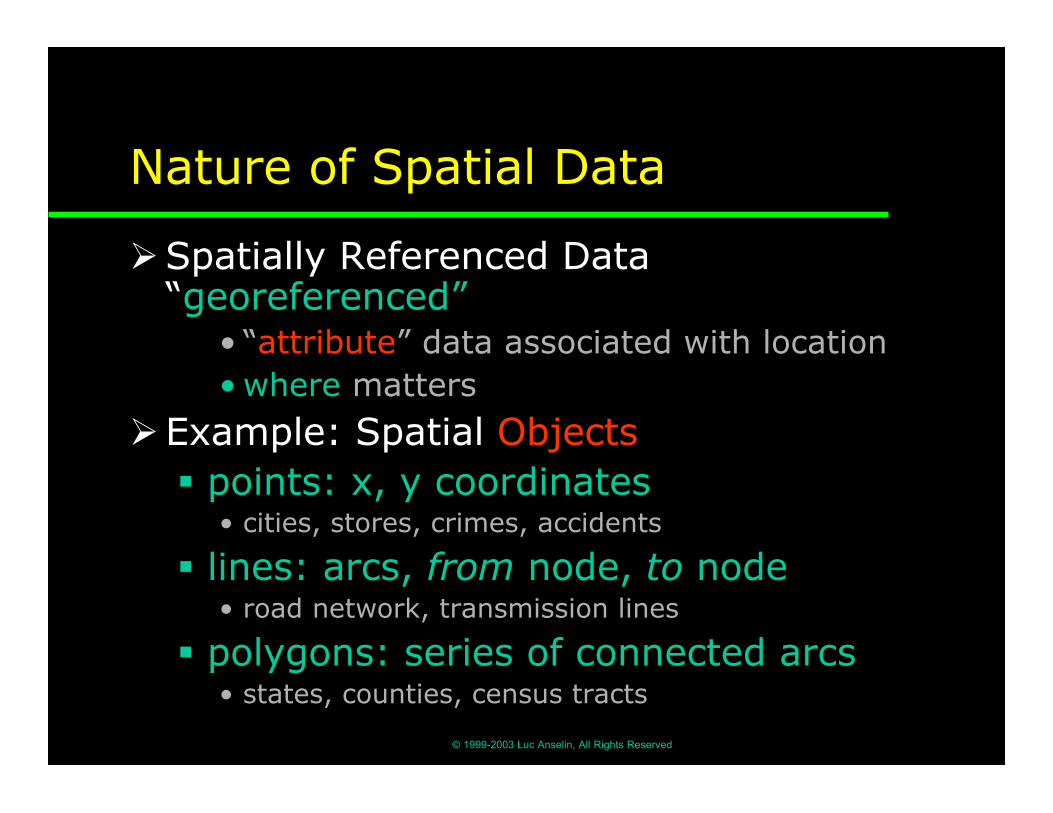
Nature of Spatial Data
ÿSpatially Referenced Data“georeferenced”
• “attribute” data associated with location• where matters
ÿExample: Spatial Objectsß points: x, y coordinates
• cities, stores, crimes, accidents
ß lines: arcs, from node, to node• road network, transmission lines
ß polygons: series of connected arcs• states, counties, census tracts
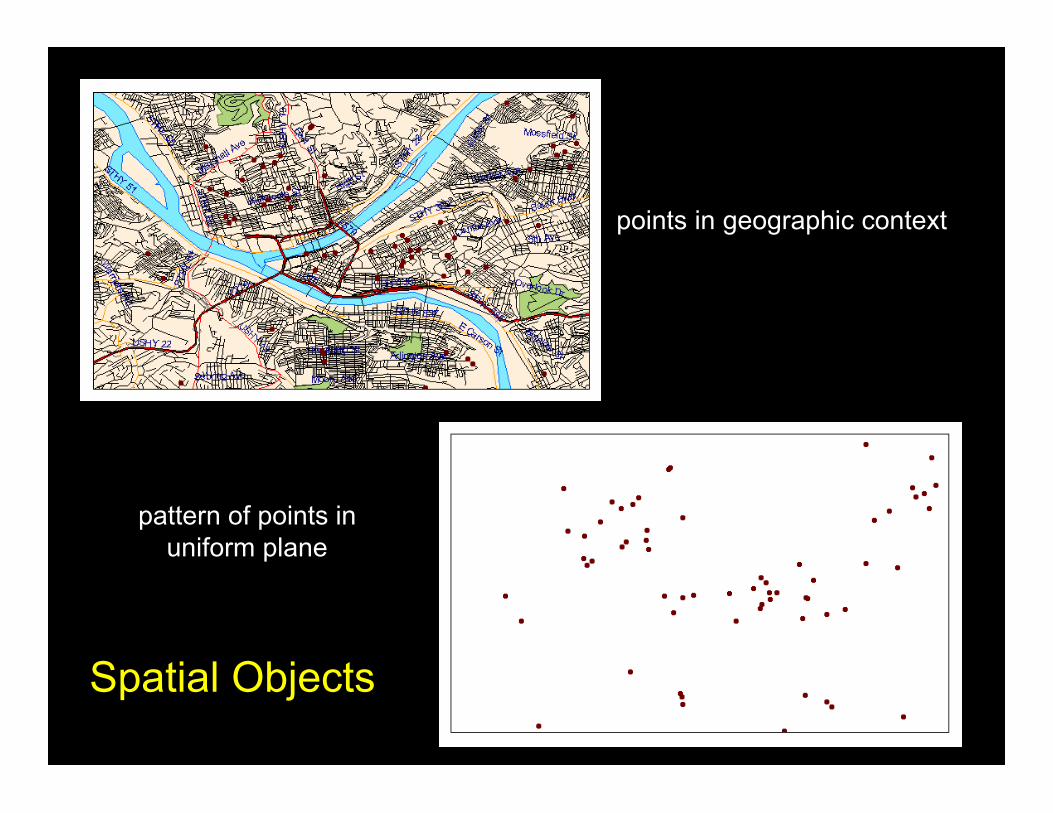
points in geographic context
pattern of points inuniform plane
Spatial Objects
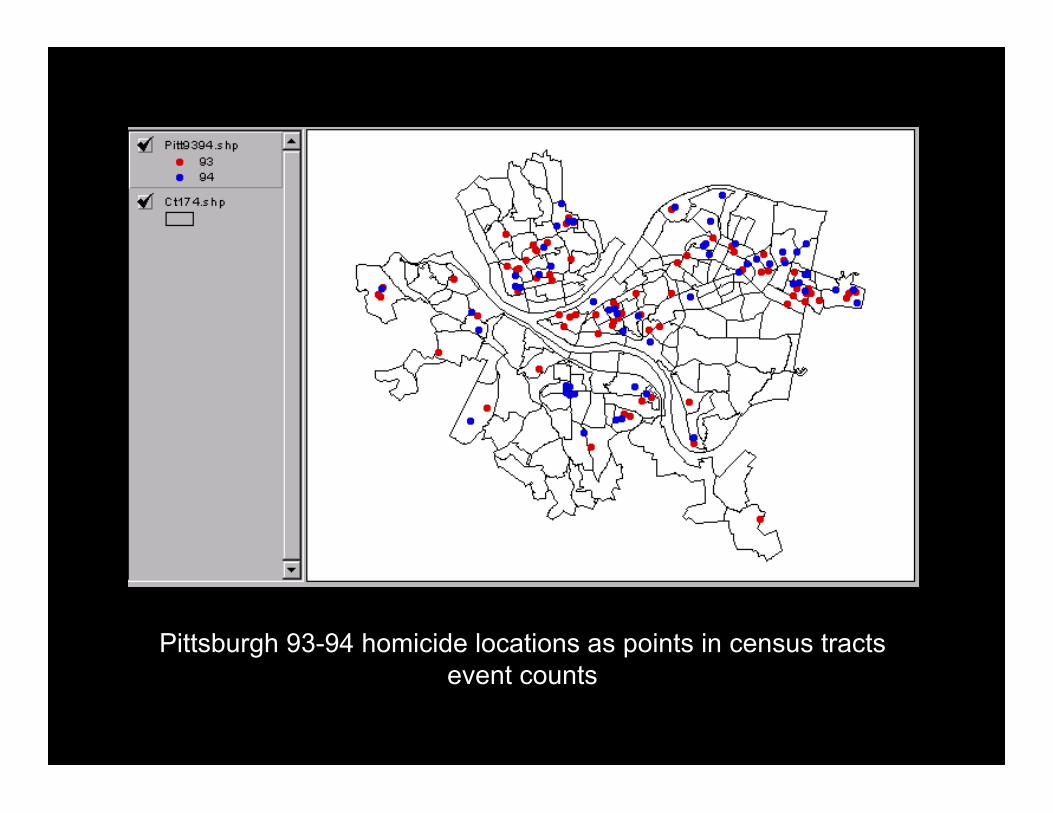
Pittsburgh 93-94 homicide locations as points in census tractsevent counts
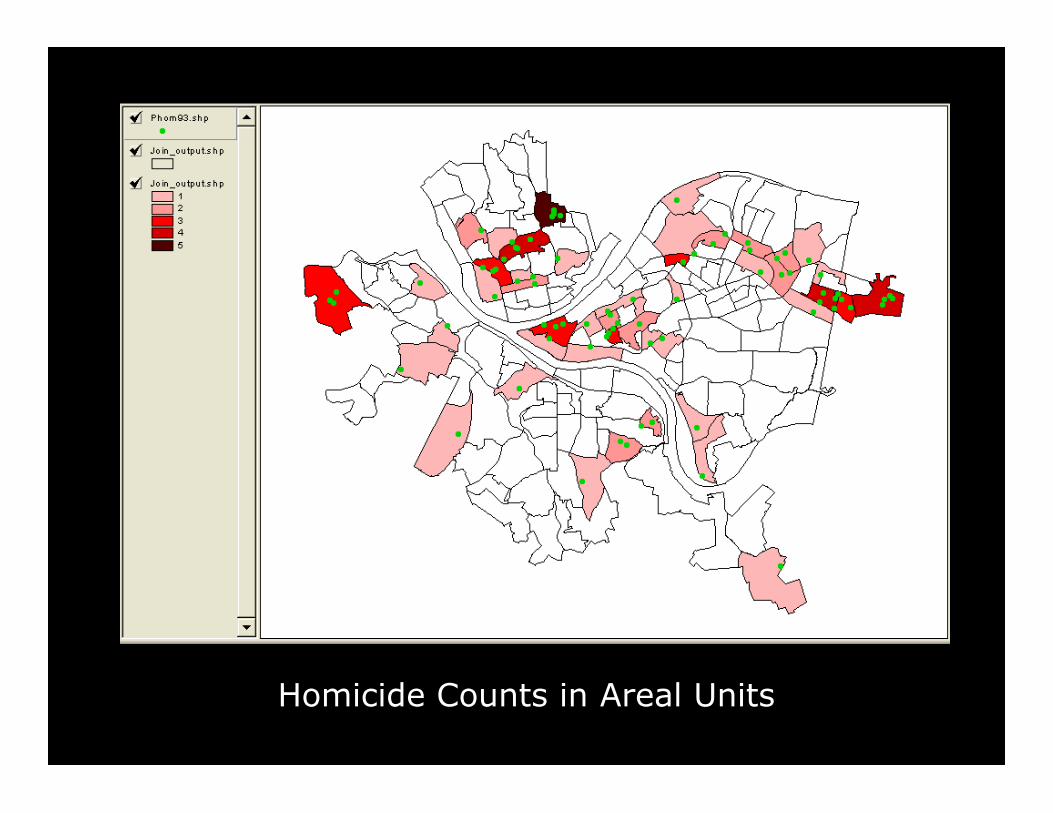
Homicide Counts in Areal Units
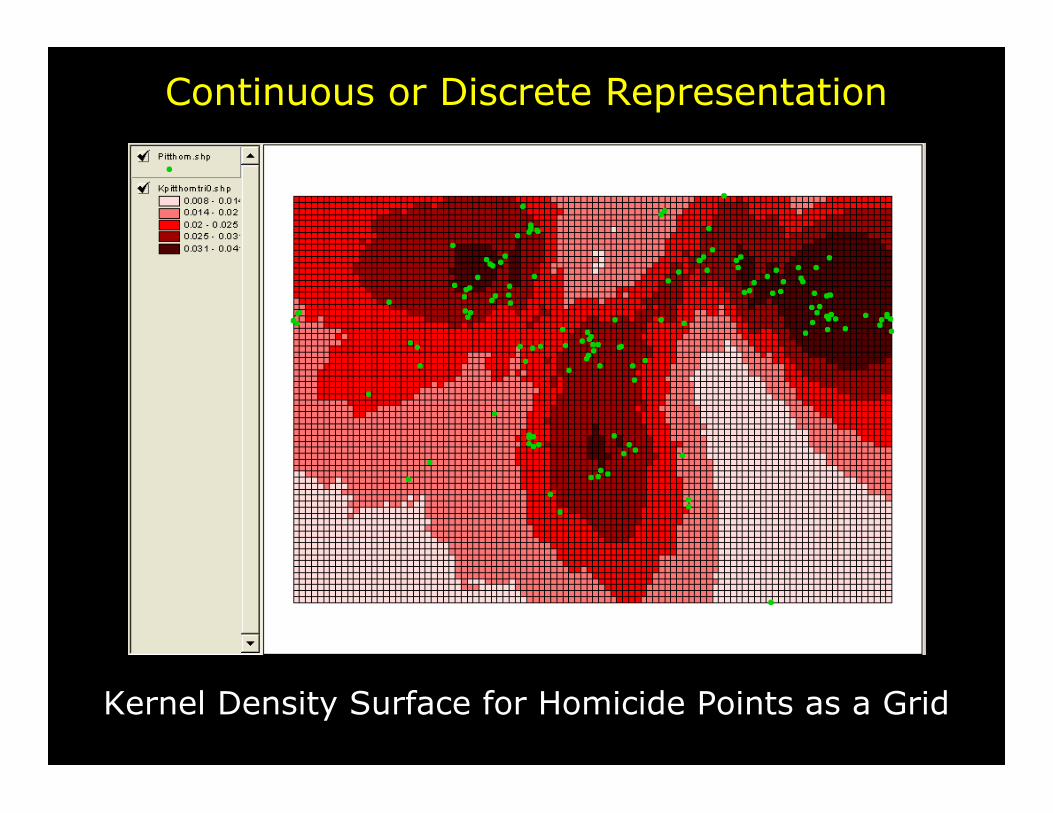
Kernel Density Surface for Homicide Points as a Grid
Continuous or Discrete Representation
© 1999-2003 Luc Anselin, All Rights Reserved
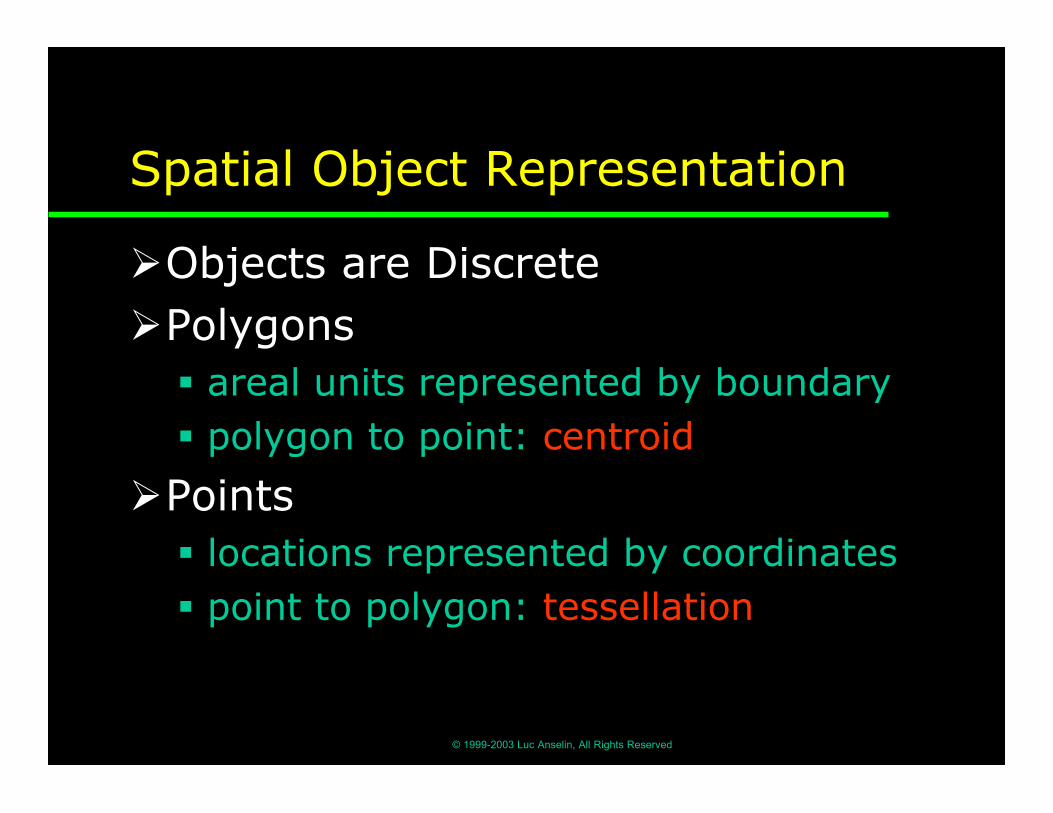
Spatial Object Representation
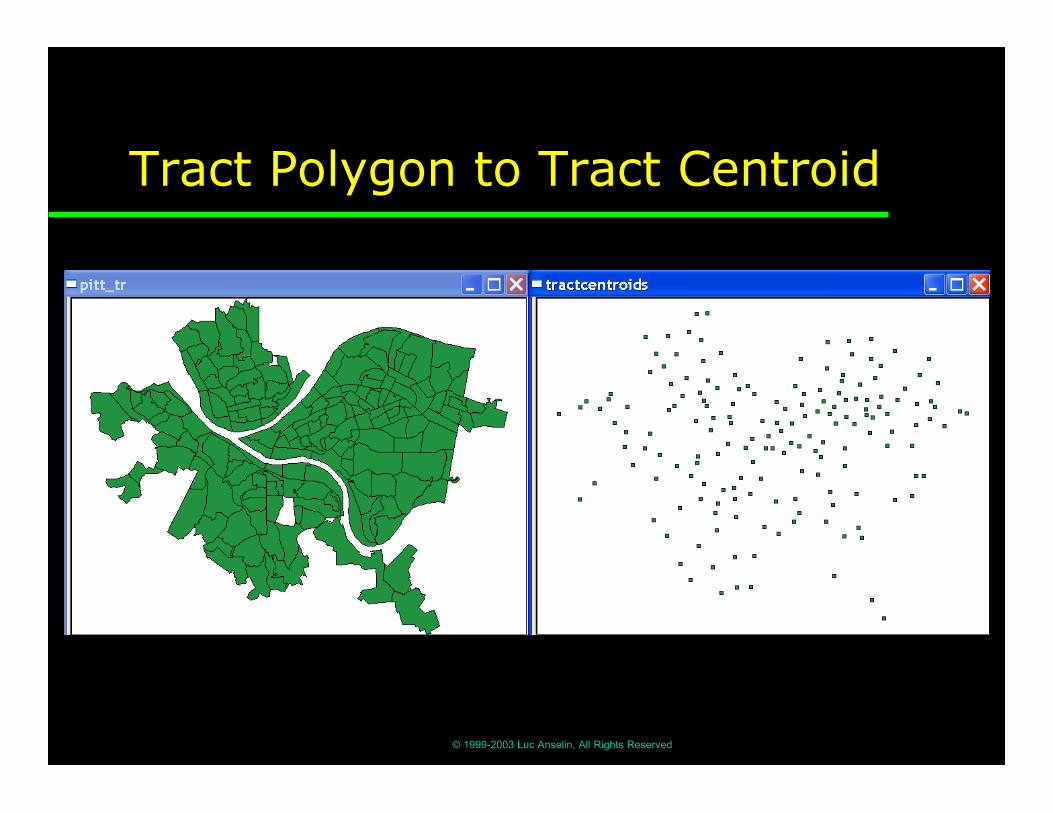
ÿObjects are DiscreteÿPolygonsß areal units represented by boundaryß polygon to point: centroid
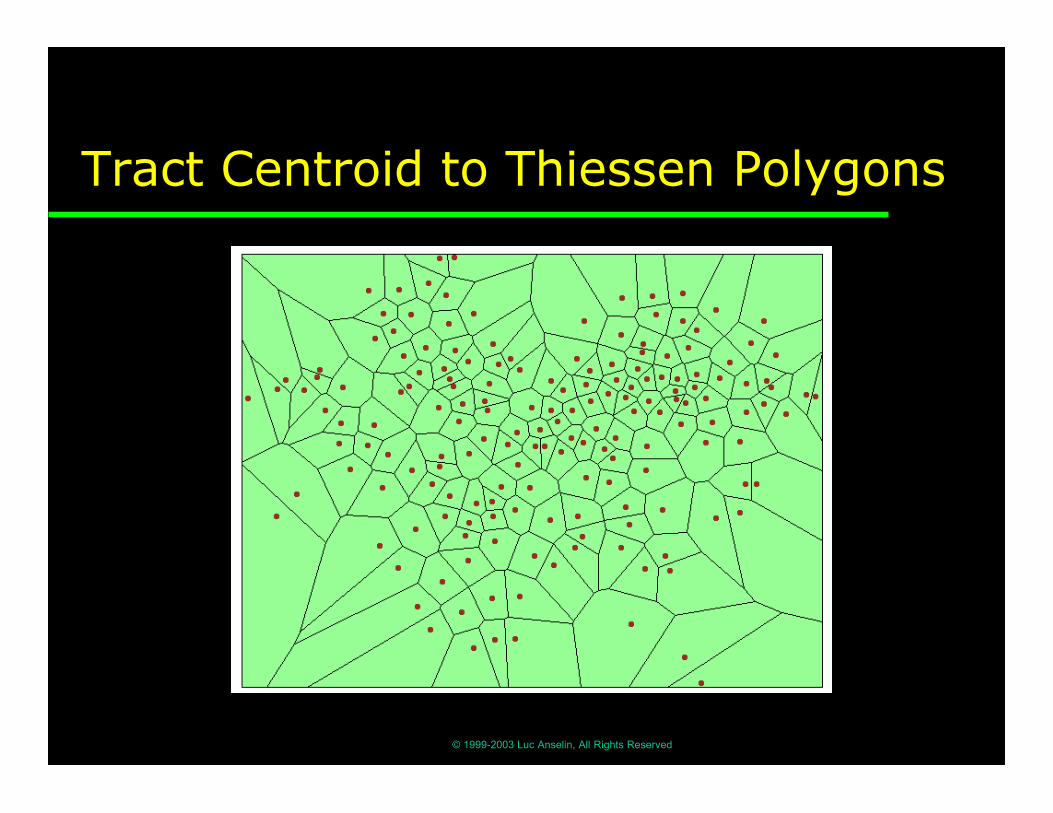
ÿPointsß locations represented by coordinatesß point to polygon: tessellation
© 1999-2003 Luc Anselin, All Rights Reserved
Tract Polygon to Tract Centroid
© 1999-2003 Luc Anselin, All Rights Reserved
Tract Centroid to Thiessen Polygons
© 1999-2003 Luc Anselin, All Rights Reserved
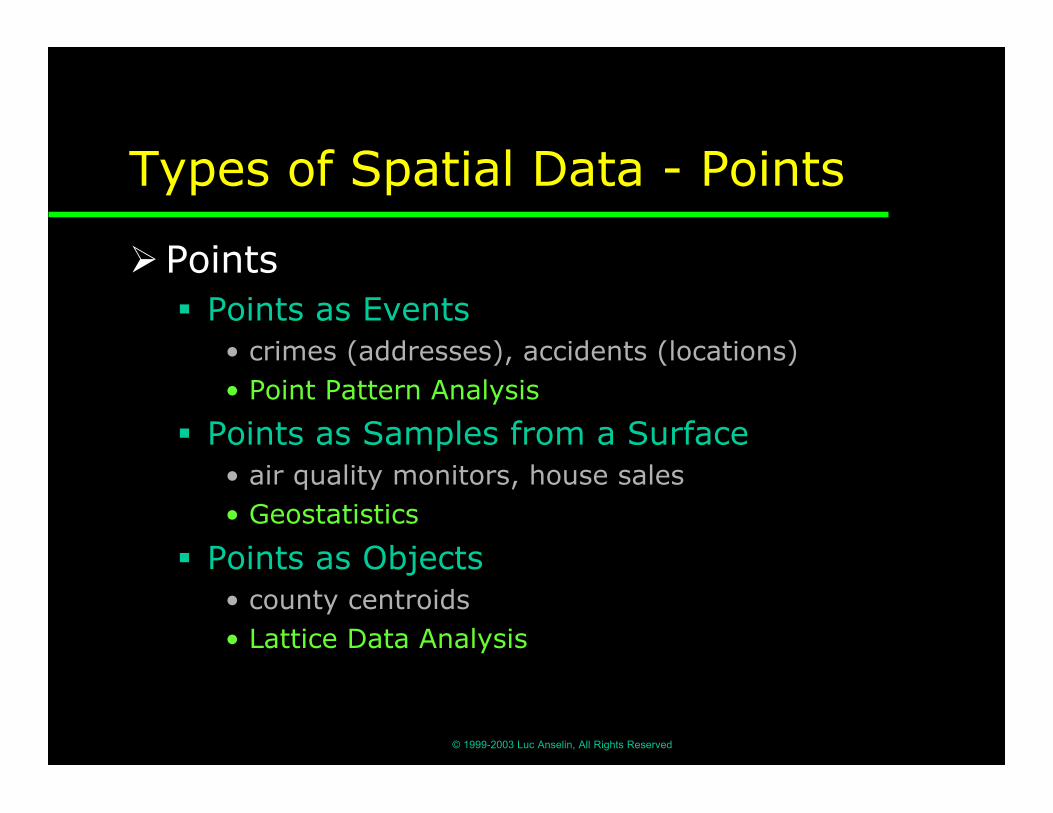
Types of Spatial Data - Points
ÿPointsß Points as Events
• crimes (addresses), accidents (locations)• Point Pattern Analysis
ß Points as Samples from a Surface• air quality monitors, house sales• Geostatistics
ß Points as Objects• county centroids• Lattice Data Analysis
© 1999-2003 Luc Anselin, All Rights Reserved
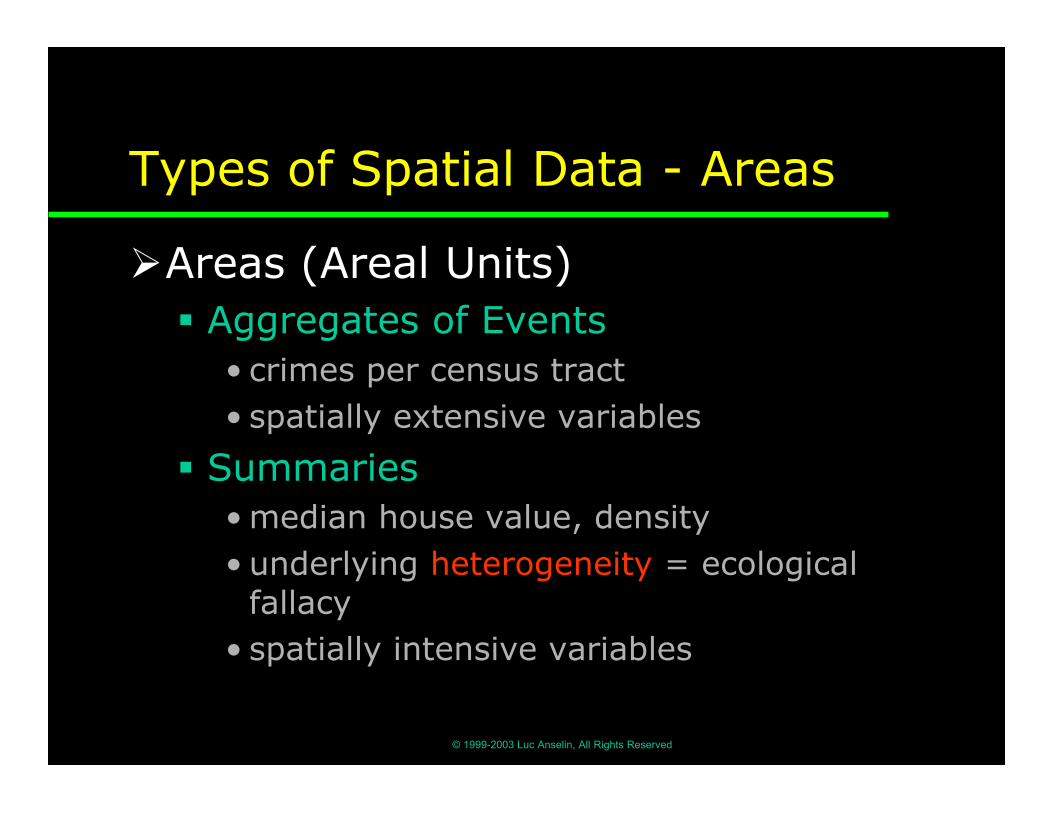
Types of Spatial Data - Areas
ÿAreas (Areal Units)ß Aggregates of Events
• crimes per census tract• spatially extensive variables
ß Summaries• median house value, density• underlying heterogeneity = ecological
fallacy• spatially intensive variables
© 1999-2003 Luc Anselin, All Rights Reserved
Spatial Data AnalysisSome Examples
© 1999-2003 Luc Anselin, All Rights Reserved
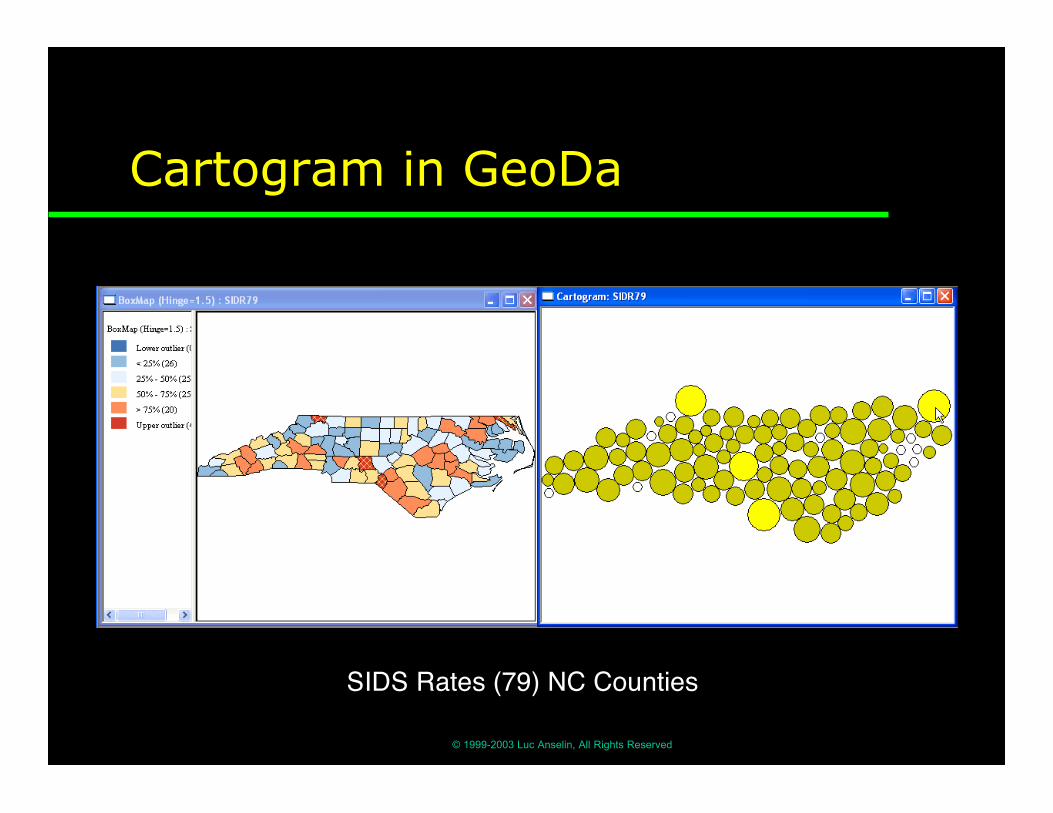
Cartogram in GeoDa
SIDS Rates (79) NC Counties
© 1999-2003 Luc Anselin, All Rights Reserved
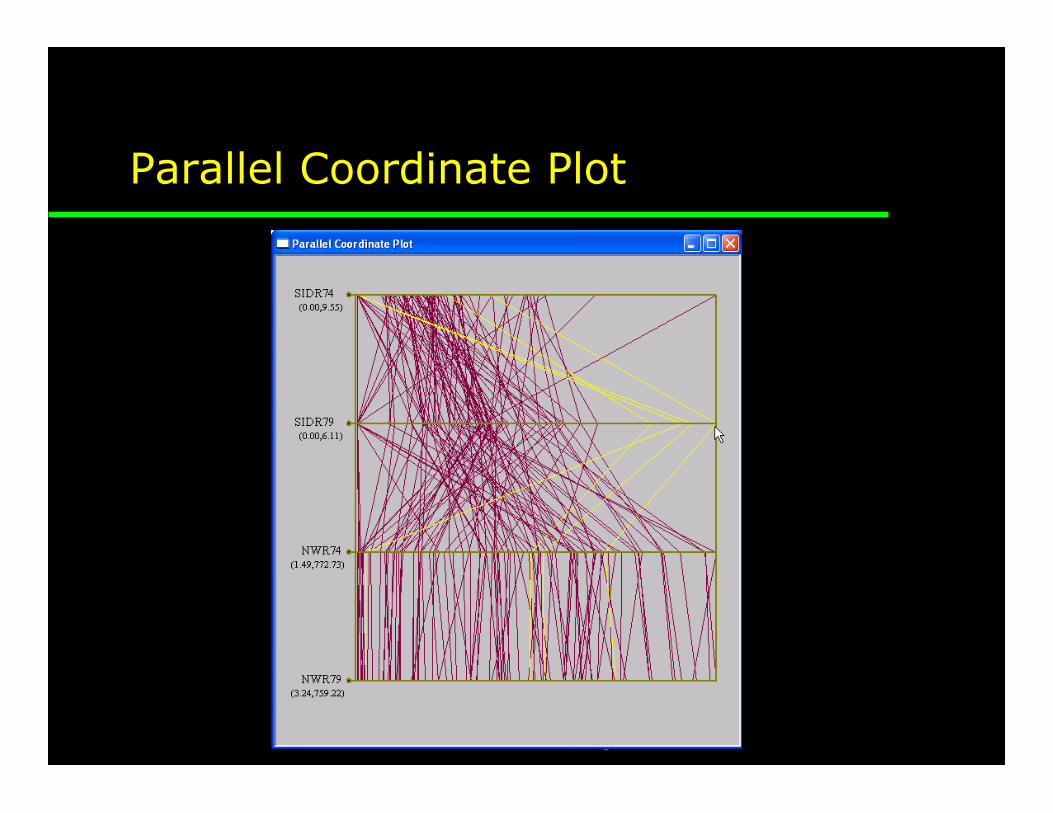
Parallel Coordinate Plot
© 1999-2003 Luc Anselin, All Rights Reserved
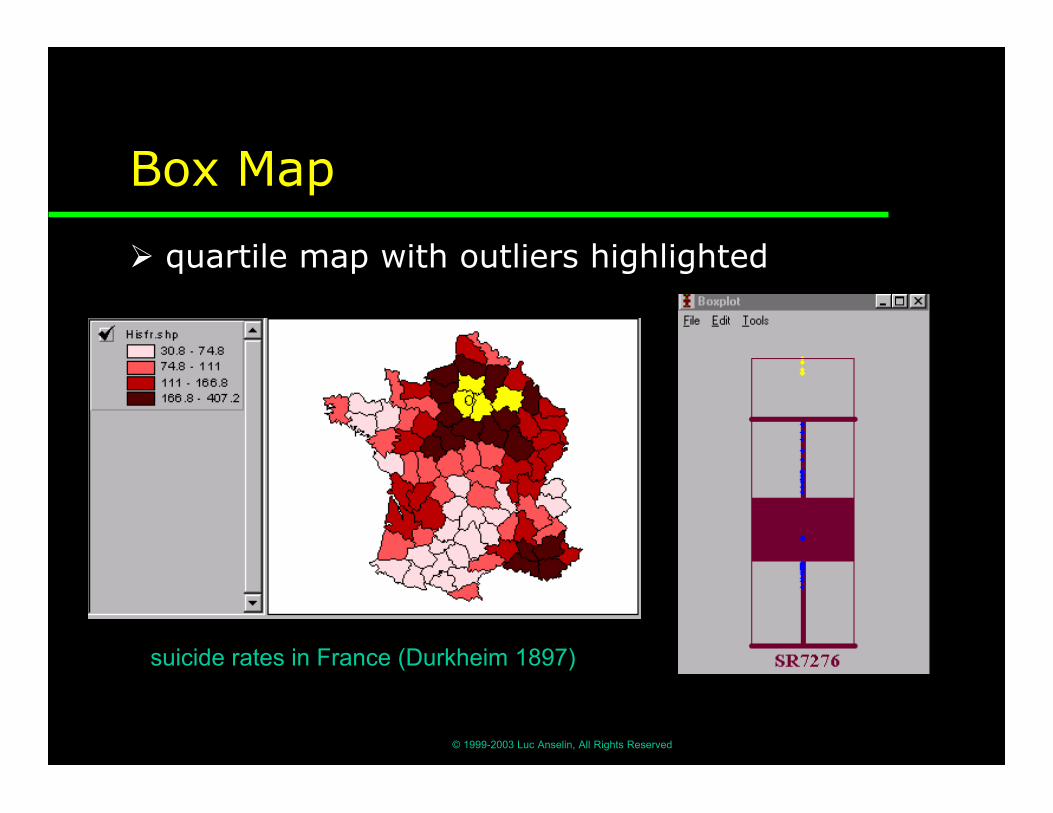
Box Map
ÿ quartile map with outliers highlighted
suicide rates in France (Durkheim 1897)
© 1999-2003 Luc Anselin, All Rights Reserved
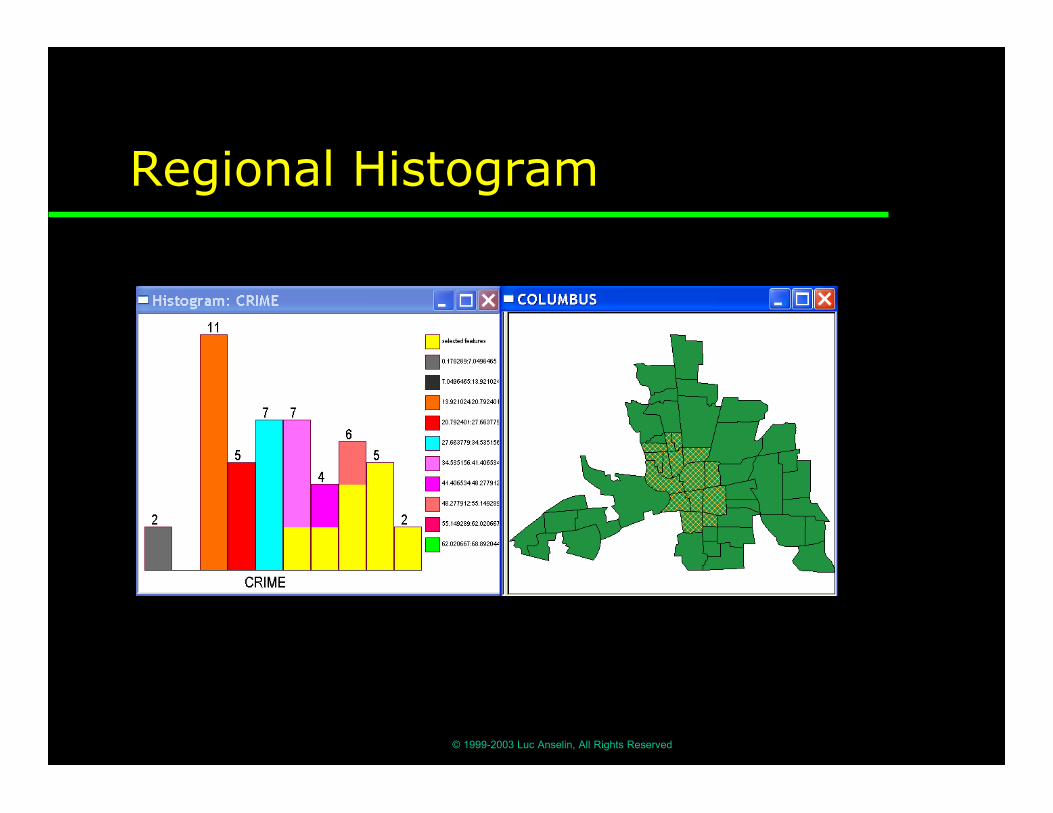
Regional Histogram
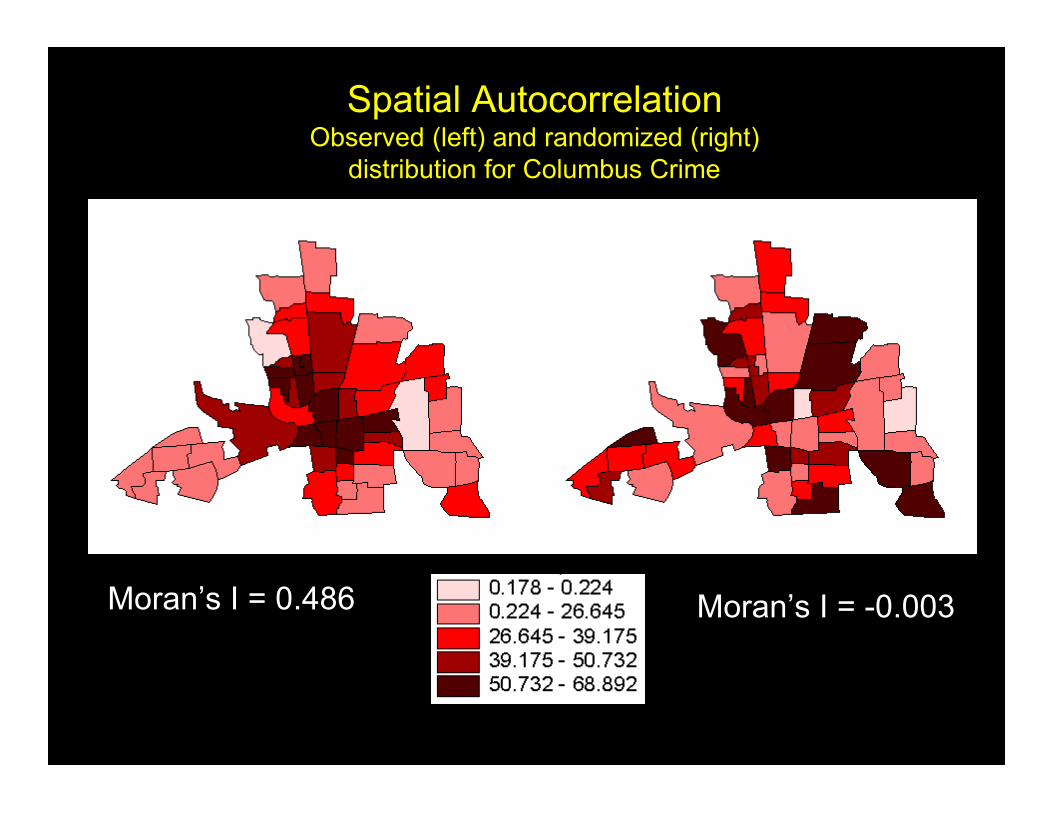
Spatial AutocorrelationObserved (left) and randomized (right)
distribution for Columbus Crime
Moran’s I = 0.486 Moran’s I = -0.003
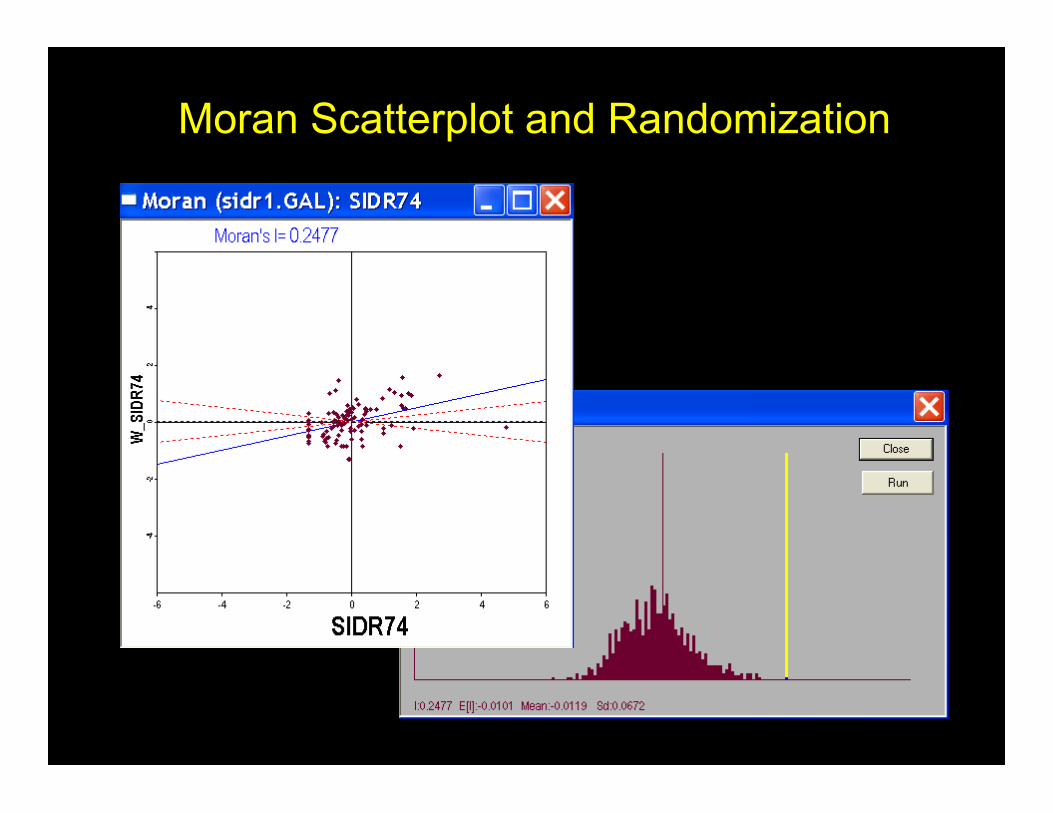
Moran Scatterplot and Randomization
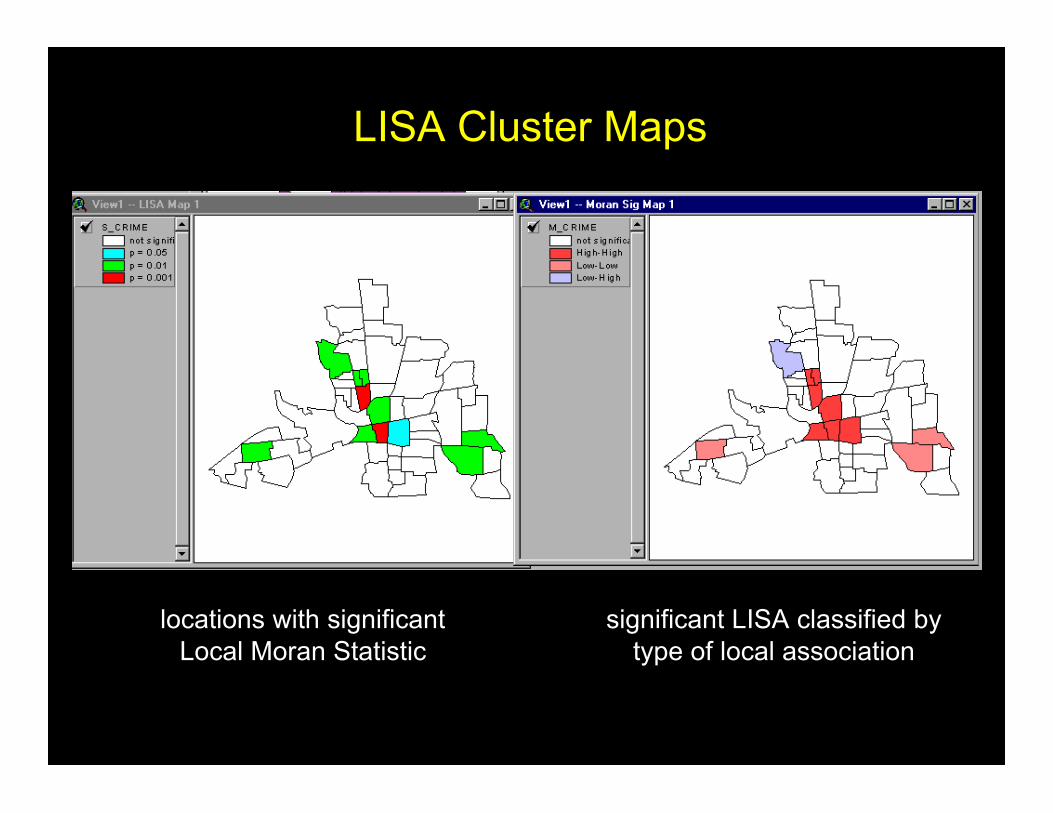
locations with significantLocal Moran Statistic
significant LISA classified bytype of local association
LISA Cluster Maps
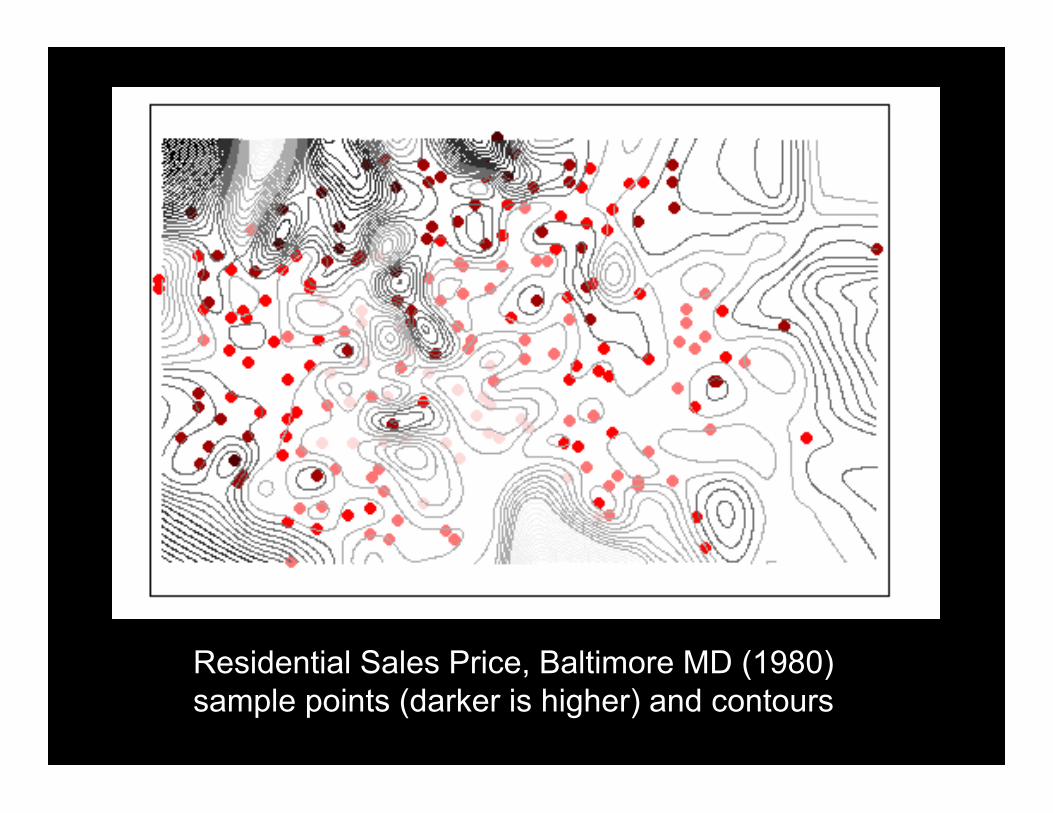
Residential Sales Price, Baltimore MD (1980)sample points (darker is higher) and contours

Baltimore House Sales PricesSpatial Trend Analysis
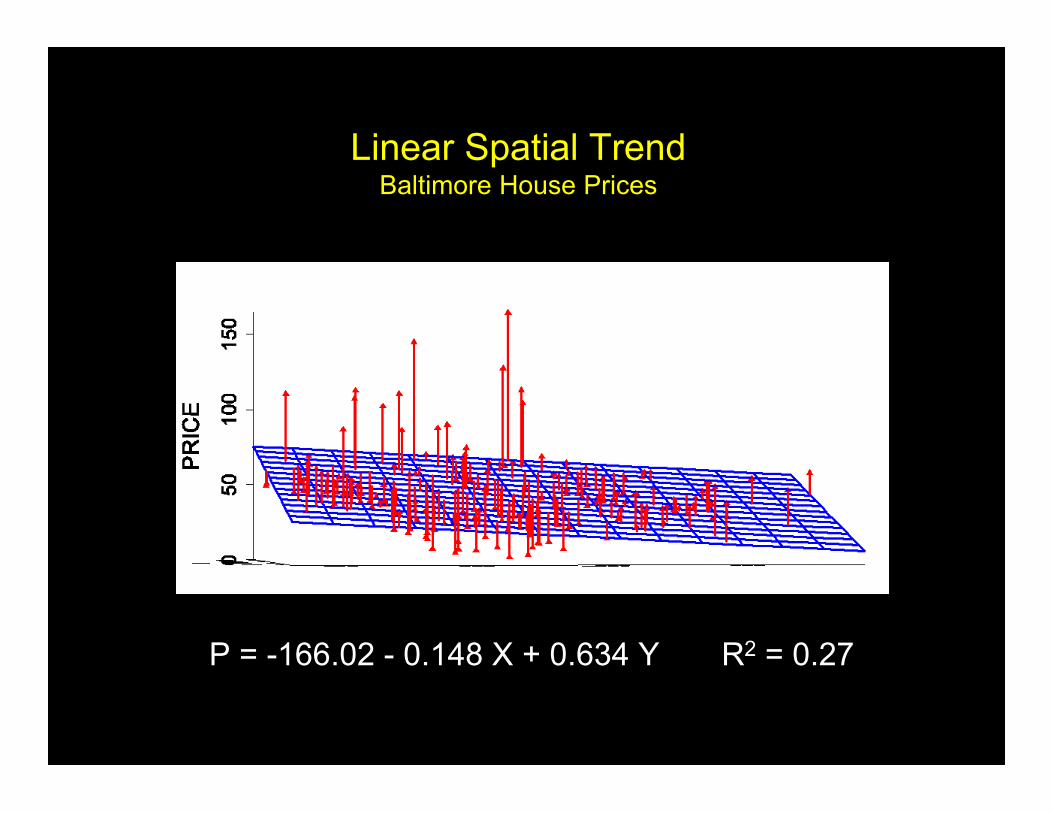
Linear Spatial TrendBaltimore House Prices
P = -166.02 - 0.148 X + 0.634 Y R2 = 0.27
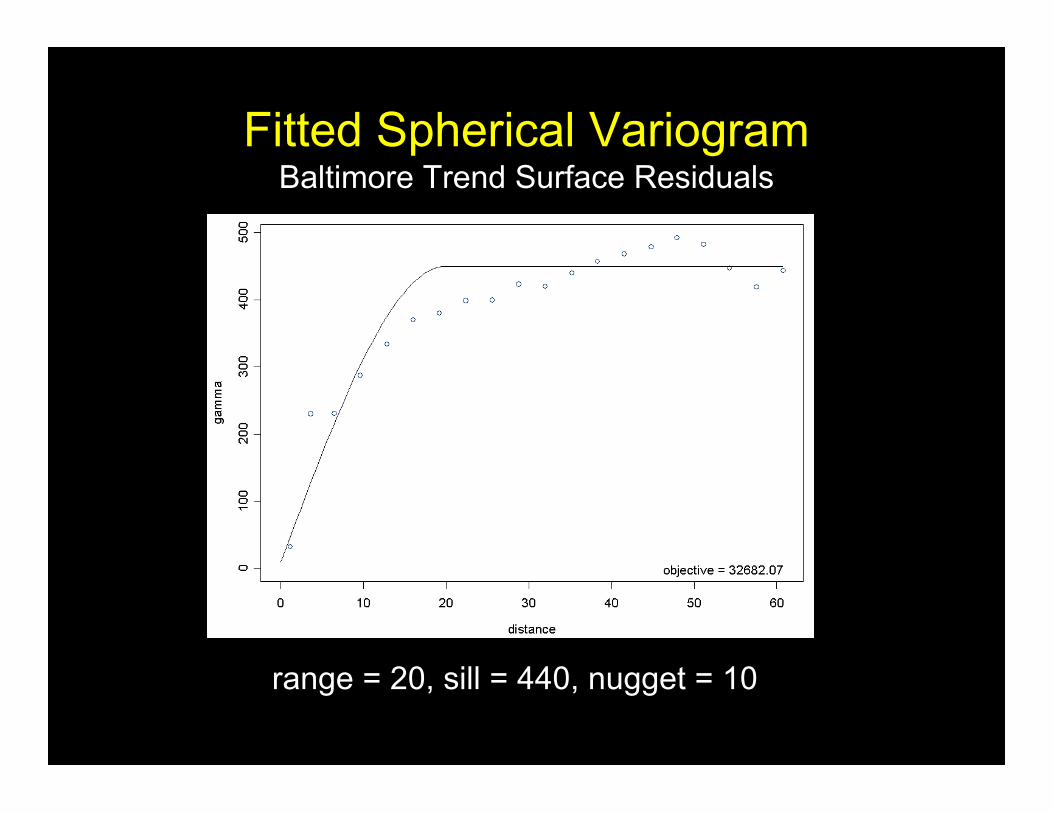
Fitted Spherical VariogramBaltimore Trend Surface Residuals
range = 20, sill = 440, nugget = 10
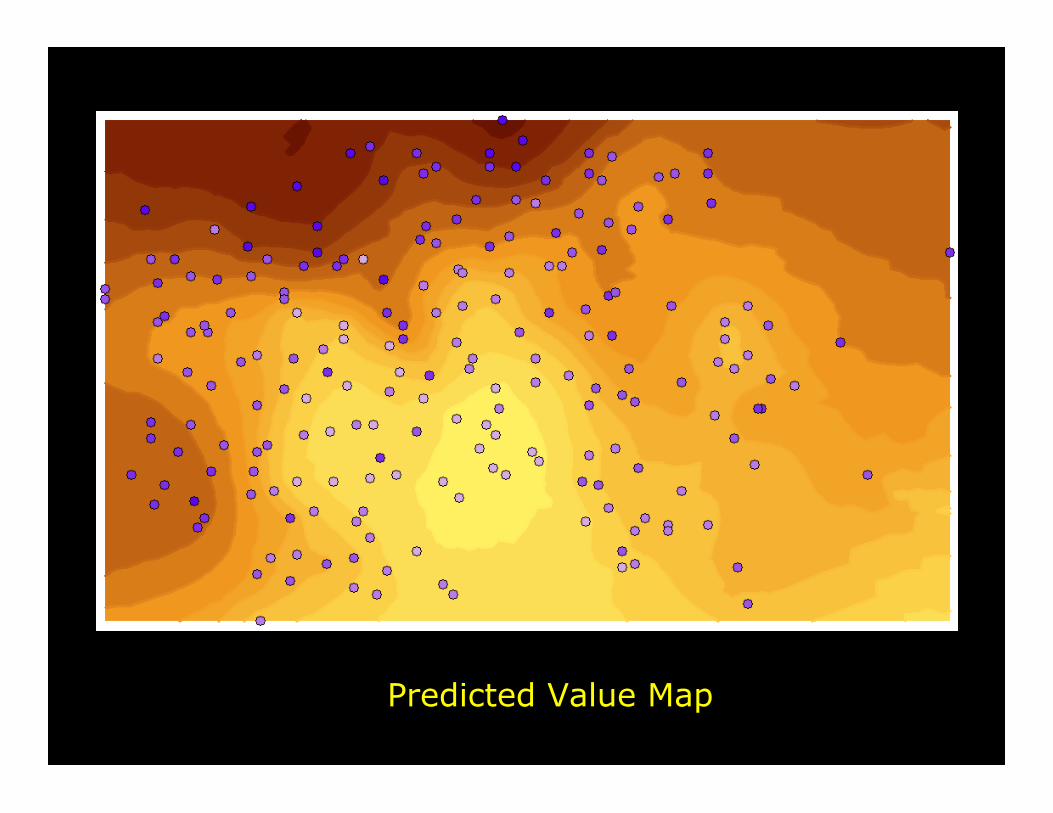
Predicted Value Map
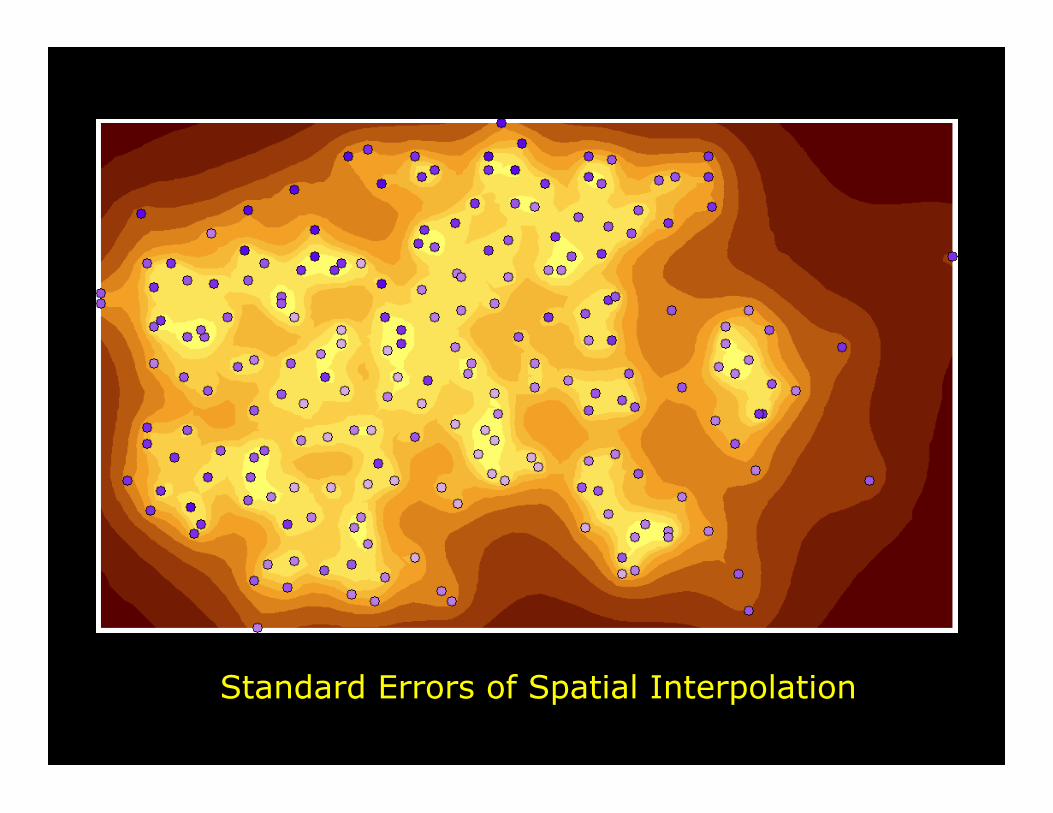
Standard Errors of Spatial Interpolation