
Getting Started with R
140.776 Statistical Computing
August 21, 2011
140.776 Statistical Computing Getting Started with R

Reading
An Introduction to R (Venables and Smith), Chapter2-6, from http://www.r-project.org
140.776 Statistical Computing Getting Started with R

Getting Started with R
Open your R, type:
> 1+1
140.776 Statistical Computing Getting Started with R

Getting Started with R
> x <- read.table("Speed_Ex.txt",sep="\t",header=TRUE)> x
140.776 Statistical Computing Getting Started with R

Getting Started with R
STATE INCREASe FATALITIESCHANGE1 Alaska No -29.02 Connecticut No -4.43 Dist. of Columbia No -80.04 Hawaii No -25.05 Indiana No -13.26 Kentucky No 3.47 Louisiana No -5.4
140.776 Statistical Computing Getting Started with R
Set working directory
> getwd()
140.776 Statistical Computing Getting Started with R

Set working directory
> setwd("C:/Users/jihk/doc/courses/Computing2010/lecture2")
> getwd()[1] "C:/Users/jihk/doc/courses/Computing2010/lecture2"
> list.files()
> x <- read.table("Speed_Ex.txt",sep="\t",header=TRUE)
140.776 Statistical Computing Getting Started with R

Speed limits and fatalities
STATE INCREASe FATALITIESCHANGE1 Alaska No -29.02 Connecticut No -4.43 Dist. of Columbia No -80.04 Hawaii No -25.05 Indiana No -13.26 Kentucky No 3.47 Louisiana No -5.4
140.776 Statistical Computing Getting Started with R

Speed limits and fatalities
The National Highway System Designation Act was signedinto law in 1995.
It abolished the federal mandate of 55 mph speed limits.
The data show percentage changes in interstate highwaytraffic fatalities from 1995 to 1996.
140.776 Statistical Computing Getting Started with R

Speed limits and fatalities
> hist(x[,3])
140.776 Statistical Computing Getting Started with R

Speed limits and fatalities
Histogram of x[, 3]
x[, 3]
Fre
quen
cy
−50 0 50
05
1015
140.776 Statistical Computing Getting Started with R

Speed limits and fatalities
During 1996, 32/51 states increased speed limits.
> boxplot(x[,3]~x[,2])
140.776 Statistical Computing Getting Started with R

Speed limits and fatalities
●
No Yes
−80
−40
020
4060
140.776 Statistical Computing Getting Started with R

Speed limits and fatalities
> t.test(x[,3]~x[,2])
Welch Two Sample t-test
data: x[, 3] by x[, 2]t = -2.7722, df = 28.248, p-value = 0.009747alternative hypothesis: true difference inmeans is not equal to 095 percent confidence interval:-38.799538 -5.833028
sample estimates:mean in group No mean in group Yes
-8.563158 13.753125
140.776 Statistical Computing Getting Started with R

Speed limits and fatalities
> class(x)[1] "data.frame"
> class(x[,1])[1] "factor"
> class(x[,2])[1] "factor"
> class(x[,3])[1] "numeric"
140.776 Statistical Computing Getting Started with R

Objects
R operates on objects:
vectors
matrices
factors
lists
data frames
functions
140.776 Statistical Computing Getting Started with R

Vectors
The simplest objects are vectors which can have one of thefollowing modes:
numeric (double, integer)
complex
logical (TRUE/FALSE)
character
raw (hold raw bytes)
140.776 Statistical Computing Getting Started with R

Speed limits and fatalities
> is.vector(x[,3])
140.776 Statistical Computing Getting Started with R

Create a numeric vector
> x <- c(1.1, 2.2, 3.3, 4.4, 5.5)> x[1] 1.1 2.2 3.3 4.4 5.5
The first line is an assignment using the function c().
In this example, c() takes five arguments and concatenates theminto a vector.
The second line is an expression.
140.776 Statistical Computing Getting Started with R

Create a numeric vector
You can do the same thing using the following commands:
> y = c(1.1, 2.2, 3.3, 4.4, 5.5)> y[1] 1.1 2.2 3.3 4.4 5.5
> assign("z", c(1.1, 2.2, 3.3, 4.4, 5.5))> z[1] 1.1 2.2 3.3 4.4 5.5
> c(1.1, 2.2, 3.3, 4.4, 5.5)->u> u[1] 1.1 2.2 3.3 4.4 5.5
140.776 Statistical Computing Getting Started with R

Create a numeric vector
You can also concatenate two vectors:
> w<-c(x,0,y)> w[1] 1.1 2.2 3.3 4.4 5.5 0.0 1.1 2.2 3.3 4.4 5.5
140.776 Statistical Computing Getting Started with R

Check objects in the current workspace
> ls()
140.776 Statistical Computing Getting Started with R

Remove objects
> rm(x)> ls()
> rm(list=ls())
140.776 Statistical Computing Getting Started with R
Vector arithmetic
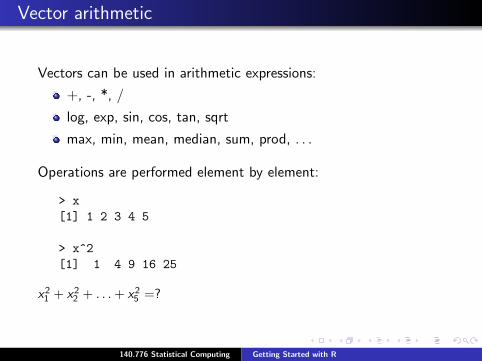
Vectors can be used in arithmetic expressions:
+, -, *, /
log, exp, sin, cos, tan, sqrt
max, min, mean, median, sum, prod, . . .
Operations are performed element by element:
> x[1] 1 2 3 4 5
> x^2[1] 1 4 9 16 25
x21 + x2
2 + . . . + x25 =?
140.776 Statistical Computing Getting Started with R

Vector arithmetic
> sum(x^2)[1] 55
140.776 Statistical Computing Getting Started with R

Maximum and minimum
max and min select the largest and smallest values in theirarguments, even if they are given several vectors.
Examples:
> x[1] 1 2 3 4 5> y[1] 5 4 3 2 1
> max(x,y)[1] 5
140.776 Statistical Computing Getting Started with R

Maximum and minimum
pmax and pmin return element-wise maximum and minimum.
Examples:
> pmax(x,y)[1] 5 4 3 4 5
140.776 Statistical Computing Getting Started with R

Sorting
Elements in a vector can be sorted:
> x<-c(3,8,4,2,9,10)> x[1] 3 8 4 2 9 10
> sort(x)[1] 2 3 4 8 9 10
> y<-sort.int(x,index.return=TRUE)> y$x[1] 2 3 4 8 9 10$ix[1] 4 1 3 2 5 6
140.776 Statistical Computing Getting Started with R

Exercise
> x<-read.table("sortdata.txt",header=FALSE)
> dim(x)[1] 1000 2
> y<-x[,1]
> y[1][1] 0.87765
y(3) + y(176) + y(872) =?
140.776 Statistical Computing Getting Started with R

Exercise
> z<-sort(y)
> z[3]+z[176]+z[872][1] -3.079099
> (z[500]+z[501])/2[1] 0.02903422
> median(y)[1] 0.02903422
140.776 Statistical Computing Getting Started with R

Generating regular sequences
1:5 does the same thing as c(1,2,3,4,5)
Example:
> n<-5
> 1:n-1
> 1:(n-1)
140.776 Statistical Computing Getting Started with R

Generating regular sequences
The colon operator has high priority within an expression
You can generate a decreasing sequence
> 2*1:n[1] 2 4 6 8 10
> n:1[1] 5 4 3 2 1
140.776 Statistical Computing Getting Started with R

Generating regular sequences
The function seq() provides a more general approach:
> seq(from=-1,to=2,by=0.5)[1] -1.0 -0.5 0.0 0.5 1.0 1.5 2.0
> seq(from=-1,by=0.5,length=7)[1] -1.0 -0.5 0.0 0.5 1.0 1.5 2.0
> x<-rnorm(4)> x[1] -2.3247806 -1.5598637 -0.3470389 -0.1820149> seq(along.with=x)[1] 1 2 3 4
140.776 Statistical Computing Getting Started with R

Generating regular sequences
Another useful function is rep():
> x<-c(1,2,3)> x[1] 1 2 3
> rep(x,times=2)
> rep(x,each=2)
140.776 Statistical Computing Getting Started with R

Numbers
Numbers in R a generally treated as numeric objects withdouble precision
To explicitly specify an integer, you can use the L suffix
Example:
> x<-1> is.integer(x)[1] FALSE
> x<-1L> is.integer(x)[1] TRUE
140.776 Statistical Computing Getting Started with R
Numbers
To work with complex numbers, supply an explicit complexpart:
> sqrt(-9+0i)[1] 0+3i
140.776 Statistical Computing Getting Started with R

Exercise
> x<-read.table("sortdata.txt",header=FALSE)
> sum(log(x[,2]-x[,1]))
140.776 Statistical Computing Getting Started with R

Numbers
NaN represents an undefined value (“not a number”) (e.g.0/0 gives you NaN), it can also be thought of as a missingvalue
There is a special number Inf which means infinity (e.g. 1/0= Inf; Inf can be used in calculation, 1/Inf = 0)
140.776 Statistical Computing Getting Started with R


![Skaffold - storage.googleapis.com · [getting-started getting-started] Hello world! [getting-started getting-started] Hello world! [getting-started getting-started] Hello world! 5](https://cdn.vdocuments.mx/doc/165x107/5ec939f2a76a033f091c5ac7/skaffold-getting-started-getting-started-hello-world-getting-started-getting-started.jpg)


