
Sponsored by
Maui County Mayor’s Office of Economic Development and the
Maui Visitors Bureau
Get Ready for Chinese Visitors

CHINA
Understanding Chinese Visitors


5000 Years of Tumult & Transformation
1978 –Reform & Opening
1949 –Communist Revolution
19c. – 1948 Humiliation, Nationalism & Wars
5 Rulers 27-22 c. BCXia 22-16 c.Shang 16c-1066Zhou 1066-221Qin 221-205Han 206 BC-220 AD3 Kingdoms 220-280Wei 220-265Shu 221-263Wu 222-280W. Jin 265-316E. Jin 317-42016 Kingdoms 304-420South-North 420-588Tang 618-907Song 960-1279Yuan 1279-1368Ming 1368-1644Qing 1644-1911R. of China 1911-1949
2001 – WTO
2008 – Beijing Olympics
One-party rule
Central authority
Top-down style

1990
2010
SHANGHAI

A Walk Down Shanghai’s Nanjing Road

Chinese Tourists – Important Regional Differences
• Beijing
• Shanghai
• Taiwan
• Chongqing• Chengdu
• Hong Kong• Guangzhou
Cantonese-speaking
Mandarin-speaking
Beijing, Northern China:- Heavier drinkers- More political- Warmer personalities
Shanghai:- Wealthy (reputation
for being stingy)
Southern China (Hong Kong, Guangzhou):- Cosmopolitan- Flashy style- Cantonese , more English
Western China (Chengdu, Chongqing):- Newest wealth- Less sophisticated- Warmer personalities

Chinese Tourists – Vast Generational Differences
Age 45+ 30-45 Kids & 20-somethings
Born Before 1970 1970-85 After 1985
Background • Survived severe hardships • Emerged out of poverty• Family first-achiever
• Every year has been better than last
• Spoiled, only child• “Little emperor”
Travel Preferences - Safe, conservative tourist sites- Familiar food- Cost-conscious- “Make the children happy”
- Luxury shoppers- Photo ops- Educational shopping for kids- “Let’s keep up with the
Joneses”
- Heavy social media- Spend parents’ $- Becoming
eco-conscious- Niche interests- “I want it all”

Our target market segments
TRAVEL SOPHISTICATION High
Hig
hSP
EN
DIN
G
POW
ER
Super Rich• Small, select group• Some have little education• Want money-can’t-buy experiences
BusinessDelegations
• Expense accounts• 5-star focused
Upper-Middle Class Shoppers
Honeymooners• Materialistic• Want bragging
rights, photo ops
Visiting Family & FriendsSeniors
• Budget conscious
Educational Tourists
Real Estate Investors
• ‘Smart’ travelers• Info hungry
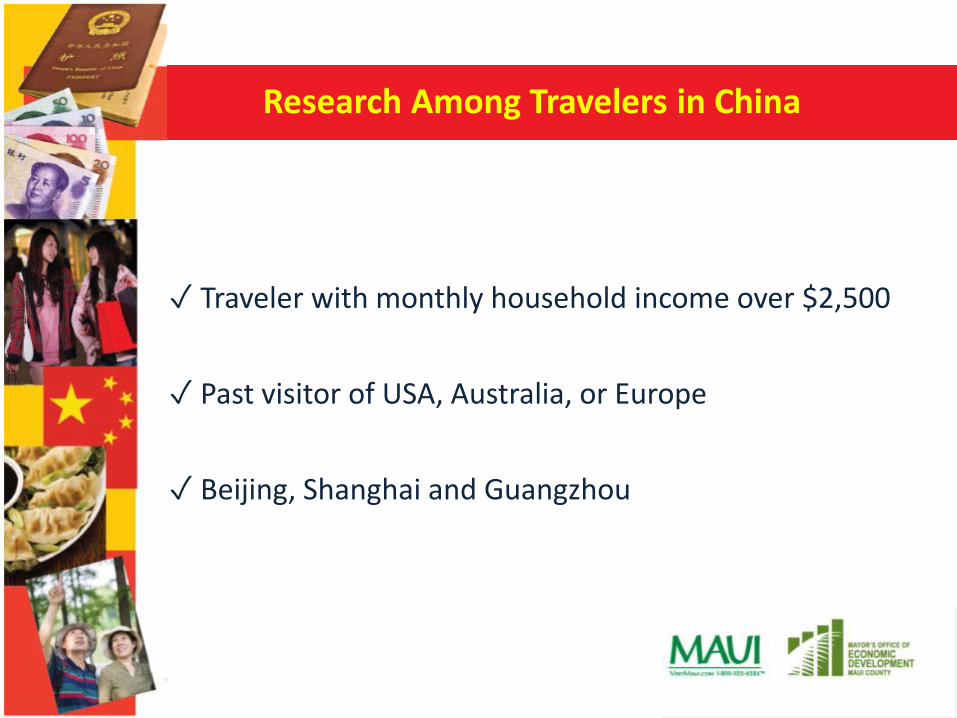
Research Among Travelers in China
✓ Traveler with monthly household income over $2,500
✓ Past visitor of USA, Australia, or Europe
✓ Beijing, Shanghai and Guangzhou

Hawai‘i has strong top of mind consideration,and competes well against the USA as a whole and AU
Base Total Respondents: (400)A1 Now we'd like you to think specifically about vacation destinations. What vacation destinations would you consider for your next international leisure trip?
Unaided Destination Consideration – Hawaii and Top Competitors
Hawai‘i 25%
Tahiti 2%
Australia 32%
Maldives 19%
Dubai 7%Saipan 4%
France 33%USA 32%
New York 4%
50%
40%
30%
20%
10%
California 2%
Japan 38%

Among core competitors, Hawai‘i is the most considered destination on par with the Maldives
Aided Destination Consideration(Next 2 Year Visitation)
/ Statement is significantly higher/lower than Hawaii at 95% confidence levelBase Those Aware: Hawaii (400); New York (193); California (208); Maldives (157); Australia (157); Dubai (167); Tahiti (163); Saipan (155)B2 Consideration: How strongly would you consider visiting the following destinations in the next 2 years?
Top 2 Box Consideration: It’s the only destination I would consider/It’s one of the first destinations I’d consider but I might also consider
others
California47% New York
51%
Australia59%
Maldives63%
Hawai‘i 69%
Dubai57%
Tahiti45%
Saipan41%

Hawai‘i image is positive but not unique
Destination Imagery – Perceptual Map
Note: Yellow highlighted metrics represent top tier imagery drivers to considerationB5 Destination Imagery Perceptions: How well would you say the statement below describes each travel destination? Using the scale from 1-5 below, where 1 means “it does not describe the destination at all”, and 5 means “it completely describes the destination."
Is a place that is worth going to several times
Worth paying more for than other travel destinations
Offers the best of everything in one place
Is a place with a unique and desirable lifestyle
Offers great family experiences
Is a good value for the money Is a place with scenic beauty
Is a place you feel safe and secure
Is a place to indulge myself
The local people are friendly
Is a place with an abundance of offerings
The environment is clean
Is a place rich with culture
Offers unique experiences
Offers great weather year round
12.8%
66.4%
Hawai‘i
New York
CaliforniaMaldives
Australia
Dubai
Tahiti
Saipan
Blue = Top Consideration Drivers
SceneryVariety
Family
Unique

Visas and costs are top barriers for Hawai‘i; Opinions from family/friends are influential
Barriers to Visitation
Hawai‘i New York Maldives Australia
Concerns over visas & travel requirements 22% 29% 18% 17%Opinions from family, friends and co-workers 20% 19% 17% 18%
Hotels, meals, transportation and other costs are too expensive once there 20% 28% 17% 15%
It's difficult for me to communicate with locals because of the language barrier 19% 15% 22% 14%
Concerns over safety (terrorism, political unrest, crime, natural disasters) 18% 34% 24% 14%
It costs too much to get there 17% 20% 17% 18%It's hard to get around within the destination 14% 14% 20% 20%
It's hard to make a last minute booking 13% 13% 11% 11%There are no direct flights 12% 9% 10% 8%
Other destinations are more worthwhile to me 12% 16% 8% 8%Lack of knowledge beyond major cities 11% 12% 14% 11%
Past experiences I’ve had there 10% 16% 11% 10%There is nothing new to experience 10% 16% 9% 11%
They do not offer food that I want to eat 9% 12% 11% 13%I don't know enough about this destination 8% 7% 10% 11%
Note: Statements above only shown for top tier competitors/ Statement is significantly higher/lower than Hawaii at 95% confidence levelBase Those Aware: Hawaii (400); New York (193); California (208); Maldives (157); Australia (157); Dubai (167); Tahiti (163); Saipan (155)B6 Barriers to Visitation: Which of the following would prevent you from visiting these destinations?

Traveler Profile – Those who would Consider Hawai‘i (Top 2 Box)
Preferred Type of Vacation
Concerns over visas & travel requirements
24%
It's difficult for me to communicate with locals because of the language barrier
21%
Hotels, meals, transportation and other costs are too expensive once there
19%
Compared to those who would not highly consider Hawai‘i ...
More likely to prefer a vacation that is relaxing + romantic or full of outdoor activities
69%
Top 3 Barriers to visiting Hawai‘i
Travel Mindset
Compared to those who would not highly consider Hawai‘i ...
More likely to share travel experiences with others through social media
Post reviews on travel websites
Give family/friends trip advice

Romance/wedding imagery is most persuasive and fits best with impressions of Hawai‘i
Note: All numbers above are Top Box scoreBase All respondents (400)C1 Creative Diagnostics: For each pair of statements below, please select a number on the scale that is closest to the statement that you most agree with.
Creative Response (Top 5 Images)
0% 25% 50% 75% 100%
77%Persuasion
75%Fit
0% 25% 50% 75% 100%
69%Persuasion
68%Fit
0% 25% 50% 75% 100%
60%Persuasion
61%Fit
0% 25% 50% 75% 100%
58%Persuasion
57%Fit
0% 25% 50% 75% 100%
56%Persuasion
51%Fit
Average Persuasion: 54%Average Fit: 53%
Rom
ance
Fam
ilyBe
ach
part
yW
aiki
kiVo
lcan
o
Top Box Scores

Note: All numbers above are Top Box scoreBase All respondents (400)C1 Creative Diagnostics: For each pair of statements below, please select a number on the scale that is closest to the statement that you most agree with.
Average Persuasion: 54%Average Fit: 53%
Shopping imagery is the least persuasive and is not considered a strong fit for Hawai‘i
Creative Response (Bottom 5 Images)
0% 25% 50% 75% 100%
47%
Persuasion
47%
Fit
0% 25% 50% 75% 100%
45%
Persuasion
41%
Fit
0% 25% 50% 75% 100%
40%
Persuasion
34%
Fit
0% 25% 50% 75% 100%
46%
Persuasion
50%
Fit
0% 25% 50% 75% 100%
44%
Persuasion
47%
Fit
Hul
a da
nce
Surf
boar
dra
ckU
kule
leSh
ave
ice
Shop
ping
para
dise
Top Box Scores
Touchpoints

• Note: Touchpoints are ranked from highest to lowest usage at “Thinking of potential destinations”• Base: Total Respondents: (400)• T1 Touchpoints Used – Offline Sources: Now we'd like to know which sources you use when deciding on a vacation destination. For each of the following, please
select all of the stages at which you use that source.
Touchpoints Across Stages – Offline Sources
Half of Chinese travelers use word of mouth to determine and finalize their vacation destination
Thinking of potential destinations
Gathering information and narrowing down options
Making my final decision about where to go
Movie or documentary 60% 47% 19%Advertisement on TV, radio, print,
outdoor, etc. 59% 55% 24%
Travel book 56% 57% 30%
Articles/reviews in a magazine/newspaper 55% 60% 32%TV program or news story about the
destination 55% 61% 26%
Talk to friends/family who have visited or are familiar with the destination 54% 60% 50%
Advertisement or brochure received in the mail 50% 49% 21%
Travel agent 50% 59% 41%
Travel convention 50% 52% 25%
Destination visitor's guide 49% 57% 44%
Usa
ge P
erce
nt
Highest
Lowest

• Note: Touchpoints are ranked from highest to lowest usage at “Thinking of potential destinations”• Base: Total Respondents: (400)• T1 Touchpoints Used – Online Sources: Now we'd like to know which sources you use when deciding on a vacation destination. For each of the following, please
select all of the stages at which you use that source.
Touchpoints Across Stages – Online Sources
Online booking websites are often used for research and making final vacation decisions
Thinking of potential destinations Gathering information and narrowing down options
Making my final decision about where to go
Search engine results 59% 65% 33%
Social networking site 57% 58% 26%
Website for an online booking site 56% 64% 52%
Online advertisement 55% 41% 16%
Official destination website for a tourism agency 54% 62% 38%
Website with travel advice and consumer reviews 54% 62% 38%
An app for a travel website 50% 58% 34%Website for an airline, hotel, tour
operator 49% 60% 35%
Online Malls 42% 43% 18%
Usa
ge P
erce
nt
Highest
Lowest

41%46%50%51%49%48%53%55%55%56%58%57%58%62%61%
53%64%
60%57%
57%47%
46%43%
43%43%
40%38%36%35%34%
33%31%
29%29%
23%22%
22%20%
Talk to friends/family who have visited or are familiar with the destinationDestination visitor’s guide
Website for an online booking site Website with travel advice and consumer reviews
Travel bookTV program or news story about the destination
Travel agentTravel convention
Articles/reviews in a magazine/newspaperOfficial destination website for a tourism agency
Social networking site Search engine results
An app for a travel website Movie or documentary
Website for an airline, hotel, tour operatorAdvertisement on TV, radio, print, outdoor, etc.
Online Malls Advertisement or brochure received in the mail
Online advertisement
Note: Touchpoints are ranked from high to low on “Very influential”Base All respondents (400)T3 How influential are these sources when deciding which destination you want to travel to for vacation?
The most influential touchpoint in destination planning is word of mouth from friends/family
• Online/Offline Sources - Influencers in Planning
Use, somewhat influential
Use, very influential

Top Tier Touchpoints Across Decision Journey – Offline and Online
T1/T2 Now we'd like to know which sources you use when deciding on a vacation destination. For each of the following, please select all of the stages at which you use that source.
Movie or documentary 60%
Advertisement on TV, radio, print, outdoor, etc.
59%
Search engine results 59%
Social networking site 57%
Travel book 56%
Website for an online booking site 56%
Search engine results 65%
Website for an online booking site 64%
Official destination website for a tourism agency
62%
Website with travel advice and consumer reviews
62%
TV program or news story about the destination
61%
Articles/reviews in a magazine/newspaper
60%
Talk to friends/family who have visited or are familiar with the
destination60%
Website for an airline, hotel, tour operator
60%
Website for an online booking site 52%
Talk to friends/family who have visited or are familiar with the
destination50%
Destination visitor's guide 44%
* Only top tier sources shown. Full list included in Appendix.
WOM is key for gathering information and making a decision; booking sites are used at all stages
Online source Offline source
Thinking of potential destinations Making my final decision about where to go
Gathering information and narrowing down options
Both offline and online sources are used at all stages of planning

How can Maui businesses be ready to deliver that experience ?

1 – Provide Chinese-Language Materials & Custom Itineraries
• Websites, mobile apps
• Brochures
• TV channels, TV guide
• Welcome letter (hotels)
• Maps
• Museum captions
• Entertainment magazines
Custom itineraries:- Shopping- Education- Real estate- Small town America- Luxury lifestyles- Eco-tourism
Packaged to “speak” to Chinese tourists:* Chinese historical references* Chinese celebrity endorsements

1 – Provide Chinese-Language Materials & Custom Itineraries
Chinese tourist menu design:1.Photo of each food item2.Chinese-English translation3.PriceEasy food recognition, point-to-order

2 – Train Staff to Welcome Chinese Guests
• Encourage staff to interact with Ch. visitors- Show interest, be chatty- Play with their kids- When drinking, toast guests individually- Pull them on stage- For delegations, introduce boss to shake hands and
receive business cards (use both hands)
• Exploit Chinese passion for photography- Offer to take their photos- Jump in photos yourself, strike a pose
(and give them a hug!)

2 – Train Staff to Welcome Chinese Guests
• Demonstrate you are interested in Chinese culture- Learn a few common Chinese phrases
• Learn to say their names- Use English name (or offer to give them one!)- If no English name, use family name only- Learn correct pronunciation of 20 most common family
names
PronunciationHello Ni hao 你好 “Knee-how”Welcome Huan ying 欢迎 “Hwan-ying”Thank you Xie xie 谢谢 “Shay-shay”Good bye Zai jian 再见 “Zie-jen”

3 – Accommodate Chinese Dining Preferences
• Chinese eat collectively, like to share food(may put dishes in middle of table)
• Enjoy buffets
• Prefer noodles, cooked vegetables, spicy foods (not cold dishes)
• Rather have soup than salad
• Smaller portions of meat
• Do not put ice in drinks (ask if they prefer hot/warm water)
• Eager to try seafood (esp. lobster, crab)
• Less focus on desserts
• Not used to tipping

3 – Accommodate Chinese Dining Preferences
Chinese tourists prefer to start their day with their Chinese food …
so provide a simple Chinese breakfast option
Noodles Fried dough
Rice soup
Hard Boiled Eggs
Consult a Chinese supermarket … or just serve chicken-rice soup, hard boiled eggs and hot soy milk

4 – Prepare Technology to Accommodate Chinese Tourist Needs
• Free Wifi (w/Chinese interface)
• Charging stations, adapters
• Unionpay
• WeChat + QR codes
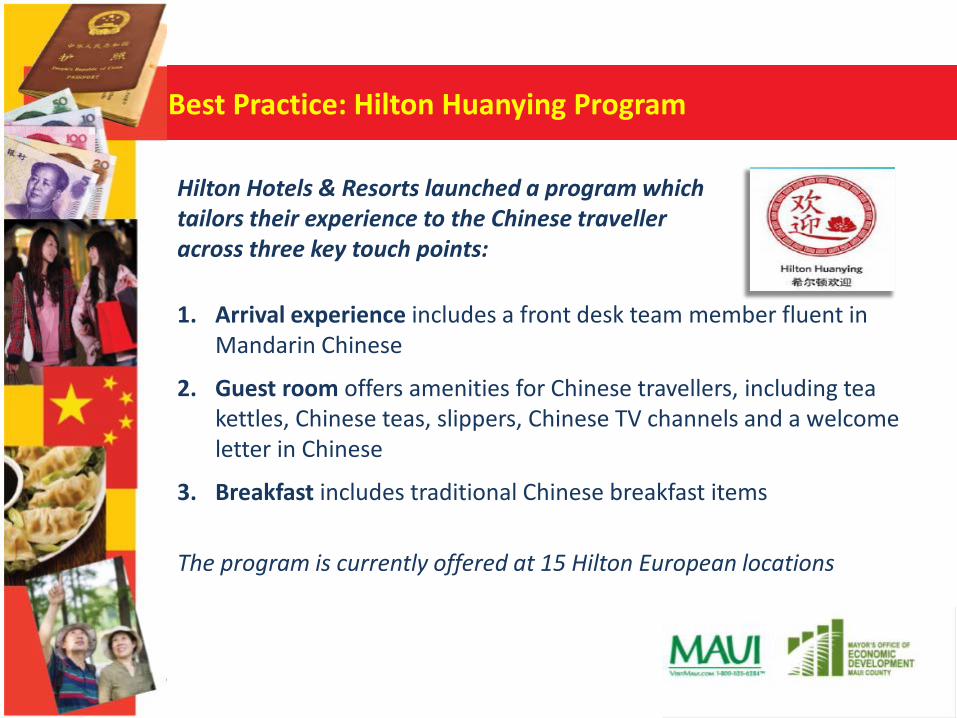
Best Practice: Hilton Huanying Program
Hilton Hotels & Resorts launched a program whichtailors their experience to the Chinese traveller across three key touch points:
1. Arrival experience includes a front desk team member fluent in Mandarin Chinese
2. Guest room offers amenities for Chinese travellers, including tea kettles, Chinese teas, slippers, Chinese TV channels and a welcome letter in Chinese
3. Breakfast includes traditional Chinese breakfast items
The program is currently offered at 15 Hilton European locations

What HTChina is doing?
CHINA

China Outbound Travel
Table: Chinese outbound visitors 2010-2017
2010 2011 2012 2013 2014 2020
57.39m70.25m
83m98m 109.8m
200m
18% 22% 18% 18% 12%
Visitors
Year-on-Year Growth
Source: CNTA & CLSA

493 525
802
1,089
1,474
1,808
2,188
2,603
2008 2009 2010 2011 2012 2013 2014F 2015F
China Outbound to USA
Source: U.S. Department of Commerce. April 2014. (‘000)
6.5%52.8%
35.8%
35.4%
22.7%
19%
21%

China Outbound to Hawai‘i
7%
22%

China Outbound to Maui County
2010 % Chng 2011 % Chng 2012 % Chng 2013 % Chng
Maui 6,683 +39.2% 10,564 +58.1% 15,343 +45.2% 18,789 +22.5%
Moloka‘i 579 +43.0% 934 +61.3% 1,560 +67.0% 1,034 -33.7%
Lāna‘i 464 +29.6% 1,090 +134.9% 641 -41.2% 718 +12.0%

2014 YTD (Jan – July)
Arrivals YOY YTD
O‘ahu 31.1% 95,130
Maui 41.6% 16,740
Kaua‘i 16.3% 3,349
Hawai‘i Island 64% 20,414

China Outbound to Other Destinations
Malaysia Japan
1,791,423 1,390,446
AustraliaNew
Zealand Maldives
715,360 228,928 331,694
Thailand
4,705,173
Korea
4,326,869

2013 MMA Arrivals to Hawai‘i

Market Profile
2013
• Expenditures: 394M
• Arrivals: 125,011
• LOS: 6.19 days
• PPPD: $394

PPPD Breakdown (2014 Jan-Jun) China Korea Japan
FOOD 52.2 56.4 51.4
ENTERTAINMENT & RECREATION
27.2 24.7 19.1
TRANSPORTATION 29.9 22.5 12.1
SHOPPING 178.8 70.7 79.0
LODGING 91.6 85.6 102.8
ALL OTHER EXPENSES 12.0 2.9 14.5
TOTAL EXPENSES 391.7 262.9 278.9

First Timers Repeaters85.2% 14.8%
Group Tour Non-Group51% 49%
Package Trip No Package71% 29%
Market Profile

• Purpose of Trip
Pleasure/Vacation 87%
Honeymoon/Get Married 7.2%
MCI 7.7%
Market Profile

Island Distribution
O‘ahu Hawai‘i Island Maui Kaua‘i Moloka‘i Lāna‘i
95% 15.9% 15.0% 3.0% 0.8% 0.5%

Airlift - Direct Service
Shanghai
Beijing
6 flights/week
5 flights/week
2014 Total Seats: 139,473 (+225% YOY)

Airlift - One-stop Service
19 flights /week
Tokyo
Shanghai
Qingdao
DalianBeijing
Shenyang
XiamenShenzhen
Chengdu Seoul
28 flights /week

Romance Hawai‘i CampaignBeijing
Shanghai
Guangzhou

Hawai‘i Micro Movie
14 Feb - 13 MarVV: 10.33 million

China Leisure & MCI Sales Missions
Leisure: 31 Hawai‘i partners & 400 travel agentsMCI: 9 Hawai‘i partners & 120 travel agents
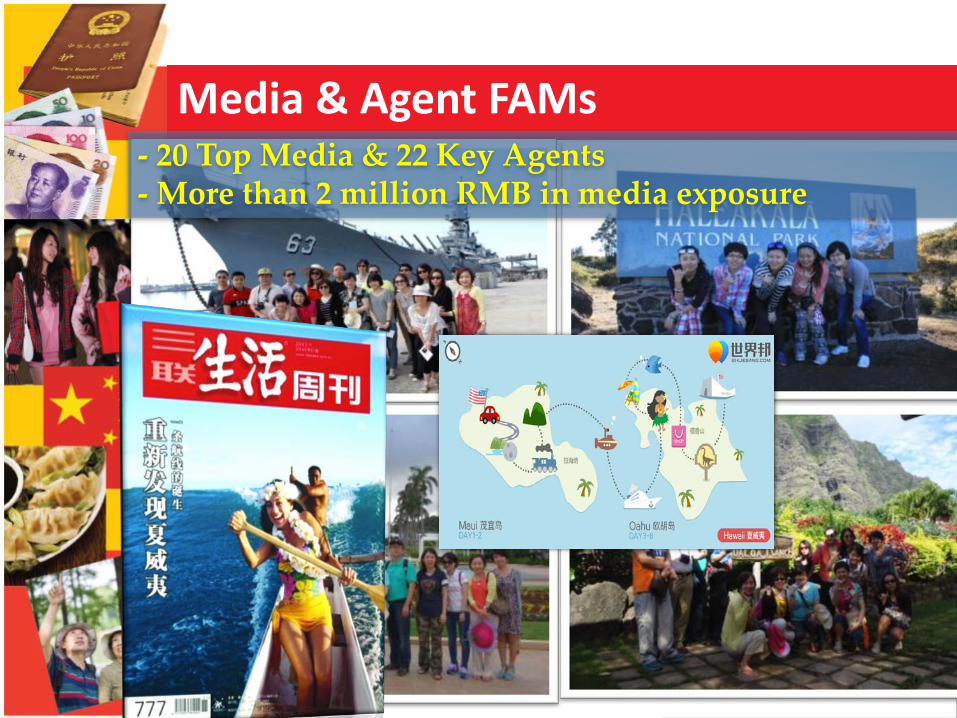
Media & Agent FAMs- 20 Top Media & 22 Key Agents- More than 2 million RMB in media exposure

Road Shows to Top Tier 2 Cities
12 cities – over 1,000 travel agents
Northern China:1. Tianjin2. Qingdao3. Shenyang4. Dalian5. Jinan
Eastern China:1. Hangzhou2. Nanjing
Southern China:1. Xiamen2. Shenzhen
Southwest China:1. Chengdu2. Chongqing3. Xian

Brochure Audit – Hawai‘i Products
Product 2013 YOY YTD
US Mainland+Hawai‘i 413 40% 578
Hawai‘i Stand-Alone 9 360% 202
FIT 0 72
Honeymoon 3 61
Golf 4 39
Family 0 13
87 TOs + 20 OTAs

2015 China Key Initiatives
Sustain/Grow Air Seat Capacity
Travel Trade Education & Collaboration
Increase Online & Social Media Presence
Product Development
Hawai‘i Capacity Building
Grow MCI

Partnership Opportunties
• Trade and Media FAM Trips• eNewsletters• Press Releases• Social Media Promotions• China Sales Mission: March 16-20, 2015• Road Shows/Workshops• Joint Sales Calls

Mahalo !
Hawai‘i Tourism Authority
Jadie GooTourism Brand Manager
Hawai‘i Tourism China
Ivy GaoAccount Director86-10-64384924


