Download - Genetic structure and patterns of gene flow among populations of the endangered Ethiopian wolf
Genetic structure and patterns of gene flow amongpopulations of the endangered Ethiopian wolfD. Gottelli1, C. Sillero-Zubiri2, J. Marino2, S. M. Funk3 & J. Wang1
1 Institute of Zoology, Zoological Society of London, London, UK2 Wildlife Conservation Research Unit, Zoology Department, University of Oxford, Tubney, UK3 Nature Heritage, Berlin, Germany
Keywords
Canis simensis; endangered species;microsatellites; population structure; geneflow; Afroalpine habitat.
Correspondence
Dada Gottelli, Institute of Zoology,Zoological Society of London, Regents Park,London NW1 4RY, UKEmail: [email protected]
Editor: Todd KatznerAssociate Editor: Jeff Johnson
Received 13 September 2011; accepted 10August 2012
doi:10.1111/j.1469-1795.2012.00591.x
AbstractPopulations of endangered mammals are often small, fragmented and have lowgenetic variability that can reduce the ability to evolve in response to environmen-tal changes. The endangered Ethiopian wolf (Canis simensis) is a habitat specialistrestricted to six small, isolated pockets of Afroalpine habitat, with a total popu-lation of fewer than 500 adult animals. The degradation of the Ethiopian high-lands because of human expansion is ever increasing, potentially leading to furtherpopulation fragmentation and local extinctions. In order to assist Ethiopian wolfconservation management, we quantified the genetic diversity, population struc-ture and patterns of gene flow of the species using up to 14 microsatellite loci. FST,analysis of molecular variance, principal coordinates analysis and Bayesian clus-tering analyses revealed geographic population structuring delimited by threemountain ranges, in concert with a previous study based on mitochondrial DNA.Bayesian analysis showed that current gene flow is low, unidirectional and limitedto geographically proximate populations. Given the small census size and strongpopulation structuring with low gene flow, demographic stochasticity is likely tobe the highest threat to the long-term persistence of this species. The protection ofthe remaining suitable habitat, especially narrow ridges linking habitat patcheswithin mountain blocks, is therefore essential. The genetic survey presented by thisstudy provides vital and much needed information for the future effective man-agement of Ethiopian wolf populations.
Introduction
The Ethiopian wolf, Canis simensis, is a medium-sized canidhighly adapted to life in Afroalpine ecosystems above alti-tudes of 3000 m, where it preys almost exclusively on highaltitude rodents (Marino, Mitchel & Johnson, 2010). For acomprehensive review of the species’ ecology, see Sillero-Zubiri et al. (2004). This highly specialized canid divergedfrom its wolf-like ancestor about 100 000 ya, at the peak ofthe last glaciation, when Afroalpine habitat reached itsmaximum expansion allowing the wolves to colonize theEthiopian highlands (Gottelli et al., 2004). It is likely thatthe Ethiopian wolf exhibited its largest range and most con-tinuous distribution during this period. Numbers began todecline with the onset of the present interglacial, 18 000 ya,as Afroalpine habitats started to disappear from lower alti-tudes replaced by montane forests. Suitable habitat becameincreasingly fragmented, forcing the wolves to retreat intothe remaining mountain refugia.
These historic processes of range contraction and popu-lation fragmentation following the last glaciation may haveresulted in a genetic structure shaped by disruption to gene
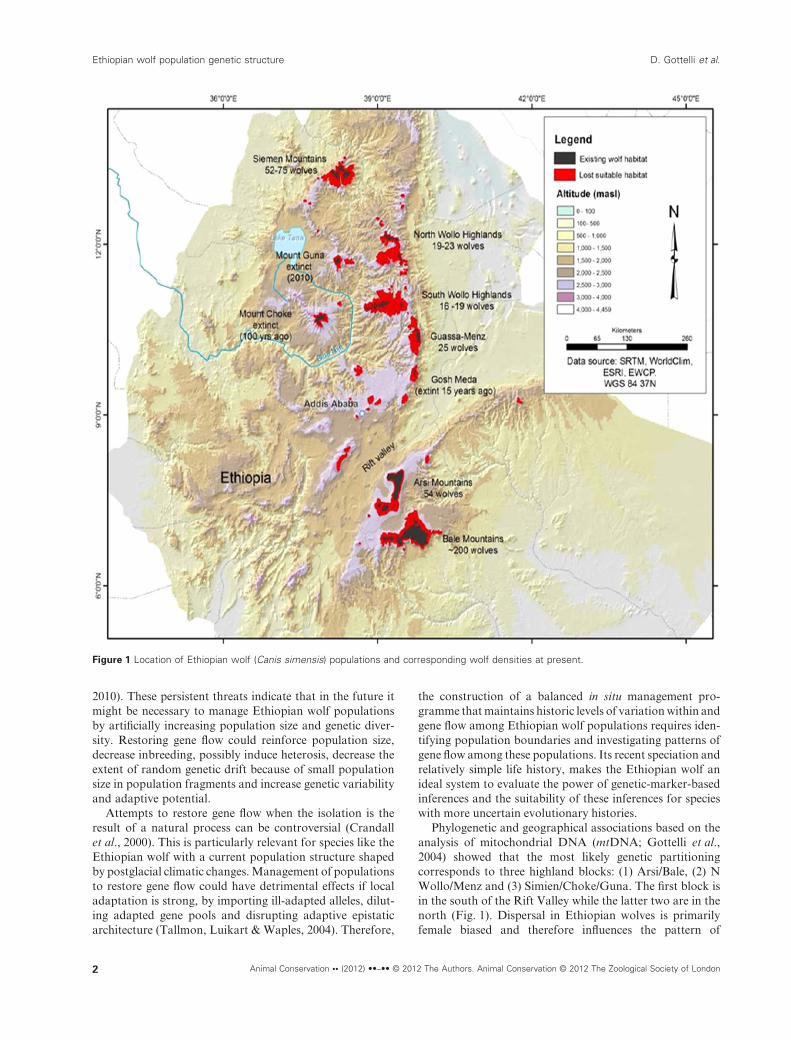
flow, genetic isolation and then rapid genetic drift of thesepopulations. This type of demographic history couldexplain the low genetic variability found in Ethiopianwolves, compared with more generalist canids (Wayne,Geffen & Vila, 2004; Aspi et al., 2009, vonHoldt et al., 2010,Sastre et al., 2011). In recent times, the loss of Afroalpinehabitats because of human expansion resulted in furtherdramatic declines in wolf numbers. Today, there are fewerthan 500 adult wolves in six isolated populations across theEthiopian highlands, with three confirmed populationextinctions in the last hundred years (Fig. 1; Sillero-Zubiri &Marino, 2004; Marino et al., 2011).
The long-term effect of drastic fluctuations in populationsize on eroding fitness may not be apparent at present (Reed& Frankham, 2003, vonHoldt et al., 2010). However, theextremely small breeding size of some of the Ethiopian wolfpopulations, north of the Rift valley, has raised concerns(Marino, 2003). Ethiopian wolves are also vulnerable tooutbreaks of rabies that have previously dramaticallyreduced local population densities by up to 75% over just afew months (Sillero-Zubiri, Gottelli & Macdonald, 1996a;Randall et al., 2004; Haydon et al., 2006; Johnson et al.,
bs_bs_banner
Animal Conservation. Print ISSN 1367-9430
Animal Conservation •• (2012) ••–•• © 2012 The Authors. Animal Conservation © 2012 The Zoological Society of London 1
2010). These persistent threats indicate that in the future itmight be necessary to manage Ethiopian wolf populationsby artificially increasing population size and genetic diver-sity. Restoring gene flow could reinforce population size,decrease inbreeding, possibly induce heterosis, decrease theextent of random genetic drift because of small populationsize in population fragments and increase genetic variabilityand adaptive potential.
Attempts to restore gene flow when the isolation is theresult of a natural process can be controversial (Crandallet al., 2000). This is particularly relevant for species like theEthiopian wolf with a current population structure shapedby postglacial climatic changes. Management of populationsto restore gene flow could have detrimental effects if localadaptation is strong, by importing ill-adapted alleles, dilut-ing adapted gene pools and disrupting adaptive epistaticarchitecture (Tallmon, Luikart & Waples, 2004). Therefore,
the construction of a balanced in situ management pro-gramme that maintains historic levels of variation within andgene flow among Ethiopian wolf populations requires iden-tifying population boundaries and investigating patterns ofgene flow among these populations. Its recent speciation andrelatively simple life history, makes the Ethiopian wolf anideal system to evaluate the power of genetic-marker-basedinferences and the suitability of these inferences for specieswith more uncertain evolutionary histories.
Phylogenetic and geographical associations based on theanalysis of mitochondrial DNA (mtDNA; Gottelli et al.,2004) showed that the most likely genetic partitioningcorresponds to three highland blocks: (1) Arsi/Bale, (2) NWollo/Menz and (3) Simien/Choke/Guna. The first block isin the south of the Rift Valley while the latter two are in thenorth (Fig. 1). Dispersal in Ethiopian wolves is primarilyfemale biased and therefore influences the pattern of
Figure 1 Location of Ethiopian wolf (Canis simensis) populations and corresponding wolf densities at present.
Ethiopian wolf population genetic structure D. Gottelli et al.
2 Animal Conservation •• (2012) ••–•• © 2012 The Authors. Animal Conservation © 2012 The Zoological Society of London
mtDNA variation among populations. However, there isevidence that some long-distance male-mediated dispersalcan take place especially following disruption to pack social-ity caused by diseases outbreaks (Sillero-Zubiri, King &Macdonald, 1996b; Randall et al., 2010). In order to eluci-date further the genetic structure of Ethiopian wolf popula-tions, we use faster evolving microsatellite markers capableof detecting migrations of both sexes and allowing infer-ences on a more recent population history. We expect stronggenetic differentiation because of the wolves’ strict habitatspecialization and the lack of suitable corridors for dispersalamong extant populations. We test this hypothesis by ana-lyzing the microsatellite data using a range of analyticalapproaches. We discuss the implications of the results forthe genetic management of Ethiopian wolves to ensure theeffective conservation of one of Africa’s most threatenedcarnivores and the world’s rarest canid (IUCN/SSC CanidSpecialist Group, 2011).
Materials and methods
Sampling
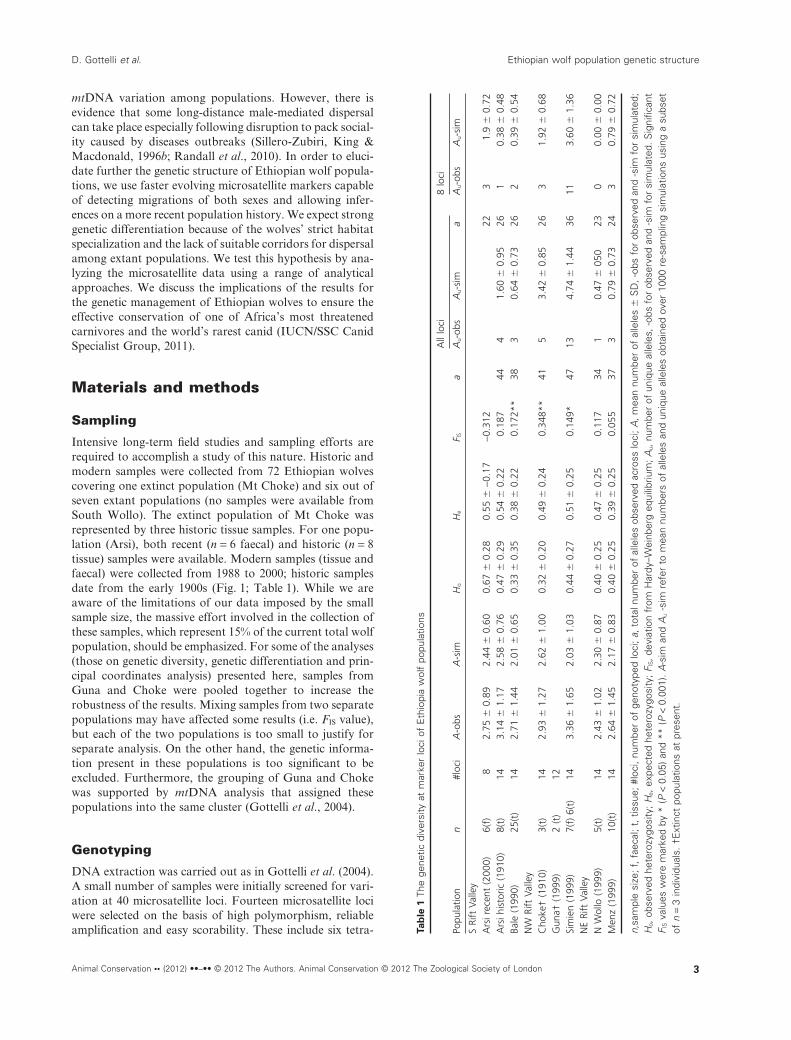
Intensive long-term field studies and sampling efforts arerequired to accomplish a study of this nature. Historic andmodern samples were collected from 72 Ethiopian wolvescovering one extinct population (Mt Choke) and six out ofseven extant populations (no samples were available fromSouth Wollo). The extinct population of Mt Choke wasrepresented by three historic tissue samples. For one popu-lation (Arsi), both recent (n = 6 faecal) and historic (n = 8tissue) samples were available. Modern samples (tissue andfaecal) were collected from 1988 to 2000; historic samplesdate from the early 1900s (Fig. 1; Table 1). While we areaware of the limitations of our data imposed by the smallsample size, the massive effort involved in the collection ofthese samples, which represent 15% of the current total wolfpopulation, should be emphasized. For some of the analyses(those on genetic diversity, genetic differentiation and prin-cipal coordinates analysis) presented here, samples fromGuna and Choke were pooled together to increase therobustness of the results. Mixing samples from two separatepopulations may have affected some results (i.e. FIS value),but each of the two populations is too small to justify forseparate analysis. On the other hand, the genetic informa-tion present in these populations is too significant to beexcluded. Furthermore, the grouping of Guna and Chokewas supported by mtDNA analysis that assigned thesepopulations into the same cluster (Gottelli et al., 2004).
Genotyping
DNA extraction was carried out as in Gottelli et al. (2004).A small number of samples were initially screened for vari-ation at 40 microsatellite loci. Fourteen microsatellite lociwere selected on the basis of high polymorphism, reliableamplification and easy scorability. These include six tetra- T
ab
le1
The
gene
ticdi
vers
ityat
mar
ker
loci
ofE
thio
pia
wol
fpo
pula
tions
Popu
latio
nn
#loc
iA
-obs
A-s
imH
oH
eF IS
a
All
loci
8lo
ci
Au-
obs
Au-
sim
aA
u-ob
sA
u-si
m
SRi
ftVa
lley
Ars
irec
ent
(200
0)6(
f)8
2.75
�0.
892.
44�
0.60
0.67
�0.
280.
55�
-0.1
7-0
.312
223
1.9
�0.
72A
rsih
isto
ric(1
910)
8(t)
143.
14�
1.17
2.58
�0.
760.
47�
0.29
0.54
�0.
220.
187
444
1.60
�0.
9526
10.
38�
0.48
Bale
(199
0)25
(t)
142.
71�
1.44
2.01
�0.
650.
33�
0.35
0.38
�0.
220.
172*
*38
30.
64�
0.73
262
0.39
�0.
54N
WRi
ftVa
lley
Cho
ke†
(191
0)3(
t)14
2.93
�1.
272.
62�
1.00
0.32
�0.
200.
49�
0.24
0.34
8**
415
3.42
�0.
8526
31.
92�
0.68
Gun
a†(1
999)
2(t
)12
Sim
ien
(199
9)7(
f)6(
t)14
3.36
�1.
652.
03�
1.03
0.44
�0.
270.
51�
0.25
0.14
9*47
134.
74�
1.44
3611
3.60
�1.
36N
ERi
ftVa
lley
NW
ollo
(199
9)5(
t)14
2.43
�1.
022.
30�
0.87
0.40
�0.
250.
47�
0.25
0.11
734
10.
47�
050
230
0.00
�0.
00M
enz
(199
9)10
(t)
142.
64�
1.45
2.17
�0.
830.
40�
0.25
0.39
�0.
250.
055
373
0.79
�0.
7324
30.
79�
0.72
n,sa
mpl
esi
ze;f
,fae
cal;
t,tis
sue;
#loc
i,nu
mbe
rof
geno
type
dlo
ci;a
,tot
alnu
mbe
rof
alle
les
obse
rved
acro
sslo
ci;A
,mea
nnu
mbe
rof
alle
les
�S
D,-
obs
for
obse
rved
and
-sim
for
sim
ulat
ed;
Ho,
obse
rved
hete
rozy
gosi
ty;H
e,ex
pect
edhe
tero
zygo
sity
;FIS,d
evia
tion
from
Har
dy–W
einb
erg
equi
libriu
m;A
u,nu
mbe
rof
uniq
ueal
lele
s,-o
bsfo
rob
serv
edan
d-s
imfo
rsi
mul
ated
.Sig
nific
ant
F IS
valu
esw
ere
mar
ked
by*
(P<
0.05
)and
**(P
<0.
001)
.A-s
iman
dA
u-s
imre
fer
tom
ean
num
bers
ofal
lele
san
dun
ique
alle
les
obta
ined
over
1000
re-s
ampl
ing
sim
ulat
ions
usin
ga
subs
etof
n=
3in
divi
dual
s.†E
xtin
ctpo
pula
tions
atpr
esen
t.
D. Gottelli et al. Ethiopian wolf population genetic structure
Animal Conservation •• (2012) ••–•• © 2012 The Authors. Animal Conservation © 2012 The Zoological Society of London 3
nucleotide microsatellite loci (c2001, c2010, c2017, c2054,c2088, c2096; Francisco et al., 1996), seven dinucleotide loci(130, 213, 250, 253, 436, 466, 642; Ostrander, Sprague &Rine, 1993) and one hexanucleotide locus (vwF, Shibuyaet al., 1994). All samples were screened using these 14 loci,with the exception of faecal samples where a subset of onlyeight loci (c2001, c2010, c2017, c2088, c2096; 466, 436, vwF)were used because the multiple tube approach (Taberletet al., 1996) that is used to control genotyping errors requireslarge quantities of DNA (Table 1). Genotyping was carriedout using fluoro-labelled primers and by performing 36 cyclesof polymerase chain reaction (PCR) amplification in a 10 mLreaction volume containing � 50 ng DNA, 2 nmol of eachdNTP, 1 to 5 pmol of each primer, 0.25 units of Taq polymer-ase (IGI) and 10% of 10x KCl Taq buffer (IGI). We carriedout ‘multiple loading’ by combining PCR products originat-ing from three primer pairs labelled with different dyestogether with a size standard (Tamra 350) using the ABI 377Automatic Sequencer (Applied Biosystems, Foster City, CA,USA) running Genescan 2.1®. Reference samples wereincluded on each electrophoresis gel allowing the standardi-zation of allele size measurements across gels. Microsatellitedata were analyzed using Genotyper 2.0® software (AppliedBiosystems). Faecal and museum samples were amplified atleast six times per locus, and consensus genotypes wereobtained by the multiple tubes approach in order to reducegenotyping errors because of allelic dropout and false alleles(Navidi, Arnheim & Waterman, 1992; Taberlet et al., 1996).
Genetic analyses
Genetic diversity
Marker polymorphism in each population was measuredusing the mean number of alleles per locus (A), the totalnumber of unique alleles (Au), observed (Ho) and expected(He) heterozygosity (Nei, 1978). In order to comparenumber of alleles (A, Au) between populations with differ-ing sample sizes, a re-sampling simulation was carried outby selecting a subset of three individuals at random withoutreplacement and calculating the means over 1000 simula-tions (A-sim, Au-sim). Linkage disequilibrium between allpairs of loci (Garnier-Gere & Dillmann, 1992) was evalu-ated and tested for significance using program GENEPOP3.1b (Raymond & Rousset, 1995). FIS, estimated accordingto Weir & Cockerham (1984), was used to quantify depar-ture from Hardy–Weinberg equilibrium (HWE) in eachpopulation (Wright, 1965). Departure from the null hypoth-esis of HWE was tested using permutations as implementedin the GENEPOP 3.1b program.
We applied BOTTLENECK 1.1 (Piry, Luikart &Cornuet, 1999) to the microsatellite data to assess whether abottleneck has occurred and affected the current geneticdiversity or not. Compared with the expected heterozygosityunder mutation-drift equilibrium, an excess of observed het-erozygosity indicates a recent severe reduction in Ne, and adeficit of observed heterozygosity indicates a recent expan-sion in population size or a recent influx of rare alleles from
genetically distinct immigrants (Cornuet & Luikart, 1996).The BOTTLENECK analyses were conducted using a two-phase stepwise mutation model (Di Rienzo et al., 1994) with95% single-step mutations and 5% multiple-step mutations.
Genetic differentiation among populations
We assessed the genetic differentiation of populations andidentified geographically differentiated units using severalapproaches. We calculated pairwise weighted mean FST
values (Cockerham & Weir, 1993) as an estimate of geneticdifferentiation. Significance of differences in allele frequencybetween populations was tested using the Hudson, Boos &Kaplan (1992) c2 test, based on 1000 permutations. Criticalsignificance levels were adjusted using the sequential Bon-ferroni method taking into account multiple tests on thesame data (Rice, 1989).
We applied a hierarchical analysis of molecular variance(AMOVA, Excoffier, Smouse & Quattro, 1992) as imple-mented in Arlequin 1.1 (Schneider et al., 1997). This analy-sis is analogous to an analysis of variance in which thecorrelation among genotype distances is used as anF-statistic analogue at various hierarchical levels, calledj-statistics. jST estimates the proportion of genetic variationamong populations relative to the genetic variation from thewhole species, jCT estimates the proportion of genetic vari-ation among groups of populations relative to the wholespecies and jSC estimates the variation among populationsrelative to a regional grouping of populations. The group-ings that maximized values of jCT and were statisticallysignificant (tested using 10 000 random permutations) indi-cate the most parsimonious geographical subdivisions.
The pattern of genetic differentiation between popula-tions was plotted using a principal coordinates analysis(PCA) conducted using GENALEX v6 (Peakall & Smouse,2006). A Bayesian clustering analysis by STRUCTUREv2.3 (Pritchard, Stephens & Donnelly, 2000) was then usedto infer the number of genetically distinct clusters (K).STRUCTURE partitions a sample of individuals into apredefined number of populations (K) under the assumptionof Hardy–Weinberg and linkage equilibrium using a Baye-sian clustering algorithm. For the analyses presented here,population genetic structure was inferred without using theinformation on the origin of samples. A model allowing foradmixture and independent allele frequencies among popu-lations was chosen, as this setting is considered best becauseof the inferred isolation of populations. Analysis parametersincluded 500 000 iterations followed by a burn in period of50 000. We tested K from 1 to 10, with five replicate analysesper value of K. The most likely number of clusters in oursample was determined using the DK approach (Evannoet al., 2005) implemented in Structure Harvester v0.56.3.(Earl & vonHoldt, 2011).
Migration rates
We estimated recent migration (over the last few genera-tions) using a Bayesian MCMC method implemented in
Ethiopian wolf population genetic structure D. Gottelli et al.
4 Animal Conservation •• (2012) ••–•• © 2012 The Authors. Animal Conservation © 2012 The Zoological Society of London
BayesAss 1.3 (Wilson & Rannala, 2003). The methodaccounts for deviations from HWE within populations byincorporating a separate inbreeding coefficient for eachpopulation. To estimate the posterior probability distribu-tions of the parameters, the MCMC was run for a total of3 ¥ 106 iterations, discarding the first 106 iterations as burnin. Values were averaged from two independent analysesusing different random seeds and D parameters set at 0.15 tocheck for consistency in the results. Because this Bayesianmethod estimates rates of recent immigration into a givenpopulation, only modern samples were included in thisanalysis.
Because of the limitation of the analysis imposed by thesmall sample size, we integrated results from the Bayesianmethod with a sibship analysis. Parentage and kinshipanalyses are often set within the context of conservation andcan yield direct and indirect estimates of migration rates(Waples & Gaggiotti, 2006) as well as reveal the fine geneticstructure within populations. Using the multilocus genotypedata, full and half sibship assignments among the sampledindividuals were made by the software Colony (Wang,2004; Wang & Santure, 2009). The presence of between-population siblings would indicate migrations betweenpopulations, while siblings within a population would indi-cate the pack structure of wolves. This approach has beensuccessfully used in other genetic studies of canids to iden-tify non-migrants, migrants and admixed individuals (von-Holdt et al., 2010). Colony results suggest that analysis ofsibship can be an effective tool to assess genetically effectivemigration among populations.
Power to detect genetic differentiation and
population structures
The power of population differentiation, structure and geneflow analyses described above depends on, among manyfactors, the number of individuals sampled from each popu-lation. Given the small sample sizes, does the dataset of thepresent study have sufficient statistical power to detectgenetic structure and differentiation with a sufficiently low a(type I) error? To answer this question, we carried out asimulation study using the program POWSIM (Ryman &Palm, 2006). The number and frequencies of alleles at eachof the 14 loci estimated from the whole set of populations,and the actual sample size for each of the seven populations(samples from Guna and Choke were pooled as did fordifferentiation and structure analyses) were used as data inthe simulations. To account for missing data, the number ofindividuals with complete genotypes at each locus was aver-aged across loci for each population, and the average (roundto an integer) was taken as the actual sample size for thepopulation. The default values of the parameters inPOWSIM were adopted, except for the number of genera-tions t. We allowed t to vary between 0 and 300 to generatean expected FST between 0 and 0.3 for a subpopulationeffective size of Ne = 500 (the default value of the program).For each t-value, 10 000 replicate runs were conducted andthe frequency that the Fisher exact tests and chi-square tests
reject the null hypothesis of genetic homogeneity at 95%confidence (P < 0.05) was an estimate of power (Ryman &Palm, 2006). The power at t = 0 (FST = 0) represents the a(type I) error, the frequency that genetic homogeneity isrejected while it is true.
To be conservative about the power, we also runPOWSIM for the most difficult situation of low differentia-tion, small sample sizes and a high proportion of missingdata. It involves three populations, Arsi/historic, Arsi/modern and Choke/Guna, with an average estimated FST ofabout 0.08.
Results
Genetic diversity
The levels of allelic diversity (A-observed, A-simulated) andheterozygosity (Ho, He) were relatively similar among allpopulations (Table 1). The number of unique alleles rangedfrom 2.9% in N Wollo to 28% in Simien. The re-samplingsimulation, carried out to correct for the varying sample sizebetween populations, indicated that the Simien populationhas the highest number of unique alleles. Mean FIS acrosspopulations was -0.016 (n = 7). However, the FIS value inBale, Choke/Guna and Simien was positive and significantlydifferent from HWE (P < 0.05), due possibly to the packstructure (see sibship analysis below) or the Wahlund effect.No loci were in linkage disequilibrium (P > 0.05) for alllocus/population combinations. None of the three popula-tions with a sufficiently large sample size (n > 10) showed asignificant excess of expected heterozygosity under HWEover the heterozygosity expected at mutation-drift equilib-rium, indicating no recent severe population genetic bottle-neck (Bale: P = 0.58, Menz: P = 0.60, Simien: P = 0.66;Wilcoxon test) and therefore no recent severe reductionof Ne.
Genetic differentiation betweenpopulations
Pairwise FST varied between 0.074 and 0.357 (Table 2). Ithad a markedly lower value (0.131 � 0.049) between popu-lations within each of the three mountain blocks thanthat between populations from different mountain blocks(0.242 � 0.074). Mean pairwise FST between southern andnorthern populations (0.240 � 0.073) was almost identicalto mean pairwise FST between the two mountain blocksnorth of the Rift Valley (0.240 � 0.075). All pairs of popu-lations differed significantly (P < 0.001, Fisher’s exact test)in allele frequencies across all loci. The lowest FST valueswere found between Bale and historic samples from Arsi.The pairwise FST between Menz and the three largest popu-lations of Bale, Arsi and Simien showed the highest values.
AMOVA analysis showed significant differentiationamong populations, and grouped the populations into thethree mountain ranges. This population grouping showedthe largest jCT value (Table 3). In contrast, the value of jCT
D. Gottelli et al. Ethiopian wolf population genetic structure
Animal Conservation •• (2012) ••–•• © 2012 The Authors. Animal Conservation © 2012 The Zoological Society of London 5
between population groups north and south of the RiftValley was the lowest found and not statistically significant.
Both pairwise FST and jCT AMOVA analyses indicatedthat the most parsimonious genetic subdivisions of theEthiopian wolf populations corresponded to the threemountain blocks, N Wollo/Menz; Simien/Guna/Choke andArsi/Bale.
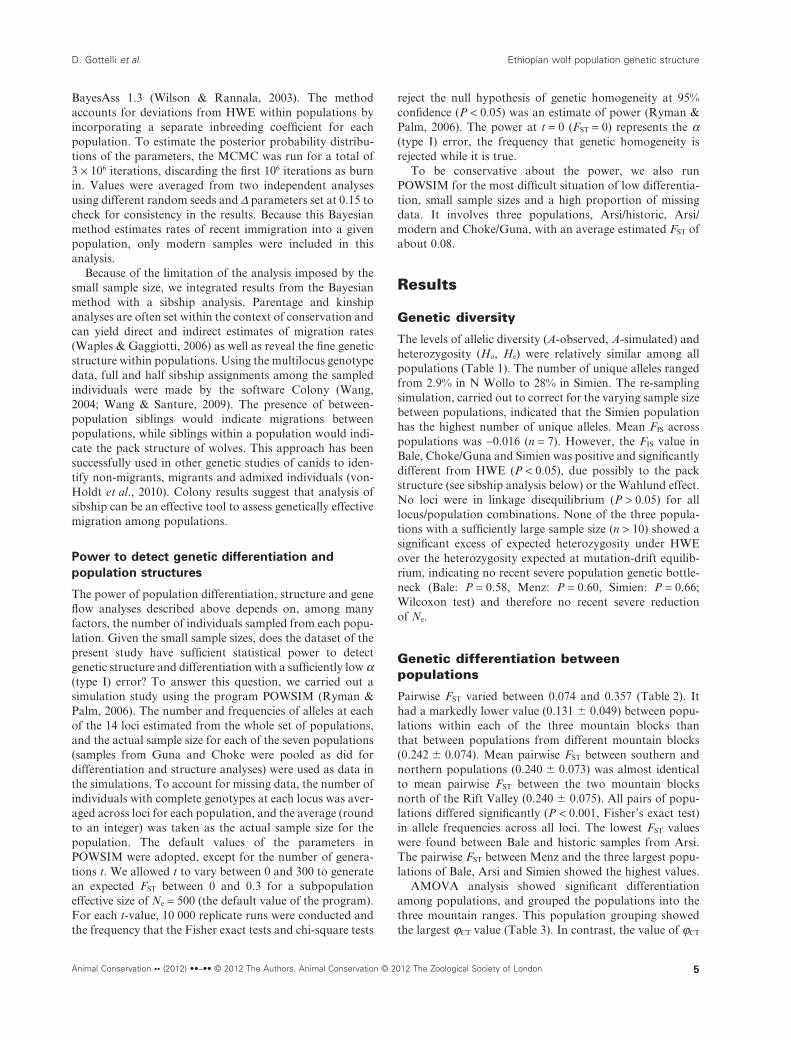
The first two axes of the graphical representation of PCAconducted on the genetic distance between individualsexplained 34.8% and 21.1% of the total genetic variation,55.9% altogether (Fig. 2). The pattern shows the clusteringof Bale and Arsi on the left side, Simien, Choke and Gunaon the top right and N Wollo, Menz on the bottom right. Asingle sample from Choke/Guna is grouped with the Arsipopulation.
The six Ethiopian wolf populations were clearly differen-tiated into six distinct demes with low levels of overlappingpresent between neighbouring populations like Arsi andBale and Choke/Guna and Simien.
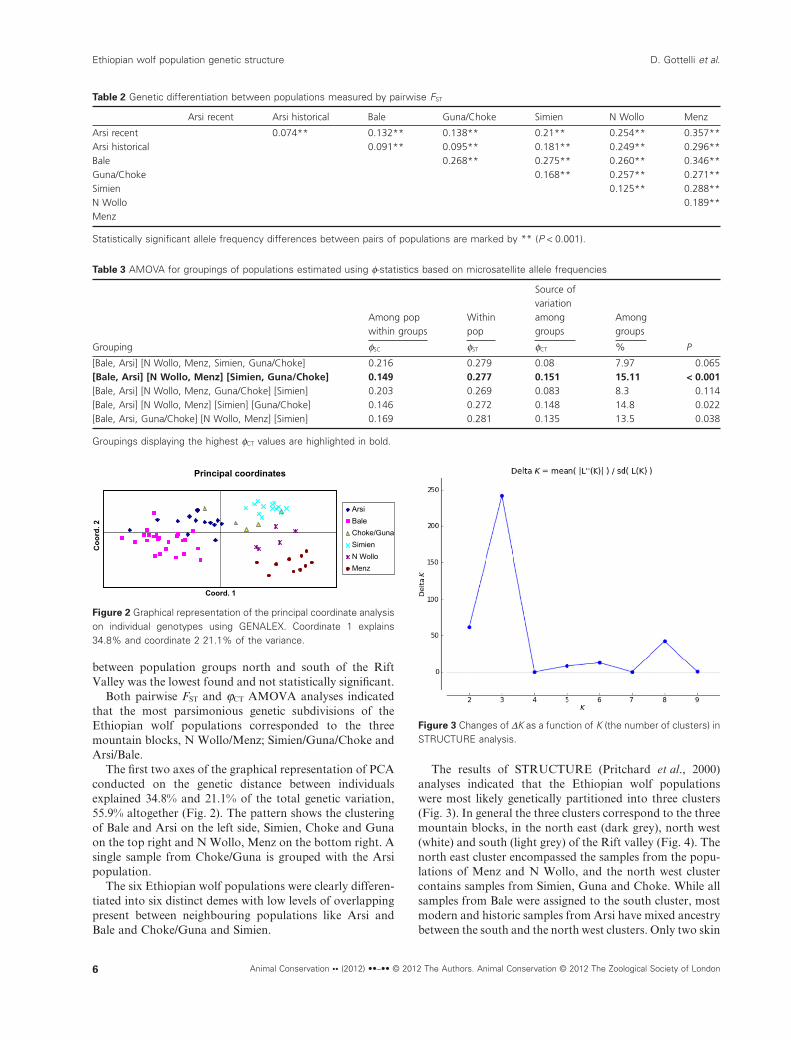
The results of STRUCTURE (Pritchard et al., 2000)analyses indicated that the Ethiopian wolf populationswere most likely genetically partitioned into three clusters(Fig. 3). In general the three clusters correspond to the threemountain blocks, in the north east (dark grey), north west(white) and south (light grey) of the Rift valley (Fig. 4). Thenorth east cluster encompassed the samples from the popu-lations of Menz and N Wollo, and the north west clustercontains samples from Simien, Guna and Choke. While allsamples from Bale were assigned to the south cluster, mostmodern and historic samples from Arsi have mixed ancestrybetween the south and the north west clusters. Only two skin
Table 2 Genetic differentiation between populations measured by pairwise FST
Arsi recent Arsi historical Bale Guna/Choke Simien N Wollo Menz
Arsi recent 0.074** 0.132** 0.138** 0.21** 0.254** 0.357**Arsi historical 0.091** 0.095** 0.181** 0.249** 0.296**Bale 0.268** 0.275** 0.260** 0.346**Guna/Choke 0.168** 0.257** 0.271**Simien 0.125** 0.288**N Wollo 0.189**Menz
Statistically significant allele frequency differences between pairs of populations are marked by ** (P < 0.001).
Table 3 AMOVA for groupings of populations estimated using f-statistics based on microsatellite allele frequencies
Grouping
Among popwithin groups
Withinpop
Source ofvariationamonggroups
Amonggroups
PfSC fST fCT %
[Bale, Arsi] [N Wollo, Menz, Simien, Guna/Choke] 0.216 0.279 0.08 7.97 0.065[Bale, Arsi] [N Wollo, Menz] [Simien, Guna/Choke] 0.149 0.277 0.151 15.11 < 0.001[Bale, Arsi] [N Wollo, Menz, Guna/Choke] [Simien] 0.203 0.269 0.083 8.3 0.114[Bale, Arsi] [N Wollo, Menz] [Simien] [Guna/Choke] 0.146 0.272 0.148 14.8 0.022[Bale, Arsi, Guna/Choke] [N Wollo, Menz] [Simien] 0.169 0.281 0.135 13.5 0.038
Groupings displaying the highest fCT values are highlighted in bold.
Principal coordinates
Coord. 1
Co
ord
. 2
Arsi
Bale
Choke/Guna
Simien
N Wollo
Menz
Figure 2 Graphical representation of the principal coordinate analysison individual genotypes using GENALEX. Coordinate 1 explains34.8% and coordinate 2 21.1% of the variance.
Figure 3 Changes of DK as a function of K (the number of clusters) inSTRUCTURE analysis.
Ethiopian wolf population genetic structure D. Gottelli et al.
6 Animal Conservation •• (2012) ••–•• © 2012 The Authors. Animal Conservation © 2012 The Zoological Society of London
tissue samples collected in 1910 have more than 60% ances-try in the south cluster.
Migration rates
Correlations of the posterior probability between two inde-pendent MCMC analyses converged after 3 ¥ 106 iterations(Supporting Information Fig. S1). Most populations appearquite isolated (mean m was 0.056 for Arsi, 0.024 for Bale,0.02 for Guna, 0.0073 for Simien, 0.038 for N Wollo and0.0055 for Menz), only two populations showed evidence ofreceiving immigrants from at least one main source. Themean migration rate from Bale to Arsi was 0.16 (95% CI0.04–0.29) and that from Menz to N Wollo was 0.11 (95%CI 0.05–0.28; Table 4). These populations are found in thesame highland block and relatively close to one another.However, it is important to note that migration ratesbetween these populations are not symmetrical, suggestingthat movement of wolves between these populations takesplace predominantly in one direction.
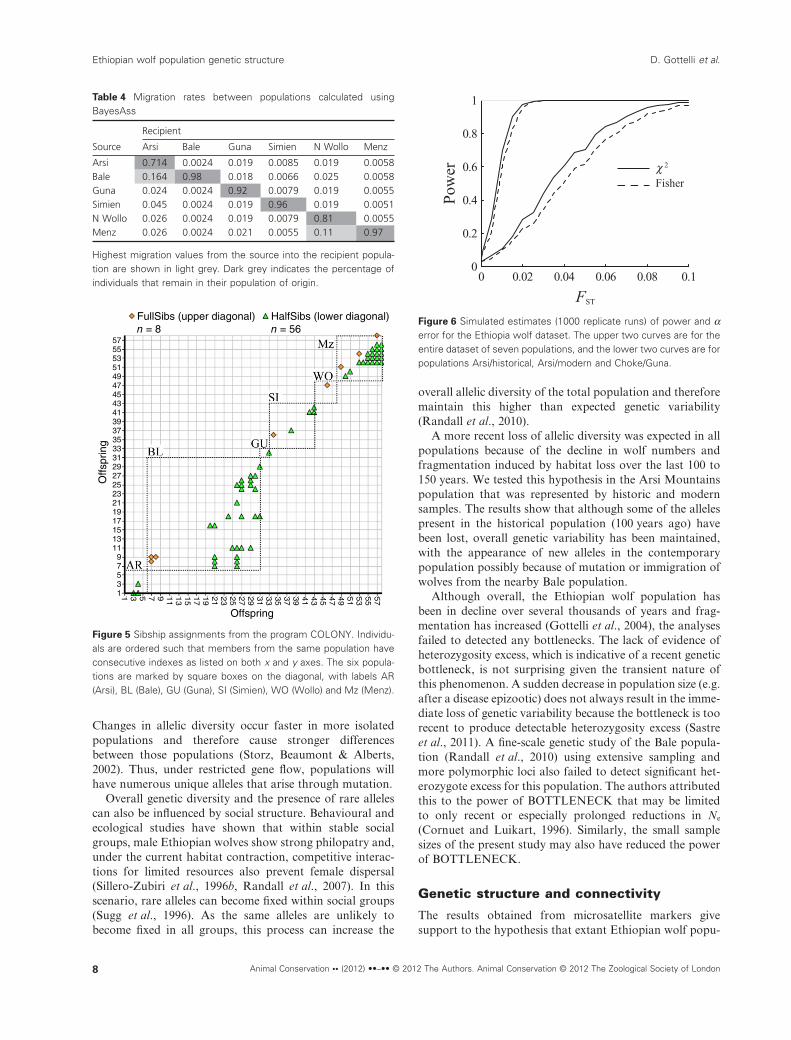
The sibship assignments obtained by COLONY areshown in Fig. 5. Shared sibship between wolves from differ-ent populations will be an indication of migration, while thefrequency of siblings within a population indicates the effec-tive population size and pack structure. In our study, all fulland half sibship assignments are found within populations,suggesting the absence of between-population migration.Overall, there are many more half siblings than full siblings.The population of Menz has a higher sibling frequency thanother populations.
Statistical power
The entire dataset of seven populations has a high statisticalpower with a small type I error rate in detecting differentia-tion, structure and estimating gene flow (Fig. 6). The type Ierror rate is 0.07 and 0.06 for c2 test and Fisher’s exact testrespectively, while the power is close to 1 for both tests when
FST is 0.025, which is much lower than the lowest pairwise FST
(0.074) observed for pairs of populations (Table 2). Even inthe worst scenario of the three populations Arsi/historic,Arsi/modern and Choke/Guna, which have the lowest FST,small sample sizes and a high proportion of missing data, c2
test and Fisher’s exact test still yield a high power of 0.91 and0.85 at FST = 0.07, and a power of 0.96 and 0.92 at FST = 0.08,with a low type I error rate of 0.030 and 0.028. The estimatedvalues of FST are between 0.074 and 0.095 (Table 2), andsuggest that the dataset has sufficient power to delineatepopulation genetic structures, as further verified by thehighly significant FST results listed in Table 2.
Discussion
Genetic diversity
The genetic variation in the Ethiopian wolf population as awhole is relatively high for a species that has declined tofewer than 500 wolves within a short time period. Severalstudies on grey wolf have also found higher than expectedlevels of genetic diversity even in small populations, and thishas been attributed to positive correlations between geneticdiversity and gene flow (Flagstad et al., 2003; Lucchini,Galov & Randi, 2004; Aspi et al., 2009; vonHoldt et al.,2010). In the absence of gene flow, the higher than expectedgenetic diversity found among Ethiopian wolves may beexplained by a relatively stable population structure follow-ing the fragmentation of their habitat at the end of the lastglaciation. Despite fragmentation and reductions in popu-lation size, the species could have maintained overall geneticdiversity, as alleles that might be lost in one populationcould be fixed in another, preserving more variability than asingle population of a similar total size (Wright, 1965). TheSimien Mountains population had the highest number ofunique alleles; this result was not unexpected since geologi-cal reconstructions indicate that this population has beenisolated for the longest period (Gottelli et al., 2004).
North WestSouth North East
0%
10%
20%
30%
40%
50%
60%
70%
80%
90%
100%
1 3 5 7 9 11 13 15 17 19 21 23 25 27 29 31 33 35 37 39 41 43 45 47 49 51 53 55 57 59 61 63 65 67 69 71
Per
centa
ge
mem
ber
ship
elaBisrA Choke/Guna
Simien N Wollo Menz
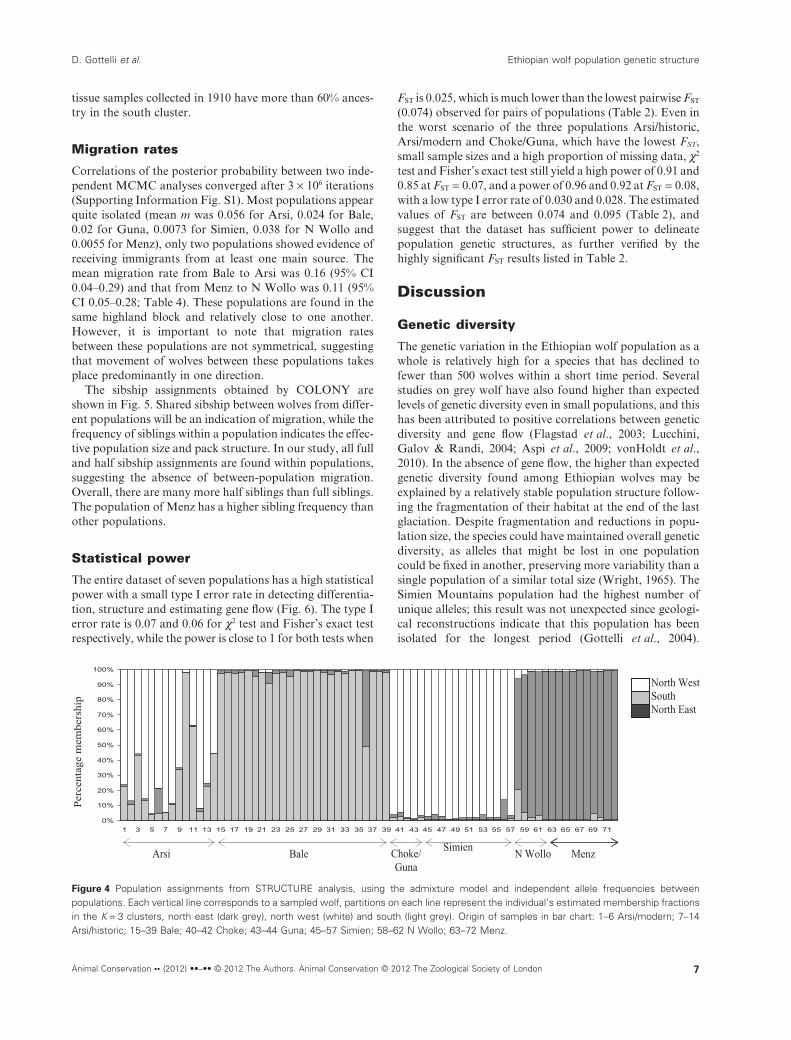
Figure 4 Population assignments from STRUCTURE analysis, using the admixture model and independent allele frequencies betweenpopulations. Each vertical line corresponds to a sampled wolf, partitions on each line represent the individual’s estimated membership fractionsin the K = 3 clusters, north east (dark grey), north west (white) and south (light grey). Origin of samples in bar chart: 1–6 Arsi/modern; 7–14Arsi/historic; 15–39 Bale; 40–42 Choke; 43–44 Guna; 45–57 Simien; 58–62 N Wollo; 63–72 Menz.
D. Gottelli et al. Ethiopian wolf population genetic structure
Animal Conservation •• (2012) ••–•• © 2012 The Authors. Animal Conservation © 2012 The Zoological Society of London 7
Changes in allelic diversity occur faster in more isolatedpopulations and therefore cause stronger differencesbetween those populations (Storz, Beaumont & Alberts,2002). Thus, under restricted gene flow, populations willhave numerous unique alleles that arise through mutation.
Overall genetic diversity and the presence of rare allelescan also be influenced by social structure. Behavioural andecological studies have shown that within stable socialgroups, male Ethiopian wolves show strong philopatry and,under the current habitat contraction, competitive interac-tions for limited resources also prevent female dispersal(Sillero-Zubiri et al., 1996b, Randall et al., 2007). In thisscenario, rare alleles can become fixed within social groups(Sugg et al., 1996). As the same alleles are unlikely tobecome fixed in all groups, this process can increase the
overall allelic diversity of the total population and thereforemaintain this higher than expected genetic variability(Randall et al., 2010).
A more recent loss of allelic diversity was expected in allpopulations because of the decline in wolf numbers andfragmentation induced by habitat loss over the last 100 to150 years. We tested this hypothesis in the Arsi Mountainspopulation that was represented by historic and modernsamples. The results show that although some of the allelespresent in the historical population (100 years ago) havebeen lost, overall genetic variability has been maintained,with the appearance of new alleles in the contemporarypopulation possibly because of mutation or immigration ofwolves from the nearby Bale population.
Although overall, the Ethiopian wolf population hasbeen in decline over several thousands of years and frag-mentation has increased (Gottelli et al., 2004), the analysesfailed to detected any bottlenecks. The lack of evidence ofheterozygosity excess, which is indicative of a recent geneticbottleneck, is not surprising given the transient nature ofthis phenomenon. A sudden decrease in population size (e.g.after a disease epizootic) does not always result in the imme-diate loss of genetic variability because the bottleneck is toorecent to produce detectable heterozygosity excess (Sastreet al., 2011). A fine-scale genetic study of the Bale popula-tion (Randall et al., 2010) using extensive sampling andmore polymorphic loci also failed to detect significant het-erozygote excess for this population. The authors attributedthis to the power of BOTTLENECK that may be limitedto only recent or especially prolonged reductions in Ne
(Cornuet and Luikart, 1996). Similarly, the small samplesizes of the present study may also have reduced the powerof BOTTLENECK.
Genetic structure and connectivity
The results obtained from microsatellite markers givesupport to the hypothesis that extant Ethiopian wolf popu-
Table 4 Migration rates between populations calculated usingBayesAss
Source
Recipient
Arsi Bale Guna Simien N Wollo Menz
Arsi 0.714 0.0024 0.019 0.0085 0.019 0.0058Bale 0.164 0.98 0.018 0.0066 0.025 0.0058Guna 0.024 0.0024 0.92 0.0079 0.019 0.0055Simien 0.045 0.0024 0.019 0.96 0.019 0.0051N Wollo 0.026 0.0024 0.019 0.0079 0.81 0.0055Menz 0.026 0.0024 0.021 0.0055 0.11 0.97
Highest migration values from the source into the recipient popula-tion are shown in light grey. Dark grey indicates the percentage ofindividuals that remain in their population of origin.
FullSibs (upper diagonal)n = 8
HalfSibs (lower diagonal)n = 56
57555351494745434139373533312927252321191715131197531 57555351494745434139373533312927252321191715131197531
Offs
prin
g
Offspring
Figure 5 Sibship assignments from the program COLONY. Individu-als are ordered such that members from the same population haveconsecutive indexes as listed on both x and y axes. The six popula-tions are marked by square boxes on the diagonal, with labels AR(Arsi), BL (Bale), GU (Guna), SI (Simien), WO (Wollo) and Mz (Menz).
0 0.02 0.04 0.06 0.08 0.10
0.2
0.4
0.6
0.8
1
FST
Pow
er c 2
Fisher
Figure 6 Simulated estimates (1000 replicate runs) of power and aerror for the Ethiopia wolf dataset. The upper two curves are for theentire dataset of seven populations, and the lower two curves are forpopulations Arsi/historical, Arsi/modern and Choke/Guna.
Ethiopian wolf population genetic structure D. Gottelli et al.
8 Animal Conservation •• (2012) ••–•• © 2012 The Authors. Animal Conservation © 2012 The Zoological Society of London
lations are clearly genetically differentiated as a result of thehistorical fragmentation of Afroalpine habitats that fol-lowed the end of the last glaciation. Genetic data from bothmtDNA (Gottelli et al., 2004) and nuclear markers suggestthat extant Ethiopian wolf populations are clustered intothree highland blocks with little interconnectivity betweenthem.
The high levels of differentiation between most popula-tions (FST values ranging from 0.115–0.346) indicate limitedgene flow among populations. From a behavioural perspec-tive, this is not surprising because, unlike other more oppor-tunistic canids like grey wolves and red foxes (Carmichaelet al., 2001, Wandeler et al., 2003) Ethiopian wolves exhibitvery high habitat specificity. It is unlikely for Ethiopianwolves to undertake long-distance dispersal because of thehistorical lack of suitable habitats connecting populationsbetween the different mountain ranges. Worryingly, ourdata also suggest that subpopulations within these moun-tain ranges are also highly fragmented (Marino, 2003;Marino et al., 2011) and genetically differentiated. This sug-gests that connecting corridors for dispersal are insufficientto promote gene flow, even between populations in geo-graphic proximity. Consequently, most populations arebecoming increasingly isolated and vulnerable to decreasedpopulation viability and extinction primarily because ofsmall population size, genetic drift and demographicstochasticity.
Nuclear microsatellite differentiation between populationblocks across the Rift Valley did not exceed differentiationbetween population blocks in the north. This would indicatethat the level of genetic differentiation at mitochondrial andnuclear loci does not support the two subspecies classifica-tion that has been previously proposed. De Beaux (1922)and Yalden, Largen & Kock (1980) considered populationsfrom opposite sides of the Rift Valley to be taxonomicallydistinct, describing the northern, Canis simemsis simensis,and the southern, C. s. cisternii, subspecies based on coatcoloration and skull morphology. Given the current levelsof genetic differentiation, Ethiopian wolf population couldbe classified as three separate management units (sensuMoritz, 1995), namely north west, north east and south ofthe Rift valley.
The genetic partition of the Ethiopian wolf populationinto these three clusters was also reflected in the STRUC-TURE analysis. With the exception of the Arsi population,all Ethiopian wolves were assigned to their population oforigin. Most wolves sampled in Arsi were geneticallyassigned to either the south or north west clusters, with noclear pattern between samples collected in recent years or100 years ago. This could be explained by ancestral poly-morphisms, recent migration or could be the effect of poorsampling. The hierarchical genetic structure (mountainblocks, populations and possibly packs) of the samples mayhave also impaired the power of STRUCTURE (Guinandet al., 2006; Anderson & Dunham, 2008).
Estimates of recent migration found relatively higherasymmetric migration rates from Bale to Arsi and fromMenz to N Wollo. Such unidirectional migration rates
suggest a source-sink model of migration, with wolvesmoving from more stable populations (Bale and Menz) intoneighbouring populations with lower population densities(Arsi and N Wollo) (IUCN/SSC Canid Specialist Group,2011). Currently, both populations of Arsi and N Wollosuffer from lower protection than the suggested ‘source’populations, which are protected within the Bale MountainsNational Park and Menz (Guassa) Community Conserva-tion Area. Conservation strategies and availability of high-quality habitat for wolves in Bale and Menz could explainthe capacity of these populations to produce surplusanimals that disperse. In contrast, human–wolf conflict inArsi and N Wollo because of livestock predation, which inthe past has resulted in persecution (Marino, 2003), has hada negative effect on the population growth of the ‘sink’populations. Evidence of unidirectional migration rateswere also found between subpopulations in the Bale Moun-tains, with Ethiopian wolves moving from more stable sub-populations into subpopulations more adversely affected bydisease (Randall et al., 2010). Asymmetric migration rateshave been observed between other wolf (Wilson & Rannala,2003) and coyote populations (Sacks et al., 2005) and immi-gration of grey wolves from high- into low-density popula-tions has been reported between Finland and Russia(vonHoldt et al., 2010). The relatively high immigration rateestimated from Bale to Arsi (0.16, 95% CI 0.04–0.29) seemsto be in conflict with the high differentiation found betweenthe two populations (0.091 and 0.132 for historical andmodern samples, respectively). It is possible that the immi-gration rate is overestimated due to small sample sizes, asindicated by the wide 95% confidence interval whose lowerlimit is only 0.04.
Low migration levels among Ethiopian wolf populationswere also found by the sibship analysis that did not showany evidence of sibship shared between populations.
Potential limitations of the analyses
This study provides critical insights into the genetic struc-turing of Ethiopian wolf populations, urgently needed toinform evolving plans for metapopulation management(Marino et al., 2011). Our results, however, need to begauged against the limitations inherent to studies of elusiveand endangered carnivores, characterized by low samplesizes, and potential lack of statistical power. While samplesherein covered 15% of the global population of Ethiopianwolves, absolute sample sizes are small and sampling errorscoupled with missing data for some combination of loci andpopulations might have affected the analysis results.
In spite of the small sample sizes, however, the powersimulations clearly showed that our dataset has a powerhigher than 0.9 to detect population genetic structures.All pairwise FST values were highly significant (P < 0.001,Table 2). Furthermore, multiple unsupervised populationassignment methods (such as PCA and STRUCTURE),which do not rely on predefined populations based on geo-graphical origin of samples, yield congruent results that arealso compatible with independent information such as geo-
D. Gottelli et al. Ethiopian wolf population genetic structure
Animal Conservation •• (2012) ••–•• © 2012 The Authors. Animal Conservation © 2012 The Zoological Society of London 9
graphic distances. All these suggest that the populationstructure and differentiation of the Ethiopia wolves are bio-logical, and the conclusions reached in the present studyshould be reliable. The high power and significant resultsdespite of small sample sizes of the present study can beexplained by the fact that the populations have been isolatedfor a long time (since the last glaciations) and thus becomehighly differentiated (as found in Table 2). Furthermore, weused 14 relatively highly polymorphic microsatellites thatcould provide sufficient information to compensate forsmall sample sizes.
Small sample sizes and a high proportion of missing dataare often a drawback in conservation genetics studies of rarespecies. They could reduce the precision of the analysisresults (estimates), but should not bias them. For example,we adopted unbiased estimators of expected heterozygosity(Nei & Chesser, 1983) and FST (Weir & Cockerham, 1984)that took into account of sample sizes. Therefore, smallsample sizes may result in an estimate with a large samplingvariance, but should not bias the estimate upwardly ordownwardly. In practice, small sample sizes effectively makeit difficult to detect a biological effect at a given statisticalsignificance level. A larger sample size is required to identifya smaller biological effect at a certain level of statisticalsignificance. However, once an effect is found to be statisti-cally significant, it should be accepted as biological ratherthan sporadic regardless of the sample sizes, simply becausethe statistical test has taken sampling effect (sample size)into account. In most of the analyses conducted and pre-sented in this study, we applied statistical significance testsand conclusions based on these should be valid in spite ofthe small sample sizes.
The assignment of the Arsi population (modern and his-toric) between the south and north west cluster could be theresult of sampling error, a lack of power (or information) orthe hierarchical genetic structure. Since gene flow betweenArsi and the mountain block in the north west is unlikely,given the insular nature of these two areas, even in a histori-cal context, other potential explanations (i.e. limitations ofthe analysis) have to be considered. Accurate unsupervisedpopulation structure analysis requires the presence of stronggenetic divergence among subpopulations, sufficient samplesizes of individuals and markers, as well as the absence of alarge number of closely related individuals in the samples(Anderson & Dunham, 2008; Rodríguez-Ramilo & Wang,2012). In our study, the sample size of individuals is small,which could have affected the power of the analysis. Thepresence of close relatives (e.g. siblings) among individualsin a sample, as revealed by COLONY, could also reduce thepower of STRUCTURE analysis (Anderson & Dunham,2008; Rodríguez-Ramilo & Wang, 2012). Furthermore,when there is a hierarchical population structure, STRUC-TURE tends to detect the uppermost hierarchical level ofstructure (Evanno et al., 2005) and forces the assignment ofindividuals to one of the inferred clusters, as in this caseK = 3. A widely varying assignment probability of some ofthe Arsi samples indicates that these individuals cannot beassigned confidently to any cluster and we could not rule out
the possibility that these individuals are from the sampledpopulation.
A thorough simulation evaluation of the performance ofBayesAss has concluded that it can provide accurate esti-mation of migration rates (m) even when m is fairly high(m = 0.10) if FST is not lower than 0.05 (Faubet, Waples &Gaggiotti, 2007). This scenario is most likely when N is lowas in all Ethiopian wolf populations. Although the high FST
values (>0.10) found in this study seemed to suggest that ourdataset has sufficient power to estimate contemporarymigration rates, the results found should be treated withcaution because of the small sample sizes.
Management implications
In spite of these reservations, the current genetic make-up ofthe species clearly reflect low levels of migration amongEthiopian wolf populations, raising concerns about furtherisolation, a critical conservation issue with implications forpopulation recovery and long-term survival. Isolation couldincrease the risk of inbreeding, which among Ethiopianwolves is already enhanced by the social structure, withstrong male philopatry and kinship within and betweenneighbouring packs (Sillero-Zubiri et al., 1996b, 2004;Randall et al., 2007). Further evidence that populations aresmall and have a pack structure was provided by theCOLONY analysis that found relatively high frequency ofhalf siblings in all of the six populations.
The most persistent threat to the genetic health of Ethio-pian wolf populations is the human-induced degradationof the Ethiopian highlands, likely to accelerate if globalwarming allows agriculture to flourish at higher elevations(Grabherr, Gottfrier & Pauli, 2003). Therefore, most popu-lations are becoming internally fragmented and increasinglyisolated from others, making them vulnerable to extinctionbecause of their small size, which causes genetic stochastic-ity (genetic drift and inbreeding) and demographic stochas-ticity. Restricted gene flow could also result in further loss ofgenetic variability, reducing the species adaptive potentialand affecting the way isolated populations respond to envi-ronmental challenges, such as climate change or exposure tonew pathogens.
Maintaining habitat connectivity and natural dispersaldynamics are essential to ensure the viability of wild carni-vore populations, as shown by recent genetic studies inmaned wolf (Bruzzi et al., 2011), European grey wolf (Sastreet al., 2011; Aspi et al., 2009), North American grey wolf(vonHoldt et al., 2010) and Florida panthers (Hedrick &Fredrickson, 2010). The increasing isolation found amongmost Ethiopian wolf populations is of great conservationconcern and should be addressed as one of the main factorscausing endangerment.
The samples analyzed herein were collected between 20and 12 years ago. Since then, the wolf population of Gunahas gone extinct and dramatic fluctuations in wolf densities,caused by disease transmission by domestic dogs, haveaffected the Bale (Johnson et al., 2010) and Menz popula-tions (Ashenafi et al., 2005). Although all other populations
Ethiopian wolf population genetic structure D. Gottelli et al.
10 Animal Conservation •• (2012) ••–•• © 2012 The Authors. Animal Conservation © 2012 The Zoological Society of London
with the exception of Guna have maintained or recoveredthe original densities (Marino et al., 2011), it is unclear howthese fluctuations could have affected the current geneticdiversity and its distribution among populations. Ourresults characterize the genetic make-up of Ethiopian wolfpopulations of more than 10 years ago and thus should beused with caution in guiding the genetic management ofcurrent wolf populations, which may have been affected bythe recent demographic changes.
If the anthropogenic factors affecting the long-tern viabil-ity of Ethiopian wolves cannot be mitigated, genetic resto-ration should be considered. In view of current criticalpopulation sizes and levels of isolation, especially betweenpopulations within the same mountain range, it may benecessary in the near future to artificially increase popula-tion size and restore gene flow between nearby populations.The introduction of genes from a different population hasenabled the recovery of wild endangered populations ofFlorida panther (Hedrick & Fredrickson, 2010) and Scan-dinavian adder (Madsen et al., 1999). Among canids, astudy of Scandinavian grey wolf (Vila et al., 2003) hasshown that the arrival of just one male immigrant into agenetically depauperate and isolated population led to arapid increase in individual heterozygosity. In the UnitedStates, the translocation of two wolves from Montana toYellowstone, which reproduced successfully in the recipientpopulation, provides further evidence that translocationevents could replace natural migration and generate geneflow between isolated populations at risk of extinction (von-Holdt et al., 2008).
The genetic rescue strategy however is not undisputed asthis often involves the immigration of non-adapted indi-viduals, which may cause outbreeding depression in off-spring when immigrants mate with native individuals. Thegenetic monitoring of artificially restored populations ofthe endangered Florida panther (Puma concolor cougar) andthe Mexican wolf (Canis lupus baylei) provided no evidenceof negative effects, as long as a set of strict restorationrequirements are followed (Hedrick & Fredrickson, 2010).Special considerations should be taken to minimize the risksof negative effects before making the decision to carry outindividual translocations (Allendorf, Hohenlohe & Luikart,2010).
Our findings have important implications for the devel-opment of management plans to ensure the effective conser-vation of one of Africa’s most threatened carnivores and theworld’s rarest canid (IUCN/SSC Canid Specialist Group,2011). The aim of our study was to conduct a genetic surveymeant to provide vital information for assisting the effectivegenetic management of the species. Based on our results andthe historical isolation of the Ethiopian wolf populations(Gottelli et al., 2004), until further studies are carried out, itwould be advisable to translocate individuals or semen (arti-ficial inseminations) between populations within the samemountain blocks. Moving wolves within these three areaswill minimize the risk of genetic depletion and possibleinbreeding depression and limit genetic swamping and dis-ruptions to local adaptations.
On the basis of this study, the Ethiopian Wolf Conserva-tion Programme (http://www.ethiopianwolf.org) is conduct-ing more extensive sampling in the smaller populationsof the Northern Highlands. Increasing sample sizes andmarker information are recommended to elucidate theEthiopian wolf genetic structure to a finer scale.
In any case, for endangered species such as the Ethiopianwolf, the genetic management of the remaining populationscan only take place in conjunction with conservation actionsaimed at mitigating threats from human activities and envi-ronmental stochasticity. Priority should be given to improveand extend the protection of all areas suitable for Ethiopianwolf, especially high-quality patches and narrow ridges ofAfroalpine habitat that act as connecting corridors betweenthese patches. By restoring and maintaining Afroalpinehabitats, we will protect not only the Ethiopian wolves butalso a unique refuge of genetic biodiversity.
AcknowledgementsModern samples were collected by the Ethiopian Wolf Con-servation Programme. The historic samples were providedby the British Museum of Natural History, London, UK,the Powell-Cotton Museum in Kent, UK and the ChicagoField Museum, USA. The research was jointly supported bythe Zoological Society of London, the Born Free Founda-tion, Wildlife Conservation Network and St Louis Zoo.This paper was greatly improved, thanks to the commentsby Bill Jordan, Benjamin Sacks, the editor and severalanonymous referees.
References
Allendorf, F.W., Hohenlohe, P.A. & Luikart, G. (2010).Genomics and the future of conservation genetics. Genet-ics 11, 697–709.
Anderson, E.C. & Dunham, K.K. (2008). The influence offamily groups on inferences made with the programStructure. Mol. Ecol. 8, 1219–1229.
Ashenafi, Z.T., Coulson, T., Sillero-Zubiri, C. & Leader-Williams, N. (2005). Behaviour and ecology of the Ethio-pian wolf (Canis simensis) in a human-dominatedlandscape outside protected areas. Anim. Conserv. 8, 113–121.
Aspi, J., Roininen, M., Kiiskila, J., Ruokonen, M., Kojola,I., Bljudnik, L., Danilov, P., Heikkinen, S. & Pulliainen,E. (2009). Genetic structure of the northwestern Russianwolf populations and gene flow between Russia andFinland. Conserv. Genet. 10, 815–826.
Bruzzi, M.L., Eizirik, E., Garda, A.A., da Fontoura-Rodrigues, M.L., Guimarães Rodrigues, F.H. &Marinho-Filho, J.S. (2011). Conservation genetics ofmaned wolves in a highly impacted area of the BrazilianCerrado biome. Genetica 139, 369–381.
Carmichael, L.E., Nagy, J.A., Larter, N.C. & Strobeck, C.(2001). Prey specialization may influence patterns of geneflow in wolves of the Canadian Northwest. Mol. Ecol. 10,2787–2798.
D. Gottelli et al. Ethiopian wolf population genetic structure
Animal Conservation •• (2012) ••–•• © 2012 The Authors. Animal Conservation © 2012 The Zoological Society of London 11
Cockerham, C.C. & Weir, B.S. (1993). Estimation of geneflow from F-statistics. Evolution 47, 855–863.
Cornuet, J.M. & Luikart, G. (1996). Description and poweranalysis of two tests for detecting recent population bot-tlenecks from allele frequency data. Genetics 144, 2001–2014.
Crandall, K.A., Binida-Edmonds, O.R.P., Mace, G.M. &Wayne, R.K. (2000). Considering evolutionary processesin conservation biology. Trends Ecol. Evol. 15, 290–295.
de Beaux, O. (1922). Mammiferi Abyssini e Somali. Attidella Societ Italiana di Sciencia Naturale da Milano 61,21–34.
Di Rienzo, A., Peterson, A.C. & Garza, J.C. (1994) Muta-tional processes of simple sequence repeat loci in humanpopulations. Proc Natl Acad Sci USA 91, 3166–3170.
Earl, D.A. & vonHoldt, B.M. (2011). STRUCTUREHARVESTER: a website and program for visualizingSTRUCTURE output and implementing the Evannomethod. Cons. Gen. Resour. 2, 359–361.
Evanno, G., Regnaut, S. & Goudet, J. (2005). Detecting thenumber of clusters of individuals using the softwareSTRUCTURE: a simulation study. Mol. Ecol. 14, 2611–2620.
Excoffier, L., Smouse, P.E. & Quattro, J.M. (1992). Analy-sis of molecular variance inferred from metric distancesamong DNA haplotypes: application to humanmitochondrial DNA restriction data. Genetics 131,479–491.
Faubet, P., Waples, R.S. & Gaggiotti, O.E. (2007). Evaluat-ing the performance of a multilocus Bayesian method forthe estimation of migration rates. Mol. Ecol. 16, 1149–1166.
Flagstad, Ø., Walker, C.W., Vila’, C., Sundqvist, A.K.,Fernholm, B., Hufthammer, A.K., Wiig, Ø., Koyola, I.& Ellegren, H. (2003). Two centuries of the Scandinavianwolf population: patterns of genetic variability andmigration during an era of dramatic decline. Mol. Ecol.12, 869–880.
Francisco, L.V.V., Langston, A.A., Mellersh, C.S., Neal,C.L. & Ostrander, E.A. (1996). A class of highly poly-morphic tetranucleotide repeats for canine geneticmapping. Mamm. Genome 7, 359–362.
Garnier-Gere, P. & Dillmann, C. (1992). A computerprogram for testing pairwise linkage disequilibria in sub-divided populations. J. Hered. 83, 239–250.
Gottelli, D., Marino, J., Sillero-Zubiri, C. & Funk, S.(2004). The effect of the last glacial age on speciation andpopulation genetic structure of the endangered Ethiopianwolf (Canis simensis). Mol. Ecol. 13, 2275–2286.
Grabherr, G., Gottfrier, M. & Pauli, H. (2003). High moun-tain environment as indicator of global change. Adv.Glob. Chan. Res. 9, 331–345.
Guinand, B., Scribner, K.T., Page, K.S., Filcek, K., Main,L. & Burnham-Curtis, M.K. (2006). Effects of coancestryon accuracy of individual assignments to populations of
origin: examples using Great Lakes lake trout (Salvelinusnamaycush). Genetica 127, 329–340.
Haydon, D.T., Randall, D.A., Matthews, D., Tallents,L.A., Gravenor, M., Williams, S., Pollinger, J., Cleave-land, S., Woolhouse, M.E., Sillero-Zubiri, C., Marino, J.,Macdonald, D.W. & Laurenson, M. (2006). Low-coverage vaccination strategies for the conservation ofendangered species. Nature 443, 692–695.
Hedrick, P.W. & Fredrickson, R. (2010). Genetic rescueguidelines with examples from Mexican wolves andFlorida panthers. Conservation Genetics 11, 615–626.
Hudson, R.R., Boos, D.D. & Kaplan, N.L. (1992). A statis-tical test for detecting geographic subdivision. Mol. Biol.Evol. 9, 138–151.
IUCN/SSC Canid Specialist Group (2011). Strategic planfor Ethiopian wolf conservation. Oxford: IUCN/SSCCanid Specialist Group.
Johnson, N., Mansfield, K.L., Marston, D.A., Wilson, C.,Goddard, T., Selden, D., Hemson, G., Edea, L., vanKesteren, F., Shiferaw, F., Stewart, A.E., Sillero-Zubiri,C. & Fooks, A.R. (2010). A new outbreak of rabies inrare Ethiopian wolves (Canis simensis). Arch. Virol. 155,1175–1177.
Lucchini, V., Galov, A. & Randi, E. (2004). Evidence ofgenetic distinction and long-term population decline inwolves (Canis lupus) in the Italian Apennines. Mol. Ecol.13, 523–536.
Madsen, T., Shine, R., Olsson, M. & Wittzell, H. (1999).Restoration of an inbred adder population. Nature 402,34–35.
Marino, J. (2003). Critically endangered Ethiopian wolvespersist in small isolated Afroalpine enclaves. Oryx 37,62–71.
Marino, J., Mitchel, R. & Johnson, P.J. (2010). Dietary spe-cialization and climatic-linked variations in extant popu-lations of Ethiopian wolves. Afri. J. Ecol. 48, 517–525.
Marino, J., Stewart, A.E., Gordon, C.H., Gottelli, D.,Tefera, Z., Laurenson, M.K. & Sillero-Zubiri, C. (2011).Status review of the Ethiopian wolf. Strategic plan forEthiopian wolf conservation. Oxford: IUCN/SSC CanidSpecialist Group.
Moritz, C. (1995). Defining ‘evolutionary significant units’for conservation. Trends Ecol. Evol. 9, 373–375.
Navidi, W., Arnheim, N. & Waterman, M.S. (1992). Amultiple-tube approach for accurate genotyping of verysmall DNA samples by using PCR: statistical considera-tions. American Journal of Human Statistics 50,347–359.
Nei, M. (1978). Estimation of average heterozygosity andgenetic distance from a small number of individuals.Genetics 89, 583–590.
Nei, M. & Chesser, R. (1983). Estimation of fixation indicesand gene diversities. Ann. Hum. Genet. 47, 253–259.
Ostrander, E.A., Sprague, G.F. & Rine, J. (1993). Identifi-cation and characterization of dinucleotide repeat (CA)n
Ethiopian wolf population genetic structure D. Gottelli et al.
12 Animal Conservation •• (2012) ••–•• © 2012 The Authors. Animal Conservation © 2012 The Zoological Society of London
markers for genetic mapping in dog. Genomics 16, 207–213.
Peakall, R. & Smouse, P.E. (2006). GENALEX 6: geneticanalysis in Excel. Population genetic software for teach-ing and research. Mol. Ecol. Notes 6, 288–295.
Piry, S., Luikart, G. & Cornuet, J.-M. (1999). BOTTLE-NECK: a computer program for detecting recent reduc-tions in the effective population size using allelefrequency data. J. Hered. 90, 502–503.
Pritchard, J.K., Stephens, M. & Donnelly, P. (2000). Infer-ence of population structure using multilocus genotypedata. Genetics 155, 945–959.
Randall, D.A., Pollinger, J.P., Kifle, A., Macdonald, D.W.,Wayne, R.K. (2010). Fine scale genetic structure inEthiopian wolves imposed by sociality, migration andpopulation bottlenecks. Conserv. Genet. 11, 89–101.
Randall, D.A., Pollinger, J.P., Wayne, R.K., Tallents, L.A.,Johnson, J.P. & Macdonald, D.W. (2007). Inbreeding isreduced by female-biased dispersal and mating behaviorin Ethiopian wolves. Behav. Ecol. 18, 579–589.
Randall, D.A., Williams, S.D., Kuzmin, I.V., Rupprecht,C.E., Tallents, L.A., Tefera, Z., Argaw, K., Shiferaw, F.,Knobel, D.L., Sillero-Zubiri, C. & Laurenson, M.K.(2004). Rabies in endangered Ethiopian wolves. Emerg.Infect. Dis. 10, 2214–2217.
Raymond, M. & Rousset, F. (1995). Genepop (version-1.2)– population-genetics software for exact tests and ecu-menicism. J. Hered. 86, 248–249.
Reed, D.H. & Frankham R. (2003). Correlation betweenfitness and genetic diversity. Conserv. Biol. 17, 230–237.
Rice, W.R. (1989). Analyzing tables of statistical tests. Evo-lution 43, 223–225.
Rodríguez-Ramilo, S.T. & Wang, J. (2012). The effect ofclose relatives on unsupervised Bayesian clustering algo-rithms in population genetic structure analysis. Mol.Ecol. Resour. 12, 873–884.
Ryman, N. & Palm, S. (2006). POWSIM: a computerprogram for assessing statistical power when testing forgenetic differentiation. Mol. Ecol. Resour. 6, 600–602.
Sacks, B.N., Mitchell, B.R., Williams, C.L. & Ernest, H.B.(2005). Coyote movements and social structure along acryptic population genetic subdivision. Mol. Ecol. 14,1241–1249.
Sastre, N., Vila, C., Salinas, M., Bologov, V.V., Urios, V.,Sanchez, A., Francino, O. & Ramirez, O. (2011). Signa-tures of demographic bottlenecks in European wolfPopulations. Conserv. Genet. 12, 701–712.
Schneider, S., Kueffen, J.M., Roessli, D. & Excoffier, L.(1997). ARLEQUIN, version 1.1. A software for popula-tion genetic data analysis. Geneva: Genetics and BiometryLaboratory, University of Geneva.
Shibuya, H., Collins, B.K., Huang, T.H.M. & Johnson,G.S. (1994). A polymorphic (AGGAAT)n tandem repeatin an intron of the canine von Willebrand factor gene.Anim. Genet. 25, 122–126.
Sillero-Zubiri, C., Gottelli, D. & Macdonald, D.W. (1996a).Male philopatry, extra pack copulations and inbreedingavoidance in Ethiopian wolves. Behav. Ecol. Sociob. 38,331–340.
Sillero-Zubiri, C., King, A.A. & Macdonald, D.W. (1996b).Rabies and mortality in Ethiopian wolves (Canis simen-sis). J. Wildl. Dis. 32, 80–86.
Sillero-Zubiri, C. & Marino, J. (2004). Ethiopian wolf. InCanids: foxes, wolves, jackals and dogs. Status survey andconservation action plan. 2nd edn. 167–174. Sillero-Zubiri,C., Hoffmann, M. & Macdonald, D.W. (Eds). Gland,Cambridge: IUCN.
Sillero-Zubiri, C., Marino, J., Gottelli, D. & Macdonald,D.W. (2004). Afroalpine ecology, solitary foraging andintense sociality amongst Ethiopian wolves. In Canidbiology and conservation, Chapter 20, 311–322. Macdon-ald, D.W. & Sillero-Zubiri, C. (Eds). Oxford: OxfordUniversity Press.
Storz, J.F., Beaumont, M.A. & Alberts, S. (2002). Geneticevidence for long-term population decline in a savannah-dwelling primate: inferences from a hierarchical Bayesianmodel. Mol. Biol. Evol. 19, 1981–1990.
Sugg, D.W., Chesser, R.K., Dobson, F.S. & Hoogland, J.L.(1996). Population genetics meets behavioural ecology.Trends Ecol. Evol. 11, 338–342.
Taberlet, P., Griffin, S., Goossens, B., Questiau, S.,Manceau, V. & Bouvet, J. (1996). Reliable genotyping ofsamples with very low DNA quantities using PCR.Nucleic Acids Res. 24, 3189–3194.
Tallmon, D.A., Luikart, G. & Waples, R.S. (2004). Thealluring simplicity and complex reality of genetic rescue.Trends Ecol. Evol. 19, 489–496.
Vila, C., Sundqvist, A.K., Flagstad, Q., Seddon, J., Bjorner-feldt, S., Kojola, L., Casulli, A., Sand, H., Wabakken, P.& Ellegren, H. (2003). Rescue of a severely bottleneckedwolf (Canis lupus) population by a single immigrant.Proc. Biol. Sci. 270, 91–97.
vonHoldt, B.M., Stahler, D.R., Bangs, E.E., Smith, D.W.,Jimenez, M.D., Mack, C.M., Niemeyer, C.C., Pollinger,J.P. & Wayne, R.K. (2010). A novel assessment of popu-lation structure and gene flow in grey wolf populations ofthe Northern Rocky Mountains of the United States.Mol. Ecol. 19, 4412–4427.
Wandeler, P., Funk, S.M., Largiadèr, C.R., Gloor, S. &Breitenmoser, U. (2003). The city-fox phenomenon:genetic consequences of a recent colonization of urbanhabitat. Mol. Ecol. 12, 647–656.
Wang, J. (2004). Sibship reconstruction from genetic datawith typing errors. Genetics 166, 1963–1979. (doi:10.1534/genetics.166.4.1963).
Wang, J. & Santure, A.W. (2009). Parentage and sibshipinference from multilocus genotype data underpolygamy. Genetics 181, 1579–1594.
Waples, R.S. & Gaggiotti, O. (2006). What is a population?An empirical evaluation of some genetic methods for
D. Gottelli et al. Ethiopian wolf population genetic structure
Animal Conservation •• (2012) ••–•• © 2012 The Authors. Animal Conservation © 2012 The Zoological Society of London 13
identifying the number of gene pools and their degree ofconnectivity. Mol. Ecol. 15, 1365–1419.
Wayne, R.K., Geffen, E. & Vila, C. (2004). Population andconservation genetics of canids. In Canid biology andconservation: Chapter 3, 55–84. Macdonald, D.W. &Sillero-Zubiri, C. (Eds). Oxford: Oxford UniversityPress.
Weir, B.S. & Cockerham, C.C. (1984). EstimatingF-statistics for the analysis of population structure. Evo-lution 38, 1358–1370.
Wilson, G.A. & Rannala, B. (2003). Bayesian inference ofrecent migration rates using multilocus genotypes. Genet-ics 163, 1177–1191.
Wright, S. (1965). The interpretation of population struc-ture by F-statistics with special regard to systems ofmating. Evolution 19, 395–420.
Yalden, D.W., Largen, M.J. & Kock, D. (1980). Catalogueof the mammals of Ethiopia. 4. Carnivora. Mon. Zool.Ital. 13, 169–272.
Supporting informationAdditional Supporting Information may be found in theonline version of this article:
Figure S1. Correlation of the posterior probability betweentwo independent MCMC analyses using BayesAss. Analysissettings were 3 million iterations plus 1 million burnin itera-tions, sample freq 2000 and Delta of 0.15. Only modernsamples were included in the analysis.
Please note: Wiley-Blackwell are not responsible for thecontent or functionality of any supporting materials sup-plied by the authors. Any queries (other than missing mate-rial) should be directed to the corresponding author for thearticle.
Ethiopian wolf population genetic structure D. Gottelli et al.
14 Animal Conservation •• (2012) ••–•• © 2012 The Authors. Animal Conservation © 2012 The Zoological Society of London


