
University of Nebraska - Lincoln University of Nebraska - Lincoln
DigitalCommons@University of Nebraska - Lincoln DigitalCommons@University of Nebraska - Lincoln
Sociology Theses, Dissertations, & Student Research Sociology, Department of
2010
Gender and Race Differences in Job Satisfaction and Gender and Race Differences in Job Satisfaction and
Commitment among STEM Faculty: The Influence of Network Commitment among STEM Faculty: The Influence of Network
Integration and Work-Family Balance Integration and Work-Family Balance
Megumi Watanabe University of Nebraska-Lincoln, [email protected]
Follow this and additional works at: https://digitalcommons.unl.edu/sociologydiss
Part of the Sociology Commons
Watanabe, Megumi, "Gender and Race Differences in Job Satisfaction and Commitment among STEM Faculty: The Influence of Network Integration and Work-Family Balance" (2010). Sociology Theses, Dissertations, & Student Research. 4. https://digitalcommons.unl.edu/sociologydiss/4
This Article is brought to you for free and open access by the Sociology, Department of at DigitalCommons@University of Nebraska - Lincoln. It has been accepted for inclusion in Sociology Theses, Dissertations, & Student Research by an authorized administrator of DigitalCommons@University of Nebraska - Lincoln.

GENDER AND RACE DIFFERENCES IN JOB SATISFACTION AND
COMMITMENT AMONG STEM FACULTY: THE INFLUENCE OF NETWORK
INTEGRATION AND WORK-FAMILY BALANCE
by
Megumi Watanabe
A THESIS
Presented to the Faculty of
The Graduate College at the University of Nebraska
In Partial Fulfillment of Requirements
For the Degree of Master of Arts
Major: Sociology
Under the Supervision of Professors Christina D. Falci and Kristen M. Olson
Lincoln, Nebraska
May, 2010
GENDER AND RACE DIFFERENCES IN JOB SATISFACTION AND
COMMITMENT AMONG STEM FACULTY: THE INFLUENCE OF NETWORK
INTEGRATION AND WORK-FAMILY BALANCE
Megumi Watanabe, M.A.
University of Nebraska, 2010
Advisors: Christina D. Falci and Kristen M. Olson
Using data on 137 Science, Technology, Engineering, and Mathematics (STEM)
faculty working at a research intensive Midwestern University, this study explores
whether gender and race variation in network (connections to other faculty within one’s
primary department) and work-life (family-friendly work climate and satisfaction with
work-life balance) integration can explain gender and race variation in job satisfaction
and organizational commitment. Results indicate that job satisfaction did not significantly
vary by gender or race. Women, however, were less likely to say they intend to remain at
their current institution. Compared to men, women had lower levels of integration in the
departmental friendship network, worked at the University for a shorter period of time,
and were more likely to be unmarried. Size of friendship networks and years at the
institution were positively correlated with organizational commitment while being
unmarried was negatively correlated with organizational commitment. Thus, these three
factors explained the gender differences in organizational commitment. Network
integration in research networks and work-life integration did not predict organizational
commitment and did not vary by gender. The significant differences in organizational

commitment between white and nonwhite faculty remain unexplained as network and
work-life integration did not vary by race.

1
Introduction
Historically, women faculty and faculty of racial minority groups have been
underrepresented in the fields of Science and Engineering (National Science Foundation
[NSF], 2006, 2008). According to the reports by National Science Foundation (NSF)
(2006, 2008), however, women and minorities’ share of doctoral degrees and faculty
positions has been increasing over time. In 2006, women earned 40.2% of Science and
Engineering doctoral degrees, and they constituted 42% of full-time tenured or tenure-
track faculty with relatively recent doctorates (those who received Ph.D. within 7 years)1
(NSF, 2008). In terms of race, Asians, Blacks, Hispanics, and American Indians earned
35% of all Science and Engineering doctoral degrees as a group in 2003. Among the
recently employed faculty (those who received Ph.D. in 2000 or later), 28% were
minorities as of 2003 (NSF, 2006).
The rising inflow of women and minorities into Science and Engineering might
give the impression that time could solve their underrepresentation. Unfortunately,
however, the recent increase in their proportions at the assistant professor level does not
necessarily improve their representation at the full professor level. This is because
successful recruiting of under-represented faculty will not diversify faculty if the
institution fails to retain these new hires. Recruiting will not matter if under-represented
1 It is important to note that NSF defines “Science and Engineering” as Physical,
Mathematical, Computer, Environmental, Life, Engineering, Psychological and Social Sciences (Fox, 2001). Compared to the other fields, women’s representation is higher in Psychology (71.3% of doctorate degree recipients and 46.2% of all tenured or tenure-track faculty in 2006) and in Social Sciences (45.7% of doctorate degree recipients and 33.9% of all tenured or tenure-track faculty in 2006) (NSF, 2008). Therefore, the proportion of women doctoral degree holders and faculty would have been smaller if the two fields had been excluded from the calculation.

2
faculty leak out of the pipeline at the stages of the tenure and promotion stage of their
career. Thus, in addition to recruitment, we need to consider retention a crucial aspect in
increasing faculty diversity. Furthermore, this study places value on faculty retention
because it costs time and money to replace faculty (especially faculty from an under-
represented group) when somebody leaves the position (Moody, 2004). Considering the
cost of losing underrepresented faculty after recruitment efforts, furthering the
understanding of faculty retention would be of great interest and value for administrators
within academic institutions.
This study pays particular attention to the influence of academic climate
perceptions to explore the mechanisms of faculty retention in Science and Engineering. It
is important to know in general how academic climate can promote faculty retention in
addition to understanding gender and race variations in retention. Given that under-
represented faculty are likely to report feelings of isolation (MIT Report, 1999; Smith &
Calasanti, 2005) and that work-family conflict is a prevalent problem in academia
(Jacobs & Winslow, 2004; Mason & Goulden, 2002, 2004; Monosson, 2008), I focus on
two key academic climate perceptions (network integration and work-family balance) and
examine their influence on job satisfaction and organizational commitment. Job
satisfaction and organizational commitment are treated as proxy indicators for faculty
retention in this paper. A detailed discussion on these indicators is in the later section.
In an attempt to understand retention of under-represented faculty, this study takes
a two-step approach. First, I explore gender and race variation in academic climate
perceptions (network integration and work-family balance) as well as variation in job
satisfaction and organizational commitment. Secondly, I explore whether gender and race

3
variation in academic climate perceptions can explain gender and race variation in job
satisfaction and organizational commitment, if any. In other words, I investigate if gender
and race variation in job satisfaction and organizational commitment is mediated by
academic climate perceptions.
For several reasons, this study advances past research. First, it explores the
mechanism of retention focusing on academia, which has unique organizational
structures and may have different turnover patterns compared to business organizations.
The second advantage of this study is that it measures isolation from a network
perspective (the number of connections in the research exchange network and the
friendship network within the department). A handful of previous research reported that
there is perceived isolation among women and minority faculty (Cornell University
Provost’s Advisory Committee on Faculty Work Life [CUPACFWL], 2006; MIT, 1999;
Monroe, Ozyurt, Wrigley, & Alexander, 2008; Ross & Gatta, 2009: Smith & Calasanti,
2005; Yen, Quinn, Carrigan, Litzler, & Riskin, 2007). Therefore, the unique use of the
network perspective will contribute to a better understanding of isolation in academia.
Finally, this study explores how the level of network integration is related to job
satisfaction and organizational commitment. This relationship has been studied in non-
academic organizations (Ibarra & Andrews, 1993; Roberts & O’Reilly, 1979) but not in
academic settings.
To start with, I will define the terms job satisfaction and organizational
commitment and explore gender and race variation in these concepts. Then I will discuss
work climate perceptions (network integration and work-family balance) in academic and
non-academic environments focusing on gender and race variation. At the end of each

4
section on network integration and work-family balance, I will explore how they are
related to job satisfaction and organizational commitment.
1. Job Satisfaction and Organizational Commitment
Faculty retention is difficult to directly study because faculty turnover takes place
over a long period of time. Therefore, this research explores two proxy indicators for
faculty retention: job satisfaction and organizational commitment. Job satisfaction is
defined as an affective reaction to the roles that workers play at workplace (Kalleberg,
1977). On the other hand, organizational commitment is defined as workers’ response to
more general conditions, such as organizational context (Ibarra & Andrews, 1993). More
specifically, this study conceptualizes organizational commitment as an intention to
remain at the organization under the assumption that changing one’s job could be a
negative response to overall organizational conditions.
It is important to consider job satisfaction and organizational commitment as
distinct concepts for two reasons. First, job satisfaction and organization commitment are
different reactions to work environments. As their definitions in the previous paragraph
showed, job satisfaction is a reaction to one’s work itself while organizational
commitment is a reaction to the organizational contexts (Ibarra & Andrews, 1993;
Kalleberg, 1977). Simply put, job satisfaction and organizational commitment are
specific (former) and general perceptions (latter) of the workplace.
Second, job satisfaction and organization commitment are related to retention at
different levels. It is possible that workers keep working for the same organization
because they like their roles at the workplace (i.e., they have high job satisfaction).

5
However, it is also possible that workers keep the job even though they are not satisfied
with the work itself (i.e., they have low job satisfaction). There are many potential
reasons why dissatisfied workers are not always likely to leave the organization. For
example, close relationships with colleagues, good compensations (e.g., salary, benefits),
and lack of alternative jobs might stop them from leaving. Unlike job satisfaction,
however, organizational commitment (i.e., intention to remain at the organization) is
strongly related to retention (Mobley, Horner, & Hollingsworth, 1978). Because
intentions often cause subsequent behavior, information on workers’ intentions to remain
or leave the organization helps predict the actual act of leaving (Callister, 2006). Thus,
based on the previous studies’ argument that job satisfaction and organizational
commitment are distinct reactions to the workplace (Ibarra & Andrews, 1993; Kalleberg,
1977) and that they predict retention at the different levels (Callister, 2006; Mobley et al.,
1978), this study explores the two concepts simultaneously.
Gender and Race
Several studies examined gender and race variation in job satisfaction and
organizational commitment among faculty. However, they offer mixed findings. In terms
of job satisfaction, some researchers argue that women tend to have lower job satisfaction
than men (Bilimoria, Perry, Liang, Stoller, Higgins, & Taylor, 2006; Callister, 2006;
CUPACFWL, 2006; Rosser, 2004) while others argue that men and women are equally
satisfied (Sabharwal & Corley, 2009).
Two previous studies explored differences in job satisfaction among faculty
across race. Sabharwal and Corley (2009) found that Asians were more dissatisfied than
Whites, but African Americans were equally or more satisfied than Whites. A study at
6
Cornell University (CUPACFWL, 2006) found that faculty job satisfaction did not
significantly vary by race. In sum, the previous studies provide inconsistent findings
whether job satisfaction varies by gender and race, and it is worthwhile to investigate
gender and race variation further.
Less research has focused on organizational commitment. For example, I only
found one study which explored race variation in organizational commitment. Rosser
(2004) found that minority faculty as a group had lower organizational commitment than
White faculty. The few studies on gender differences in organizational commitment have
also produced inconsistent findings. One study found no significant gender variation (Xu,
2008). There are also two studies in contrast that found women’s tendency to have lower
organizational commitment than men (Callister, 2006) and men’s tendency to lower
organizational commitment than women (Smart, 1990). Smart’s study (1990) showed that
among tenured faculty, women tended to have higher organizational commitment than
men, but among non-tenured faculty, there was no significant gender difference.
As identified above, there are mixed findings on gender and race variation in job
satisfaction and organizational commitment. However, the majority of the previous
research found that compared to men and Whites, women and minority faculty have
either equal or lower job satisfaction and organizational commitment. Thus, I hypothesize
that among Science and Engineering faculty, women and minorities have lower job
satisfaction and organizational commitment than men and Whites.
This study focuses on academic climate perceptions (network integration and
work-family balance) as potential factors that mediate gender and race differences in
faculty job satisfaction and organizational commitment. The following sections assess

7
gender and race variation in network integration and work-family balance, and then
discuss the association of network integration and work-family balance with job
satisfaction and organizational commitment.
2. Network Integration
Network integration is especially important for faculty in Science and
Engineering. Compared to other disciplines, isolation has a particularly disadvantageous
effect in Science and Engineering because cooperation among researchers (i.e.,
teamwork) is almost a requirement for career success in these fields (Fox, 2001). Besides
opportunities for cooperation, isolation could cause negative consequences. There are
many opportunities to make subjective judgments about faculty in academia (e.g.,
evaluations of colleagues, vitae, and job candidates), and those who are subjects of
negative stereotypes (often women and minorities) tend to be vulnerable to unequal
evaluation and treatment caused by biased interactions (Ross & Gatta, 2009).
Considering the importance of network integration in the fields of Science and
Engineering, this study attempts to further understand its relationship with faculty job
satisfaction and organizational commitment. This section starts with theoretical
explanations for gender and race variation in network integration in the workplace. Then,
I will provide a review of empirical research which (a) has focused on perceptions of
isolation in academic environments or (b) has conducted social network analyses
primarily focusing on non-academic work environments.
Theoretical Explanation

8
There are two major theoretical explanations for gender and race variation in
network integration in the workplace: the human capital perspective and the systematic
barriers perspective. The human capital perspective explains that women and minorities’
human capital (e.g., rank and experience) is generally lower compared to White men, and
this difference makes women and minorities less desirable contacts and consequently
make them isolates (Blau & Ferber, 1987, Miller, 1986, as cited in Ibarra, 1992, p.426).
On the other hand, the systematic barriers perspective explains that organizational
structures (e.g., being a numerical minority, stratification) bias interaction patterns among
workers. Then, these biased interactions amplify differences between minority and
majority groups and maintain unequal network integration levels (Kanter, 1977; Morrison
& Von Glinow, 1990, Fairhurst & Snavely, 1983, as cited in Ibarra, 1992, p.426).
Kanter’s (1977) idea of tokenism is an example of the systematic barriers
perspective. She points out the importance of relative numbers in the workplace.
Numerically rare individuals, such as women in male-dominated workplaces and
minorities in White-dominated workplaces, are considered tokens. Tokens often gather
attention from others in the workplace. Because of their visibility, the differences
between tokens and the dominant group are exaggerated. While tokens become self-
conscious of their numerical minority status, members of the dominant group become
aware of the commonalities within the group by contrasting themselves to the tokens.
Thus, the tokens have a tendency to become outsiders or end up being in isolated
positions.
In sum, the human capital perspective emphasizes individual characteristics while
the systematic barriers perspective emphasizes characteristics at the organizational level.
9
Comparing the effectiveness of these two perspectives is not the purpose of this study.
However, these perspectives imply the complex process that prevents integration of
women and minorities in organizations which have been traditionally dominated by
White men. Next, I will review empirical research.
Perceived Isolation in Academia
In recent years, researchers have paid much attention to isolation of under-
represented faculty in academic work environments; it has been often reported that
women and minorities are likely to experience feelings of isolation (CUPACFWL, 2006;
MIT, 1999; Monroe et al., 2008; Ross & Gatta, 2009: Smith & Calasanti, 2005; Yen et
al., 2007). The study by Smith and Calasanti (2005) explored two indicators of isolation:
institutional isolation and social isolation. The first concept, institutional isolation, is
perceived exclusion “from inner-circles and decision-making” (Smith & Calasanti, 2005,
p.309), and the second concept, social isolation, is perceived exclusion “from supportive
networks” (Smith & Calasanti, 2005, p.310) (e.g., close friendship). Women were more
likely than men to feel socially isolated, but there was no gender difference in
institutional isolation. Compared to Whites, Asians were more likely to feel
institutionally isolated, and African American were more likely to feel socially isolated.
Although it is a prevalent view that under-represented faculty tend to feel isolated,
previous studies on academic settings measured network integration with “perceived”
isolation (CUPACFWL, 2006; MIT, 1999; Monroe et al., 2008; Ross & Gatta, 2009:
Smith & Calasanti, 2005; Yen et al., 2007). For example, it is possible that some faculty
reported feeling integrated at the workplace when they had a strong relationship with
only one other faculty member. At the same time, it is possible that faculty reported

10
feeling isolated even though they engaged in interactions with multiple other faculty
members. Due to their methodologies (e.g., interviews, surveys of work climate
perceptions), how well faculty were actually connected with each other was not shown
very clearly in the previous research. Thus, this study takes a different approach. Instead
of feelings of isolation, I analyze faculty’s interaction patterns within Science and
Engineering departments using the network data which were obtained at a research
intensive Midwestern University. I count the self-reported number of connections within
their departments to compare levels of network integration by gender and race. The use
of actual network ties in measuring integration levels is the uniqueness and strength of
this study.
Social Networks
To my knowledge, no research has examined network ties at an academic
institution. Yet there is plenty of social network literature on non-academic organizations
(e.g., a newspaper publishing company, an advertising firm, state government) (Brass,
1981, 1985; Ibarra, 1992, 1993; Moore, 1988, 1992; Pelgi & Moore, 2004). The network
perspective conceptualizes that an organization consists of interdependent individuals
who interact with each other and form personal networks (Brass, Galaskiewicz, Greve, &
Tsai, 2004). Network researchers analyze interaction patterns and precedence or
consequences of these patterns.
Informal organizational networks are often the focus of research because informal
interactions are related to work outcomes, such as getting a promotion (Brass, 1985;
Moore, 1992). Informal networks are “discretionary patterns of interaction, where the
content of relationships may be work related, social, or a combination of both” (Ibarra,

11
1993, p.58). Such networks can be divided into two categories (instrumental networks
and expressive networks) based on the characteristics of interactions. In instrumental
networks, individuals exchange job-related resources, such as information, advice, and
materials, while friendship and social supports are shared in expressive networks (Ibarra,
1993). In Smith and Calasanti’s study (2005) on the perceptions of isolation among
faculty, for example, interactions in instrumental networks might have influenced the
perceptions of institutional isolation while interactions in friendship networks might have
influenced the perceptions of social isolation.
Overall, the results of social network research provide mixed findings on whether
integration patterns vary by gender in non-academic organizations. It seems that for the
workplaces with a high proportion of women, research found no significant gender
difference or women’s greater informal network integration than men (Brass, 1985;
Ibarra, 1992). In the cases where women’s proportion was low, however, women were
found to be less integrated than men (Moore, 1988, 1992).
For example, Ibarra’s (1992) study on an advertisement firm had a sample in
which women were highly represented (57%), and she found that men and women had
equal network integration levels controlling for individual characteristics (e.g., education,
tenure status, past work), rank, and departments. In addition, Brass’ (1985) sample of
workers at a newspaper publishing company also included a high percentage of women
(46%). His findings showed that women were more integrated in the informal interaction
network than men. Based on this previous research, women might be better at building
informal networks than men. However, it is highly possible that men and women’s
interaction patterns might be influenced by gender composition in the workplace. Even if

12
women are better able to develop informal networks than men, these relationship skills
might be compromised when there are few women in the workplace.
There are two studies that found gender differences in informal network
integration at the male-dominated workplaces. Moore (1988) conducted an international
comparative research among the United States, West Germany, and Australia on elites in
powerful national organizations (e.g., politics, business, news media). Her sample had
only 54 women (4%) out of 1415 respondents, and the results showed that in all
countries, women were less integrated in informal elite networks than men. Another
study by Moore (1992) analyzed informal interaction patterns on state government. This
study had a higher, but still relatively small proportion of women (36% or 36 women out
of 101 respondents). Her results revealed that men were more integrated than women in
the instrumental network and that there was no significant gender difference in the
expressive network. Thus, consistent with systematic barriers perspective women might
be more likely than men to become isolates particularly when they work in male-
dominated workplaces.
Compared to gender variation, race variation in network integration has been less
studied and understood (Miller, Lincoln, & Olson, 1981). Women and minorities tend to
have common characteristics (e.g., numerical minority status, negative stereotypes
regarding competence, lower social status than White men) (Fernandez, 1981, Morrison
& Von Glinow, 1991, O’Leary & Ickovics, 1992, Ridgeway, 1991, as cited in Ibarra,
1993, p.66); therefore, they may have similar levels of isolation within organizations.
Academic Science and Engineering departments are clear examples of instances
where women and minorities are numerically rare. Therefore, I hypothesize that women

13
and minority faculty have lower levels of network integration compared to men and
White faculty, respectively.
Network Integration on Job satisfaction and Organizational Commitment
For several reasons, network integration should have considerable influence on
Science and Engineering faculty’s job satisfaction and organizational commitment. First,
there are previous faculty retention studies that found a major effect of interpersonal
issues, such as relationship with colleagues and chairperson, on decision to leave an
institution (Johnsrud & Heck, 1994; Maiter, 1990; Weiler, 1985). Therefore, it is likely
that networking in the workplace influences faculty’s reactions to the workplace.
Secondly, empirical research on non-academic settings (an advertising firm and
high technology military organizations) has shown the association between network
integration (measured with informal interaction patterns or communication patterns) and
reactions to the work environments (measure with evaluation of the workplace or job
satisfaction and organizational commitment) (Ibarra & Andrews, 1993; Roberts &
O’Reilly, 1979). For academic settings, research has identified that perceived network
integration is positively related to job satisfaction (Bilimoria, et al, 2006; CUPACFWL,
2006; Settles, Cortina, Stewart, & Malley, 2007) and organizational commitment (Smith
& Calasanti, 2005).
Putting the previous studies on academic and non-academic settings together, it is
likely that network integration is positively related to job satisfaction and organizational
commitment. In fact, network researchers generally emphasize the benefits from social
networks in workplace (Burt, 1998; Lin, 1999; Palgi & Moore, 2004). Therefore, I

14
predict that more integrated faculty will have higher job satisfaction and organizational
commitment than less integrated faculty.
Although I expect a positive influence of network integration, some researchers
argue that individuals can face negative consequences of networks (Brass et al., 2004;
Labianca & Brass, 2006). According to Labianca and Brass (2006), for example, negative
relationships could cause social liabilities. Taking into account the potential negative
consequences of network integration, this study also explores the influence of over-
integration. That is, instead of simply assuming positive linear relationships of network
integration with job satisfaction and organizational commitment, I test curvilinear
relationships of network integration with job satisfaction and organizational commitment.
3. Work-Family Balance
In this section, I discuss the other potential mediator in gender and race variation
in job satisfaction and organizational commitment: work-family balance. Work-family
conflict has been recognized as a prevalent problem in academia (Mason & Goulden,
2002, 2004; O’Laughlin & Bischoff, 2005). Balancing work and family life is a common
concern among faculty of all disciplines (UC Faculty Family Friendly Edge [UCFFFE],
2005), but faculty in Science and Engineering are especially likely to struggle with
tension between work and family because of the particular characteristics of the fields,
such as competitiveness, long working hours, and necessity of traveling (Mason &
Ekman, 2007; Monroe et al., 2008). Therefore, there is a strong possibility that work-
family balance has an influence on faculty’s job satisfaction and organizational
commitment. When I use the term work-family balance, it represents the general

15
experience of balancing work and family life and the experience of conflict between the
two spheres. In the following paragraphs, I will review the literature on work-family
balance in both academic and non-academic environments, and then explain why I expect
that gender and race variation in work-family balance among Science and Engineering
faculty exists.
Work-Family Balance
Work-family conflict is commonly experienced in academia (Mason & Goulden,
2002, 2004; O’Laughlin & Bischoff, 2005). According to the research by Jacobs and
Gerson (2004), among workers in various occupations, highly educated men and women
who have technical, managerial, or professional positions have a tendency to work for the
longest hours and experience the biggest gap between their ideal work hours and the
actual work hours. Considering that university professors tend to work for longer hours
per week compared to other professionals (Jacobs & Winslow, 2004), it is particularly
worthwhile to study work-family balance in academic environments.
In addition, there are reasons why faculty’s work-family balance should be taken
seriously. For example, Mason and Goulden’s studies (2002, 2004) showed a strong
interconnected relationship between family and academic careers. They point out that
family factors influence job outcomes (e.g., success in earning tenure) while academic
careers influence family outcomes (e.g., delay/forgo marriage and child bearing).
Work-family balance is a serious concern outside of academia as well, and there
are many previous studies on work-family conflict in non-academic settings (e.g.,
Hochschild, 1989; Jacobs & Gerson, 2004). Some scholars have argued that the
contradiction between the norms of an ideal worker and a good mother/parent makes it
16
hard to combine work and family (Blair-Loy, 2003: Garey, 1999; Glass, 2000; Hays,
1996; Jacobs & Gerson, 2004; Williams, 2000). Based on the norm of an ideal worker,
both men and women workers are expected to be highly committed to career in terms of
time and emotion, and yet, the norm of motherhood/parenthood requires the same level of
exceedingly high commitment to children (Blair-Loy, 2003; Hays, 1996). Thus, literature
generally suggests that the expectation for heavy involvement in both career and
parenting leads to work-family conflict.
The concept of role spillover is often used in work-family balance literature
(Glass & Estes, 1997; Jacobs & Gerson, 2004; Keene & Quadagno, 2004). There are two
types of role spillover: work to family spillover and family to work spillover. Work to
family spillover “affects the family by impairing both individual and family functioning”
(Glass & Estes, 1997, p.294), while family to work spillover “often takes the form of
lower productivity, higher absenteeism, and greater turn over” (Glass & Estes, 1997,
p.294). Either way, experience of role spillover could be detrimental to work-family
balance.
The idea of role spillover resembles Mason and Goulden’s (2002, 2004) argument
over the interconnectedness between family and academic careers. In fact, previous
studies have shown that faculty members struggle managing role spillover (Drago,
Colbeck, Stauffer, Pirretti, Burkum, Fazioli, Lazarro, & Habasevich, 2006; O’Laughlin &
Bischoff, 2005). As is the case in non-academic settings, it appears that the
incompatibility between the norms of an ideal worker (i.e., an ideal faculty member) and
a mother/caregiver is present in academic settings.
Gender, Race, and Work-Family Balance

17
I hypothesize that women and minority faculty might have more work-family
conflict. In other words, work-family balance is lower for women and minorities than for
men and White faculty. I developed this hypothesis considering the influence of women
and minority faculty’s status as tokens. As described before, numerically rare individuals
are highly visible in the workplace, and they tend to be self-conscious of their difference
from the majority group (Kanter, 1977). In the case of under-represented faculty,
therefore, they might try extra hard to be accepted by their colleagues. In other words,
they might keenly feel the necessity of following the norm of an ideal worker to be
recognized as a good faculty member. Such pressure might trigger heavy involvement in
work life, which can lead to work to family spillover.
Work-Family Balance, Job Satisfaction and Organizational Commitment
There are reasons why we should expect the influence of work-family balance on
job satisfaction and organizational commitment. In the case of academia, research has
identified the associations of work-family balance and job satisfaction and organizational
commitment among faculty (CUPACFWL, 2006; UCFFFE, 2005). The influence of
satisfaction with personal life on job satisfaction is observed among faculty at Cornell
University (CUPACFWL, 2006). Also, a study with faculty in the University of
California system showed that following low salary, family/geographic considerations
were the second most common reason why both men and women faculty changed jobs
(UCFFFE, 2005).
In addition, scholars who advocate the change toward family-friendly work
environments often mention the negative influence of work-family conflict on job
satisfaction and organizational commitment (Glass & Estes, 1997; Richman, Civian,

18
Shannon, Hill & Brennan, 2008). For example, Glass and Estes (1997) emphasize the
necessity of family-friendly workplace because work-family conflict could lead to
turnover. More specifically, they argue that employees who suffer role spillover might
change jobs for better conditions to accommodate family demands.
In sum, this review of the literature suggests that work-family balance should
affect job satisfaction and organizational commitment. Therefore, I expect that Science
and Engineering faculty who perceive higher levels of work-family balance have higher
job satisfaction and organizational commitment than faculty who perceive lower levels of
work-family balance.
The Current Study
Figure 1 presents my conceptual model. Based on the literature, I hypothesize that
women and nonwhite faculty have lower job satisfaction and organizational commitment
than men and White faculty, respectively (H1). Women and nonwhite faculty will also
have lower network integration and worse work-family balance (H2a and H3a). Network
integration and work-family balance will have a positive association with job satisfaction
and organizational commitment (H2b and H3b). Thus, I expect that gender and race
differences in job satisfaction and organizational commitment should disappear upon
controlling for network integration and work-family balance.
(Figure 1 about here)
Additional Factors
When studying network integration and work-family balance among faculty, it is
necessary to take into account the influence of individual characteristics other than
19
gender and race. First of all, the recent increase in the proportions of women and
minorities in Science and Engineering (NSF, 2006, 2008) means that under-represented
faculty are likely to be new at the institution. That is, they might be less integrated
because they have had fewer interaction opportunities compared to those who have been
around longer. It is also possible that the longer faculty have worked at the institution, the
better they have become at combining work and family life. This is because accumulation
of experience might help them improve time management skills.
Secondly, interaction opportunities might be limited by family factors. For
example, faculty have a strong tendency to marry partners who are also faculty (13% of
men faculty’s partners and 18% of women faculty’s partners) or who have professional or
managerial jobs (71% of men faculty’s partners and 70% of women faculty’s partners)
(Jacobs & Winslow, 2004). Considering that partners’ work demands could possibly
increase faculty’s share of family responsibility, faculty whose partner works full-time
might have less time to interact with colleagues or have higher tendency to experience
work-family conflict compared to those without a partner or those whose partner is not
employed full-time.
Beside employment status of partners, whether or not faculty have children could
influence their socialization patterns and work-family balance. For example, those who
have children might not have enough time to have non-work related interactions with
colleagues (e.g., eating out together, sharing recreational activities). On the other hand, it
is also possible that presence of children might increase interaction opportunities among
faculty who have children (e.g., exchange advice and support with childcare, attending

20
birthday parties). Thus, this study controls for years working at the institution, presence
of a partner and partner’s employment status, and presence of children.
Methods Data Collection
The COACHE Job Satisfaction Survey and the Faculty Network Survey were
conducted at a research intensive Midwestern University in the spring of 2008. Both
surveys were administered to faculty in Science, Technology, Engineering, and
Mathematics (STEM) departments via the web. The COACHE Survey asked faculty to
assess their experiences regarding the academic climate within their primary departments.
The Network Survey asked faculty to identify connections among faculty within and
outside of their primary department. Some demographic information (years working at
the institution, presence of a partner / partner’s employment status, number of children)
was obtained through the COACHE Survey while the other key demographic information
(gender, race) was obtained from the Office of Institutional Research and Planning (IRP),
which manages information on the university’s students, faculty and staff.
Sample
All full-time faculty in 26 STEM department (452 faculty members) were invited
to participate in the COACHE Job Satisfaction Survey and the Faculty Network Survey.
The response rates to the COACHE Survey and the Network Survey were 48% (216) and
68% (307), respectively. Faculty who responded to only one of the two surveys were
excluded from the sample. Many of the concepts of interest in this study contained some
missing data. Cases were lost due to missing data on job satisfaction (n=10),

21
organizational commitment (n=33), departmental research exchange network (n=16),
departmental friendship network (n=42), work-family balance variables (n=24 for family-
friendly work climate scale, and n=13 for satisfaction with work-life balance). Three
faculty members who were planning to retire within five years were excluded from the
analysis because their response to the organization commitment variable was irrelevant to
the interest of this study. After removing faculty with missing data and the retiring
respondents, the final sample included 137 faculty members (30% of the original
population). The sample contained 117 men (102 white and 15 nonwhite) and 20 women
(14 white and six nonwhite). They were 27 assistant professors, 40 associate professors,
and 70 full professors.
Nonresponse to the Network and COACHE Surveys did not meaningfully vary by
gender, race, or rank (See Appendix A). Women faculty were 14% of the original
population, and 15% of the sample. The percentage of nonwhite faculty was 19% in the
original population, and 15% in the sample (the shift was not statistically significant).
Also, proportions of assistant, associate, and full professors were 19%, 30%, and 51% in
the original population, and 20%, 29%, and 51% in the sample, respectively.
Measures and Variables
Job satisfaction. Job satisfaction was measured using a scale which consists of
two items from the COACHE Survey. The survey asked (1) “All things considered, how
satisfied or dissatisfied are you with your department as a place to work?” and (2) “All
things considered, how satisfied or dissatisfied are you with your institution as a place to
work?” Faculty identified their level of satisfaction with a five-point scale (1=very
dissatisfied; 2=dissatisfied; 3=neither satisfied not dissatisfied; 4=satisfied; 5=very

22
satisfied). The mean score on the two items was used for the scale (Cronbach’s alpha:
0.79). If a respondent had a missing value on one of the two scale items, then job
satisfaction was measured using the single valid item.
Organizational commitment. The measure of organizational commitment was
obtained from a question in the COACHE Survey, “Assuming you have or will achieve
tenure, how long do you plan to remain at your institution?” The respondents chose one
category from four answer choices: “I haven’t thought that far ahead”; “For no more than
five years”; “For the foreseeable future”; and “For the rest of my career.” Based on their
answers, the respondents were categorized into two groups: 0= “Not sure or leaving,” and
1= “Staying.” The first category, “not sure or leaving,” is a combination of “I haven’t
thought that far ahead” (n=13) and “For no more than five years” (n=15) and the second
category, “staying,” is a combination of “For the foreseeable future” (n=63) and “For the
rest of my career” (n=46). I collapsed these categories because the number in each
category was too small to conduct valid statistical analysis on the four categories
separately. These numbers became even smaller for gender and race subgroup analyses.
Also, grouping them into two categories (staying versus everyone else) was a logical
procedure considering that the purpose of this study is to explore organizational
commitment in terms of intention to remain at the institution.
Network integration. The Network Survey asked about interactions with two
types of faculty (within one’s primary department and outside of the department). For
each type, network integration was measured with the numbers of self-reported
connections in two kinds of informal networks: the departmental research exchange

23
network (the instrumental network) and departmental friendship network (the expressive
network).
For the departmental research exchange network, the integration levels were
measured based on the response to two questions, “Have you received helpful research
related information, advice, or equipment from each of the following faculty members in
the <department name inserted here> during the 2007-2008 academic year?” and “Have
you provided research related information, advice, or equipment to each of the following
faculty members in the <department name inserted here> during the 2007-2008 academic
year?” Faculty were provided a list of all faculty in the tenure home department and were
asked to identify the frequency they interacted with each faculty member (1=Never;
2=Once a semester or less; 3=A few times a semester; 4=A few times a month; 5=Once a
week or more). I used “3=A few times a semester” as the cut-off for identifying the
presence of a network tie. In other words, faculty who selected either “1=Never,” or
“2=Once a semester or less” were assigned a value indicating that a tie did not exist. The
cut-off was chosen for following reasons. Providing a list of all network members makes
respondents more inclined to identify a connection (Brewer, 2000). I wanted to ensure
that the ties measured are not weak connections. One way to assess tie strength is the
frequency of contact between the two actors. Strong ties are characterized as having a
higher frequency of interaction (Granovetter, 1973). Casual contact would not be
consistent a strong tie. In the context of this research, interacting less than once a
semester or only once semester is considered casual contact. In contrast, interacting a few
times a semester or more is considered a strong tie.

24
The numbers of ties identified in the two questions above were combined for the
departmental research exchange network. If faculty indicated either receiving from or
providing research-related help/aid to another faculty member in their department, the tie
was given the value of one. The within department research exchange variable was
created by summing the binary tie variables. The variable ranges from zero, indicating
the respondent engaged in no research exchange with other faculty in their primary
department, to 35. Since the largest department size is 38, this respondent clearly felt he
or she had a strong research exchange tie with almost everyone in their home department.
This was not the norm. In fact, this variable was highly skewed with a mean of 6.57 and
the standard deviation of 5.09. The majority of faculty (90%), reported 11 or fewer
faculty with whom they engaged in research exchange.
For the departmental friendship network, faculty were asked, “Thinking about
non-work related interactions, have you spent free time together (such as eating dinner,
working out, or other leisure activities) or discussed personal matters (e.g., family
celebrations or difficulties) with each of the following faculty members in the
<department name inserted here > during the 2007-2008 academic year?” Faculty
identified the frequency of interactions using the same list of faculty in the department
and the same five choices of frequency as they did for the research exchange network.
The same cut-off point (“3=A few times a semester”) was used to indicate the presence of
a relational tie for friendship. The within department friendship network variable was
created by summing relational ties each faculty member had. The variable ranges from
zero to 24. Like research exchange, this variable was highly skewed with a mean of 5.94

25
and the standard deviation of 5.16. The majority of faculty (90%), reported 11 or fewer
faculty with whom they engaged in non-work related interactions.
The extreme outlier cases within the research exchange and friendship network
size produced non-normal variables, which could pose a problem within data analyses.
To address the issue of non-normality I first tried to transform the variables. None of the
8 transformations produced adequate univariate statistics (Skewness and Kurtosis).
Truncation of the extreme outliers, however, solved the skewness problem. Research
exchange and friendship network size were truncated whereby values of 12 or greater
were recoded as 11. For the research exchange network size variable, a total of 13 cases
were truncated. For friendship network size, a total of 14 cases were truncated.
In addition to the questions about connections within the department, the Network
Survey asked questions about the number of connections to other faculty outside of one’s
primary department (the frequency of interaction with faculty outside of the department
was not asked). It is important to control for connections outside of one’s primary
department, but within the University because connections outside might lessen the
impact of isolation within one’s department. Two dummy variables indicate the presence
of cross-departmental research exchange network and cross-departmental friendship.
The variable, the cross-departmental research exchange network (0=not present;
1=present), was developed using responses to two questions “From how many
<university name inserted here> faculty members outside of the <department name
inserted here> have you received helpful research related information, advice or
equipment during the 2007-2008 academic year?” and “From how many <university
name> faculty members outside of the <department name> have you provided helpful
26
research related information, advice or equipment during the 2007-2008 academic year?”
To answer these questions, faculty wrote (typed in) the numbers of connections. If there
was none, they answered “0.” The cross-departmental research exchange network was
considered not to be present only when faculty identified no tie in both of the above
questions. The question, “With how many <university name> faculty members outside of
the <department name> have you spent free time with or discussed personal matters
during the 2007-2008 academic year?,” was used for the cross-departmental friendship
network (0=not present; 1=present). The friendship network was considered present when
faculty identified one connection or more.
Work-family balance. Two measures were used for work-family balance: the
family-friendly work climate scale and self-reported satisfaction with work-life balance.
The first measure, the family-friendly work climate scale, consists of three items. The
COACHE survey asked the respondents to identify their levels of agreement or
disagreement with three statements regarding work climate (1=strongly disagree;
2=disagree; 3=neither agree nor disagree; 4=agree; 5=strongly agree). There was slight
variation in item wording depending on faculty rank. Assistant professors were
specifically asked to respond to the following two statements: (1) “My institution does
what it can to make having children and the tenure-track compatible.”; (2) “My
departmental colleagues do what they can to make having children and the tenure-track
compatible.” The first two items for associate and full professors were worded slightly
differently: (1) “My institution does what it can to make family obligations (e.g., child or
elder care) and a post-tenure faculty career compatible.”; (2) “My departmental
colleagues do what they can to make family obligations (e.g., child or elder care) and a

27
post-tenure faculty career compatible.” Although the question wording varied across
rank, the first two statements tap into similar concepts: (1) supportive climate with
balancing work and family at the institutional level, and (2) supportive climate with
balancing work and family in the department. The third item regarding family-friendly
work climate, (3) “My colleagues are respectful of my efforts to balance work and home
responsibilities”, was worded in the same way regardless of faculty rank. Thus, the
family-friendly work climate scale was created using the two items with the merged
response, and the third item with a single statement. The mean score of at least one valid
item was used to create the scale (Cronbach’s alpha: 0.80).
Satisfaction with work-life balance was measured with a single item from the
COACHE Survey. The respondents were asked “How satisfied or dissatisfied are you
with the balance between your professional time and your personal or family time?” They
identified their level of satisfaction with a five-point scale (1=very dissatisfied;
2=dissatisfied; 3=neither satisfied not dissatisfied; 4=satisfied; 5=very satisfied).
Other variables. Female is a dichotomous variable (0=male; 1=female).
Nonwhite is also a dichotomous variable which indicates whether or not the respondent is
nonwhite (0=white; 1=nonwhite). Years working at the institution was included as a
continuous variable. It ranges from zero to 42 years. For presence of a partner / partner’s
employment status, the respondents were categorized into three mutually exclusive
groups, and then a set of three dichotomous variables were created: (1) no partner is
present (0=others; 1=partner not present), (2) partner is not employed full-time (0=others;
1=partner not employed full-time), and (3) partner is employed full-time (0=others;
1=partner employed full-time). This study used the second group, “partner is not

28
employed full-time,” as the reference group because the largest number of faculty in the
sample fit in the category (n=66). Lastly, Presence of children under the age of 18 living
at home is a dichotomous variable (0=not present; 1=present).
The size of the 26 STEM departments varied from 8 to 38 faculty members, and it
was suspected that workplace climate or faculty’s working experience might be
influenced by their department size. More importantly, one’s department size influences
the number of network ties they can develop. Therefore, the department size (i.e., the
number of faculty in respondent’s department) was added as a control variable as well.
Table 1 presents the means and standard deviations for the continuous variables, and the
percentages for the categorical variables.
(Table 1 about here)
Analytic Strategy
The analysis for this paper has two parts. First, bivariate analyses were conducted
to assess gender and race variation in each of the four major concepts of the study: job
satisfaction, organizational commitment, network integration, and work-family balance.
In addition to the bivariate analyses, I conducted regression analyses to assess gender and
race variation in network integration and work-family balance controlling for the other
individual characteristics (years working at the institution on network integration,
presence of a partner and partner’s employment status, and presence of children) and the
department size. Second, using linear regression, I assessed the influence of network
integration and work-family balance on job satisfaction. Sets of variables were added
sequentially to assess if network integration and work-family balance could explain
gender and race differences in job satisfaction. I also ran sequential logistic regressions to

29
assess the influence of network integration and work-family balance on organizational
commitment.
The participants of the study were clustered into 26 STEM departments, and the
complex sample design violated the assumption of independent observations. For
example, it was possible that respondent #1 and respondent #2 were in the same
department, and respondent #1’s satisfaction with work-life balance had something to do
with respondent #2’s satisfaction level. Therefore, I made adjustments for clustering
using the statistical software Stata for all of the bivariate and multivariate regression
analyses. Finally, the number of women and minority faculty in the sample was low.
Therefore, the power of the statistical tests was compromised. For this reason, I report
statistical significance at the p<.10 level and I discuss the size of substantively
meaningful differences.
Results
Gender and Race Variation in Job Satisfaction and Organizational Commitment
Table 2a and Table 2b provide the results of bivariate analyses for gender and
race variation in job satisfaction (t-tests for mean score differences) and organizational
commitment (chi square tests for percentage differences). There were no significant
gender or race differences in job satisfaction. There was a slight trend for non-white
faculty to have lower job satisfaction (mean= 3.55) compared to white faculty (mean=
3.88); this difference is over a ¼ of a standard deviation difference for job satisfaction
across race ((3.88-3.55)/.87=.379). In contrast, the means for job satisfaction across
gender are virtually identical (3.80 for women and 3.83 for men).
30
(Table 2a about here)
Table 2b shows the distribution between two categories of the organizational
commitment variable (0=Not sure or leaving; 1=Staying) by gender and race. Unlike job
satisfaction, significant gender (p<.10) and race (p<.05) variation occurred for
organizational commitment. In terms of gender variation, 83% of men intend to remain in
the institution, whereas only 60% of women do so. In terms of race variation, 84% of
white faculty intend to remain, whereas only 57% of nonwhite faculty intend to remain.
Thus, Hypothesis 1 was partially supported. While gender (being female) and race (being
nonwhite) did not have a significant association with job satisfaction, there was
significant race and gender variation in organizational commitment.
(Table 2b about here)
Gender and Race Variation in Network Integration and Work-family Balance
The results of bivariate analyses (t-tests) investigating race and gender differences
in network integration and work-family balance are shown in Table 3. There were no
gender or race differences in departmental research exchange network size. All
respondents reported close to six other faculty members within their departmental
research exchange networks. For the departmental friendship network, however,
meaningful differences occur across gender. Women reported significantly fewer
friendship connections within their departments than men. The mean number of
friendship ties was 3.95 for women, whereas the mean was 5.50 for men (p<.05). Thus,
Hypothesis 2a was partially supported because I found the significant gender differences
in integration within friendship networks but not research exchange networks. Contrary
to my expectation, gender and race variation was not significant in the two measures of

31
work-family balance (on the right side of Table 3). Therefore, the results did not support
Hypothesis 3a.
(Table 3 about here)
To assess the robustness of gender and race differences in network integration and
work-family balance, I ran multivariate regressions with all control variables included in
the models. I accounted for the clustering in 26 departments. The first model regressed
the dependent variables on gender and race, and the control variables were added in the
second model. Because the network integration variables were count outcomes, I
conducted Poisson regressions. I conducted Ordinary Least Squares (OLS) regressions
for the family-friendly work climate scale considering that the scale used the mean score
of the three items included. For the satisfaction with work-life balance, which was
measured with a single item with a five-range scale (i.e., ordered categories), I chose the
Ordinal regression models. Table 4 presents the results of these regression analyses.
(Table 4 about here)
For the departmental research exchange network, there was no significant
association with gender and race. For the departmental friendship network, however, the
association of gender was significantly negative in both column III (p<.10) and column
IV (p<.05). The incidence rate ratio in the column IV shows that controlling for the other
variables, women had 30% smaller number of friendship ties (i.e., integration levels)
compared to men. Similar to the results of the bivariate analyses (Table 3), the results of
the regression analyses partially supported Hypothesis 2a by showing only the significant
association of gender with network integration in the departmental friendship network.
32
As shown on the right side of Table 4, no significant association of gender and
race was observed for either of the work-family balance measures. Column VIII shows
that presence of a partner and partner’s employment status had a significant association
with satisfaction with work-life balance. Compared to the case where partner did not
work full-time, having no partner or having a partner with a full-time job decreased the
odds of having higher satisfaction with work-life balance by 71% or 62%, respectively.
In other words, faculty were most likely to be satisfied with work-life balance if they had
a partner who did not have high work demands. Thus, consistent with the results of the
bivariate analyses (Table 3), gender and race did not have a significant association with
work-family balance when the other individual characteristics and the department size
were controlled in the regression models. Therefore, the results of the multivariate
analyses also rejected Hypothesis 3a.
Job Satisfaction
As described above, gender and race variation in job satisfaction, organizational
commitment, network integration, and work-family balance was tested for the first part of
the analysis. As the next step, the relationship of network integration and work-family
balance with job satisfaction and organizational commitment were investigated through
multiple regression analyses. Table 5a provides the results of the OLS models that
regressed job satisfaction on network integration variables and work-family balance
variables controlling for the other variables. I chose the OLS model because the job
satisfaction scale used the mean score of the two items included. Model 1 shows gender
and race variation in job satisfaction, and the other individual characteristics and the
department size were added in Model 2. Model 2 was the baseline model to which the

33
network integration variables and the work-family balance variables were added
separately (Model 3 and Model 4) and then were added all together in the final model
(Model 5).
(Table 5a about here)
Consistent with bivariate analysis, Model 1 in Table 5a shows that neither gender
nor race had a significant association with job satisfaction. Their associations were not
significant even when the other individual characteristics and the department size were
controlled (Model 2). Model 3 added the network integration variables to the baseline
model. While integration in the departmental research exchange network was not a
significant predictor of job satisfaction, integration in the departmental friendship
network was a significant predictor (beta= .174, p<.10). Having more friends within
one’s department is associated with higher job satisfaction. Thus, Hypothesis 2b was
partially supported for job satisfaction.
To test the influence of over-integration on job satisfaction, I ran a regression
similar to Model 3 with the addition of the squared variables for the departmental
research exchange network and the departmental friendship network separately (results
not shown). There was no significant curvilinear effect for either network. That is, I did
not find negative consequences of over-integration in the departmental networks.
However, it is important to remember that I brought down the maximum number of
network by collapsing the cases with 12 ties or above into the value of 11.
Model 4 in Table 5a reports the results of adding the work-family balance
variables to the baseline model. Consistent with hypothesis 3b, work-family balance had
a significantly positive influence with job satisfaction. There was a strong positive

34
association between family-friendly work climate and job satisfaction (beta= .496,
p<.01). Satisfaction with work-life balance also had a significant association with job
satisfaction (beta= .180, p<.05).
All variables were included in the final model (Model 5 in Table 5a). Integration
in the departmental friendship network lost significance, but both measures of the work-
family balance were still significant predictors of job satisfaction. Judging from the beta
coefficients, which represent relative strength of the predictors in the model, family-
friendly work climate had the strongest influence (positive) on job satisfaction among the
variables included in Model 5.
One of the purposes of this study was to investigate gender and race variation in
job satisfaction and the influence of network integration and work-family balance as
mediators. Therefore, I examined the changes in the coefficients for gender and race
throughout the models in Table 5a. In the case of gender, the coefficients and the beta
coefficients were very small in all models, and they were all nonsignificant. It appears
that job satisfaction did not vary by gender. Although not statistically significant, there is
some race variation in job satisfaction. The race coefficients across the models in Table
5a ranged from -.332 to -.227. The lowest race difference in job satisfaction occurs in
Model 3 and Model 5 suggesting that adding network integration slightly reduced the
race differences in job satisfaction. This occurs due to the race difference in friendship
network integration. Although not significant, there was a small indication that nonwhite
faculty reported fewer friendships in their department compared to white faculty.
Organizational Commitment
35
Because the organizational commitment variable was a binary variable (0= Not
sure or leaving; 1= Staying), I used a logistic regression model to analyze the predictors
of organizational commitment. Table 5b presents the results of the regressions.
Consistent with bivariate analyses reported earlier, organizational commitment
significantly varies by gender and race (Model 1). Compared to men, the odds of
intending to remain at the institution were lower for women by a factor of 0.37.
Compared to white faculty, the odds were lower for nonwhite faculty by a factor of 0.30.
(Table 5b about here)
Gender variation in organizational commitment was no longer statistically
significant when including control variables (Model 2) or network integration variables
(Model 3) in the regression equation. In Model 2, two control variables were significant
predictors of organizational commitment. Years working at the institution was positively
associated with organizational commitment (odds ratio= 1.08, p<.01). Also, faculty
members without a partner reported lower organizational commitment compared to
faculty members with a partner who was not employed full-time (odds ratio= .15, p<.05).
It appears that gender variation in the control variables accounted for the disappearance
of the significant association of gender and organizational commitment in Model 2.
Women tended to be newer at the institution than men, and women were more likely than
men to have no partner (See Appendix B). These gender differences suggest that there
might be more complex mechanisms of gender variation in organizational commitment
than what has been discussed in this paper.
Model 3 shows that integration in the departmental friendship network was a
significant predictor of organizational commitment (odds ratio= 1.13, p<.10). Having
36
more friends within one’s department is associated with higher organizational
commitment. Considering the former finding that integration in the departmental
friendship network was significantly lower for women than men (Table 3), the likely
explanation for the reduction of the gender coefficient in Model 3 is that the gender
difference in friendship network integration reduced the gender differences in
organizational commitment. Thus, both differences in demographic characteristics and in
the friendship network integration explain gender differences in organizational
commitment.
Model 4 adds network variables with the control variables. The effect of years
working at the institution, relationship status, and friendship network integration did not change
substantially. When including the control variables, integration in the departmental
friendship network had a significant positive association with organizational commitment
(odds ratio= 1.18, p<.10). Thus, Hypothesis 2b was partially supported for organizational
commitment. 2
It is important to note that the direction of the association for gender with
organizational commitment becomes positive in Model 4. Although not statistically
significant, the odds of intending to remain at their institution were higher for women
than men if the network integration levels as well as the other control variables were held
constant. Women’s organizational commitment could be higher than men if there was no
gender variation in friendship network integration, years working at the institution and
likelihood of having no partner. Therefore, the changes in the coefficients suggest a
2 I tested the influence of over-integration on organizational commitment in the
same way as job satisfaction, but there was no significant curvilinear effect (the results not shown).

37
mediation effect of integration in the departmental friendship network, years working at
the institution, and likelihood of having no partner on gender differences in
organizational commitment.
Model 5 added the work-family balance variables. Neither the family-friendly
work climate scale nor satisfaction with work-life balance had a significant influence on
organizational commitment. Thus, the results rejected Hypothesis 3b for organizational
commitment. Given that there was not significant gender variation in the work-family
balance measures (Table 3) and that the coefficients for gender did not change much
between Model 2 and Model 4, work-family balance does not appear to mediate gender
differences in organizational commitment.
I also assessed mediation of race differences in organizational commitment.
Unlike gender, the coefficients and the odds ratios for the race variable were almost the
same values from Model 1 to Model 6, and yet their significant level dropped when the
control variables were added (P<.05 in Model 1 and Model 3 and p<.10 in the other
models). Similar to gender variation, my preliminary analysis showed a significant race
difference in years working at the institution (See Appendix B). Therefore, it appears that
the nonwhite faculty’s tendency to be new at the institution accounted for the decrease in
the significant association of race and organizational commitment. The mean years
working at the institution were 13.6 years for white faculty, whereas they were 6.7 years
for nonwhite faculty.
Considering that race variation (i.e., the coefficient of the race variable) remained
statistically significant after controlling for race differences in departmental friendship
network and years working at the institution, it is likely that there are additional
38
unexplained reasons why nonwhite faculty have lower organizational commitment than
white faculty.
The multiple regression analyses (Table 5a and Table 5b) revealed that variation
in job satisfaction and organizational commitment were explained by different factors.
Comparing the variance explained in the regression models in Table 5a, it is clear that the
work-family balance variables made the most significant contribution to predict job
satisfaction (R�increased from 0.047 to 0.374 between Model 2 and Model 4). For
organizational commitment, however, work-family balance did not explain the variation
as much as it did for job satisfaction (R� improved only from 0.187 to 0.209 between
Model 2 and Model 4 in Table 5b). Instead, the individual characteristics which were
added in the analyses as control variables, such as years working at the institution and
presence of a partner, were actually the most significant contributors of the variance in
the model (R� increased from 0.071 to 0.187 between Model 1 and Model 2 in Table 5b).
Discussion and Conclusion
The purpose of this study was to explore the potential mediation effect of network
integration and work-family balance on gender and race variation in job satisfaction and
organizational commitment. I first analyzed gender and race variation in job satisfaction,
organizational commitment, network integration, and work-life balance. Then, I explored
whether network integration and work-family balance explained gender and race
variation in job satisfaction and organizational commitment.
One of the most important findings of this research is that women and minority
faculty had lower organizational commitment compared to men and whites, respectively.

39
This finding was consistent with the findings from the previous studies (Callister, 2006;
Rosser, 2004), and it suggests that university administrators should make retention efforts
in addition to recruitment efforts to increase faculty diversity. The current study revealed
that lower organizational commitment among women and minority faculty could make
the rising inflow of women and minorities in Science and Engineering less effective in
increasing their representation.
The findings from this study provide clues on how to arrange work environments
that have the capacity to retain faculty. The analyses of the self-reported personal
networks revealed the positive association between the departmental friendship network
and organizational commitment (Although integration in the friendship network had a
significant association with organizational commitment, integration in the research
exchange network did not). More specifically, the results showed that women tended to
be less integrated in the departmental friendship network than men, and it lowered their
organizational commitment. This study revealed that network integration was the part of
the mechanisms that caused gender variation in organizational commitment. Therefore,
promoting women’s integration in non-work related interactions in the department (e.g.,
eating out together, sharing leisure activities, having conversations about personal
matters) may be a useful strategy in making them more likely to want to stay at the
institution. Results also showed that women faculty’s tendency to be new at the
institution and their high likelihood of being without a partner explained their lower
organizational commitment than men.
Unfortunately, I cannot make suggestions on how to improve retention for
minority faculty based on the findings of this study. There was no significant race
40
variation in network integration and work-family balance, and minority faculty had
significantly lower organizational commitment than whites even after accounting for
network integration, work-family balance, the individual characteristics, and the
department size. Some factors other than network integration and work-family balance
might explain race variation in organizational commitment, and exploring these factors
(e.g., discrimination, tenure and promotion process) is a subject of a future study.
The positive influence of work-family balance on job satisfaction is another
important finding. Although the strategy is not specifically targeting under-represented
faculty, improvement of work-family balance might lead to an increase in job satisfaction
and eventually contribute to faculty retention. Future research should look into the
condition of work-family balance among faculty in more detail. This study used
perceptions of a family-friendly work climate and satisfaction with work-life balance as
the measures of work-family balance, but it would be interesting to further examine the
association of work-family balance with faculty retention using more sophisticated
measures. It has been suggested that researchers should use multidimensional measures
(i.e., measures that consist of items on work characteristics, family characteristics, and
role spillover) to study work-family balance (Keene & Quadagno, 2004). Therefore,
future research should examine faculty’s demands from family life (e.g., amount of
housework and child care) as well as demands from work life (e.g., hours spent on
teaching, research, service work) and the spillover effects between them.
For several reasons, the results of this research should be interpreted with caution.
First, this study had low statistical power due to the small sample size. The analytic
sample consisted of 137 faculty members, and there were only 20 women and 21

41
nonwhites. Although I could not find significant gender and race variation in job
satisfaction and work-family balance measures, the results could have shown significant
variation if the sample size were larger. Also, this study could not explore the
intersections of gender and race due to the small numbers of women and minorities in the
sample (14 white women, six nonwhite women, and 15 nonwhite men). Yet this
limitation of analysis is important evidence that women and minority faculty are still
underrepresented in Science and Engineering. There were only six nonwhite women in
the sample, and I could not examine how their dual minority status (women and racial
minority) made their experience different from that of white women and nonwhite men.
In fact, nonwhite women had the lowest integration level in both the departmental
research network and friendship network when I examined the mean difference between
white men, nonwhite men, white women, and nonwhite women for the preliminary
analyses (See Appendix C). Therefore, future research with a bigger sample and more
nonwhite women should explore the intersection of gender and race.
In addition, there is a question of causality. The use of the cross sectional data
makes it difficult to distinguish preceding variables from outcome variables. For example
I argued that integration in the departmental friendship network had a positive influence
on organizational commitment. It is possible, however, that some faculty were planning
to leave the institution in the near future, and it made them reluctant to get involved with
other faculty. Future research should use longitudinal data to clarify the causal ordering.
Lastly, the generalizability of the findings is questionable. The data were
collected at only one setting, a research intensive Midwestern University. Its geographic
location, size of the university, facilities, administrative services, and many other factors

42
might have influenced the results. For example, faculty might have different network
integration patterns at universities where teaching is the primary focus. Also, women
faculty were more likely than men faculty to be single possibly due the location of the
university. The university is the only research intensive university in a Midwestern state.
Therefore, it might be more difficult to find a marriage partner or find employment for
both spouses in the community compared to the urban areas on the West or East Coast
where there are multiple universities and academic employment opportunities.
Regardless of these limitations, this research advanced the field by showing the
importance of effort to retain under-represented faculty, the positive association between
the departmental friendship network and organizational commitment, the possibility of
retaining more women by promoting their non-work related interactions with other
faculty, and the strong association of work-family balance with job satisfaction for
faculty in general. The findings did not fully support the proposed conceptual model.
However, this study furthered the understanding of faculty retention and provided
empirical evidence that faculty retention could be improved through network integration
and work-family balance.

43
References
Bilimoria, D., Perry, S. R., Liang, X., Stoller, E. P., Higgins, P., & Taylor, C. (2006).
How do female and male faculty members construct job satisfaction? The roles of
perceived institutional leadership and mentoring and their mediating processes.
Journal of Technology Transfer, 31, 355-365.
Blair-Loy, M. (2003). Competing devotions: Career and family among women
executives.Cambridge, MA: Harvard University Press.
Brass, D. J. (1981). Structural relationships, job characteristics, and worker satisfaction
and performance. Administrative Science Quarterly, 26(3), 331-348.
Brass, D. J. (1985). Men’s and women’s networks: A study of interaction patterns and
influence in an organization. The Academy of Management Journal, 28(2), 327-
343.
Brass, D. J., Galaskiewicz, J. G., Greve, H. R., & Tsai, W. (2004). Taking stock of
networks and organizations: A multilevel perspective. The Academy of
Management Journal, 47(6), 795-817.
Brewer, D. D. (2000). Forgetting the recall-based elicitation of personal and social
networks. Social Networks, 22, 29-43.
Burt, R. S. (1998). The gender of social capital. Rationality and Society, 10(1), 5-46.
Cornell University Provost’s Advisory Committee on Faculty Work Life. (2006).
Understanding faculty satisfaction. Cornell University, Institutional Research and
Planning. Retrieved from www.dpb.cornell.edu/documents/1000369.pdf

44
Callister, R. R. (2006). The impact of gender and department climate on job satisfaction
and intentions to quit for faculty in science and engineering fields. Journal of
Technology Transfer, 31, 367-375.
Drago, R., Colbeck, C. L., Stauffer, K. D., Pirretti, A., Burkum, K., Fazioli, J., Lazarro,
G., & Habasevich, T. (2006). The avoidance of bias against caregiving: The case
of academic faculty. American Behavioral Scientist, 49(9), 1222-1247.
Fox, M. F. (2001). Women, science, and academia: Graduate education and careers.
Gender and Society, 15(5), 654-666.
Garey, A. I. (1999). Weaving work and motherhood. Philadelphia, PA: Temple
University Press.
Glass, L. J., (2000). Toward a kinder, gentler workplace: Envisioning the integration of
family and work”, Contemporary Sociology, 29, 129-143.
Glass, L. J., & Estes, S. B. (1997). The family responsive workplace. Annual Review of
Sociology, 23, 289-313.
Granovettor, M. (1973). The strength of weak ties: A network theory revisited.
Sociological Theory, 1. 201-233.
Hays, S. (1996). The cultural contradictions of motherhood. New Haven, CT: Yale
University Press.
Hochschild, A. R. (1989). The second shift. New York: Avon Books.
Ibarra, H. (1992). Homophily and differential return: Sex difference in network structure
and access in an advertising firm. Administrative Science Quarterly, 37(3), 422-
447.

45
Ibarra, H. (1993). Personal networks of women and minorities in management: A
conceptual framework. The Academy of Management Review, 18(1), 56-87
Ibarra, H., & Andrews, S. B. (1993). Power, social influence, and sense making: Effects
of network centrality and proximity on employee perceptions. Administrative
Science Quarterly, 38(2), 277-303.
Jacobs, J. A., & Gerson, K. (2004). The time divide: Work, family and gender inequality.
Cambridge, MA: Harvard University Press.
Jacobs, J. A., & Winslow, S. E. (2004). The academic life course, time pressures and
gender inequality. Community, Work & Family, 7(2), 143-161.
Johnsrud, L. K., & Heck, R. H. (1994). A university’s faculty: Identifying who will leave
and who will stay. Journal of Higher Education Management, 10(1), 71-84.
Kalleberg, A. (1977). Work values and job rewards: A theory of job satisfaction.
American Sociological Reiew, 42(1), 124-143.
Kanter, R. M. (1977). Men and women of the corporation. New York: Basic Books, Inc.
Keene, J. R., & Quadagno, J. (2004). Predictors of perceived work-family balance:
Gender difference or gender similarity? Sociological Perspectives, 47(1), 1-23.
Labianca, G., & Brass, D. J. (2004). Exploring the social ledger: Negative relationships
and negative asymmetry in social networks in organizations. Academy of
Management Review, 31(3), 596-614.
Lin, N. (1999). Social networks and status attainment. Annual Review of Sociology, 25,
467-487.
Maiter, M. W. (1990). Retaining faculty: A tale of two campuses. Research in Higher
Education, 31(1), 39-60.

46
Mason, M. A., & Ekman, E. M. (2007). Mothers on the fast track: How a new generation
can balance family and careers. New York: Oxford University Press.
Mason, M. A., & Goulden, M. (2002). Do babies matter? Academe, 88(6), 21-27.
Mason, M. A., & Goulden, M. (2004). Marriage and baby blues: Redefining gender
equity in the academy. The ANNALS of the American Academy of Political and
Social Science, 596, 86-103.
Miller, J., Lincoln, J. R., & Olson, J. (1981). Rationality and equity in professional
networks: Gender and race as factors in the stratification of interorganizational
systems. The American Journal of Sociology, 87(2), 308-335.
MIT. (1999). A study on the status of women faculty in science at MIT. The MIT Faculty
Newsletter special edition XI, 4.
Mobley, W.H., Horner, S. O., & Holingsworth, A. T. (1978). An evaluation of precursors
of hospital employee turnover. Journal of Applied Psychology, 63, 408-414.
Monosson, E. (Eds.). (2008). Motherhood, the elephant in the laboratory. Ithaca, New
York: Cornell University Press.
Monroe, K., Ozyurt, S., Wrigley, T., & Alexander, A. (2008). Gender equality in
academia: Bad news from the trenches, and some possible solutions. Perspectives
on Politics, 6(2), 215-233.
Moody, J. (2004). Faculty diversity: Problems and solutions. New York: Taylor and
Francis Books, Inc.
Moore, G. (1988). Women in elite positions: Insiders or outsiders? Sociological Forum,
3(4), 566-585.
Moore, G. (1992). Gender and informal networks in state government. Social Science

47
Quarterly, 73(1), 46-61.
National Science Foundation. (2006). Academic institutions of minority faculty with
S&E doctorates. Retrieved from http://www.nsf.gov/statistics/infbrief/ nsf06318/
National Science Foundation. (2008). Thirty-three years of women in S&E science
positions. Retrieved from http://www.nsf.gov/statistics/infbrief/nsf08308/
O’Laughlin, E. M., & Bischoff, L. G. (2005). Balancing parenthood and academia:
Work/family stress as influenced by gender and tenure status. Journal of Family
Issues, 26(1), 79-106.
Palgi, M., & Moore, G. (2004). Social capital: Mentors and contacts. Current Sociology,
52(3), 459-480.
Richman, A. L., Civian, J. T., Shannon, L. L., Hill, E. J., & Brennan, R. T. (2008). The
relationships of perceived flexibility, supportive work-life policies, and use of
formal flexible arrangements and occasional flexibility to employee engagement
and expected retention. Community, Work & Family, 11(2), 183-197.
Roberts, K. H., & O’Reilly, C. A. (1979). Some correlations of communication roles in
organizations. The Academy of Management Journal, 22(1), 42-57.
Roos, P., & Gatta, M. (2008). Gender (in)equity in the academy: Subtle mechanisms
and the production of inequality. Research in Social Stratification and Mobility,
27, 177-200.
Rosser, V. J. (2004). Faculty members’ intentions to leave: A national study on their
worklife and satisfaction. Research in Higher Education, 45(3), 285-309.
Sabharwal, M., & Corley, E. A. (2009). Faculty job satisfaction across gender and
discipline. The Social Science Journal, 46, 539-556.

48
Settles, I. H., Cortina, L. M., Stewart, A. J., & Malley, J. (2007). Voice matters:
Buffering the impact of a negative climate for women in science. Psychology of
Women Quarterly, 31, 270-281.
Smart, J. C. (1990). A causal model of faculty turnover intentions. Research in Higher
Education, 31(5), 405-424.
Smith, J. W., & Calasanti, T. (2005). The influence of gender, race, and ethnicity on
workplace experiences of institutional and social isolation: An exploratory study
of university faculty. Sociological Spectrum, 25(3), 307-334.
UC Faculty Family Friendly Edge. (2005, Feburuary). An initiative for tenure-track
faculty at the University of California. Retrieved from http://
ucfamilyedge.berkeley.edu/ucfamilyedge.pdf
Weiler, W. C. (1985). Why do faculty members leave a university? Research in Higher
Education, 23(3), 270-278.
Williams, J. (2000). Unbending gender: Why family and work conflict and what to do
about it.New York: Oxford University Press.
Xu, Y. J. (2008). Faculty turnover: Discipline specific attention is warranted. Research in
Higher Education, 49, 40-61.
Yen, J.W., Quinn, K., Carrigan, C., Litzler E., & Riskin, E.A. (2007). The ADVANCE
mentoring-for-leadership lunch series for women faculty in STEM at the
University of Washington. Journal of Women and Minorities in Science and
Engineering, 13, 191-206.

49

50

51
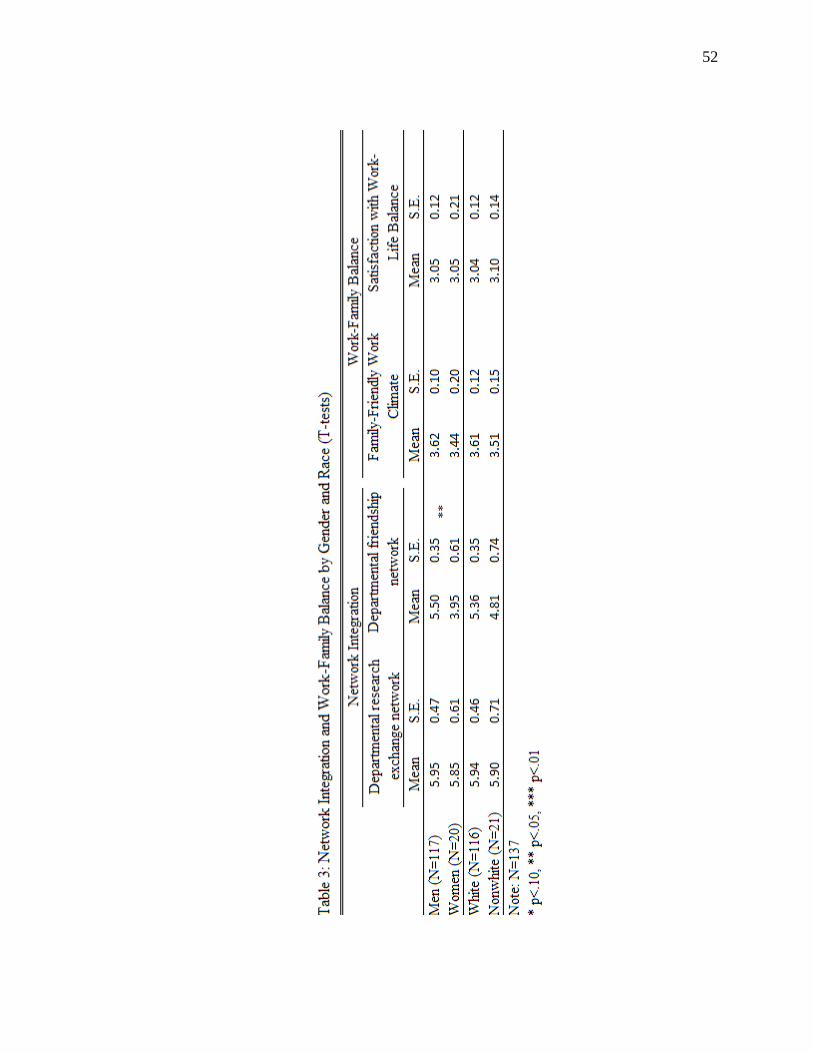
52

53

54

55

56
Figure 1: Conceptual Model
H1
H2a H2b
H3a H3b
Gender
Race
Proxy Indicators
for Retention
Job Satisfaction
Organizational Commitment
Academic Climate Perceptions
Network Integration
Work-Family Balance

57

58

59


