
Food and Agriculture Organization of the United Nations
GAEZGlobal Agro-ecological Zones
I I A S A
International Institutefor Applied Systems Analysis
GAEZ v3.0
Global Agro-ecological Zones
User’s Guide
Global Agro-Ecological Zones (GAEZ v3.0)
GAEZ Data Portal
- User’s Guide -
Géza Tóth, Bartosz Kozlowski, Sylvia Prieler and David Wiberg
Laxenburg, Austria, May 2012

Page | 2
Page | 3
Disclaimer
The designations employed and the presentation of materials in GAEZ do not imply the expression of any opinion whatsoever on the part of the International Institute for Applied Systems Analysis (IIASA) or the Food and Agriculture Organization of the United Nations (FAO) concerning the legal status of any country, territory, city or area or its authorities, or concerning the delimitation of its frontiers or boundaries. © IIASA and FAO IIASA and FAO are the sole and exclusive owners of all rights, titles and interests, including trademarks, copyrights, trade names, trade secrets and other intellectual property rights, contained in the data and software of GAEZ. Acknowledgements and citation Full acknowledgement and citation in any materials or publications derived in part or in whole from GAEZ data is required and must be cited as follows: IIASA/FAO, 2012. Global Agro-ecological Zones (GAEZ v3.0). IIASA, Laxenburg, Austria and FAO, Rome, Italy.

Page | 4
Page | 5
Table of Contents
Disclaimer .................................................................................................................................... 3
Table of Contents ......................................................................................................................... 5
Figures ......................................................................................................................................... 6
Tables .......................................................................................................................................... 6
Acronyms ..................................................................................................................................... 7
Part 1: Introduction ...................................................................................................................... 8 1.1 GAEZ data overview ...................................................................................................................... 8
1.2 Accessing GAEZ data ................................................................................................................... 11
1.3 GAEZ Data Portal technical implementation overview ............................................................... 12
1.4 Hardware and software requirements ....................................................................................... 12
Part 2: Accessing the GAEZ Portal ............................................................................................... 13 2.1 Login and registration ................................................................................................................. 13
2.2 Data interface .............................................................................................................................. 14
2.2.1 Selecting options and features ............................................................................................ 15
Part 3: Data and query selection ................................................................................................. 16 3.1 Selecting a theme and parameters ............................................................................................. 16
3.2 Selecting crops, management, time period (Parameter menu) ................................................. 16
3.2.1 Crop ...................................................................................................................................... 18 3.2.2 Water Supply ....................................................................................................................... 18 3.2.3 Input Level ........................................................................................................................... 18 3.2.4 Time Period .......................................................................................................................... 19
3.3 Selecting geographic areas and masks (Mask menu) ................................................................. 19
3.3.1 Geographic Area Selection ................................................................................................... 20 3.3.2 Geographic Masks ................................................................................................................ 21
Part 4: Data output formats (Output menu) ................................................................................ 23 4.1 Map ……………………………………………………………………………………………………………………………………….23
4.2 Map statistics .............................................................................................................................. 24
4.3 Crop summary table .................................................................................................................... 25
4.4 Visualization and download ........................................................................................................ 28
4.4.1 Visualization ......................................................................................................................... 28 4.4.2 Download ............................................................................................................................. 29
APPENDIXES .............................................................................................................................. 30
APPENDIX 1: User agreement ............................................................................................................ 30
APPENDIX 2: Operating system requirements for display with Google EarthTM ............................... 32
APPENDIX 3: Land resource and agro-climatic resource data ........................................................... 34
APPENDIX 4: Suitability and Potential Yield Assessment Data .......................................................... 36
APPENDIX 5: Actual Yield and Production and Yield and Production Gap Data ................................ 46
APPENDIX 6: Actual Yield and Production and Yield and Production Gap Data ................................ 47
APPENDIX 7: List of regions/countries/sub-national divisions .......................................................... 49
APPENDIX 8: Geographic masks ........................................................................................................ 58 APPENDIX 9: Spatial Data Availability for GAEZ Themes……………………..……………….……………………….59 APPENDIX 10: Spatial Data Availability for Suitability and Potential Yield Assessment…….……….….63
Page | 6
Figures
Figure 1 GAEZ Assessment theme overview ...................................................................................... 9
Figure 2 Suitability and Potential Yield theme overview ................................................................. 10
Figure 3 Start page of the GAEZ Data Portal ................................................................................... 11
Figure 4 Technical implementation of the GAEZ Data Portal ........................................................... 12
Figure 5 GAEZ Registration page ...................................................................................................... 13
Figure 6 Login ................................................................................................................................... 14
Figure 7 Welcome page of the GAEZ Data Portal ............................................................................. 14
Figure 8 Selection menu ................................................................................................................... 15
Figure 9 Select Administrative Unit .................................................................................................. 20
Figure 10 Example of geographic mask definition ............................................................................. 21
Figure 11 Interactive map of the GAEZ Data Portal ........................................................................... 23
Figure 12 Map statistics table type 1 ................................................................................................. 24
Figure 13 Map statistics table type 2 ................................................................................................. 25
Figure 14 Crop summary table output options .................................................................................. 26
Figure 15 Crop summary table ........................................................................................................... 26
Tables
Table 1 Overview of sub-menu 1 options available for themes and sub-themes ................... 17
Table 2 Mask options by parameter classes ............................................................................ 22
Table 3 A3-1 Land resources data available in the GAEZ Data Portal ...................................... 34
Table A4-2 Major crop groups ....................................................................................................... 36
Table A4-3 List of 49 crops ............................................................................................................. 36
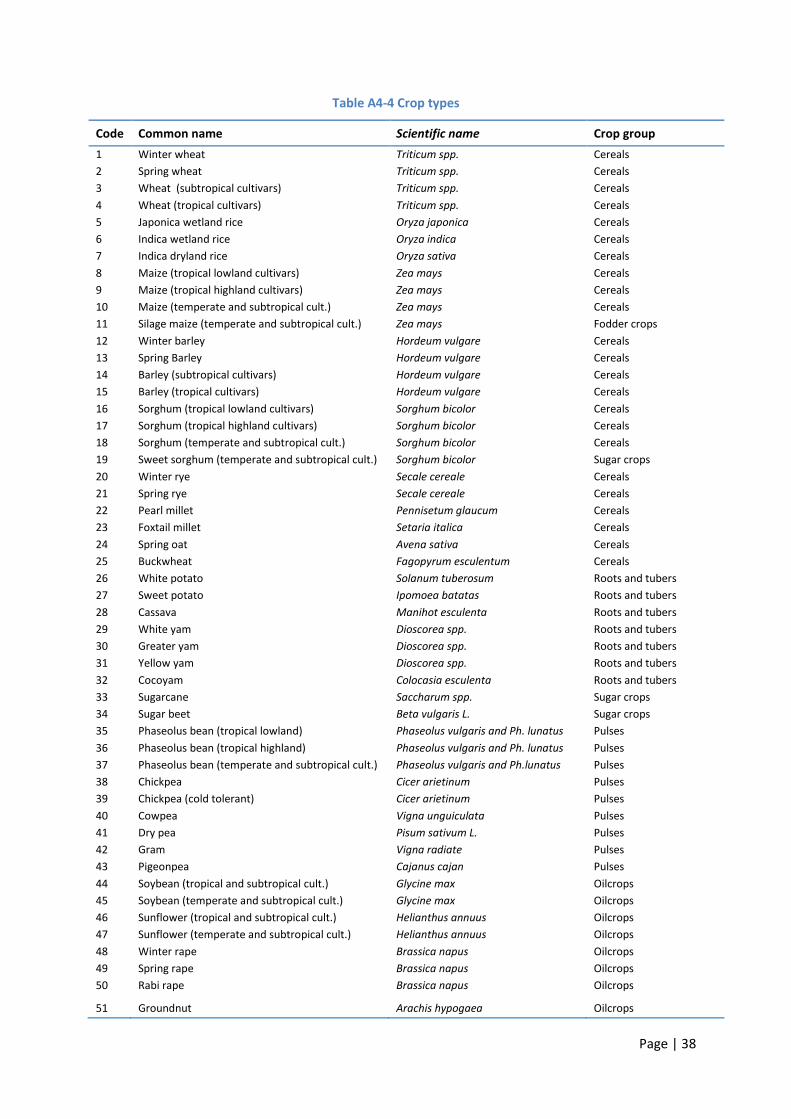
Table A4-4 List of 92 crop types..................................................................................................... 38
Table A4-5 List of 280 crop LUTs, codes and names ...................................................................... 40
Table A5-1 Actual Yield and Production data available in the GAEZ Data Portal .......................... 46
Table A5-2 Major crops/commodity groups available for actual yield and production ................ 46
Table A5-3 Yield and Production Gap data available in the GAEZ Data Portal .............................. 47
Table A5-4 Major crops/commodity groups .................................................................................. 47
Table A6-1 List of GAEZ regions ..................................................................................................... 49
Table A6-2 List of regions and countries ....................................................................................... 50
Table A6-3 List of first level sub-national divisions of eight large countries ................................. 56
Table A6-4 List of geographic masks .............................................................................................. 58
Page | 7
Acronyms
A1FI IPCC scenario. Detailed description: http://www.grida.no/climate/ipcc/emission/098.htm
A2 IPCC scenario. Detailed description: http://www.grida.no/climate/ipcc/emission/094.htm
B1 IPCC scenario. Detailed description: http://www.grida.no/climate/ipcc/emission/094.htm#1
B2 IPCC scenario. Detailed description: http://www.grida.no/climate/ipcc/emission/095.htm
CGCM2 The second generation of atmosphere-ocean coupled general circulation model
CO2 Carbon dioxide
CSIRO Commonwealth Scientific and Industrial Research Organisation
CSIRO Mark2 CSIRO global coupled ocean-atmosphere-sea-ice model
DM Dry matter
ECHAM4 Modified global forecast model developed by ECMWF
ECMWF European Centre for Medium-Range Weather Forecasts
FAO Food and Agriculture Organization of the United Nations
fct constraint factor
GAEZ Global Agro-Ecological Zones
GCM Global Circulation Model
HadCM3 Hadley Centre Coupled Model, version 3
IIASA International Institute for Applied Systems Analysis
LC Land Cover classes
LGP Length of Growing Period
LUT Land Utilization Type
MS Moderately suitable (40-60% of maximum attainable yield)
mS Marginally suitable (20-40% of maximum attainable yield)
NS Not suitable (<5% of maximum attainable yield)
PC Protection Class
PDF Portable Document Format
PET Potential evapotranspiration
PNG Portable Network Graphics
S Suitable (60-80% of maximum attainable yield)
VmS Very marginally (5-20% of maximum attainable yield)
VS Very suitable (80-100% of maximum attainable yield)
Page | 8
Part 1: Introduction
Food and Agriculture Organization of the United Nations (FAO) and the International Institute for Applied Systems Analysis (IIASA) have been continuously developing the Agro-Ecological Zones (AEZ) methodology over the past 30 years for assessing agricultural resources and potential. Rapid developments in information technology have produced increasingly detailed and manifold global databases, which made the first global AEZ assessment possible in 2000. Since then global AEZ assessments have been performed every few years. With each update of the system, the issues addressed, the size of the database and the number of results have multiplied. This is the most ambitious assessment yet and the goal is to make publicly available the entire database and all results of this assessment. This amounts to many terabytes of data covering five thematic areas:
Land resources, including soil resources, terrain resources, water resources, land cover, protected areas and selected socio economic and demographic data;
Agro-climatic resources, including a variety of climatic indicators;
Suitability and potential yields for up to 280 crops/land utilization types under alternative input and management levels for historical, current and future climate conditions;
Downscaled actual yields and production of main crop commodities, and
Yield and production gaps, in terms of ratios and differences between actual yield and production and potentials for main crops.
The GAEZ database provides the agronomic backbone for various applications including the quantification of land productivity. Results are commonly aggregated for current major land use/cover patterns and by administrative units, land protection status, or broad classes reflecting infrastructure availability and market access conditions. With this large amount of data, a new system had to be created to make the data accessible to a variety of users. The result is the new GAEZ Portal, an interactive data access facility, which not only gives access and allows visualization of data but GAEZ Global Agro-Ecological Zones but also provides the user with various analysis and download options
1.1 GAEZ data overview
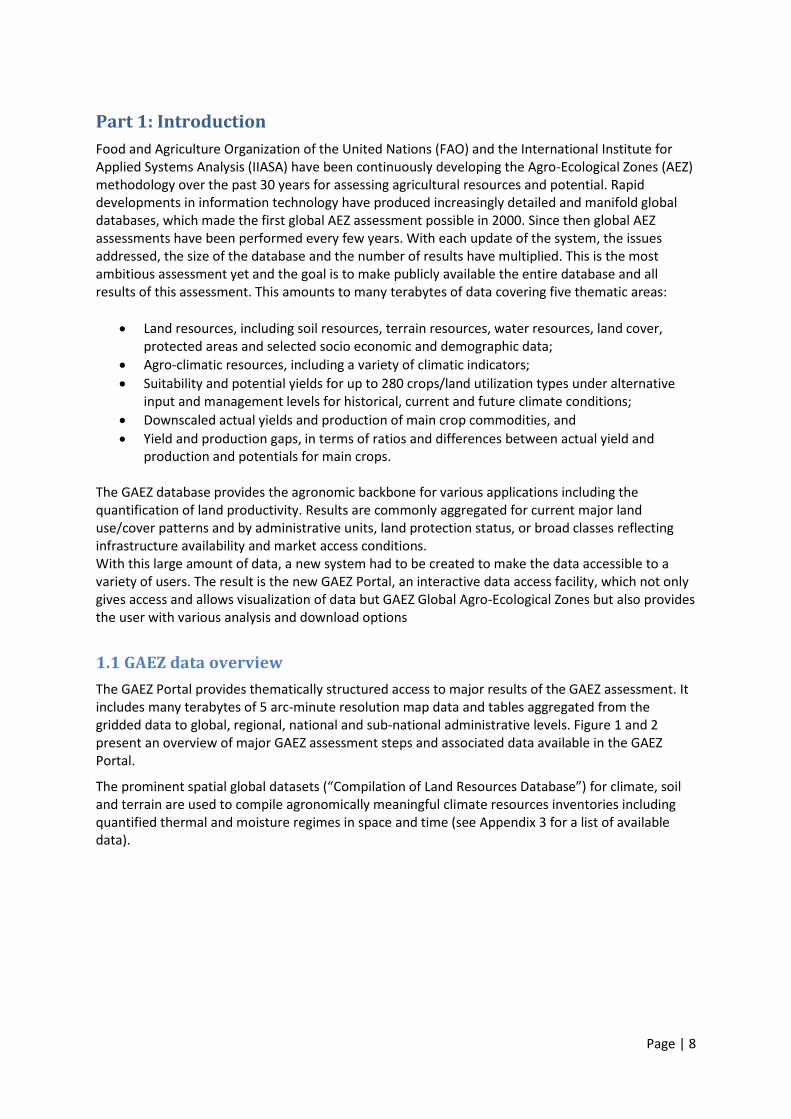
The GAEZ Portal provides thematically structured access to major results of the GAEZ assessment. It includes many terabytes of 5 arc-minute resolution map data and tables aggregated from the gridded data to global, regional, national and sub-national administrative levels. Figure 1 and 2 present an overview of major GAEZ assessment steps and associated data available in the GAEZ Portal.
The prominent spatial global datasets (“Compilation of Land Resources Database”) for climate, soil and terrain are used to compile agronomically meaningful climate resources inventories including quantified thermal and moisture regimes in space and time (see Appendix 3 for a list of available data).
Page | 9
Figure 1 GAEZ Assessment theme overview
The “Assessment of Crop Potentials” estimates suitability and potential yields of 280 individual crop/land utilization types subsequently aggregated in 92 crop types, 49 crops and 11 crop groups Appendix 4 describes all available data and crops.
The “Downscaling of Crop Statistics” of the main crops in rain-fed and irrigated cultivated land provides distributions of current yield and production for 23 major commodities. The “Estimation of Yield and Production Gaps” provides ratios and differences between actual yield and production and potentials for 17 major crops (see Appendix 5).
The GAEZ modeling framework for crop potential assessment (Figure 2) uses detailed agronomic-based knowledge to assess land suitability, potential attainable yields and potential production of crops for specified management assumptions and input levels, both for rain-fed and irrigated conditions. This domain provides maps and tabular information on agro-climatic yields, yield constraints, crop calendars, and potential production estimates at three basic levels of inputs (high, intermediate, low). Productivity estimates were made for different water supply systems: (i) rain-fed production; (ii) rain-fed production with water conservation; and (iii) irrigated production including a specification for irrigation types (gravity, sprinkler and drip irrigation systems). Results presented include agro-climatically attainable yields, climate yield constraints, crop calendar data and agro-ecological suitability and productivity assessment data.
Model results account for temperature and moisture constraints affecting growth and development and yield reducing effects caused by pests, diseases and weeds as well as climate related workability

Page | 10
constraints. These estimated yields are referred to as agro-climatically attainable yields. Yield constraints are determined by individual land utilization types (LUTs). The quantified constraint factors include temperature constraints (fc1), moisture constraints (fc2) agro-climatic constraints (fc3) and a resulting overall yield reduction factor (fc0). LUT-specific constraints related to soil and terrain conditions (fc4) as well as water deficits (WD) are provided under this heading.
Yield calculations, repeated for all possible growth cycle starting days during the prevailing growing period, determine an optimum crop calendar in terms of attainable potential yield. Information provided includes the start and duration of the LUT growth cycle reflecting the period from crop emergence to full maturity.
The agro-climatically attainable yields combined with an agro-edaphic assessment determine agro-ecological suitability and productivity for Individual land utilization types (LUTs). Soil and slope distributions within a 5 arc-minute grid-cell on the one hand, and crop, environment and management specific fallow period requirements on the other hand are used to estimate suitability distributions and the aggregate potential productivity of crops.
Figure 2 Suitability and Potential Yield theme overview
Page | 11
1.2 Accessing GAEZ data
The GAEZ Portal can currently be accessed from the home page of the IIASA ESM Program (http://www.iiasa.ac.at/Research/LUC/index.html), or directly through the following internet location (URL): http://www.iiasa.ac.at/Research/LUC/GAEZv3.0. The mirrored GAEZ data interface will also be available on the web site of FAO.
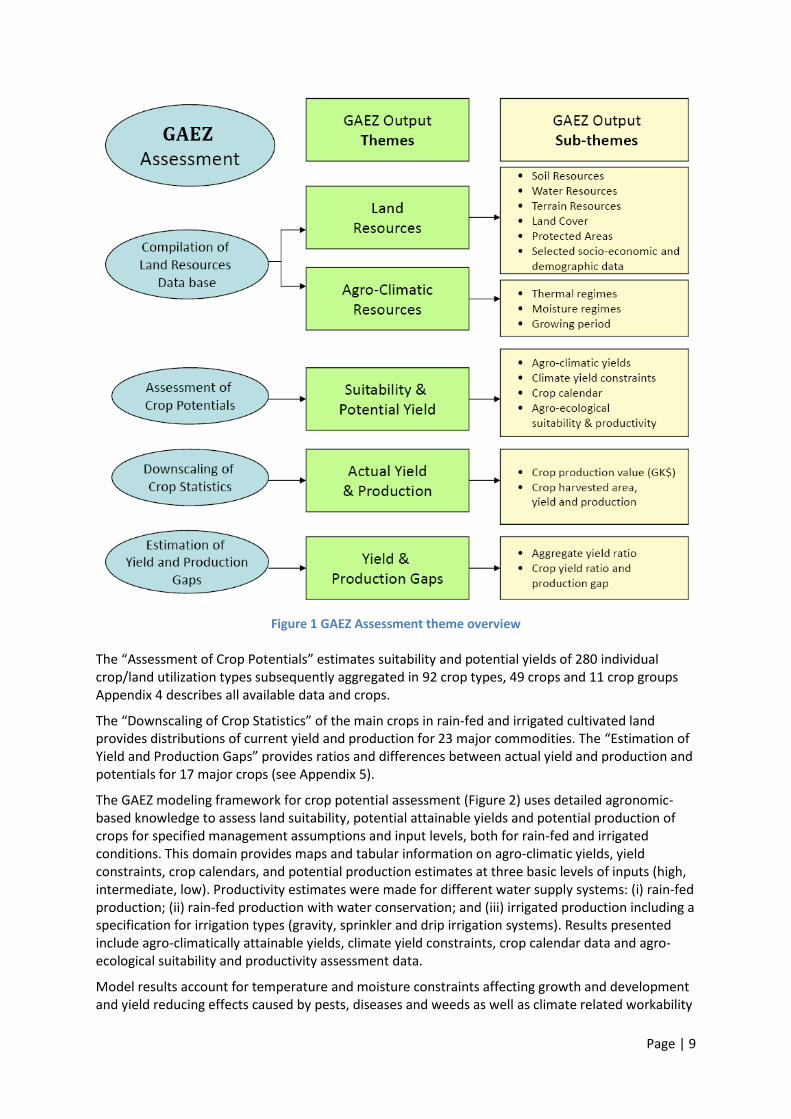
The link will open the web page shown in Figure 3:
Figure 3 Start page of the GAEZ Portal
The following options and documents are available online:
Data access – (I.e., access to the GAEZ Portal);
Data Portal User’s Guide (pdf format);
News and recent changes (GAEZ status update and news)
Model Documentation – (pdf format), and
Research Report – Global Agro-ecological Zones: Methodology and Results (pdf format).
By selecting GAEZ Portal the user enters the web interface of GAEZ.

Page | 12
1.3 GAEZ Portal technical implementation overview
The underlying technical implementation of the AEZ Web Interface consists of three primary elements: 1. GAEZ Data Portal; 2. GAEZ web server 3. GAEZ data base The portal uses html forms and javascript and communicates with java servlets on the web server. The servlets are used to dynamically create html pages and send it to the user’s browser, to communicate with the database and extract the requested data, and to prepare the results in the requested format. If the user chooses to view an interactive map of the requested data, the data is sent to GeoServer, which prepares the data to be displayed on the website using OpenLayers. The GeoServer was modified and customized to the functionality of the GAEZ implementation. A schematic representation of the implementation is shown in Figure 4 below:
Figure 4 Technical implementation of the GAEZ Portal
1.4 Hardware and software requirements
A recent web browser capable of running JavaScript is required to use the GAEZ Portal. The PC does not require any further capabilities for accessing GAEZ data. The portal is designed to function with any of the major browsers and has developed in Firefox. The system is being adapted to also function with: Internet Explorer ver. 7 and 8, Safari, Opera and Opera Mobile. Although the GAEZ Portal will run on lower screen resolutions, a minimum screen resolution of 1024 x 768 is recommended. Hard disk drive space is only necessary to download data and the required disk space depends on how much data is downloaded and in what format. Access is free for non-commercial uses. Registration and signing of a user agreement (Appendix 1) is required to download data. Results can be viewed using an interactive Map Tool with basic GIS features. In addition viewing of maps is possible within Google EarthTM for which system requirements outlined in Appendix 2 are recommended.
User (browser)
Web Application Server
and Map Server Geoserver Java Servlets
Database Server

Page | 13
Part 2: Accessing the GAEZ Portal
2.1 Login and registration
Before using the GAEZ Portal the first time, login is required with an email address and selected password. Prior to the first login, a one-time registration is required. On the registration page, users are requested to provide full name, email address and password of their own choice ( Figure 55). The User Agreement containing basic GAEZ usage policy, disclaimer and correct citation is available at the registration page, which must be read and accepted before proceeding with the registration. The User Agreement is available in full in Appendix 1.
Figure 5 GAEZ Registration page
By submitting the registration page, an email is sent to the email address provided, which contains a link that leads the user back to the GAEZ Portal, confirming the registration. After this process, the username (email address) and password will be required each time the GAEZ Portal is accessed (see Figure 6 below).
Page | 14
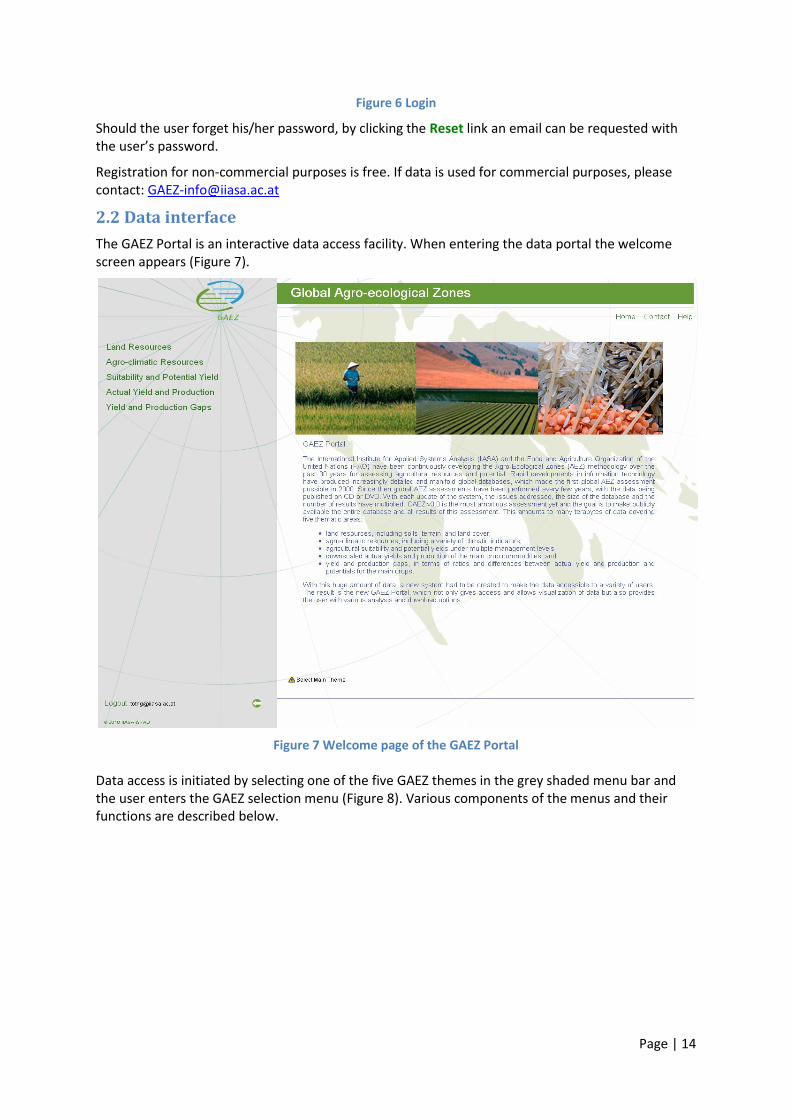
Figure 6 Login
Should the user forget his/her password, by clicking the Reset link an email can be requested with the user’s password.
Registration for non-commercial purposes is free. If data is used for commercial purposes, please contact: [email protected]
2.2 Data interface
The GAEZ Portal is an interactive data access facility. When entering the data portal the welcome screen appears (Figure 7).
Figure 7 Welcome page of the GAEZ Portal
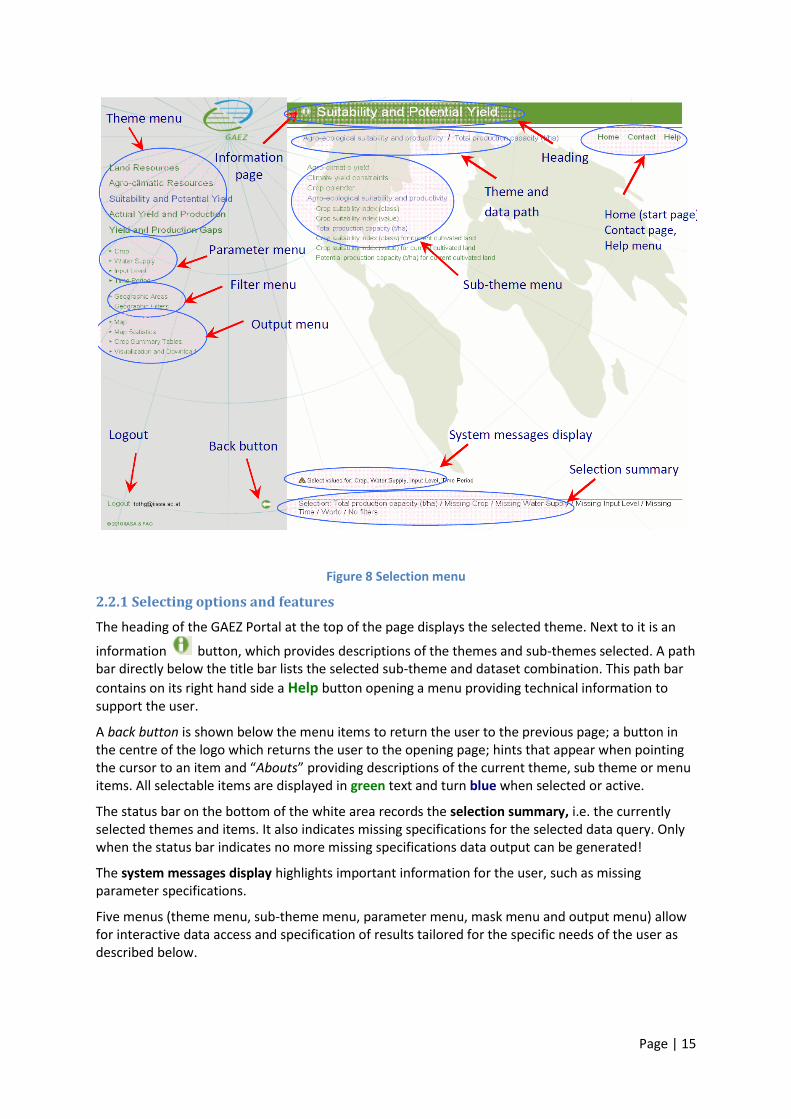
Data access is initiated by selecting one of the five GAEZ themes in the grey shaded menu bar and the user enters the GAEZ selection menu (Figure 8). Various components of the menus and their functions are described below.
Page | 15
Figure 8 Selection menu
2.2.1 Selecting options and features
The heading of the GAEZ Portal at the top of the page displays the selected theme. Next to it is an
information button, which provides descriptions of the themes and sub-themes selected. A path bar directly below the title bar lists the selected sub-theme and dataset combination. This path bar
contains on its right hand side a Help button opening a menu providing technical information to support the user.
A back button is shown below the menu items to return the user to the previous page; a button in the centre of the logo which returns the user to the opening page; hints that appear when pointing the cursor to an item and “Abouts” providing descriptions of the current theme, sub theme or menu items. All selectable items are displayed in green text and turn blue when selected or active.
The status bar on the bottom of the white area records the selection summary, i.e. the currently selected themes and items. It also indicates missing specifications for the selected data query. Only when the status bar indicates no more missing specifications data output can be generated!
The system messages display highlights important information for the user, such as missing parameter specifications.
Five menus (theme menu, sub-theme menu, parameter menu, mask menu and output menu) allow for interactive data access and specification of results tailored for the specific needs of the user as described below.
Page | 16
Part 3: Data and query selection
3.1 Selecting a theme and parameters
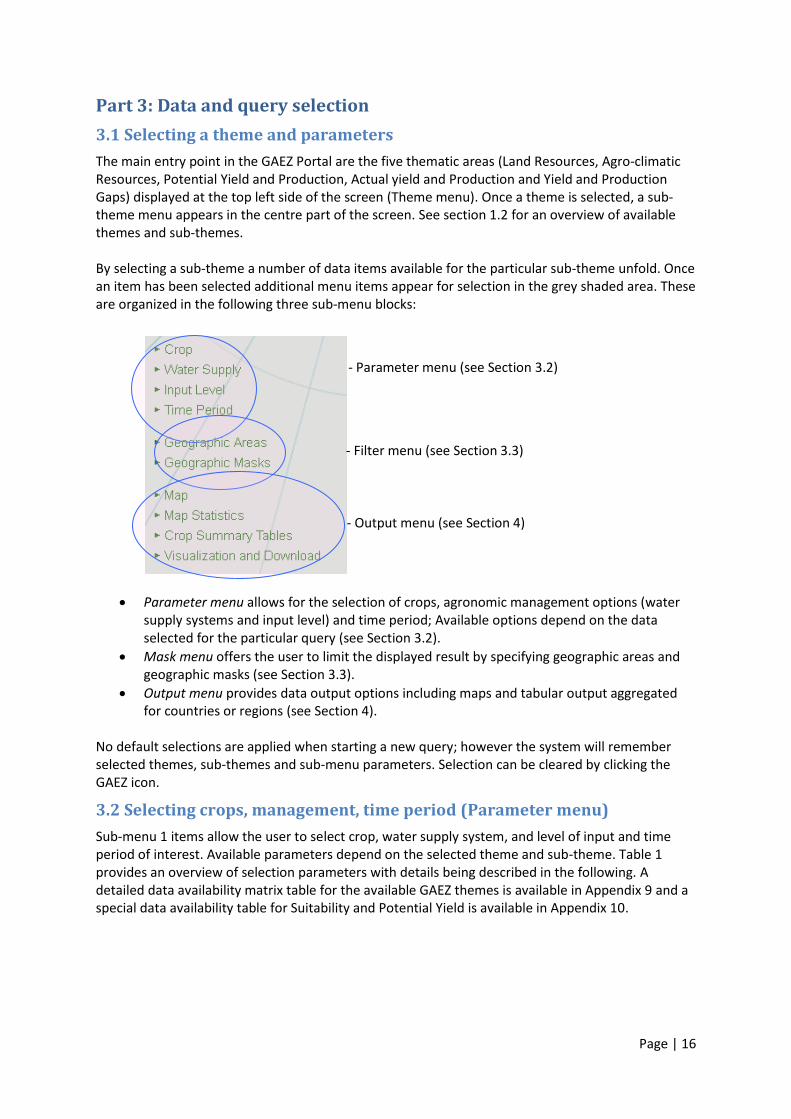
The main entry point in the GAEZ Portal are the five thematic areas (Land Resources, Agro-climatic Resources, Potential Yield and Production, Actual yield and Production and Yield and Production Gaps) displayed at the top left side of the screen (Theme menu). Once a theme is selected, a sub-theme menu appears in the centre part of the screen. See section 1.2 for an overview of available themes and sub-themes. By selecting a sub-theme a number of data items available for the particular sub-theme unfold. Once an item has been selected additional menu items appear for selection in the grey shaded area. These are organized in the following three sub-menu blocks:
Parameter menu allows for the selection of crops, agronomic management options (water supply systems and input level) and time period; Available options depend on the data selected for the particular query (see Section 3.2).
Mask menu offers the user to limit the displayed result by specifying geographic areas and geographic masks (see Section 3.3).
Output menu provides data output options including maps and tabular output aggregated for countries or regions (see Section 4).
No default selections are applied when starting a new query; however the system will remember selected themes, sub-themes and sub-menu parameters. Selection can be cleared by clicking the GAEZ icon.
3.2 Selecting crops, management, time period (Parameter menu)
Sub-menu 1 items allow the user to select crop, water supply system, and level of input and time period of interest. Available parameters depend on the selected theme and sub-theme. Table 1 provides an overview of selection parameters with details being described in the following. A detailed data availability matrix table for the available GAEZ themes is available in Appendix 9 and a special data availability table for Suitability and Potential Yield is available in Appendix 10.
- Parameter menu (see Section 3.2)
- Filter menu (see Section 3.3)
- Output menu (see Section 4)
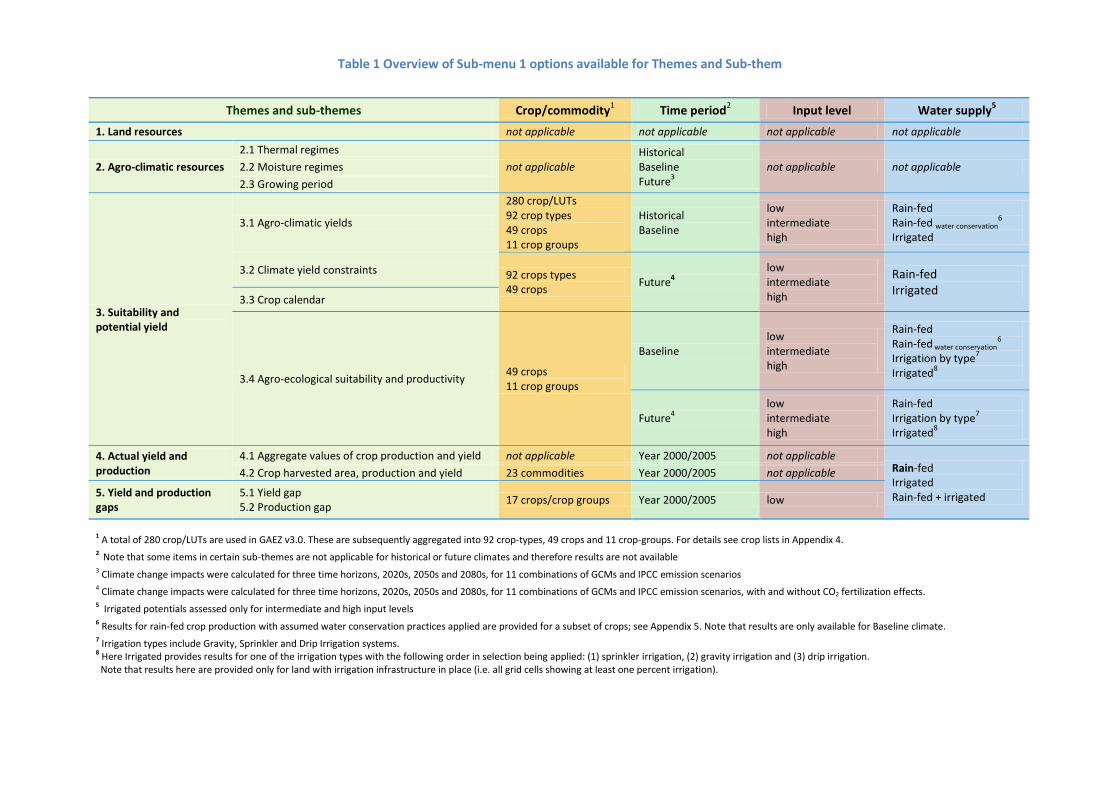
Table 1 Overview of Sub-menu 1 options available for Themes and Sub-them
Themes and sub-themes Crop/commodity1 Time period
2 Input level Water supply
5
1. Land resources not applicable not applicable not applicable not applicable
2. Agro-climatic resources
2.1 Thermal regimes
not applicable Historical Baseline Future
3
not applicable not applicable 2.2 Moisture regimes
2.3 Growing period
3. Suitability and potential yield
3.1 Agro-climatic yields
280 crop/LUTs
92 crop types 49 crops 11 crop groups
Historical Baseline
low intermediate high
Rain-fed Rain-fed water conservation
6
Irrigated
3.2 Climate yield constraints 92 crops types 49 crops
Future4
low intermediate high
Rain-fed Irrigated
3.3 Crop calendar
3.4 Agro-ecological suitability and productivity 49 crops 11 crop groups
Baseline low intermediate high
Rain-fed Rain-fed water conservation
6
Irrigation by type7
Irrigated8
Future4
low intermediate high
Rain-fed Irrigation by type
7
Irrigated8
4. Actual yield and production
4.1 Aggregate values of crop production and yield not applicable Year 2000/2005 not applicable Rain-fed Irrigated Rain-fed + irrigated
4.2 Crop harvested area, production and yield 23 commodities Year 2000/2005 not applicable
5. Yield and production gaps
5.1 Yield gap 5.2 Production gap
17 crops/crop groups Year 2000/2005 low
1 A total of 280 crop/LUTs are used in GAEZ v3.0. These are subsequently aggregated into 92 crop-types, 49 crops and 11 crop-groups. For details see crop lists in Appendix 4. 2 Note that some items in certain sub-themes are not applicable for historical or future climates and therefore results are not available
3 Climate change impacts were calculated for three time horizons, 2020s, 2050s and 2080s, for 11 combinations of GCMs and IPCC emission scenarios
4 Climate change impacts were calculated for three time horizons, 2020s, 2050s and 2080s, for 11 combinations of GCMs and IPCC emission scenarios, with and without CO2 fertilization effects.
5 Irrigated potentials assessed only for intermediate and high input levels
6 Results for rain-fed crop production with assumed water conservation practices applied are provided for a subset of crops; see Appendix 5. Note that results are only available for Baseline climate. 7 Irrigation types include Gravity, Sprinkler and Drip Irrigation systems. 8 Here Irrigated provides results for one of the irrigation types with the following order in selection being applied: (1) sprinkler irrigation, (2) gravity irrigation and (3) drip irrigation. Note that results here are provided only for land with irrigation infrastructure in place (i.e. all grid cells showing at least one percent irrigation).
3.2.1 Crop
‘Crop’ can be selected in the themes ‘suitability and potential yields’, ‘actual yield and production’, and ‘yield and production gaps’. A hierarchical menu allows the user to select “all” crops, or select among 11 crop groups, 49 crops, 92 crop types, and 280 crop subtypes (see list in Appendix 4 for detailed crop lists).
All crop groups including the detailed 280 crop sub-types, so called land utilization types (LUTs), are included in the ‘Agro-climatic yields’ sub-theme category. The extensive 280 crops/LUTs are only provided for baseline and historic climatic time periods.
‘Agro-ecological suitability and productivity’ data are available for 49 crops and 11 crop groups.
Depending on available statistical data the spatially explicit ‘Actual Yield and Production’ for the year
2000 and 2005 has been estimated via downscaling procedures for 23 commodity groups as ‘Yield
and production gaps’ is available for 17 crops (see Appendix 5 for crop lists). The latter correspond
with FAOSTAT crop groups.
3.2.2 Water Supply
For three themes; ‘Suitability and Potential Yields’, ‘Actual Yield and Production’, and ‘Potential Yield and Production Gap’ the user can tailor results to mode of water supply systems. This includes:
Rain-fed conditions
Rain-fed with water conservation measures
Irrigation For the latter different irrigation systems can be selected, namely
Gravity irrigation systems
Sprinkler irrigation systems
Drip irrigation Since not all irrigation systems are applicable for all crops, irrigation system options depend on the chosen crops. When more than one irrigation system is applicable for a particular crop the option ‘irrigation’ provides results only for one of the irrigation types applying the following order in selection being applied: (1) sprinkler irrigation, (2) gravity irrigation and (3) drip irrigation. The implementation of irrigation infrastructure depends first and foremost on water availability and also on soil and terrain conditions. The ‘Agro-ecological suitability and productivity’ assessment results have only been provided for areas with current irrigation infrastructure (i.e. all grid cells showing at least one percent irrigation). ‘Actual Yield and Production’ and ‘Yield and Production Gaps’ provide results separately for rain-fed and irrigated conditions as well as for all areas (i.e. rain-fed + irrigated).
3.2.3 Input Level
The following input levels are available in the GAEZ assessment:
1. Low-level inputs/traditional management
Under the low input/traditional management assumption, the farming system is largely subsistence based and not necessarily market oriented. Production is based on the use of traditional cultivars (if improved cultivars are used, they are treated in the same way as local cultivars), labor intensive
Page | 19
techniques, and no application of nutrients, no use of chemicals for pest and disease control and minimum conservation measures.
2. Intermediate-level inputs/improved management
In the case of intermediate input/improved management assumption, the farming system is partly market oriented. Production for subsistence plus commercial sale is a management objective. Production is based on improved varieties, on manual labor with hand tools and/or animal traction and some mechanization. It is medium labor intensive, uses some fertilizer application and chemical pest, disease and weed control, adequate fallows and some conservation measures.
3. High-level inputs/advanced management
For the high input/advanced management assumption, the farming system and management is mainly market oriented with commercial production being the management objective. Production uses improved high yielding varieties, is fully mechanized with low labor intensity and uses optimum applications of nutrients and chemical pest, disease and weed control.
4. Mixed level of inputs
Under mixed level of inputs the best land is assumed to be used for high level input farming, moderately suitable and marginal lands are assumed to be used at intermediate or low input and management systems. High, intermediate, low and mixed input levels can be selected for Suitability and Potential Yields theme and high intermediate and low input levels for the Potential Yield and Production Gaps theme. The evaluation procedures for gravity irrigation suitability cover the dryland crops and wetland rice, at both intermediate and high levels of management and input circumstances.
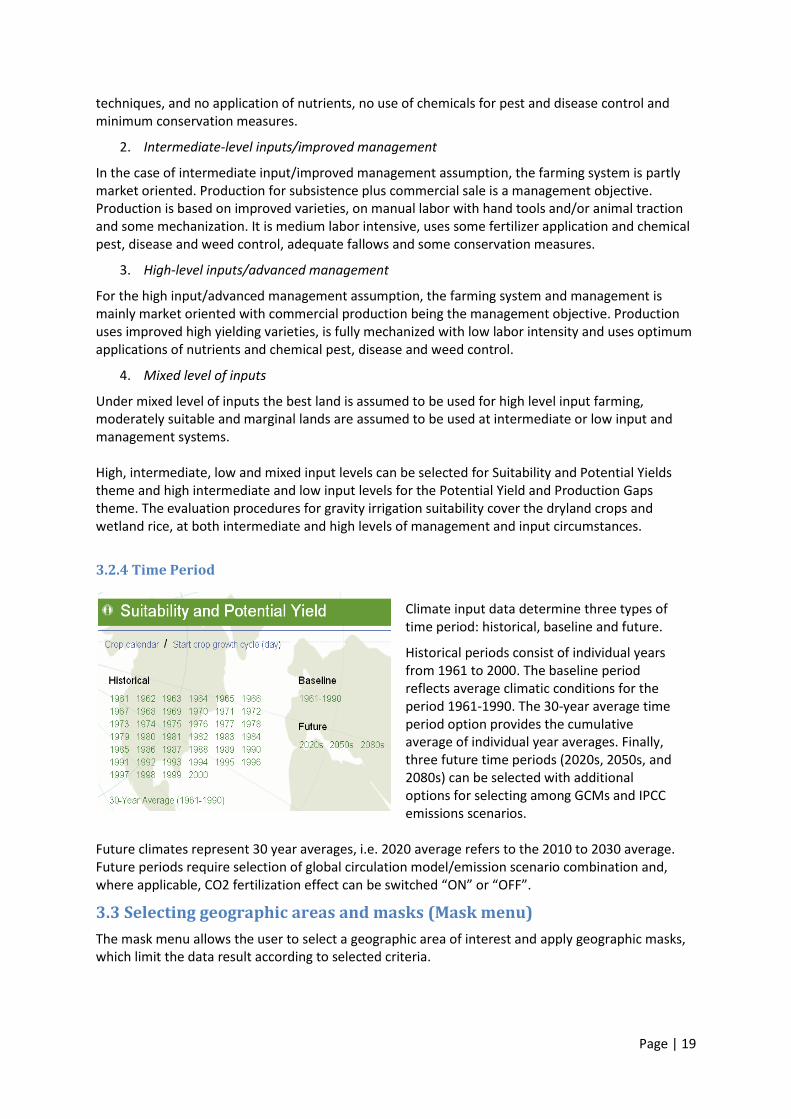
3.2.4 Time Period
Future climates represent 30 year averages, i.e. 2020 average refers to the 2010 to 2030 average. Future periods require selection of global circulation model/emission scenario combination and, where applicable, CO2 fertilization effect can be switched “ON” or “OFF”.
3.3 Selecting geographic areas and masks (Mask menu)
The mask menu allows the user to select a geographic area of interest and apply geographic masks, which limit the data result according to selected criteria.
Climate input data determine three types of time period: historical, baseline and future.
Historical periods consist of individual years from 1961 to 2000. The baseline period reflects average climatic conditions for the period 1961-1990. The 30-year average time period option provides the cumulative average of individual year averages. Finally, three future time periods (2020s, 2050s, and 2080s) can be selected with additional options for selecting among GCMs and IPCC emissions scenarios.

Page | 20
3.3.1 Geographic Area Selection
Geographic area selection allows the user to produce query results only for specified countries or regions. Very small countries with extents of less than 10 pixels at 5 arc-minute resolutions (approx. < 100 km2) are aggregated in the category Rest of the World. For Russia, USA, China, Brazil, India, Australia and Canada first level sub-national divisions (provinces) can be selected as well. Figure 9 displays the screen appearance. Individual countries, regions or the world can be ticked on or off. By Clicking on the arrow to the right of the region, underlying countries or provinces appear. Appendix 6 provides detailed region and country list and for the 8 large countries province lists.
Figure 9 Select Administrative Unit
Page | 21
3.3.2 Geographic masks
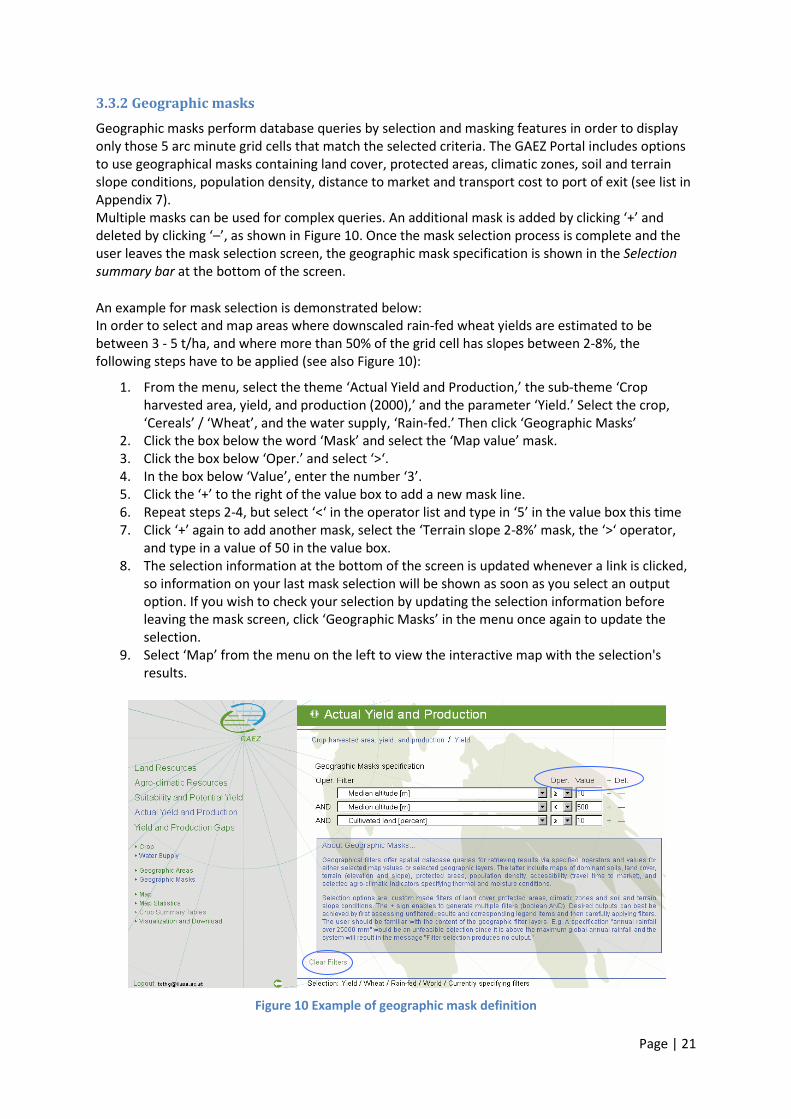
Geographic masks perform database queries by selection and masking features in order to display only those 5 arc minute grid cells that match the selected criteria. The GAEZ Portal includes options to use geographical masks containing land cover, protected areas, climatic zones, soil and terrain slope conditions, population density, distance to market and transport cost to port of exit (see list in Appendix 7). Multiple masks can be used for complex queries. An additional mask is added by clicking ‘+’ and deleted by clicking ‘–’, as shown in Figure 10. Once the mask selection process is complete and the user leaves the mask selection screen, the geographic mask specification is shown in the Selection summary bar at the bottom of the screen.
An example for mask selection is demonstrated below: In order to select and map areas where downscaled rain-fed wheat yields are estimated to be between 3 - 5 t/ha, and where more than 50% of the grid cell has slopes between 2-8%, the following steps have to be applied (see also Figure 10):
1. From the menu, select the theme ‘Actual Yield and Production,’ the sub-theme ‘Crop harvested area, yield, and production (2000),’ and the parameter ‘Yield.’ Select the crop, ‘Cereals’ / ‘Wheat’, and the water supply, ‘Rain-fed.’ Then click ‘Geographic Masks’
2. Click the box below the word ‘Mask’ and select the ‘Map value’ mask. 3. Click the box below ‘Oper.’ and select ‘>‘. 4. In the box below ‘Value’, enter the number ‘3’. 5. Click the ‘+’ to the right of the value box to add a new mask line. 6. Repeat steps 2-4, but select ‘<‘ in the operator list and type in ‘5’ in the value box this time 7. Click ‘+’ again to add another mask, select the ‘Terrain slope 2-8%’ mask, the ‘>‘ operator,
and type in a value of 50 in the value box. 8. The selection information at the bottom of the screen is updated whenever a link is clicked,
so information on your last mask selection will be shown as soon as you select an output option. If you wish to check your selection by updating the selection information before leaving the mask screen, click ‘Geographic Masks’ in the menu once again to update the selection.
9. Select ‘Map’ from the menu on the left to view the interactive map with the selection's results.
Figure 10 Example of geographic mask definition

Page | 22
When masking by parameter classes, acronyms or numbers corresponding to the desired class mask as specified in Table 2 must be inserted in the ‘Value’ field. Desired results can best be achieved by first assessing unmasked results and corresponding legend items before carefully applying masks. Future versions of the GAEZ Portal will provide a drop-down list of possible value selections. Note geographic masks remain active for subsequent output selections until they are cleared. By
selecting ‘Clear’ below the active masks, geographic mask specifications are removed. Clicking on the GAEZ logo at the top of the page clears all active selections, resetting the system.
Table 2 Mask options by parameter classes
Dominant soil classes Protection Classes Thermal climate classes Acrisols Soils [AC] Alisols Soils [AL] Andosols Soils [AN] Arenosols Soils [AR] Anthrosols Soils [AT] Chernozems Soils [CH] Calcisols Soils [CL] Cambisols Soils [CM] Fluvisols Soils [FL] Ferralsols Soils [FR] Gleysols Soils [GL] Greyzems Soils [GR] Gypsisols Soils [GY] Histosols Soils [HS] Kastanozems Soils [KS] Leptosols Soils [LP] Luvisols Soils [LV] Lixisols Soils [LX] Nitisols Soils [NT] Podzoluvisols Soils[PD] Phaeozems Soils [PH] Planosols Soils [PL] Plinthosols Soils [PT] Podzols Soils [PZ] Regosols Soils [RG] Solonchaks Soils [SC] Solonetz Soils [SN] Vertisols Soils [VR]
1. IUCN Ia Strict Nature Reserve 2. IUCN Ib Wilderness Area 3. IUCN II National Park 4. IUCN III Natural Monument 5. IUCN IV Habitat/Species Management Area 6. IUCN V Protected Landscape/ Seascape 7. IUCN VI Managed Resource Protected Area 8. Ramsar (Wetlands) Convention World Heritage Convention 9. World Heritage Convention 10. UNESCO-MAB Biosphere Reserves 11. ASEAN Heritage 12. Natura 2000 /restricted agricultural use 13. Natura 2000 strict protection 14. National (non-forest habitat) 15. National (forest habitat)
1.Tropics, lowland 2.Tropics, highland 3.Subtropics, summer rainfall; 4.Subtropics, winter rainfall; 5.Subtropics, low rainfall; 6.Temperate, oceanic; 7.Temperate, sub-continental; 8.Temperate, continental; 9.Boreal, oceanic; 10.Boreal, sub-continental; 11.Noreal, continental; 12.Arctic
Protection Classes (restrictions for agricultural use)
Reference permafrost zones
1. Limited agricultural use; 2: No agricultural use.
1.Continuous 2.Discontinuous 3.Sporadic 4.No permafrost
Page | 23
Part 4: Data output formats (Output menu)
Sub-menu 3 provides options for the specification of data output formats. Items include Maps, Map statistics tables, Crop summary tables and Data visualization and download options. Spatial data available for each of the five GAEZ themes can be checked in the table provided in Appendix 9 (a special table for Suitability and Potential Yield in Appendix 10), and scrutinized prior to query selection. Data output can only be generated when all required parameters for the selected data have been specified. Otherwise a warning appears at the bottom of the white area: ‘Cannot produce results’ and an indication, which parameters have not yet been selected.
4.1 Map
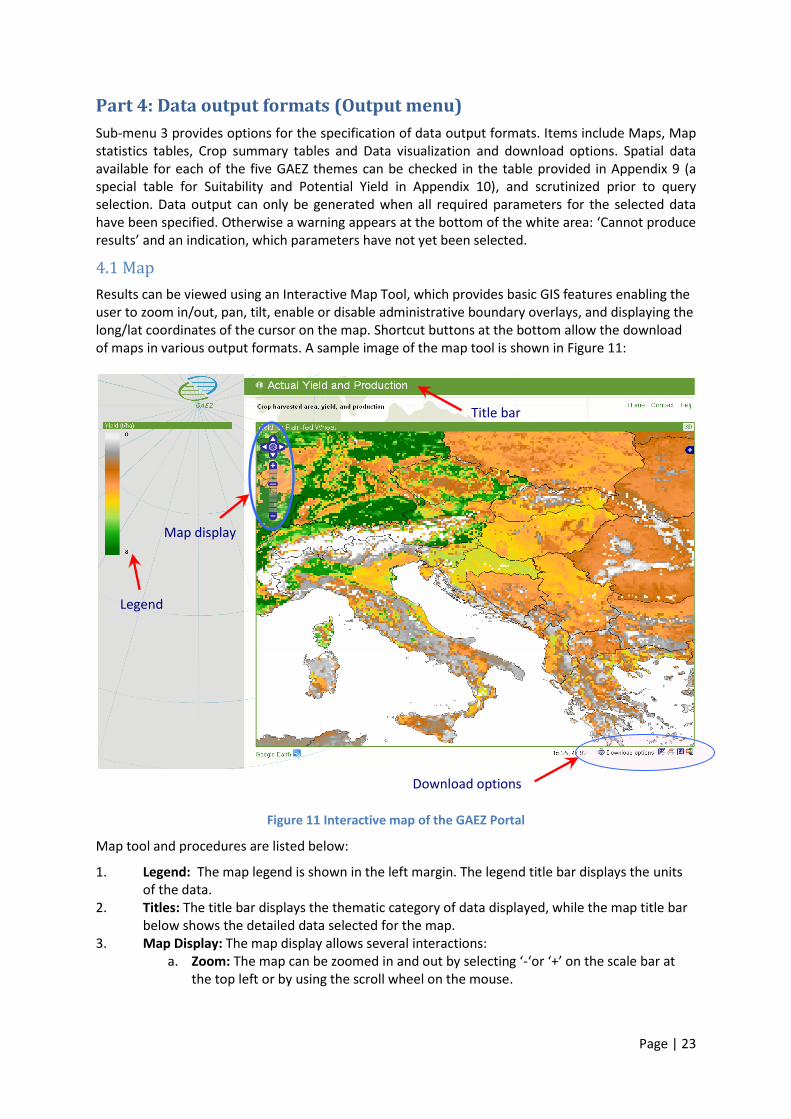
Results can be viewed using an Interactive Map Tool, which provides basic GIS features enabling the user to zoom in/out, pan, tilt, enable or disable administrative boundary overlays, and displaying the long/lat coordinates of the cursor on the map. Shortcut buttons at the bottom allow the download of maps in various output formats. A sample image of the map tool is shown in Figure 11:
Figure 11 Interactive map of the GAEZ Portal
Map tool and procedures are listed below:
1. Legend: The map legend is shown in the left margin. The legend title bar displays the units of the data.
2. Titles: The title bar displays the thematic category of data displayed, while the map title bar below shows the detailed data selected for the map.
3. Map Display: The map display allows several interactions: a. Zoom: The map can be zoomed in and out by selecting ‘-‘or ‘+’ on the scale bar at
the top left or by using the scroll wheel on the mouse.
Legend
Title bar
Map display
Download options
Page | 24
b. Pan: The map can be moved by holding the left mouse button and dragging the map or by using the arrow buttons on the top left of the map display. The centre button returns the map to a full view.
c. Pixel data: The data value of any grid cell can be obtained by clicking the left mouse button while the cursor is at the desired location. The value is shown below the map and coordinates are displayed.
d. Administrative overlay: Administrative boundaries can be activated or deactivated by selecting the ‘+’ sign on the upper right side of the map.
e. Selection summary is shown below the map.
4. Information Display Area: The area just below the map area is used to display information about the current cursor location (in longitude/latitude) and shortcut buttons for map and legend download in several formats. These will be discussed in detail in the Visualization and download chapter.
5. The selection can be modified by clicking back to the selection menu using the button.
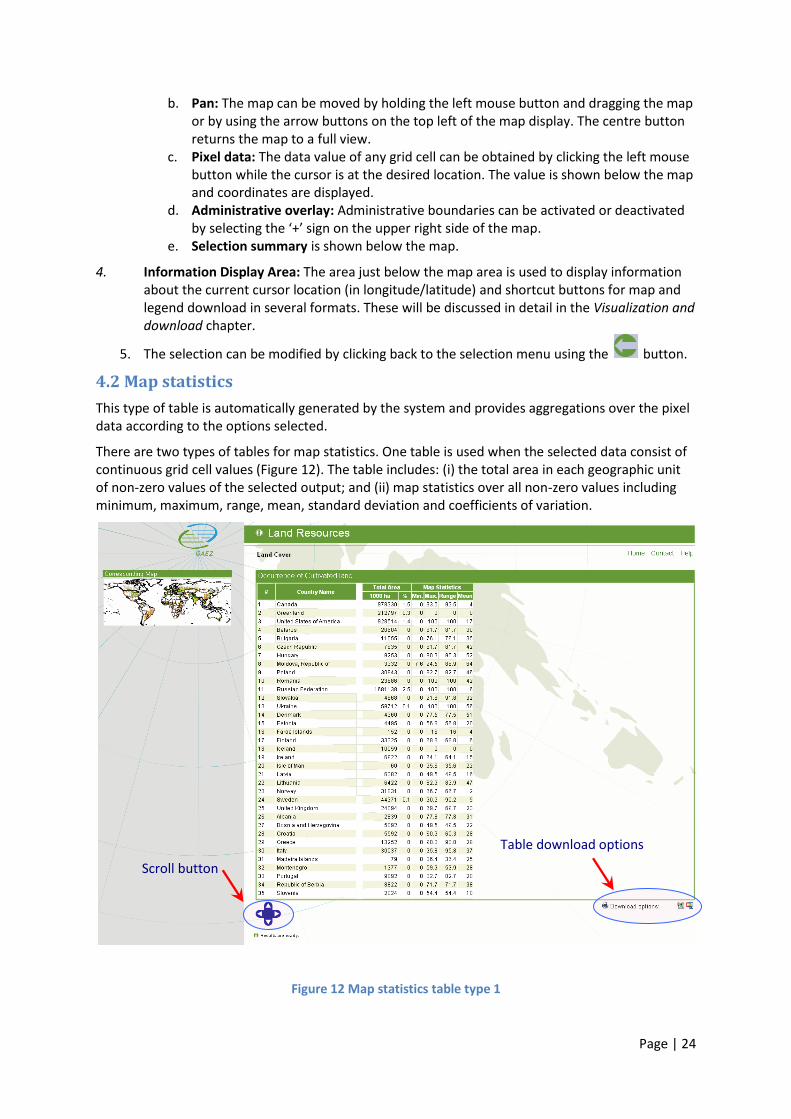
4.2 Map statistics
This type of table is automatically generated by the system and provides aggregations over the pixel data according to the options selected.
There are two types of tables for map statistics. One table is used when the selected data consist of continuous grid cell values (Figure 12). The table includes: (i) the total area in each geographic unit of non-zero values of the selected output; and (ii) map statistics over all non-zero values including minimum, maximum, range, mean, standard deviation and coefficients of variation.
Figure 12 Map statistics table type 1
Table download options
Scroll button
Page | 25
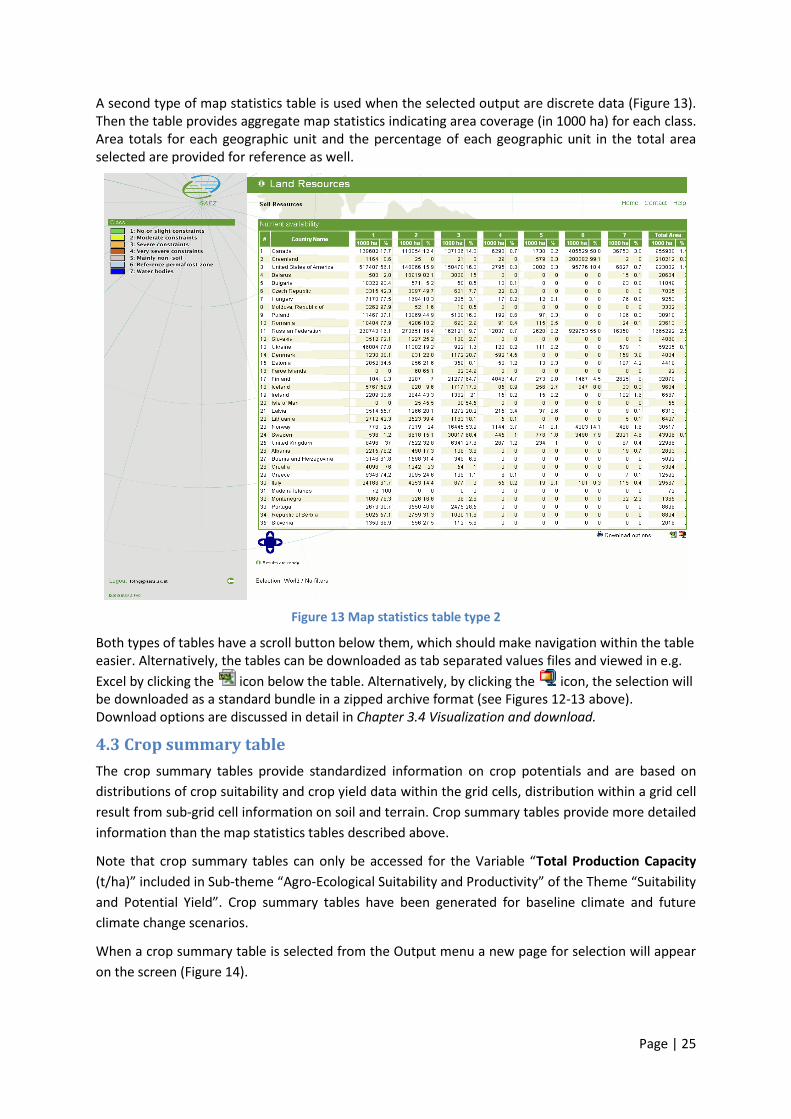
A second type of map statistics table is used when the selected output are discrete data (Figure 13). Then the table provides aggregate map statistics indicating area coverage (in 1000 ha) for each class. Area totals for each geographic unit and the percentage of each geographic unit in the total area selected are provided for reference as well.
Figure 13 Map statistics table type 2
Both types of tables have a scroll button below them, which should make navigation within the table easier. Alternatively, the tables can be downloaded as tab separated values files and viewed in e.g.
Excel by clicking the icon below the table. Alternatively, by clicking the icon, the selection will be downloaded as a standard bundle in a zipped archive format (see Figures 12-13 above). Download options are discussed in detail in Chapter 3.4 Visualization and download.
4.3 Crop summary table
The crop summary tables provide standardized information on crop potentials and are based on
distributions of crop suitability and crop yield data within the grid cells, distribution within a grid cell
result from sub-grid cell information on soil and terrain. Crop summary tables provide more detailed
information than the map statistics tables described above.
Note that crop summary tables can only be accessed for the Variable “Total Production Capacity
(t/ha)” included in Sub-theme “Agro-Ecological Suitability and Productivity” of the Theme “Suitability
and Potential Yield”. Crop summary tables have been generated for baseline climate and future
climate change scenarios.
When a crop summary table is selected from the Output menu a new page for selection will appear
on the screen (Figure 14).
Page | 26
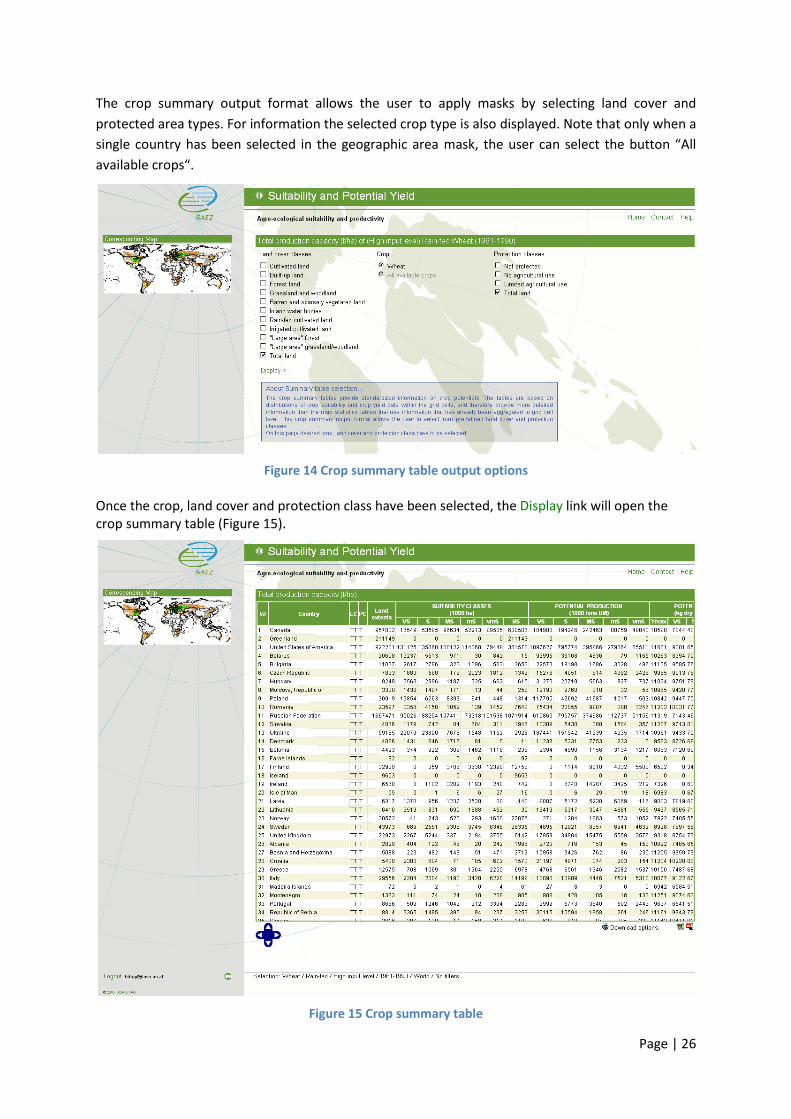
The crop summary output format allows the user to apply masks by selecting land cover and
protected area types. For information the selected crop type is also displayed. Note that only when a
single country has been selected in the geographic area mask, the user can select the button “All
available crops“.
Figure 14 Crop summary table output options
Once the crop, land cover and protection class have been selected, the Display link will open the crop summary table (Figure 15).
Figure 15 Crop summary table

Page | 27
Columns of the crop summary table above contain information for selected geographic units:
Land Cover class (Column LC): Code Land cover class CU Cultivated land BU Built-up land FR Forest land GR Grassland and woodland NV Barren and sparsely vegetated land WB Inland water bodies CR Rain-fed cultivated land CI Irrigated cultivated land LF "Large area" forest land (i.e. forest share in grid cell > 33%) LG "Large area" grassland/woodland (i.e. grassland/woodland share in grid cell > 33%) TT Total land
Protection Class (column PC); Code Protection class N Not protected S Protected (no agricultural use) P Protected (limited agricultural use) T Total land
Land extents – describes the total land area for the selected land cover and protection class (1000 ha);
CO2 fertilization effect: r - rain-fed with CO2 fertilization effect r0 - rain-fed without CO2 fertilization effect I - irrigated with CO2 fertilization effect i0 - irrigated without CO2 fertilization effect
Suitability classes – given in 1000 ha, in various levels:
VS very suitable (80-100% of maximum attainable yield)
S suitable (60-80% of maximum attainable yield)
MS moderately suitable (40-60% of maximum attainable yield)
mS marginally suitable (20-40% of maximum attainable yield)
vmS very marginally (5-20% of maximum attainable yield)
NS not suitable (<5% of maximum attainable yield)
Suitability classes are defined at LUT level, i.e. when the yield of a chosen LUT in a given grid-cell falls in the ranges 80-100%, 60-80%, 40-60%, etc., the suitability class of that grid-cell is determined as respectively VS, S, MS, etc.
Potential production – given in tons of the selected produce in (DM) and provides grid cell output. Estimates shown as potential production by suitability class account for fallow requirements.
Potential yield – shows the maximum yield (Ymax) for the selected areas and the average potential yields (kg DM/ha) for the different suitability classes described above. Estimates shown as potential yield by suitability class are not reduced for fallow requirements. Net yields including fallow requirements are calculated as potential production.

Page | 28
Constraint factors applied to the agro-climatic yields are shown for each suitability classes. They include:
fc1 - thermal constraints
fc2 - moisture constraints
fc3 - agro-climatic constraints
fc4 - soil and terrain constraints Each constraint factor indicates the reduction factor applied to the agro-climatic yields due to the specific constraint environment. Values are provided in percentage of the agro-climatic yield * 100. For example an fc2 of 7500 means that yields can only reach 75% of the agro-climatic attainable yield due to moisture constraints.
Constraint factors are cumulative with the combined constraint factor being:
fct = 10000 * (fc1/10000)*(fc2/10000)*(fc3/10000)*(fc4/10000).
A cultivation factor is provided by suitability class. It indicates fallow period requirements for sustainable production and depends on temperature and moisture regime and soil type. The value is given in percentage * 100 with the maximum being 9000. For example a cultivation factor 9000 indicates a crop can be cultivated in 90% of the period considered, i.e. 9 years cultivation and 1 year fallow. A cultivation factor 2000 indicates a crop can be cultivated in 20% of the period considered, i.e. either one year cultivation and 4 years fallow or 2 years cultivation and 8 years fallow.
Water deficit (mm) is provided by suitability class VS, S, MS, mS, VmS with average, minimum and maximum levels over all grid-cells in the particular suitability class. Water deficit indicates the difference between rain-fed water supply and optimal crop water needs in the particular environment. It is thus a quantification of irrigation water requirements.
Finally the crop summary tables provide Area, Production and Yield of the following combined suitability classes: VS + S; VS + S + MS; and VS + S + MS + mS.
4.4 Visualization and download
Display options include viewing with the GAEZ Portal’s interactive maps or tables or viewing maps within the Google EarthTM application. Data can be downloaded in standard GIS formats and map images can be printed from the interactive map screen. Download options are available for all types of visualization formats.
4.4.1 Visualization
Visualization options are accessible by selecting display options indicated with the following icons below the interactive map:
(PNG) –displays the entire map as a png file, which can then be saved using the normal features of the browser for saving images;
(PNG) – displays the selected part of the map as a png file;
(PDF) – displays the map in a pdf file;
(PDF) – displays the selected part of the map in a pdf file;
(PNG) – Map legend as png image;
Images can also be printed directly from the interactive map screen, by clicking the (print) icon.

Page | 29
4.4.2 Download
Download options for maps and tables can be accessed by:
1. Selecting display options indicated with the following icons below the interactive map and selecting the “Save as…” option;
2. Selecting the “Visualization and download” option in Sub-menu 3, which provides further display and download options in addition to the ones discussed above:
Viewing maps within the Google EarthTM application. Here maps can be downloaded by selecting Save image as… from the File menu of the application;
Download raw data in ZIPped standard ASCII Grid format;
Standard bundle archive in a ZIP file. This contains a text file with the selection criteria, a map statistics file, the map and its legend in PNG format, and the map data in ASCII Grid format;
Selection summary as tab separated values file;
Map statistics as tab separated values file.
Page | 30
APPENDIXES
Appendix 1: User agreement
Use of the Global Agro-ecological Zones Portal (hereafter referred to as "GAEZ") constitutes the acceptance of these Terms and Conditions which take effect on the date of first access to the GAEZ Portal and download data. 1. General This User Agreement sets forth the terms and conditions of a license for you to access and use data from GAEZ. By accessing and/or using GAEZ, you consent and agree to comply with all of the terms and conditions of this User Agreement. The rights and obligations concerning use of GAEZ in accordance with this User Agreement are personal and are not transferable to any other person or entity. Terms and conditions of use of GAEZ may be modified. Please note that any such changes, modifications, or additions shall be governed by this User Agreement. The designations employed and the presentation of materials in GAEZ do not imply the expression of any opinion whatsoever on the part of the Food and Agriculture Organization of the United Nations (FAO) or the International Institute for Applied Systems Analysis (IIASA) concerning the legal status of any country, territory, city or area or its authorities, or concerning the delimitation of its frontiers or boundaries. 2. Usage GAEZ contains copyrighted material and/or other proprietary information and thus is protected by intellectual property agreements and copyright laws and regulations worldwide. Permission to access and use the materials contained in GAEZ solely for scientific analyses or research provided that such use is in accordance with this User Agreement is hereby granted. Reproduction and dissemination of material contained in GAEZ for educational, research, personal or other noncommercial purposes are authorized without any prior written permission from the copyright holders, provided IIASA and FAO are fully acknowledged. No part of GAEZ data may be downloaded, stored in a retrieval system or transmitted by any means for resale or other commercial purposes without written permission of the copyright holders. If any information or resources on this site are attributed to a site or source external to IIASA and FAO, permission must be sought from that organization before the material can be reused. If you wish to use the information obtained from the GAEZ for such commercial purposes, please contact IIASA/FAO directly using the contact details below in section 7.
Use for any other purpose is expressly prohibited without written permission of the copyright holders.
3. Copyrights and ownership IIASA and FAO are the sole and exclusive owners of all right, title and interest, including trademarks, copyrights, trade names, trade secrets and other intellectual property rights, contained in the data and software of GAEZ. 4. Acknowledgements and citation Full acknowledgement and citation in any materials or publications derived in part or in whole from GAEZ data is required. Full acknowledgement and referencing of all sources must be included in any documentation using any of the material contained in the GAEZ Portal, as follows: IIASA/FAO, 2010. Global Agro-ecological Zones (GAEZ v3.0). IIASA, Laxenburg, Austria and FAO, Rome, Italy. 5. Disclaimer of Warranty; Limitations on Liability

Page | 31
The official IIASA Disclaimer can be read here. The official FAO Disclaimer can be read here. In addition, GAEZ requires: NEITHER IIASA OR FAO, OR ANY OF THEIR RESPECTIVE EMPLOYEES, THIRD-PARTY CONTENT PROVIDERS, OR LICENSORS WARRANT THAT ACCESS TO AND USE OF GAEZ WILL BE FREE FROM INTERRUPTIONS OR FREE FROM ERRORS, NOR THAT ANY INFORMATION ACCESSIBLE FROM OR RELATED TO THE DATA IS FREE OF VIRUSES, WORMS, OR OTHER HARMFUL COMPONENTS; NO WARRANTY IS MADE AS TO THE RESULTS THAT MAY BE OBTAINED FROM USE OF GAEZ, OR AS TO THE ACCURACY, RELIABILITY, OR CONTENT OF ANY INFORMATION OR SERVICE PROVIDED THROUGH GAEZ. GAEZ IS PROVIDED "AS IS" WITHOUT ANY WARRANTIES OF ANY KIND, EITHER EXPRESS OR IMPLIED, INCLUDING BUT NOT LIMITED TO WARRANTIES OF TITLE OR IMPLIED WARRANTIES OF MARCHANTABILITY OR FITNESS FOR A PARTICULAR PURPOSE. FURTHERMORE, IIASA AND FAO CAN CHANGE THE CONTENT OF GAEZ WITHOUT PRIOR NOTIFICATION. 6. Termination IIASA/FAO may terminate this User Agreement at any time, effective immediately, with or without prior notice. Termination of this Agreement automatically terminates your license to use GAEZ and any content or other material contained therein. 7. Contact information For any questions about any of the terms of this User Agreement, please contact the IIASA at: Land Use Change and Agriculture Program IIASA -International Institute for Applied Systems Analysis Schloßplatz 1 A-2361 Laxenburg, AUSTRIA Tel: +43 (0)2236 807 234 Fax: +43 (0)2236 807 533 E-mail: [email protected]
Page | 32
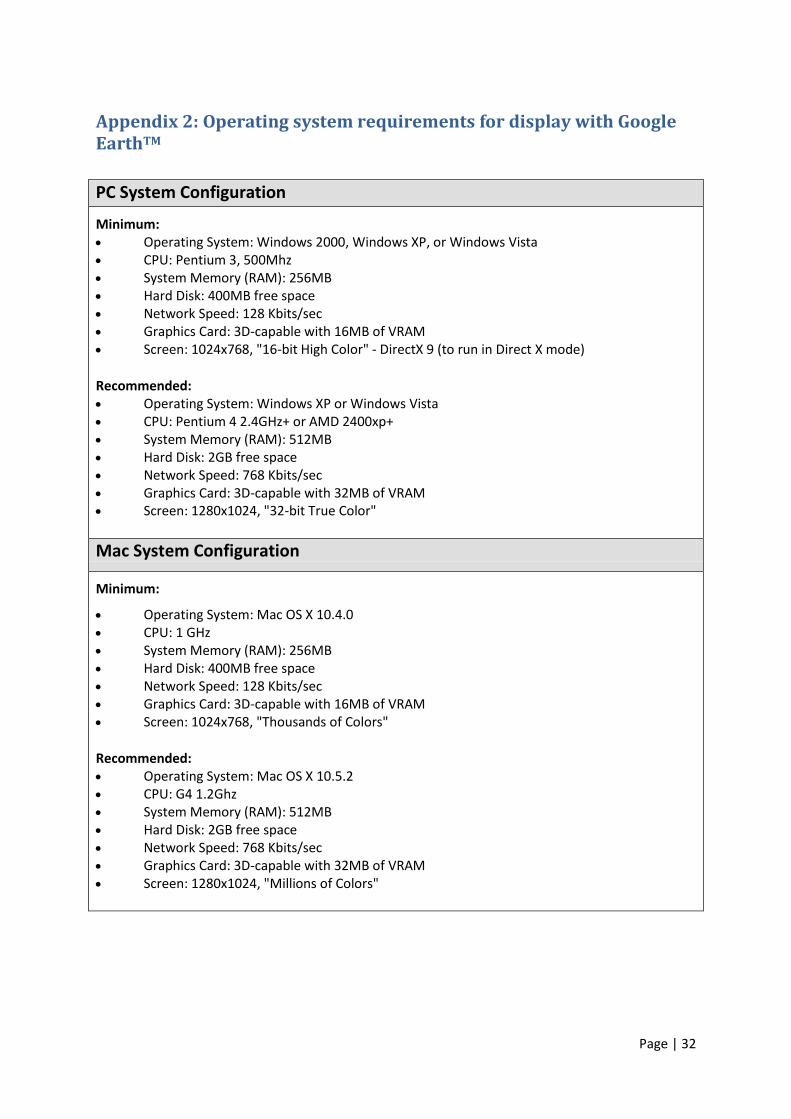
Appendix 2: Operating system requirements for display with Google EarthTM
PC System Configuration
Minimum: Operating System: Windows 2000, Windows XP, or Windows Vista CPU: Pentium 3, 500Mhz System Memory (RAM): 256MB Hard Disk: 400MB free space Network Speed: 128 Kbits/sec Graphics Card: 3D-capable with 16MB of VRAM Screen: 1024x768, "16-bit High Color" - DirectX 9 (to run in Direct X mode)
Recommended: Operating System: Windows XP or Windows Vista CPU: Pentium 4 2.4GHz+ or AMD 2400xp+ System Memory (RAM): 512MB Hard Disk: 2GB free space Network Speed: 768 Kbits/sec Graphics Card: 3D-capable with 32MB of VRAM Screen: 1280x1024, "32-bit True Color"
Mac System Configuration
Minimum:
Operating System: Mac OS X 10.4.0 CPU: 1 GHz System Memory (RAM): 256MB Hard Disk: 400MB free space Network Speed: 128 Kbits/sec Graphics Card: 3D-capable with 16MB of VRAM Screen: 1024x768, "Thousands of Colors"
Recommended: Operating System: Mac OS X 10.5.2 CPU: G4 1.2Ghz System Memory (RAM): 512MB Hard Disk: 2GB free space Network Speed: 768 Kbits/sec Graphics Card: 3D-capable with 32MB of VRAM Screen: 1280x1024, "Millions of Colors"
Page | 33
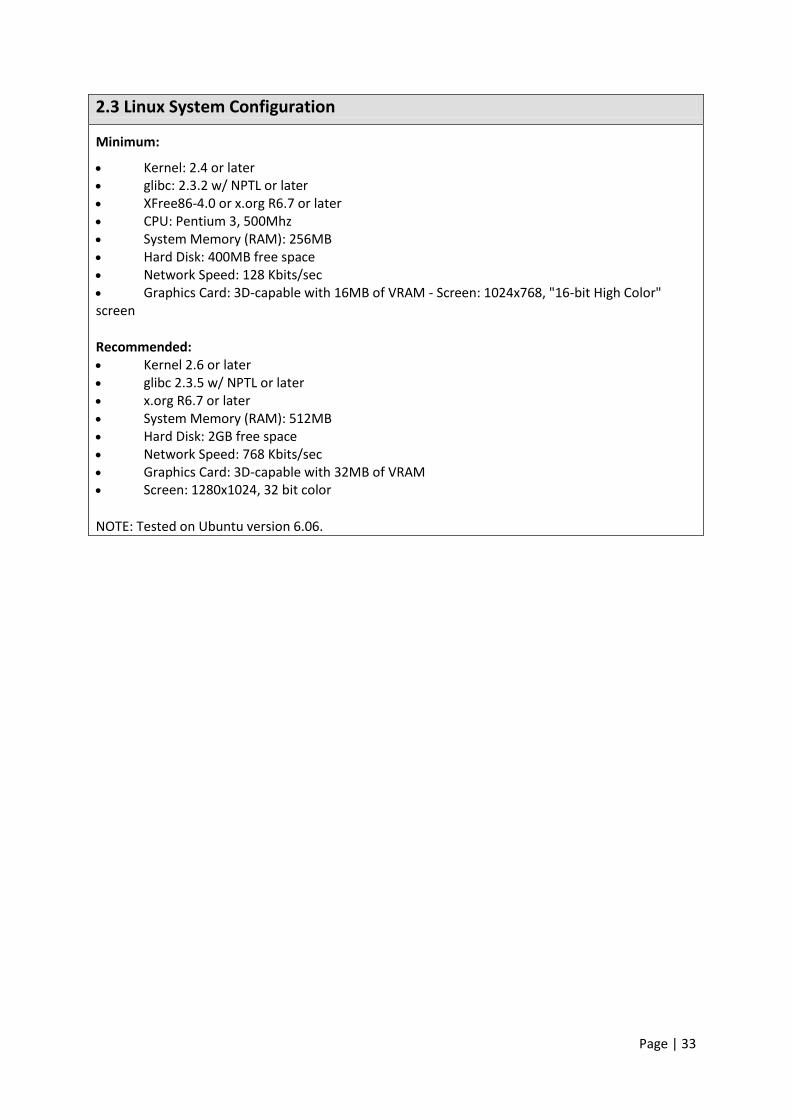
2.3 Linux System Configuration
Minimum:
Kernel: 2.4 or later glibc: 2.3.2 w/ NPTL or later XFree86-4.0 or x.org R6.7 or later CPU: Pentium 3, 500Mhz System Memory (RAM): 256MB Hard Disk: 400MB free space Network Speed: 128 Kbits/sec Graphics Card: 3D-capable with 16MB of VRAM - Screen: 1024x768, "16-bit High Color" screen
Recommended: Kernel 2.6 or later glibc 2.3.5 w/ NPTL or later x.org R6.7 or later System Memory (RAM): 512MB Hard Disk: 2GB free space Network Speed: 768 Kbits/sec Graphics Card: 3D-capable with 32MB of VRAM Screen: 1280x1024, 32 bit color
NOTE: Tested on Ubuntu version 6.06.
Page | 34
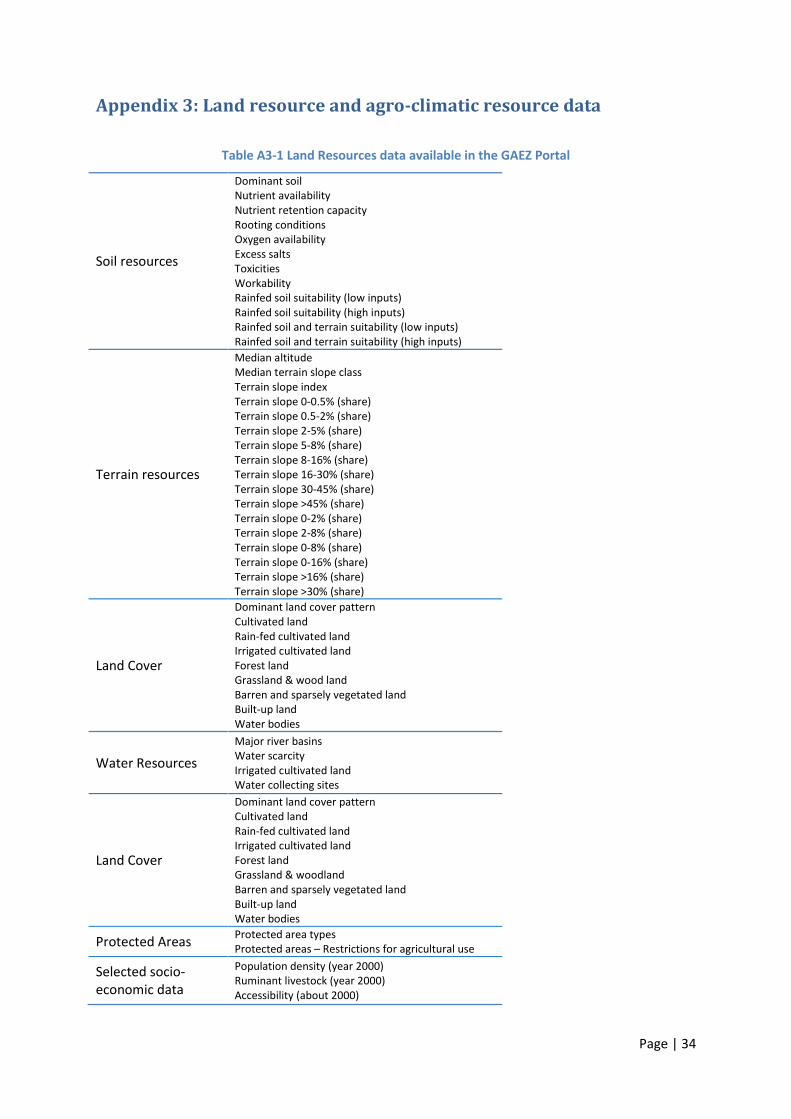
Appendix 3: Land resource and agro-climatic resource data
Table A3-1 Land Resources data available in the GAEZ Portal
Soil resources
Dominant soil Nutrient availability Nutrient retention capacity Rooting conditions Oxygen availability Excess salts Toxicities Workability Rainfed soil suitability (low inputs) Rainfed soil suitability (high inputs) Rainfed soil and terrain suitability (low inputs) Rainfed soil and terrain suitability (high inputs)
Terrain resources
Median altitude Median terrain slope class Terrain slope index Terrain slope 0-0.5% (share) Terrain slope 0.5-2% (share) Terrain slope 2-5% (share) Terrain slope 5-8% (share) Terrain slope 8-16% (share) Terrain slope 16-30% (share) Terrain slope 30-45% (share) Terrain slope >45% (share) Terrain slope 0-2% (share) Terrain slope 2-8% (share) Terrain slope 0-8% (share) Terrain slope 0-16% (share) Terrain slope >16% (share) Terrain slope >30% (share)
Land Cover
Dominant land cover pattern Cultivated land Rain-fed cultivated land Irrigated cultivated land Forest land Grassland & wood land Barren and sparsely vegetated land Built-up land Water bodies
Water Resources
Major river basins Water scarcity Irrigated cultivated land Water collecting sites
Land Cover
Dominant land cover pattern Cultivated land Rain-fed cultivated land Irrigated cultivated land Forest land Grassland & woodland Barren and sparsely vegetated land Built-up land Water bodies
Protected Areas Protected area types Protected areas – Restrictions for agricultural use
Selected socio-economic data
Population density (year 2000) Ruminant livestock (year 2000) Accessibility (about 2000)

Page | 35
The soil resources assessment is based on the Harmonized World Soil Data Base (HWSD).
The global terrain slope and aspect database has been compiled using elevation data from the Shuttle Radar Topography Mission (SRTM). The SRTM data is publicly available as 3 arc second (approximately 90 meters resolution at the equator) DEMs (CGIAR-CSI, 2006).
The SRTM data cover globe areas up to 60° latitude. For the remaining area elevation data from GTOPO30 (USGS, 2002) were used.
Additional Data documentation on terrain slope and aspect data is available from the HWSD web page (http://www.iiasa.ac.at/Research/LUC/External-World-soil-database/HTML/global-terrain-doc.html).
Table A3-2 Agro-climatic Resource data available in the GAEZ Portal
Thermal regime
Mean annual temperature Annual temperature range Thermal climates Thermal zones Temperature growing period Frost-free period Tsum during temperature growing period Tsum during frost-free period Air frost number Snow-adjusted air frost number Reference permafrost zones
Moisture conditions
Annual precipitation Annual precipitation (1961-90) CV (%) Annual precipitation (1961-90) SD (mm) Fournier index Fournier index (1961-90) CV (%) Fournier index (1961-90) SD (mm) Reference evapotranspiration Annual P/PET ratio Annual P/PET ratio (1961-90) CV (%) Annual P/PET ratio (1961-90) SD (ratio) Seasonal P/PET ratio (April to September) Seasonal P/PET ratio (October to March) Quarterly P/PET ratio (January to March) Quarterly P/PET ratio (April to June) Quarterly P/PET ratio (July to September) Quarterly P/PET ratio (October to December)
Growing period
Reference length of growing period Reference length of growing period zones Reference length of growing period CV (%) Reference length of growing period SD (days) Net primary production (rainfed) Net primary production (irrigated)

Page | 36
Appendix 4: Suitability and Potential Yield Assessment Data
Data in the Suitability and Potential Yield theme have been organized in the following categories:
Table A4-1 Suitability and Potential Yield data available in the GAEZ Portal
Agro-climatic yield
Agro-climatically attainable yield Crop/LUT selection by grid-cell Crop-specific actual evapotranspiration (mm) Crop-specific accumulated temperature SD of agro-climatically attainable yield (1961-90) CV of agro-climatically attainable yield (1961-90)
Climate yield constraints
Temperature constraint factor Moisture constraint factor Agro-climatic constraints factor Combined climate-related constraints factor Crop water deficit (mm)
Crop calendar Start crop growth cycle (day) Length of crop growth cycle (days)
Agro-ecological suitability and productivity
Crop suitability index (class) Crop suitability index (value) Total production capacity (t/ha) Crop suitability index (class) for current cultivated land Crop suitability index (value) for current cultivated land Potential productions capacity (t/ha) for current cultivated land
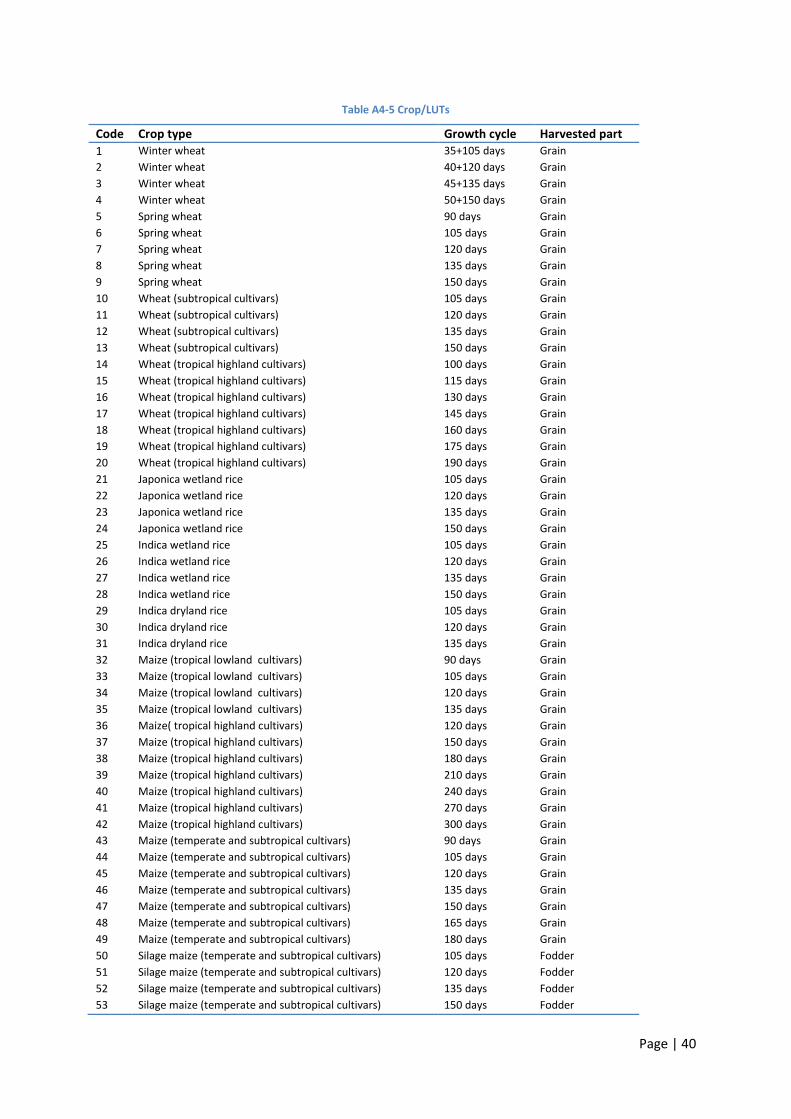
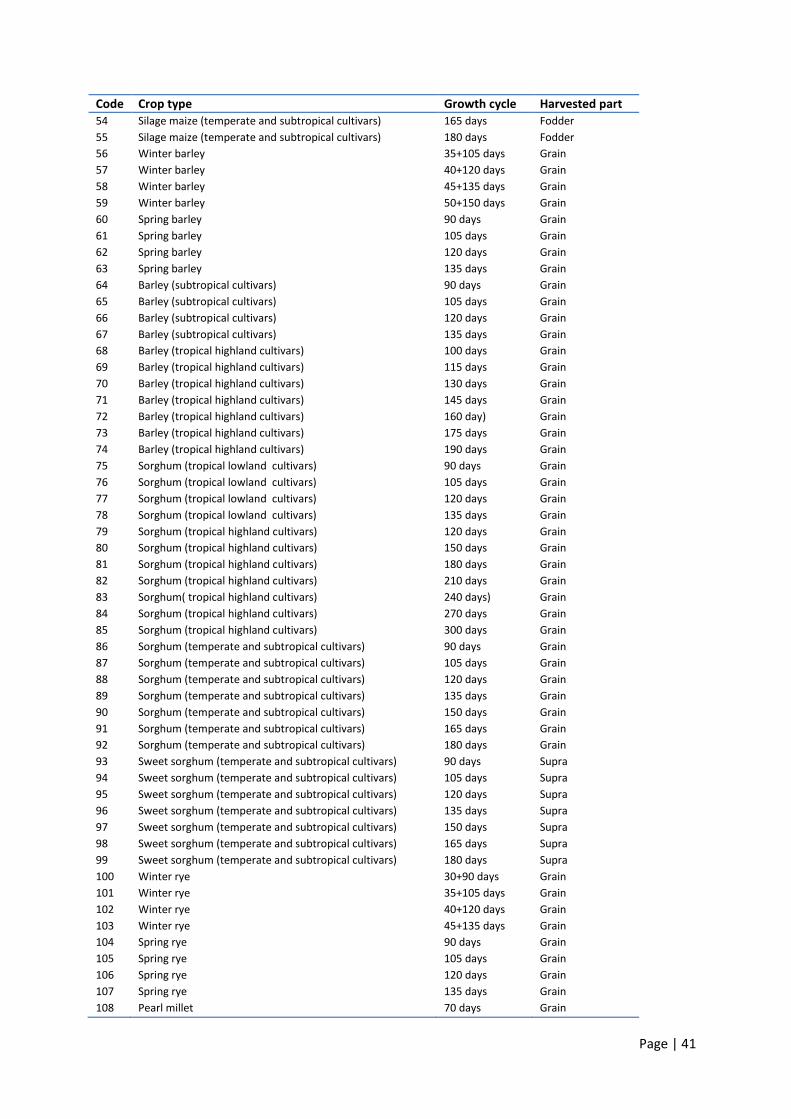
Depending on sub-theme and data selected suitability and potential yield data are available for 11 major crop groups (Table A4-1), 49 major crops (Table A4-2), 92 crop sub-types (LUT groups) (Table A4-3), and 280 crop/land utilization types (LUTs) (Table A4-4). Table 1 (in Section 3.1) provides an overview of crop availability for the different sub-themes.
Table A4-2 Crop groups
Code Crop group
1 Cereals
2 Roots and tubers
3 Sugar crops
4 Pulses
5 Oilcrops
6 Vegetables
7 Fruits
8 Fibre crops
9 Narcotics and stimulants
10 Fodder crops
11 Bioenergy feedstocks
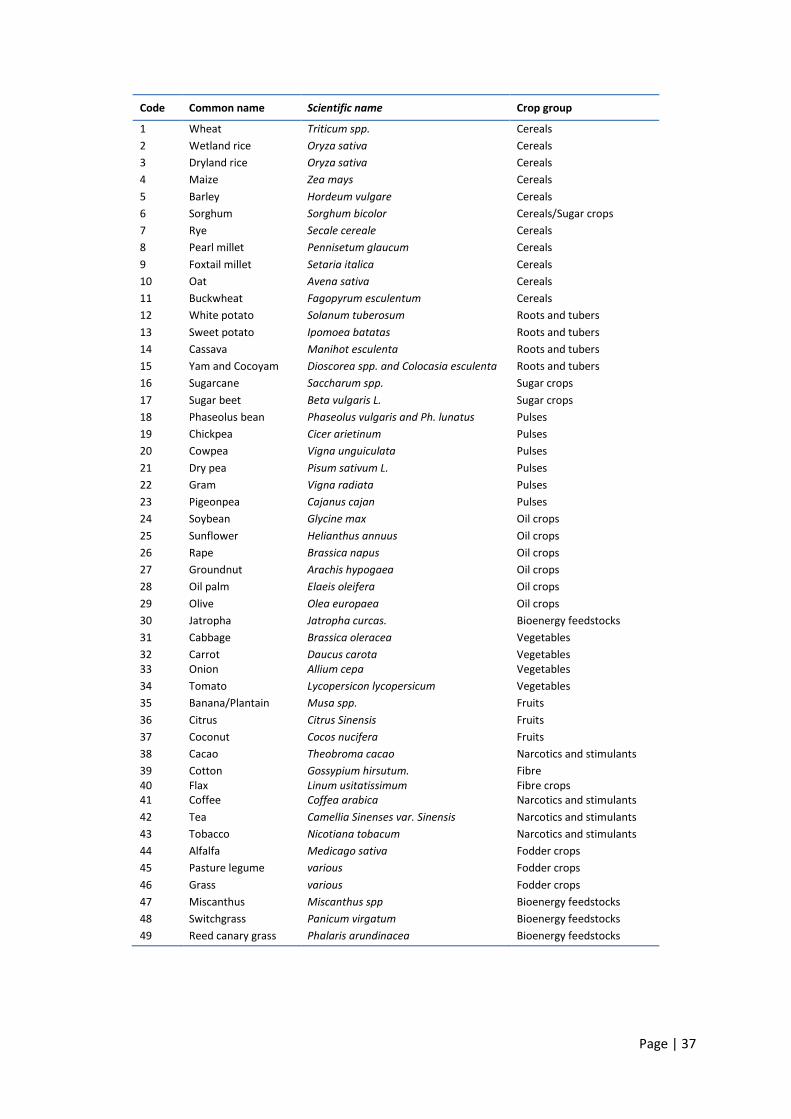
Table A4-3 Crops
Page | 37
Code Common name Scientific name Crop group
1 Wheat Triticum spp. Cereals
2 Wetland rice Oryza sativa Cereals
3 Dryland rice Oryza sativa Cereals
4 Maize Zea mays Cereals
5 Barley Hordeum vulgare Cereals
6 Sorghum Sorghum bicolor Cereals/Sugar crops
7 Rye Secale cereale Cereals
8 Pearl millet Pennisetum glaucum Cereals
9 Foxtail millet Setaria italica Cereals
10 Oat Avena sativa Cereals
11 Buckwheat Fagopyrum esculentum Cereals
12 White potato Solanum tuberosum Roots and tubers
13 Sweet potato Ipomoea batatas Roots and tubers
14 Cassava Manihot esculenta Roots and tubers
15 Yam and Cocoyam Dioscorea spp. and Colocasia esculenta Roots and tubers
16 Sugarcane Saccharum spp. Sugar crops
17 Sugar beet Beta vulgaris L. Sugar crops
18 Phaseolus bean Phaseolus vulgaris and Ph. lunatus Pulses
19 Chickpea Cicer arietinum Pulses
20 Cowpea Vigna unguiculata Pulses
21 Dry pea Pisum sativum L. Pulses
22 Gram Vigna radiata Pulses
23 Pigeonpea Cajanus cajan Pulses
24 Soybean Glycine max Oil crops
25 Sunflower Helianthus annuus Oil crops
26 Rape Brassica napus Oil crops
27 Groundnut Arachis hypogaea Oil crops
28 Oil palm Elaeis oleifera Oil crops
29 Olive Olea europaea Oil crops
30 Jatropha Jatropha curcas. Bioenergy feedstocks
31 Cabbage Brassica oleracea Vegetables
32 Carrot Daucus carota Vegetables 33 Onion Allium cepa Vegetables
34 Tomato Lycopersicon lycopersicum Vegetables
35 Banana/Plantain Musa spp. Fruits
36 Citrus Citrus Sinensis Fruits
37 Coconut Cocos nucifera Fruits
38 Cacao Theobroma cacao Narcotics and stimulants
39 Cotton Gossypium hirsutum. Fibre 40 Flax Linum usitatissimum Fibre crops 41 Coffee Coffea arabica Narcotics and stimulants
42 Tea Camellia Sinenses var. Sinensis Narcotics and stimulants
43 Tobacco Nicotiana tobacum Narcotics and stimulants
44 Alfalfa Medicago sativa Fodder crops
45 Pasture legume various Fodder crops
46 Grass various Fodder crops
47 Miscanthus Miscanthus spp Bioenergy feedstocks
48 Switchgrass Panicum virgatum Bioenergy feedstocks
49 Reed canary grass Phalaris arundinacea Bioenergy feedstocks
Page | 38
Table A4-4 Crop types
Code Common name Scientific name Crop group
1 Winter wheat Triticum spp. Cereals
2 Spring wheat Triticum spp. Cereals
3 Wheat (subtropical cultivars) Triticum spp. Cereals
4 Wheat (tropical cultivars) Triticum spp. Cereals
5 Japonica wetland rice Oryza japonica Cereals
6 Indica wetland rice Oryza indica Cereals
7 Indica dryland rice Oryza sativa Cereals
8 Maize (tropical lowland cultivars) Zea mays Cereals
9 Maize (tropical highland cultivars) Zea mays Cereals
10 Maize (temperate and subtropical cult.) Zea mays Cereals
11 Silage maize (temperate and subtropical cult.) Zea mays Fodder crops
12 Winter barley Hordeum vulgare Cereals
13 Spring Barley Hordeum vulgare Cereals
14 Barley (subtropical cultivars) Hordeum vulgare Cereals
15 Barley (tropical cultivars) Hordeum vulgare Cereals
16 Sorghum (tropical lowland cultivars) Sorghum bicolor Cereals
17 Sorghum (tropical highland cultivars) Sorghum bicolor Cereals
18 Sorghum (temperate and subtropical cult.) Sorghum bicolor Cereals
19 Sweet sorghum (temperate and subtropical cult.) Sorghum bicolor Sugar crops
20 Winter rye Secale cereale Cereals
21 Spring rye Secale cereale Cereals
22 Pearl millet Pennisetum glaucum Cereals
23 Foxtail millet Setaria italica Cereals
24 Spring oat Avena sativa Cereals
25 Buckwheat Fagopyrum esculentum Cereals
26 White potato Solanum tuberosum Roots and tubers
27 Sweet potato Ipomoea batatas Roots and tubers
28 Cassava Manihot esculenta Roots and tubers
29 White yam Dioscorea spp. Roots and tubers
30 Greater yam Dioscorea spp. Roots and tubers
31 Yellow yam Dioscorea spp. Roots and tubers
32 Cocoyam Colocasia esculenta Roots and tubers
33 Sugarcane Saccharum spp. Sugar crops
34 Sugar beet Beta vulgaris L. Sugar crops
35 Phaseolus bean (tropical lowland) Phaseolus vulgaris and Ph. lunatus Pulses
36 Phaseolus bean (tropical highland) Phaseolus vulgaris and Ph. lunatus Pulses
37 Phaseolus bean (temperate and subtropical cult.) Phaseolus vulgaris and Ph.lunatus Pulses
38 Chickpea Cicer arietinum Pulses
39 Chickpea (cold tolerant) Cicer arietinum Pulses
40 Cowpea Vigna unguiculata Pulses
41 Dry pea Pisum sativum L. Pulses
42 Gram Vigna radiate Pulses
43 Pigeonpea Cajanus cajan Pulses
44 Soybean (tropical and subtropical cult.) Glycine max Oilcrops
45 Soybean (temperate and subtropical cult.) Glycine max Oilcrops
46 Sunflower (tropical and subtropical cult.) Helianthus annuus Oilcrops
47 Sunflower (temperate and subtropical cult.) Helianthus annuus Oilcrops
48 Winter rape Brassica napus Oilcrops
49 Spring rape Brassica napus Oilcrops
50 Rabi rape Brassica napus Oilcrops
51 Groundnut Arachis hypogaea Oilcrops

Page | 39
Code Common name Scientific name Crop group
52 Oilpalm Elaeis oleifera Oilcrops
53 Olive Olea europaea Oilcrops
54 Jatropha Jatropha curcas Oilcrops 55 Cabbage Brassica oleracea Vegetables
56 Carrot (temperate and subtropical cultivars) Daucus carota Vegetables
57 Carrot (temperate and subtropical cultivars) Daucus carota Vegetables
58 Carrot (tropical cultivars) Daucus carota Vegetables
59 Onion (temperate and subtropical cultivars) Allium cepa Vegetables
60 Onion hibernating cultivar Allium cepa Vegetables
61 Onion (tropical cultivars) Allium cepa Vegetables
62 Tomato (temperate and subtropical cultivars) Lycopersicon lycopersicum Vegetables
63 Tomato (tropical and subtropical cultivars) Lycopersicon lycopersicum Vegetables
64 Banana/Plantain Musa spp. Fruits
65 Citrus Citrus sinensis Fruits
66 Coconut 1 (tall) Cocos nucifera Fruits
67 Coconut 2 (hybrid tall) Cocos nucifera Fruits
68 Coconut 3 (dwarf) Cocos nucifera Fruits
69 Cacao (comun) Theobroma cacao Narcotics and stimulants
70 Cacao (hybrid) Theobroma cacao Narcotics and stimulants
71 Cotton (tropical cultivars) Gossypium spp. Fibre crops
72 Cotton (temperate and subtropical cult.) Gossypium spp. Fibre crops
73 Flax Linum usitatissimum Fibre crops
74 Coffee arabica Coffea arabica Narcotics and stimulants
75 Coffee robusta Coffea robusta Narcotics and stimulants
76 Tea (china tea) Camellia Sinenses var. Sinensis Narcotics and stimulants
77 Tea (hybrid tea) Sinensis and Assamica Narcotics and stimulants
78 Tea (assam tea) Camellia sinensis var. assamica Narcotics and stimulants
79 Tobacco (tropical cultivars) Nicotiana tobacum Narcotics and stimulants
80 Tobacco (temperate and subtropical cult.) Nicotiana tobacum Narcotics and stimulants
81 Alfalfa (temperate and subtropical cult.) Medicago sativa Fodder crops
82 Alfalfa (tropical cultivars) Medicago sativa Fodder crops
83 Pasture legumes (temp. and subtropical cult.) various Fodder crops
84 Pasture legumes (tropical and subtropical cult.) various Fodder crops
85 Pasture grasses (C3/I cultivars) various Fodder crops
86 Pasture grasses (C3/II cultivars) various Fodder crops
87 Pasture grasses (C4/II cultivars) various Fodder crops
88 Pasture grasses (C4/I cultivars) various Fodder crops 89 Miscanthus (C4/II) Miscanthus spp Bioenergy feedstocks
90 Miscanthus (C4/I) Miscanthus spp Bioenergy feedstocks
91 Switchgrass Panicum virgatum Bioenergy feedstocks
92 Reed canary grass Phalaris arundinacea Bioenergy feedstocks
Page | 40
Table A4-5 Crop/LUTs
Code Crop type Growth cycle Harvested part
1 Winter wheat 35+105 days Grain
2 Winter wheat 40+120 days Grain
3 Winter wheat 45+135 days Grain
4 Winter wheat 50+150 days Grain
5 Spring wheat 90 days Grain
6 Spring wheat 105 days Grain
7 Spring wheat 120 days Grain
8 Spring wheat 135 days Grain
9 Spring wheat 150 days Grain
10 Wheat (subtropical cultivars) 105 days Grain
11 Wheat (subtropical cultivars) 120 days Grain
12 Wheat (subtropical cultivars) 135 days Grain
13 Wheat (subtropical cultivars) 150 days Grain
14 Wheat (tropical highland cultivars) 100 days Grain
15 Wheat (tropical highland cultivars) 115 days Grain
16 Wheat (tropical highland cultivars) 130 days Grain
17 Wheat (tropical highland cultivars) 145 days Grain
18 Wheat (tropical highland cultivars) 160 days Grain
19 Wheat (tropical highland cultivars) 175 days Grain
20 Wheat (tropical highland cultivars) 190 days Grain
21 Japonica wetland rice 105 days Grain
22 Japonica wetland rice 120 days Grain
23 Japonica wetland rice 135 days Grain
24 Japonica wetland rice 150 days Grain
25 Indica wetland rice 105 days Grain
26 Indica wetland rice 120 days Grain
27 Indica wetland rice 135 days Grain
28 Indica wetland rice 150 days Grain
29 Indica dryland rice 105 days Grain
30 Indica dryland rice 120 days Grain
31 Indica dryland rice 135 days Grain
32 Maize (tropical lowland cultivars) 90 days Grain
33 Maize (tropical lowland cultivars) 105 days Grain
34 Maize (tropical lowland cultivars) 120 days Grain
35 Maize (tropical lowland cultivars) 135 days Grain
36 Maize( tropical highland cultivars) 120 days Grain
37 Maize (tropical highland cultivars) 150 days Grain
38 Maize (tropical highland cultivars) 180 days Grain
39 Maize (tropical highland cultivars) 210 days Grain
40 Maize (tropical highland cultivars) 240 days Grain
41 Maize (tropical highland cultivars) 270 days Grain
42 Maize (tropical highland cultivars) 300 days Grain
43 Maize (temperate and subtropical cultivars) 90 days Grain
44 Maize (temperate and subtropical cultivars) 105 days Grain
45 Maize (temperate and subtropical cultivars) 120 days Grain
46 Maize (temperate and subtropical cultivars) 135 days Grain
47 Maize (temperate and subtropical cultivars) 150 days Grain
48 Maize (temperate and subtropical cultivars) 165 days Grain
49 Maize (temperate and subtropical cultivars) 180 days Grain
50 Silage maize (temperate and subtropical cultivars) 105 days Fodder
51 Silage maize (temperate and subtropical cultivars) 120 days Fodder
52 Silage maize (temperate and subtropical cultivars) 135 days Fodder
53 Silage maize (temperate and subtropical cultivars) 150 days Fodder
Page | 41
Code Crop type Growth cycle Harvested part
54 Silage maize (temperate and subtropical cultivars) 165 days Fodder
55 Silage maize (temperate and subtropical cultivars) 180 days Fodder
56 Winter barley 35+105 days Grain
57 Winter barley 40+120 days Grain
58 Winter barley 45+135 days Grain
59 Winter barley 50+150 days Grain
60 Spring barley 90 days Grain
61 Spring barley 105 days Grain
62 Spring barley 120 days Grain
63 Spring barley 135 days Grain
64 Barley (subtropical cultivars) 90 days Grain
65 Barley (subtropical cultivars) 105 days Grain
66 Barley (subtropical cultivars) 120 days Grain
67 Barley (subtropical cultivars) 135 days Grain
68 Barley (tropical highland cultivars) 100 days Grain
69 Barley (tropical highland cultivars) 115 days Grain
70 Barley (tropical highland cultivars) 130 days Grain
71 Barley (tropical highland cultivars) 145 days Grain
72 Barley (tropical highland cultivars) 160 day) Grain
73 Barley (tropical highland cultivars) 175 days Grain
74 Barley (tropical highland cultivars) 190 days Grain
75 Sorghum (tropical lowland cultivars) 90 days Grain
76 Sorghum (tropical lowland cultivars) 105 days Grain
77 Sorghum (tropical lowland cultivars) 120 days Grain
78 Sorghum (tropical lowland cultivars) 135 days Grain
79 Sorghum (tropical highland cultivars) 120 days Grain
80 Sorghum (tropical highland cultivars) 150 days Grain
81 Sorghum (tropical highland cultivars) 180 days Grain
82 Sorghum (tropical highland cultivars) 210 days Grain
83 Sorghum( tropical highland cultivars) 240 days) Grain
84 Sorghum (tropical highland cultivars) 270 days Grain
85 Sorghum (tropical highland cultivars) 300 days Grain
86 Sorghum (temperate and subtropical cultivars) 90 days Grain
87 Sorghum (temperate and subtropical cultivars) 105 days Grain
88 Sorghum (temperate and subtropical cultivars) 120 days Grain
89 Sorghum (temperate and subtropical cultivars) 135 days Grain
90 Sorghum (temperate and subtropical cultivars) 150 days Grain
91 Sorghum (temperate and subtropical cultivars) 165 days Grain
92 Sorghum (temperate and subtropical cultivars) 180 days Grain
93 Sweet sorghum (temperate and subtropical cultivars) 90 days Supra
94 Sweet sorghum (temperate and subtropical cultivars) 105 days Supra
95 Sweet sorghum (temperate and subtropical cultivars) 120 days Supra
96 Sweet sorghum (temperate and subtropical cultivars) 135 days Supra
97 Sweet sorghum (temperate and subtropical cultivars) 150 days Supra
98 Sweet sorghum (temperate and subtropical cultivars) 165 days Supra
99 Sweet sorghum (temperate and subtropical cultivars) 180 days Supra
100 Winter rye 30+90 days Grain
101 Winter rye 35+105 days Grain
102 Winter rye 40+120 days Grain
103 Winter rye 45+135 days Grain
104 Spring rye 90 days Grain
105 Spring rye 105 days Grain
106 Spring rye 120 days Grain
107 Spring rye 135 days Grain
108 Pearl millet 70 days Grain
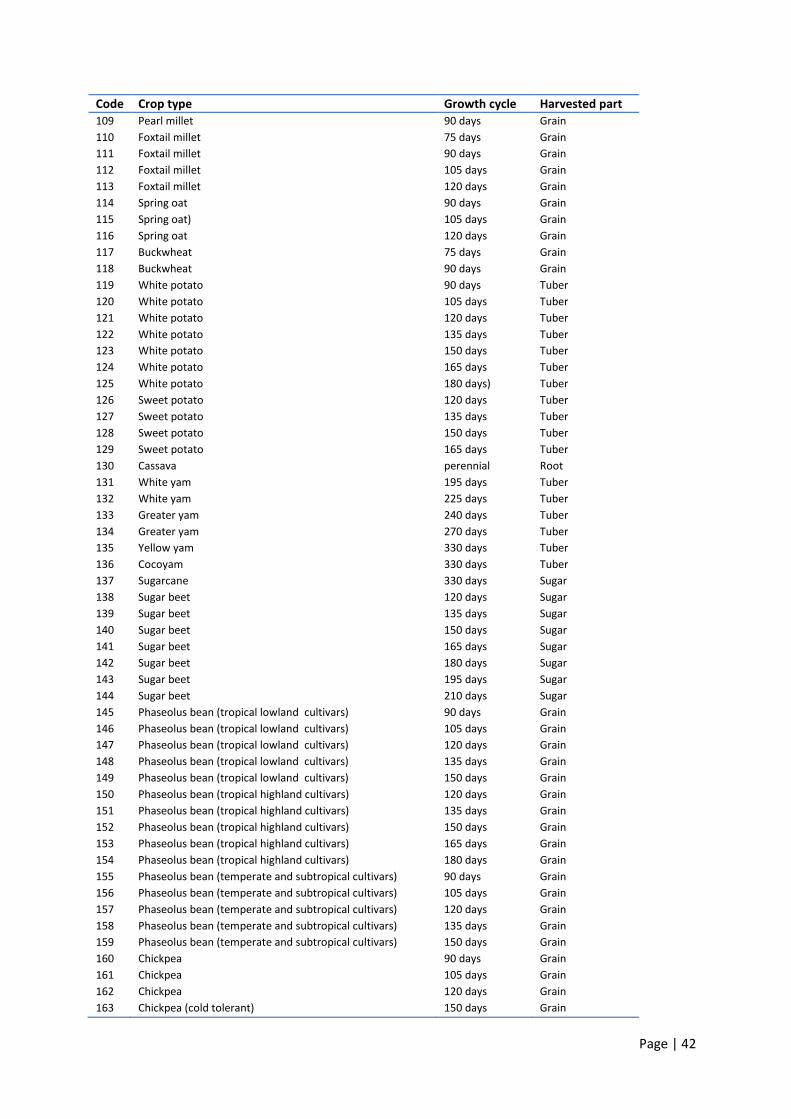
Page | 42
Code Crop type Growth cycle Harvested part
109 Pearl millet 90 days Grain
110 Foxtail millet 75 days Grain
111 Foxtail millet 90 days Grain
112 Foxtail millet 105 days Grain
113 Foxtail millet 120 days Grain
114 Spring oat 90 days Grain
115 Spring oat) 105 days Grain
116 Spring oat 120 days Grain
117 Buckwheat 75 days Grain
118 Buckwheat 90 days Grain
119 White potato 90 days Tuber
120 White potato 105 days Tuber
121 White potato 120 days Tuber
122 White potato 135 days Tuber
123 White potato 150 days Tuber
124 White potato 165 days Tuber
125 White potato 180 days) Tuber
126 Sweet potato 120 days Tuber
127 Sweet potato 135 days Tuber
128 Sweet potato 150 days Tuber
129 Sweet potato 165 days Tuber
130 Cassava perennial Root
131 White yam 195 days Tuber
132 White yam 225 days Tuber
133 Greater yam 240 days Tuber
134 Greater yam 270 days Tuber
135 Yellow yam 330 days Tuber
136 Cocoyam 330 days Tuber
137 Sugarcane 330 days Sugar
138 Sugar beet 120 days Sugar
139 Sugar beet 135 days Sugar
140 Sugar beet 150 days Sugar
141 Sugar beet 165 days Sugar
142 Sugar beet 180 days Sugar
143 Sugar beet 195 days Sugar
144 Sugar beet 210 days Sugar
145 Phaseolus bean (tropical lowland cultivars) 90 days Grain
146 Phaseolus bean (tropical lowland cultivars) 105 days Grain
147 Phaseolus bean (tropical lowland cultivars) 120 days Grain
148 Phaseolus bean (tropical lowland cultivars) 135 days Grain
149 Phaseolus bean (tropical lowland cultivars) 150 days Grain
150 Phaseolus bean (tropical highland cultivars) 120 days Grain
151 Phaseolus bean (tropical highland cultivars) 135 days Grain
152 Phaseolus bean (tropical highland cultivars) 150 days Grain
153 Phaseolus bean (tropical highland cultivars) 165 days Grain
154 Phaseolus bean (tropical highland cultivars) 180 days Grain
155 Phaseolus bean (temperate and subtropical cultivars) 90 days Grain
156 Phaseolus bean (temperate and subtropical cultivars) 105 days Grain
157 Phaseolus bean (temperate and subtropical cultivars) 120 days Grain
158 Phaseolus bean (temperate and subtropical cultivars) 135 days Grain
159 Phaseolus bean (temperate and subtropical cultivars) 150 days Grain
160 Chickpea 90 days Grain
161 Chickpea 105 days Grain
162 Chickpea 120 days Grain
163 Chickpea (cold tolerant) 150 days Grain
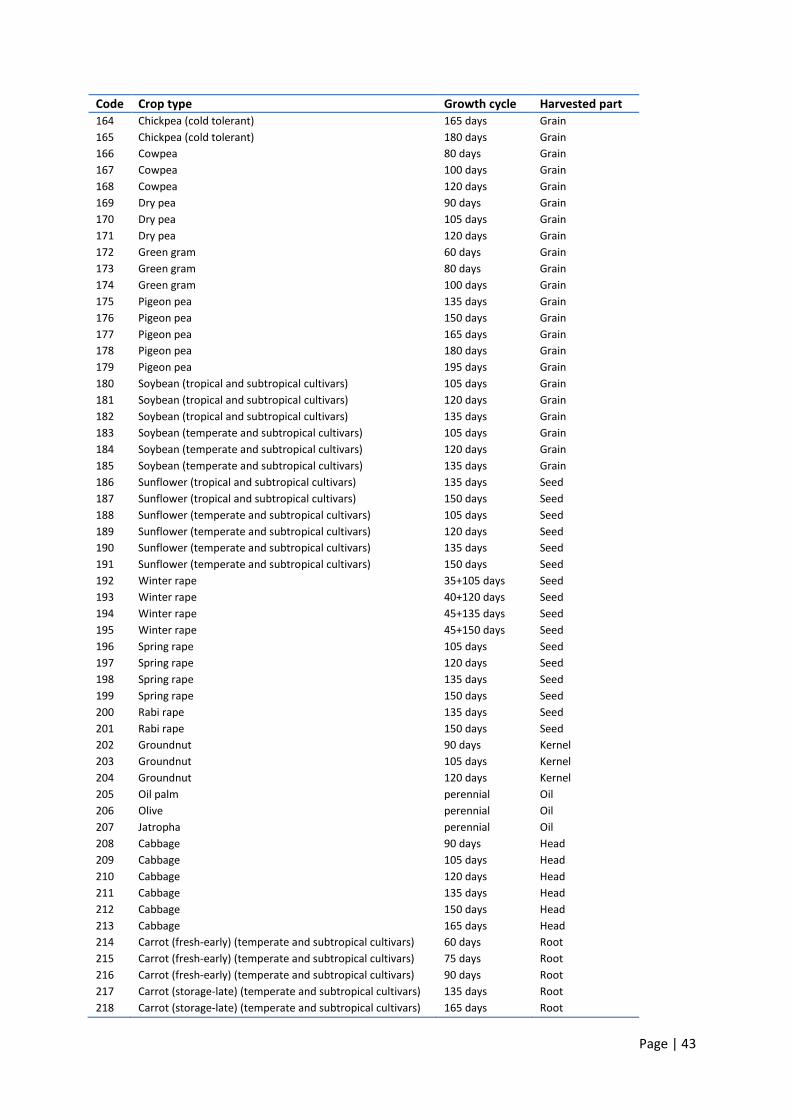
Page | 43
Code Crop type Growth cycle Harvested part
164 Chickpea (cold tolerant) 165 days Grain
165 Chickpea (cold tolerant) 180 days Grain
166 Cowpea 80 days Grain
167 Cowpea 100 days Grain
168 Cowpea 120 days Grain
169 Dry pea 90 days Grain
170 Dry pea 105 days Grain
171 Dry pea 120 days Grain
172 Green gram 60 days Grain
173 Green gram 80 days Grain
174 Green gram 100 days Grain
175 Pigeon pea 135 days Grain
176 Pigeon pea 150 days Grain
177 Pigeon pea 165 days Grain
178 Pigeon pea 180 days Grain
179 Pigeon pea 195 days Grain
180 Soybean (tropical and subtropical cultivars) 105 days Grain
181 Soybean (tropical and subtropical cultivars) 120 days Grain
182 Soybean (tropical and subtropical cultivars) 135 days Grain
183 Soybean (temperate and subtropical cultivars) 105 days Grain
184 Soybean (temperate and subtropical cultivars) 120 days Grain
185 Soybean (temperate and subtropical cultivars) 135 days Grain
186 Sunflower (tropical and subtropical cultivars) 135 days Seed
187 Sunflower (tropical and subtropical cultivars) 150 days Seed
188 Sunflower (temperate and subtropical cultivars) 105 days Seed
189 Sunflower (temperate and subtropical cultivars) 120 days Seed
190 Sunflower (temperate and subtropical cultivars) 135 days Seed
191 Sunflower (temperate and subtropical cultivars) 150 days Seed
192 Winter rape 35+105 days Seed
193 Winter rape 40+120 days Seed
194 Winter rape 45+135 days Seed
195 Winter rape 45+150 days Seed
196 Spring rape 105 days Seed
197 Spring rape 120 days Seed
198 Spring rape 135 days Seed
199 Spring rape 150 days Seed
200 Rabi rape 135 days Seed
201 Rabi rape 150 days Seed
202 Groundnut 90 days Kernel
203 Groundnut 105 days Kernel
204 Groundnut 120 days Kernel
205 Oil palm perennial Oil
206 Olive perennial Oil
207 Jatropha perennial Oil
208 Cabbage 90 days Head
209 Cabbage 105 days Head
210 Cabbage 120 days Head
211 Cabbage 135 days Head
212 Cabbage 150 days Head
213 Cabbage 165 days Head
214 Carrot (fresh-early) (temperate and subtropical cultivars) 60 days Root
215 Carrot (fresh-early) (temperate and subtropical cultivars) 75 days Root
216 Carrot (fresh-early) (temperate and subtropical cultivars) 90 days Root
217 Carrot (storage-late) (temperate and subtropical cultivars) 135 days Root
218 Carrot (storage-late) (temperate and subtropical cultivars) 165 days Root

Page | 44
Code Crop type Growth cycle Harvested part
219 Carrot (storage-late) (temperate and subtropical cultivars) 195 days Root
220 Carrot (fresh) (tropical cultivars) 75 days Root
221 Carrot (fresh) (tropical cultivars) 90 days Root
222 Carrot (fresh) (tropical cultivars) 105 days Root
223 Onion (temperate and subtropical cultivars) 120 days Bulb
224 Onion (temperate and subtropical cultivars) 135 days Bulb
225 Onion (temperate and subtropical cultivars) 150 days Bulb
226 Onion (temperate and subtropical cultivars) 165 days Bulb
227 Onion (temperate and subtropical cultivars) 180 days Bulb
228 Onion (hybernating) (temperate and subtropical cultivars) 45+105 days Bulb
229 Onion (hybernating) (temperate and subtropical cultivars) 60+120 days Bulb
230 Onion hybernating) (temperate and subtropical cultivars) 75+135 days Bulb
231 Onion (tropical cultivars) 90 days Bulb
232 Onion (tropical cultivars) 105 days Bulb
233 Onion) (tropical cultivars) 120 days Bulb
234 Onion (tropical cultivars) 135 days Bulb
235 Tomato (temperate and subtropical cultivars) 90 days Fruit
236 Tomato (temperate and subtropical cultivars) 105 days Fruit
237 Tomato (temperate and subtropical cultivars) 120 days Fruit
238 Tomato (temperate and subtropical cultivars) 135 days Fruit
239 Tomato (tropical and subtropical cultivars) 105 days Fruit
240 Tomato (tropical and subtropical cultivars) 120 days Fruit
241 Tomato (tropical and subtropical cultivars) 135 days Fruit
242 Banana/Plantain perennial Fruit
243 Citrus perennial Fruit
244 Coconut 1 (tall) perennial) Copra
245 Coconut 2 (hybrid tall) perennial Copra
246 Coconut 3 (dwarf) perennial Copra
247 Cacao (comun) perennial Beans
248 Cacao (hybrid) perennial Beans
249 Cotton (tropical cultivars) 135 days Fiber
250 Cotton (tropical cultivars) 150 days Fiber
251 Cotton (tropical cultivars) 165 days Fiber
252 Cotton (tropical cultivars) 180 days Fiber
253 Cotton (temperate and subtropical cultivars) 135 days Fiber
254 Cotton (temperate and subtropical cultivars) 150 days Fiber
255 Cotton (temperate and subtropical cultivars) 165 days Fiber
256 Flax 90 days Fiber
257 Flax 105 days Fiber
258 Flax 120 days Fiber
259 Coffee arabica perennial Green beans
260 Coffee robusta perennial Green beans
261 Tea china tea (camelia sinenses) perennial Leaves
262 Tea hybrid (sinensis and assamica) perennial Leaves
263 Tea assam tea (camelia sinenses var. assamica) perennial Leaves
264 Tobacco (tropical cultivars) 105 days Leaves
265 Tobacco (tropical cultivars) 120 days Leaves
266 Tobacco (tropical cultivars) 135 days Leaves
267 Tobacco (temperate and subtropical cultivars) 150 days Leaves
268 Tobacco (temperate and subtropical cultivars) 165 day) Leaves
269 Alfalfa (temperate and subtropical cultivars) perennial AGB
270 Alfalfa (tropical cultivars) perennial AGB
271 Pasture legumes (C3/I species) perennial AGB
272 Pasture legumes (C3/II species) perennial AGB
273 Pasture grasses (C3/I species) perennial AGB
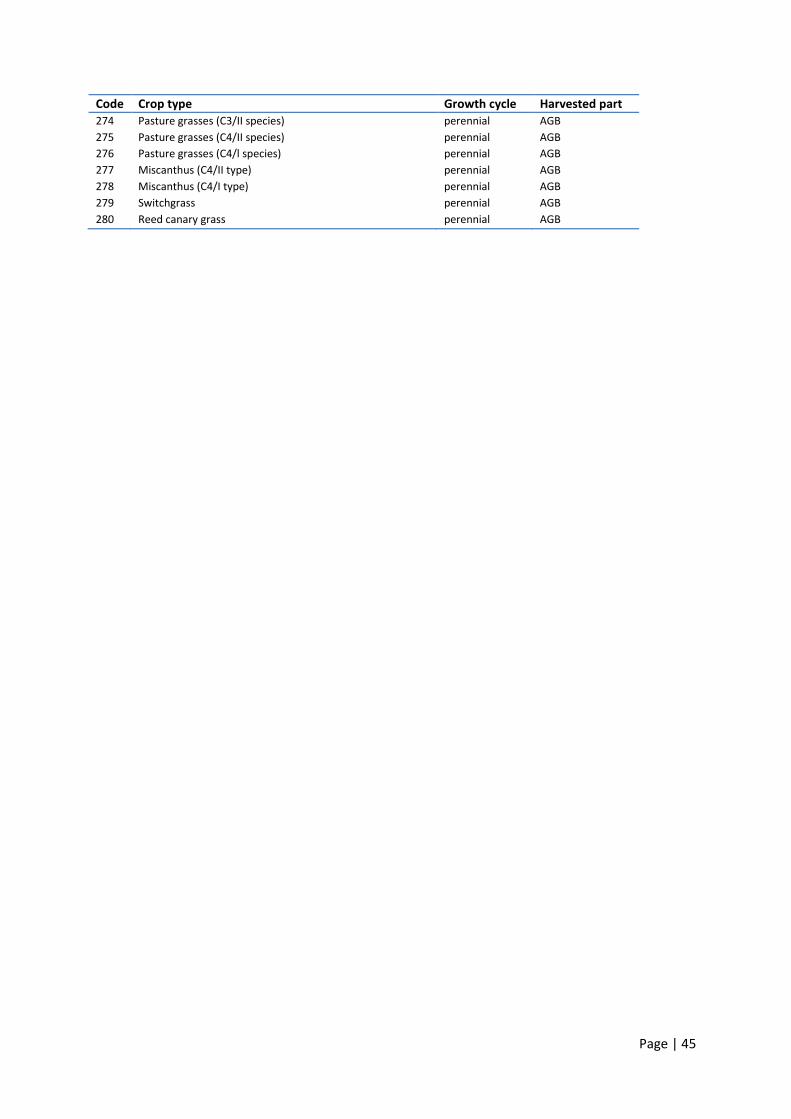
Page | 45
Code Crop type Growth cycle Harvested part
274 Pasture grasses (C3/II species) perennial AGB
275 Pasture grasses (C4/II species) perennial AGB
276 Pasture grasses (C4/l species) perennial AGB
277 Miscanthus (C4/II type) perennial AGB
278 Miscanthus (C4/I type) perennial AGB
279 Switchgrass perennial AGB
280 Reed canary grass perennial AGB
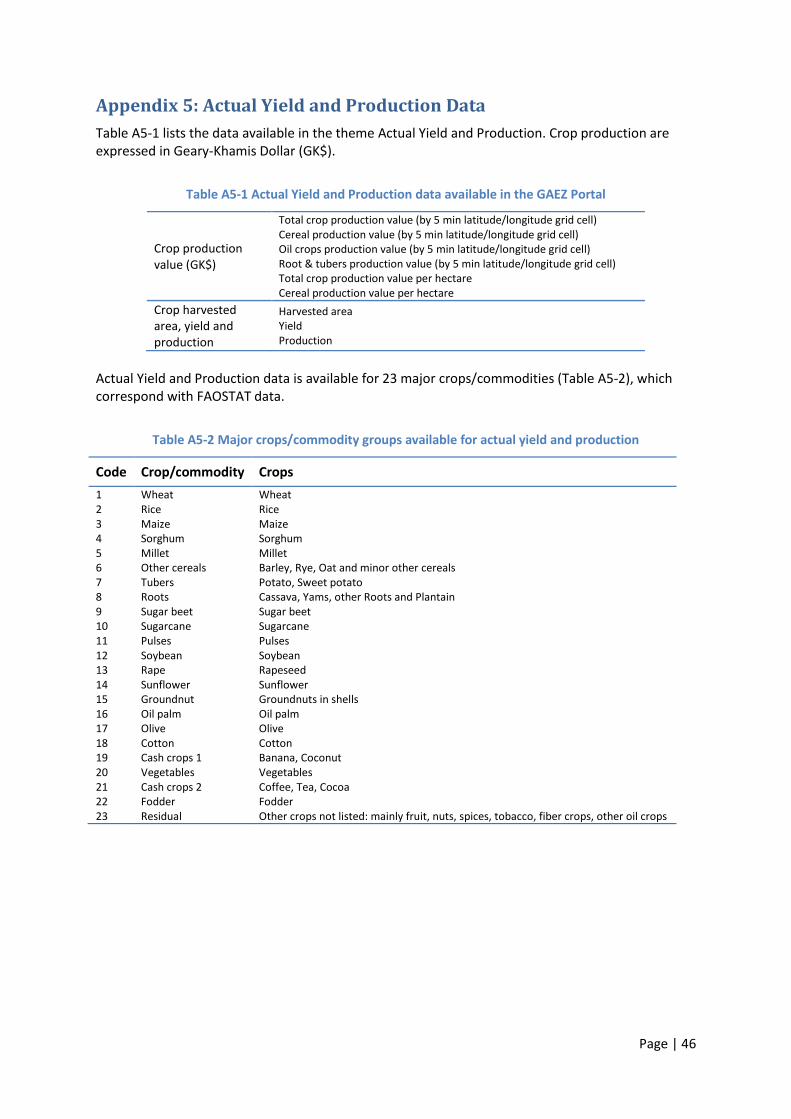
Page | 46
Appendix 5: Actual Yield and Production Data
Table A5-1 lists the data available in the theme Actual Yield and Production. Crop production are expressed in Geary-Khamis Dollar (GK$).
Table A5-1 Actual Yield and Production data available in the GAEZ Portal
Crop production value (GK$)
Total crop production value (by 5 min latitude/longitude grid cell) Cereal production value (by 5 min latitude/longitude grid cell) Oil crops production value (by 5 min latitude/longitude grid cell) Root & tubers production value (by 5 min latitude/longitude grid cell) Total crop production value per hectare Cereal production value per hectare
Crop harvested area, yield and production
Harvested area Yield Production
Actual Yield and Production data is available for 23 major crops/commodities (Table A5-2), which correspond with FAOSTAT data.
Table A5-2 Major crops/commodity groups available for actual yield and production
Code Crop/commodity Crops
1 Wheat Wheat 2 Rice Rice 3 Maize Maize 4 Sorghum Sorghum 5 Millet Millet 6 Other cereals Barley, Rye, Oat and minor other cereals 7 Tubers Potato, Sweet potato 8 Roots Cassava, Yams, other Roots and Plantain 9 Sugar beet Sugar beet 10 Sugarcane Sugarcane 11 Pulses Pulses 12 Soybean Soybean 13 Rape Rapeseed 14 Sunflower Sunflower 15 Groundnut Groundnuts in shells 16 Oil palm Oil palm 17 Olive Olive 18 Cotton Cotton 19 Cash crops 1 Banana, Coconut 20 Vegetables Vegetables 21 Cash crops 2 Coffee, Tea, Cocoa 22 Fodder Fodder 23 Residual Other crops not listed: mainly fruit, nuts, spices, tobacco, fiber crops, other oil crops

Page | 47
Appendix 6: Yield and Production Gap Data
Data in the Yield and Production Gaps theme are listed in Table A6-1.
Table A6-1 Yield and Production Gap data available in the GAEZ Portal
Aggregate yield ratio
Ratio of actual and potential yield, Main crops Ratio of actual and potential yield, Cereal crops Ratio of actual and potential yield, Oil crops Ratio of actual and potential yield, Roots and tubers
Production gap Ratio of actual and potential yield Difference of actual and potential production
Yield and Production Gaps are provided for 18 major crops:
Table A6-2 Major crops/commodity groups
Code Crop/commodity Crops
1 Wheat Wheat 2 Rice Rice 3 Maize Maize 4 Sorghum Sorghum 5 Millet Millet 7 Tubers Potato, Sweet potato 8 Roots Cassava, Yams, other Roots and Plantain 9 Sugar beet Sugar beet 10 Sugarcane Sugarcane 11 Pulses Pulses 12 Soybean Soybean 13 Rape Rapeseed 14 Sunflower Sunflower 15 Groundnut Groundnuts in shells 16 Oil palm Oil palm 17 Olive Olive 18 Cotton Cotton

Table A6-3 List of commodities and unit/price relationships for downscaling and yield gap assessments
COMMODITIES FOR DOWNSCALING AND YIELD GAP ASSESSMENTS
Commodities FAOSTAT (HARVESTED WEIGHT) GAEZ (DRY WEIGHT) FAOSTAT-
GAEZ
Code Name Commodities Produce Unit Price (GK$/t) Crop/LUTs Produce Unit Conversion
factor
1 Wheat Wheat grain tons 155 Wheat LUTs grain tons 0.875
2 Rice Rice grain tons 200 Wetland rice LUTs grain tons 0.875
3 Maize Maize grain tons 125 Grain maize LUTs grain tons 0.87
4 Sorghum Sorghum grain tons 130 Sorghum LUTs grain tons 0.88
5 Millet Millet grain tons 140, 170 Pearl millet and foxtail millet LUTs grain tons 0.9
6 Other cereals Other cereals grain tons 92 - 250 Barley, rye, oat, buckwheat, dry rice LUTs grain tons 0.875-0.9
7 Tubers Potato, Sweet potato tuber tons 105, 85 Potato and sweet potato LUTs tuber tons 0.25, 0.3
8 Roots Cassava, Yams, other roots and Plantain root tons 75, 95, 120 Cassava, yam, cocoyam and plantain LUTs root tons 0.35
9 Sugar beet Sugar beet root tons 32 Sugar beet LUTs sugar tons 0.14
10 Sugarcane Sugar cane stalk tons 20 Sugarcane LUT sugar tons 0.1
11 Pulses Pulses grain tons 235 - 500 Ph. bean, chickpea, cowpea, dry pea, grams, pigeon-pea LUTs grain GK$ 1
12 Soybean Soybean grain tons 250 Soybean LUTs grain tons 0.9
13 Rape Rapeseed seed tons 330 Rape LUTs seed tons 0.9
14 Sunflower Sunflower seed tons 300 Sunflower LUTs seed tons 0.9
15 Groundnut Groundnuts in shells grain tons 436 Groundnut LUTs grain tons 0.67
16 Oil palm Oilpalm fruit tons 75 Oil palm LUT oil tons 0.225
17 Olive Olive fruit tons 500 Olive LUT oil tons 0.22
18 Cotton Cotton seed + lint tons 525, 1430 Cotton LUTs lint tons 0.35
19 Cash crops 1 Banana, Coconut fruit tons 150, 105 Banana & coconut LUTs fruit, copra GK$ 0.35, 0.175
20 Vegetables Vegetables various tons 100 - 1650 Vegetables LUTs (cabbage, carrot, oinion, tomato) various GK$ 0.125-0.175
21 Cash crops 2 Coffee, Tea, Cocoa beans, leaves tons 1000, 1500, 750 Coffee LUTs, tea LUTs, cocoa LUTs beans, cd. leaves GK$ 0.35, 0.3, 0.5
22 Fodder Fodder AGB tons 25 Fodder LUTs AGB GK$ 0.1
23 Residual Other crops not listed above various tons 90 - 4500 n.a. n.a. n.a. n.a.
Yield and production gap assessments
Pulses in FAOSTAT include: Dry beans, Dry broad beans, Dry peas, Chick-peas, Cow peas, Pigeon peas, Lentils, Bambara beans, other pulses.
AGB = Above ground biomass

Appendix 7: List of regions/countries/sub-national divisions
Table A7-1 List of GAEZ regions
RG1 code REGION 1
11 Northern America
21 Eastern Europe and Russian Federation
22 Northern Europe
23 Southern Europe
24 Western Europe
31 Caribbean
32 Central America
41 South America
51 Australia & New Zealand
52 Pacific Islands
61 Eastern Africa Sudano-Sahelian Africa
62 Central Africa
63 Northern Africa
64 Southern Africa
65 66
Western Africa Gulf of Guinea
71 Western Asia
81 South-eastern Asia
82 Southern Asia
84 Eastern Asia
85 90
Central Asia Antarctica
RG2 code REGION 2
10 Northern America
20 30
Europe and Russian Federation Central America and Caribbean
40 South America
50 Oceania
60 Sub-Saharan Africa
70 Northern Africa & Western Asia
80
90
Central, South, South-eastern and eastern Asia Antarctica
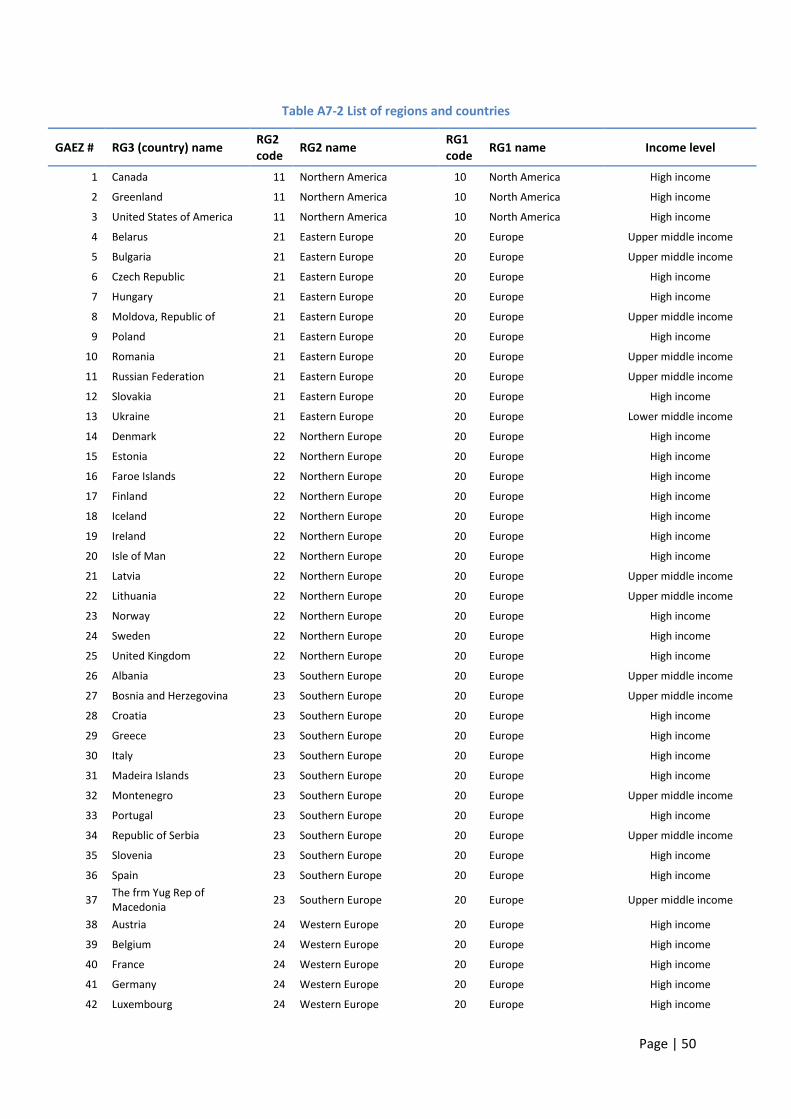
Page | 50
Table A7-2 List of regions and countries
GAEZ # RG3 (country) name RG2 code
RG2 name RG1 code
RG1 name Income level
1 Canada 11 Northern America 10 North America High income
2 Greenland 11 Northern America 10 North America High income
3 United States of America 11 Northern America 10 North America High income
4 Belarus 21 Eastern Europe 20 Europe Upper middle income
5 Bulgaria 21 Eastern Europe 20 Europe Upper middle income
6 Czech Republic 21 Eastern Europe 20 Europe High income
7 Hungary 21 Eastern Europe 20 Europe High income
8 Moldova, Republic of 21 Eastern Europe 20 Europe Upper middle income
9 Poland 21 Eastern Europe 20 Europe High income
10 Romania 21 Eastern Europe 20 Europe Upper middle income
11 Russian Federation 21 Eastern Europe 20 Europe Upper middle income
12 Slovakia 21 Eastern Europe 20 Europe High income
13 Ukraine 21 Eastern Europe 20 Europe Lower middle income
14 Denmark 22 Northern Europe 20 Europe High income
15 Estonia 22 Northern Europe 20 Europe High income
16 Faroe Islands 22 Northern Europe 20 Europe High income
17 Finland 22 Northern Europe 20 Europe High income
18 Iceland 22 Northern Europe 20 Europe High income
19 Ireland 22 Northern Europe 20 Europe High income
20 Isle of Man 22 Northern Europe 20 Europe High income
21 Latvia 22 Northern Europe 20 Europe Upper middle income
22 Lithuania 22 Northern Europe 20 Europe Upper middle income
23 Norway 22 Northern Europe 20 Europe High income
24 Sweden 22 Northern Europe 20 Europe High income
25 United Kingdom 22 Northern Europe 20 Europe High income
26 Albania 23 Southern Europe 20 Europe Upper middle income
27 Bosnia and Herzegovina 23 Southern Europe 20 Europe Upper middle income
28 Croatia 23 Southern Europe 20 Europe High income
29 Greece 23 Southern Europe 20 Europe High income
30 Italy 23 Southern Europe 20 Europe High income
31 Madeira Islands 23 Southern Europe 20 Europe High income
32 Montenegro 23 Southern Europe 20 Europe Upper middle income
33 Portugal 23 Southern Europe 20 Europe High income
34 Republic of Serbia 23 Southern Europe 20 Europe Upper middle income
35 Slovenia 23 Southern Europe 20 Europe High income
36 Spain 23 Southern Europe 20 Europe High income
37 The frm Yug Rep of Macedonia
23 Southern Europe 20 Europe Upper middle income
38 Austria 24 Western Europe 20 Europe High income
39 Belgium 24 Western Europe 20 Europe High income
40 France 24 Western Europe 20 Europe High income
41 Germany 24 Western Europe 20 Europe High income
42 Luxembourg 24 Western Europe 20 Europe High income
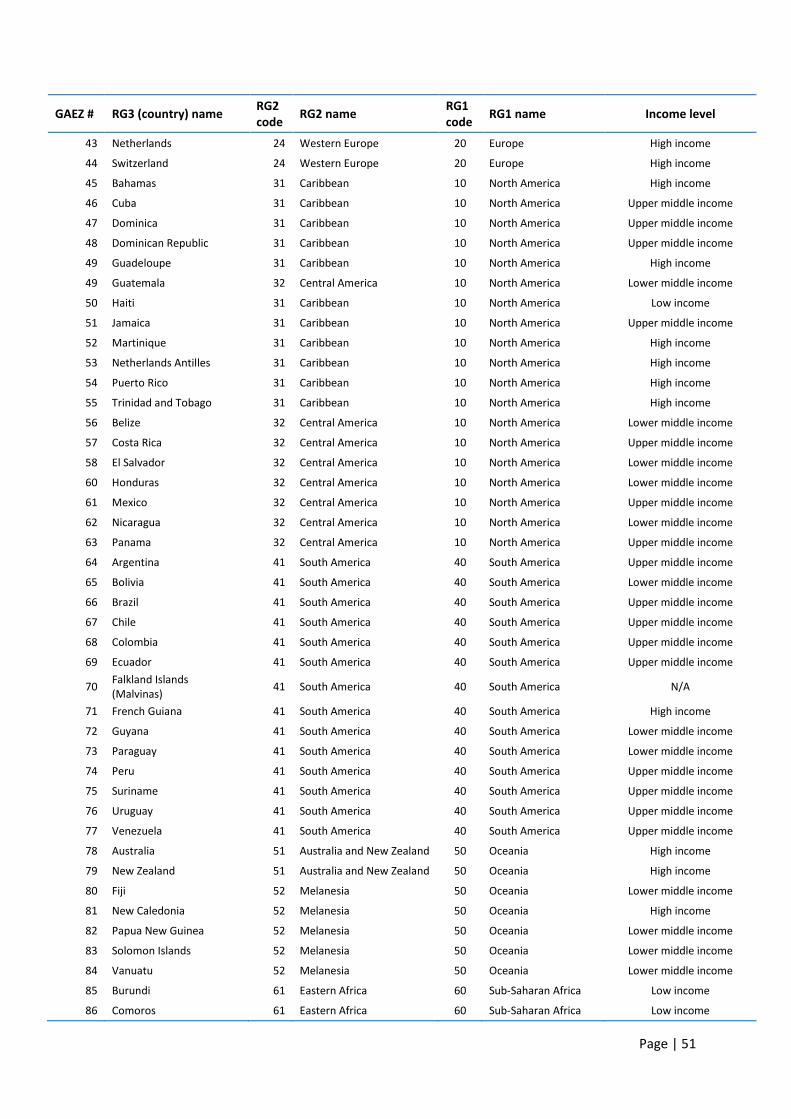
Page | 51
GAEZ # RG3 (country) name RG2 code
RG2 name RG1 code
RG1 name Income level
43 Netherlands 24 Western Europe 20 Europe High income
44 Switzerland 24 Western Europe 20 Europe High income
45 Bahamas 31 Caribbean 10 North America High income
46 Cuba 31 Caribbean 10 North America Upper middle income
47 Dominica 31 Caribbean 10 North America Upper middle income
48 Dominican Republic 31 Caribbean 10 North America Upper middle income
49 Guadeloupe 31 Caribbean 10 North America High income
49 Guatemala 32 Central America 10 North America Lower middle income
50 Haiti 31 Caribbean 10 North America Low income
51 Jamaica 31 Caribbean 10 North America Upper middle income
52 Martinique 31 Caribbean 10 North America High income
53 Netherlands Antilles 31 Caribbean 10 North America High income
54 Puerto Rico 31 Caribbean 10 North America High income
55 Trinidad and Tobago 31 Caribbean 10 North America High income
56 Belize 32 Central America 10 North America Lower middle income
57 Costa Rica 32 Central America 10 North America Upper middle income
58 El Salvador 32 Central America 10 North America Lower middle income
60 Honduras 32 Central America 10 North America Lower middle income
61 Mexico 32 Central America 10 North America Upper middle income
62 Nicaragua 32 Central America 10 North America Lower middle income
63 Panama 32 Central America 10 North America Upper middle income
64 Argentina 41 South America 40 South America Upper middle income
65 Bolivia 41 South America 40 South America Lower middle income
66 Brazil 41 South America 40 South America Upper middle income
67 Chile 41 South America 40 South America Upper middle income
68 Colombia 41 South America 40 South America Upper middle income
69 Ecuador 41 South America 40 South America Upper middle income
70 Falkland Islands (Malvinas)
41 South America 40 South America N/A
71 French Guiana 41 South America 40 South America High income
72 Guyana 41 South America 40 South America Lower middle income
73 Paraguay 41 South America 40 South America Lower middle income
74 Peru 41 South America 40 South America Upper middle income
75 Suriname 41 South America 40 South America Upper middle income
76 Uruguay 41 South America 40 South America Upper middle income
77 Venezuela 41 South America 40 South America Upper middle income
78 Australia 51 Australia and New Zealand 50 Oceania High income
79 New Zealand 51 Australia and New Zealand 50 Oceania High income
80 Fiji 52 Melanesia 50 Oceania Lower middle income
81 New Caledonia 52 Melanesia 50 Oceania High income
82 Papua New Guinea 52 Melanesia 50 Oceania Lower middle income
83 Solomon Islands 52 Melanesia 50 Oceania Lower middle income
84 Vanuatu 52 Melanesia 50 Oceania Lower middle income
85 Burundi 61 Eastern Africa 60 Sub-Saharan Africa Low income
86 Comoros 61 Eastern Africa 60 Sub-Saharan Africa Low income
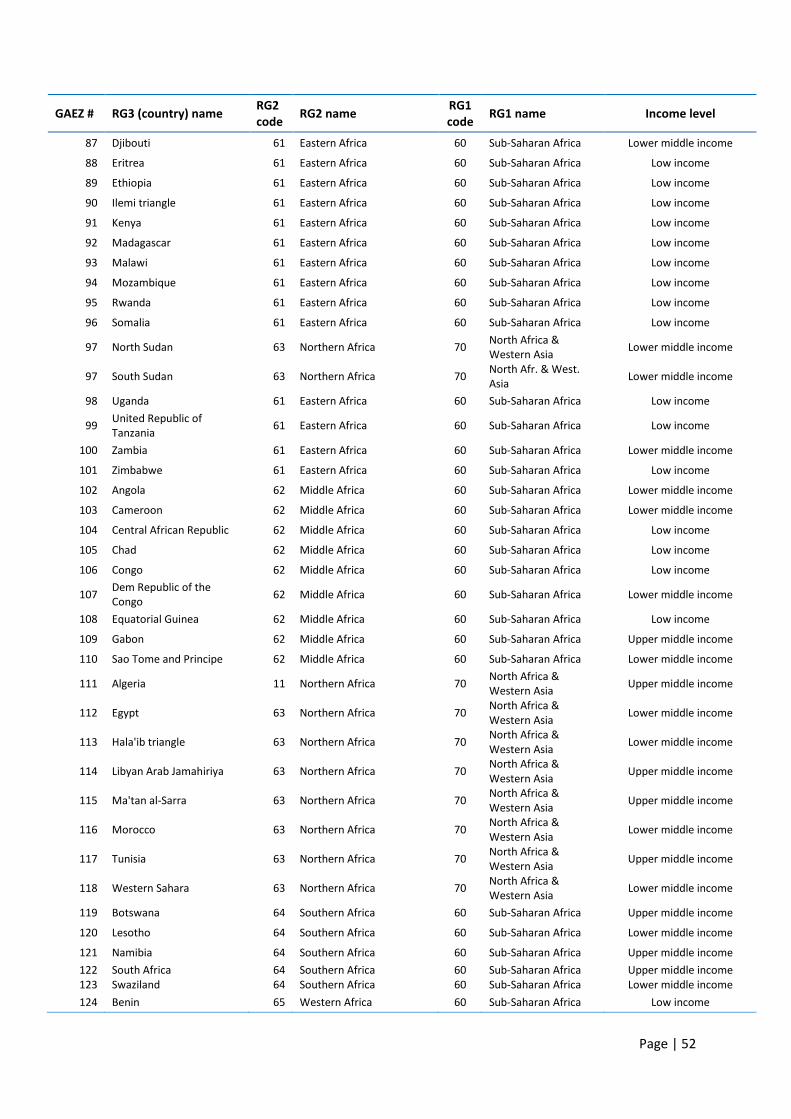
Page | 52
GAEZ # RG3 (country) name RG2 code
RG2 name RG1 code
RG1 name Income level
87 Djibouti 61 Eastern Africa 60 Sub-Saharan Africa Lower middle income
88 Eritrea 61 Eastern Africa 60 Sub-Saharan Africa Low income
89 Ethiopia 61 Eastern Africa 60 Sub-Saharan Africa Low income
90 Ilemi triangle 61 Eastern Africa 60 Sub-Saharan Africa Low income
91 Kenya 61 Eastern Africa 60 Sub-Saharan Africa Low income
92 Madagascar 61 Eastern Africa 60 Sub-Saharan Africa Low income
93 Malawi 61 Eastern Africa 60 Sub-Saharan Africa Low income
94 Mozambique 61 Eastern Africa 60 Sub-Saharan Africa Low income
95 Rwanda 61 Eastern Africa 60 Sub-Saharan Africa Low income
96 Somalia 61 Eastern Africa 60 Sub-Saharan Africa Low income
97 North Sudan 63 Northern Africa 70 North Africa & Western Asia
Lower middle income
97 South Sudan 63 Northern Africa 70 North Afr. & West. Asia
Lower middle income
98 Uganda 61 Eastern Africa 60 Sub-Saharan Africa Low income
99 United Republic of Tanzania
61 Eastern Africa 60 Sub-Saharan Africa Low income
100 Zambia 61 Eastern Africa 60 Sub-Saharan Africa Lower middle income
101 Zimbabwe 61 Eastern Africa 60 Sub-Saharan Africa Low income
102 Angola 62 Middle Africa 60 Sub-Saharan Africa Lower middle income
103 Cameroon 62 Middle Africa 60 Sub-Saharan Africa Lower middle income
104 Central African Republic 62 Middle Africa 60 Sub-Saharan Africa Low income
105 Chad 62 Middle Africa 60 Sub-Saharan Africa Low income
106 Congo 62 Middle Africa 60 Sub-Saharan Africa Low income
107 Dem Republic of the Congo
62 Middle Africa 60 Sub-Saharan Africa Lower middle income
108 Equatorial Guinea 62 Middle Africa 60 Sub-Saharan Africa Low income
109 Gabon 62 Middle Africa 60 Sub-Saharan Africa Upper middle income
110 Sao Tome and Principe 62 Middle Africa 60 Sub-Saharan Africa Lower middle income
111 Algeria 11 Northern Africa 70 North Africa & Western Asia
Upper middle income
112 Egypt 63 Northern Africa 70 North Africa & Western Asia
Lower middle income
113 Hala'ib triangle 63 Northern Africa 70 North Africa & Western Asia
Lower middle income
114 Libyan Arab Jamahiriya 63 Northern Africa 70 North Africa & Western Asia
Upper middle income
115 Ma'tan al-Sarra 63 Northern Africa 70 North Africa & Western Asia
Upper middle income
116 Morocco 63 Northern Africa 70 North Africa & Western Asia
Lower middle income
117 Tunisia 63 Northern Africa 70 North Africa & Western Asia
Upper middle income
118 Western Sahara 63 Northern Africa 70 North Africa & Western Asia
Lower middle income
119 Botswana 64 Southern Africa 60 Sub-Saharan Africa Upper middle income
120 Lesotho 64 Southern Africa 60 Sub-Saharan Africa Lower middle income
121 Namibia 64 Southern Africa 60 Sub-Saharan Africa Upper middle income
122 South Africa 64 Southern Africa 60 Sub-Saharan Africa Upper middle income 123 Swaziland 64 Southern Africa 60 Sub-Saharan Africa Lower middle income
124 Benin 65 Western Africa 60 Sub-Saharan Africa Low income

Page | 53
GAEZ # RG3 (country) name RG2 code
RG2 name RG1 code
RG1 name Income level
125 Burkina Faso 65 Western Africa 60 Sub-Saharan Africa Lower middle income
126 Cote d'Ivoire 65 Western Africa 60 Sub-Saharan Africa Lower middle income
127 Gambia 65 Western Africa 60 Sub-Saharan Africa Low income
128 Ghana 65 Western Africa 60 Sub-Saharan Africa Lower middle income
129 Guinea 65 Western Africa 60 Sub-Saharan Africa Low income
130 Guinea-Bissau 65 Western Africa 60 Sub-Saharan Africa Low income
131 Liberia 65 Western Africa 60 Sub-Saharan Africa Low income
132 Mali 65 Western Africa 60 Sub-Saharan Africa Low income
133 Mauritania 65 Western Africa 60 Sub-Saharan Africa Lower middle income
134 Niger 65 Western Africa 60 Sub-Saharan Africa Low income
135 Nigeria 65 Western Africa 60 Sub-Saharan Africa Lower middle income
136 Senegal 65 Western Africa 60 Sub-Saharan Africa Lower middle income
137 Sierra Leone 65 Western Africa 60 Sub-Saharan Africa Low income
138 Togo 65 Western Africa 60 Sub-Saharan Africa Low income
139 Cyprus 71 Western Asia 70 North Africa & Western Asia
High income
140 Iraq 71 Western Asia 70 North Africa & Western Asia
Lower middle income
141 Israel 71 Western Asia 70 North Africa & Western Asia
High income
142 Jordan 71 Western Asia 70 North Africa & Western Asia
Upper middle income
143 Kuwait 71 Western Asia 70 North Africa & Western Asia
High income
144 Lebanon 71 Western Asia 70 North Africa & Western Asia
Upper middle income
145 Oman 71 Western Asia 70 North Africa & Western Asia
High income
146 Qatar 71 Western Asia 70 North Africa & Western Asia
High income
147 Saudi Arabia 71 Western Asia 70 North Africa & Western Asia
High income
148 Syrian Arab Republic 71 Western Asia 70 North Africa & Western Asia
Lower middle income
149 Turkey 71 Western Asia 70 North Africa & Western Asia
Upper middle income
150 United Arab Emirates 71 Western Asia 70 North Africa & Western Asia
High income
151 West Bank 71 Western Asia 70 North Africa & Western Asia
Lower middle income
152 Yemen 71 Western Asia 70 North Africa & Western Asia
Lower middle income
153 Brunei Darussalam 81 South-Eastern Asia 80 Asia (excl. Western Asia)
High income
154 Cambodia 81 South-Eastern Asia 80 Asia (excl. Western Asia) Low income
155 Indonesia 81 South-Eastern Asia 80 Asia (excl. Western Asia)
Lower middle income
156 Lao People's Dem Republic
81 South-Eastern Asia 80 Asia (excl. Western Asia)
Lower middle income
157 Malaysia 81 South-Eastern Asia 80 Asia (excl. Western Asia)
Upper middle income
158 Myanmar 81 South-Eastern Asia 80 Asia (excl. Western Asia)
Low income
159 Philippines 81 South-Eastern Asia 80 Asia (excl. Western Asia)
Lower middle income
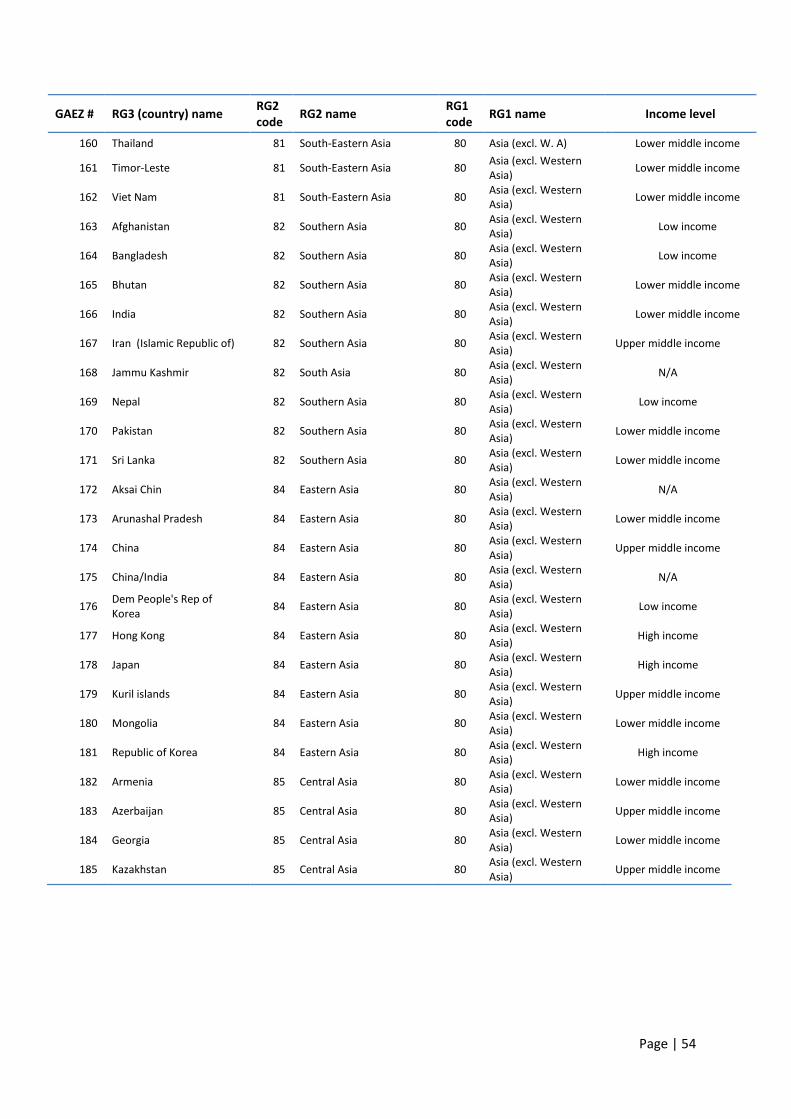
Page | 54
GAEZ # RG3 (country) name RG2 code
RG2 name RG1 code
RG1 name Income level
160 Thailand 81 South-Eastern Asia 80 Asia (excl. W. A) Lower middle income
161 Timor-Leste 81 South-Eastern Asia 80 Asia (excl. Western Asia)
Lower middle income
162 Viet Nam 81 South-Eastern Asia 80 Asia (excl. Western Asia)
Lower middle income
163 Afghanistan 82 Southern Asia 80 Asia (excl. Western Asia)
Low income
164 Bangladesh 82 Southern Asia 80 Asia (excl. Western Asia)
Low income
165 Bhutan 82 Southern Asia 80 Asia (excl. Western Asia)
Lower middle income
166 India 82 Southern Asia 80 Asia (excl. Western Asia)
Lower middle income
167 Iran (Islamic Republic of) 82 Southern Asia 80 Asia (excl. Western Asia)
Upper middle income
168 Jammu Kashmir 82 South Asia 80 Asia (excl. Western Asia)
N/A
169 Nepal 82 Southern Asia 80 Asia (excl. Western Asia)
Low income
170 Pakistan 82 Southern Asia 80 Asia (excl. Western Asia)
Lower middle income
171 Sri Lanka 82 Southern Asia 80 Asia (excl. Western Asia)
Lower middle income
172 Aksai Chin 84 Eastern Asia 80 Asia (excl. Western Asia)
N/A
173 Arunashal Pradesh 84 Eastern Asia 80 Asia (excl. Western Asia)
Lower middle income
174 China 84 Eastern Asia 80 Asia (excl. Western Asia)
Upper middle income
175 China/India 84 Eastern Asia 80 Asia (excl. Western Asia)
N/A
176 Dem People's Rep of Korea
84 Eastern Asia 80 Asia (excl. Western Asia)
Low income
177 Hong Kong 84 Eastern Asia 80 Asia (excl. Western Asia)
High income
178 Japan 84 Eastern Asia 80 Asia (excl. Western Asia)
High income
179 Kuril islands 84 Eastern Asia 80 Asia (excl. Western Asia)
Upper middle income
180 Mongolia 84 Eastern Asia 80 Asia (excl. Western Asia)
Lower middle income
181 Republic of Korea 84 Eastern Asia 80 Asia (excl. Western Asia)
High income
182 Armenia 85 Central Asia 80 Asia (excl. Western Asia)
Lower middle income
183 Azerbaijan 85 Central Asia 80 Asia (excl. Western Asia)
Upper middle income
184 Georgia 85 Central Asia 80 Asia (excl. Western Asia)
Lower middle income
185 Kazakhstan 85 Central Asia 80 Asia (excl. Western Asia)
Upper middle income
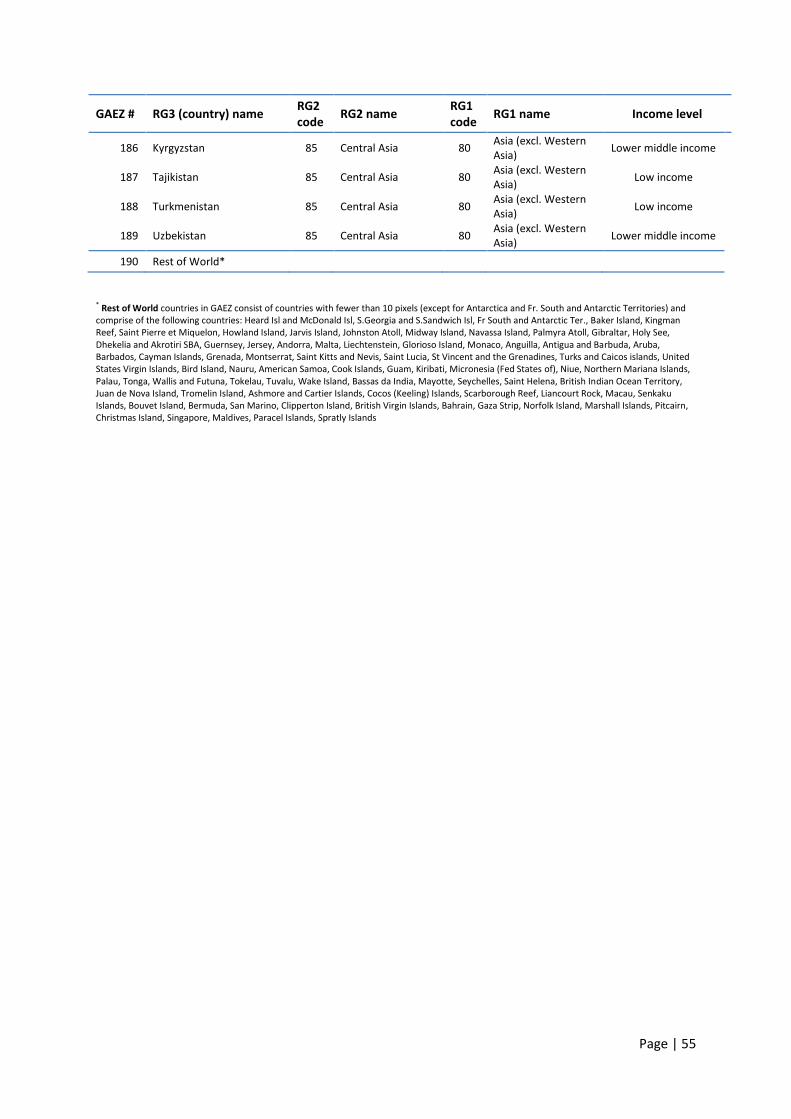
Page | 55
GAEZ # RG3 (country) name RG2 code
RG2 name RG1 code
RG1 name Income level
186 Kyrgyzstan 85 Central Asia 80 Asia (excl. Western Asia)
Lower middle income
187 Tajikistan 85 Central Asia 80 Asia (excl. Western Asia)
Low income
188 Turkmenistan 85 Central Asia 80 Asia (excl. Western Asia)
Low income
189 Uzbekistan 85 Central Asia 80 Asia (excl. Western Asia)
Lower middle income
190 Rest of World*
* Rest of World countries in GAEZ consist of countries with fewer than 10 pixels (except for Antarctica and Fr. South and Antarctic Territories) and comprise of the following countries: Heard Isl and McDonald Isl, S.Georgia and S.Sandwich Isl, Fr South and Antarctic Ter., Baker Island, Kingman Reef, Saint Pierre et Miquelon, Howland Island, Jarvis Island, Johnston Atoll, Midway Island, Navassa Island, Palmyra Atoll, Gibraltar, Holy See, Dhekelia and Akrotiri SBA, Guernsey, Jersey, Andorra, Malta, Liechtenstein, Glorioso Island, Monaco, Anguilla, Antigua and Barbuda, Aruba, Barbados, Cayman Islands, Grenada, Montserrat, Saint Kitts and Nevis, Saint Lucia, St Vincent and the Grenadines, Turks and Caicos islands, United States Virgin Islands, Bird Island, Nauru, American Samoa, Cook Islands, Guam, Kiribati, Micronesia (Fed States of), Niue, Northern Mariana Islands, Palau, Tonga, Wallis and Futuna, Tokelau, Tuvalu, Wake Island, Bassas da India, Mayotte, Seychelles, Saint Helena, British Indian Ocean Territory, Juan de Nova Island, Tromelin Island, Ashmore and Cartier Islands, Cocos (Keeling) Islands, Scarborough Reef, Liancourt Rock, Macau, Senkaku Islands, Bouvet Island, Bermuda, San Marino, Clipperton Island, British Virgin Islands, Bahrain, Gaza Strip, Norfolk Island, Marshall Islands, Pitcairn, Christmas Island, Singapore, Maldives, Paracel Islands, Spratly Islands

Page | 56
Table A7-3 List of first level sub-national divisions for eight large countries
Australia Russian Federation United States of America
Australian Capital Territory Adygeya Rep. Alabama
New South Wales Aginskiy Buryatskiy A. Okrug Alaska
Northern Territory Altay Rep. Arizona
Other Territories Altayskiy Kray Arkansas
Queensland Amurskaya Oblast California
South Australia Arkhangelskaya Oblast Colorado
Tasmania Astrakhanskaya Oblast Connecticut
Victoria Bashkortostan Rep. Delaware
Western Australia Belgorodskaya Oblast District Of Columbia
Brasil Bryanskaya Oblast Florida
Acre Buryatiya Rep. Georgia
Alagoas Chechnya Rep. Hawaii
Amapa Chelyabinskaya Oblast Idaho
Amazonas Chitinskaya Oblast Illinois
Bahia Chukotskiy Okrug Indiana
Ceara Chuvashiya Rep. Iowa
Distrito Federal Dagestan Rep. Kansas
Espirito Santo Evenkiyskiy Okrug Kentucky
Goias Ingushetiya Rep. Louisiana
Maranhao Irkutskaya Oblast Maine
Mato Grosso Ivanovskaya Oblast Maryland
Mato Grosso Do Sul Kabardino-balkariya Rep. Massachusetts
Minas Gerais Kaliningradskaya Oblast Michigan
Para Kalmykiya Rep. Minnesota
Paraiba Kaluzhskaya Oblast Mississippi
Parana Kamchatskaya Oblast Missouri
Pernambuco Karatchayevo-cherkesiya Rep. Montana
Piaui Karelya Rep. Nebraska
Rio De Janeiro Kemerovskaya Oblast Nevada
Rio Grande Do Norte Khabarovskiy Kray New Hampshire
Rio Grande Do Sul Khakasiya Rep. New Jersey
Rondonia Khanty-mansyiskiy Okrug New Mexico
Roraima Kirovskaya Oblast New York
Santa Catarina Komi Rep. North Carolina
Sao Paulo Komi-permyatskiy Okrug North Dakota
Sergipe Koryakskiy Okrug Ohio
Tocantins Kostromskaya Oblast Oklahoma
Canada Krasnodarskiy Kray Oregon
Alberta Krasnoyarskiy Kray Pennsylvania
British Columbia Kurganskaya Oblast Rhode Island
Manitoba Kurskaya Oblast South Carolina
New Brunswick Leningradskaya Oblast South Dakota
Newfoundland and Labrador Lipetskaya Oblast Tennessee
Northwest Territories Magadanskaya Oblast Utah
Nova Scotia Mariy-el Rep. Vermont
Nunavut Mordoviya Rep. Virginia
Ontario Moskovskaya Oblast Washington
Prince Edward Island Moskva West Virginia
Quebec Murmanskaya Oblast Wisconsin
Saskatchewan Name Unknown Wyoming
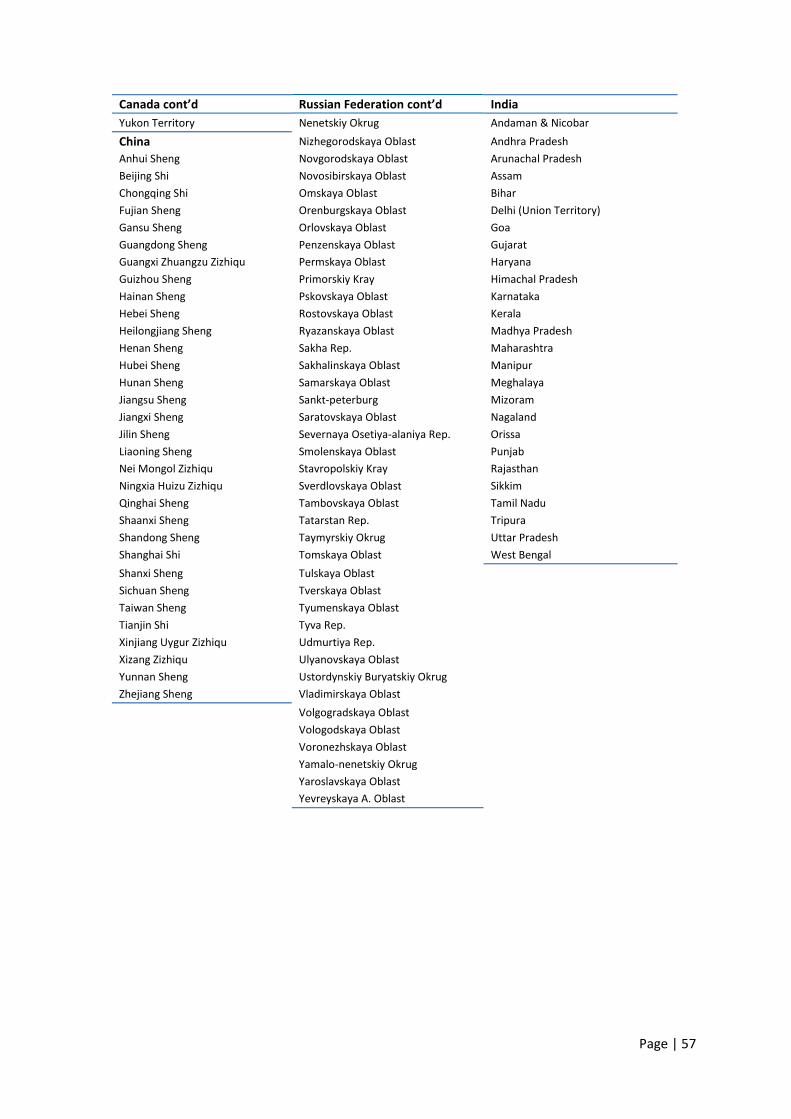
Page | 57
Canada cont’d Russian Federation cont’d India
Yukon Territory Nenetskiy Okrug Andaman & Nicobar
China Nizhegorodskaya Oblast Andhra Pradesh
Anhui Sheng Novgorodskaya Oblast Arunachal Pradesh
Beijing Shi Novosibirskaya Oblast Assam
Chongqing Shi Omskaya Oblast Bihar
Fujian Sheng Orenburgskaya Oblast Delhi (Union Territory)
Gansu Sheng Orlovskaya Oblast Goa
Guangdong Sheng Penzenskaya Oblast Gujarat
Guangxi Zhuangzu Zizhiqu Permskaya Oblast Haryana
Guizhou Sheng Primorskiy Kray Himachal Pradesh
Hainan Sheng Pskovskaya Oblast Karnataka
Hebei Sheng Rostovskaya Oblast Kerala
Heilongjiang Sheng Ryazanskaya Oblast Madhya Pradesh
Henan Sheng Sakha Rep. Maharashtra
Hubei Sheng Sakhalinskaya Oblast Manipur
Hunan Sheng Samarskaya Oblast Meghalaya
Jiangsu Sheng Sankt-peterburg Mizoram
Jiangxi Sheng Saratovskaya Oblast Nagaland
Jilin Sheng Severnaya Osetiya-alaniya Rep. Orissa
Liaoning Sheng Smolenskaya Oblast Punjab
Nei Mongol Zizhiqu Stavropolskiy Kray Rajasthan
Ningxia Huizu Zizhiqu Sverdlovskaya Oblast Sikkim
Qinghai Sheng Tambovskaya Oblast Tamil Nadu
Shaanxi Sheng Tatarstan Rep. Tripura
Shandong Sheng Taymyrskiy Okrug Uttar Pradesh
Shanghai Shi Tomskaya Oblast West Bengal
Shanxi Sheng Tulskaya Oblast
Sichuan Sheng Tverskaya Oblast
Taiwan Sheng Tyumenskaya Oblast
Tianjin Shi Tyva Rep.
Xinjiang Uygur Zizhiqu Udmurtiya Rep.
Xizang Zizhiqu Ulyanovskaya Oblast
Yunnan Sheng Ustordynskiy Buryatskiy Okrug
Zhejiang Sheng Vladimirskaya Oblast
Volgogradskaya Oblast
Vologodskaya Oblast
Voronezhskaya Oblast
Yamalo-nenetskiy Okrug
Yaroslavskaya Oblast
Yevreyskaya A. Oblast
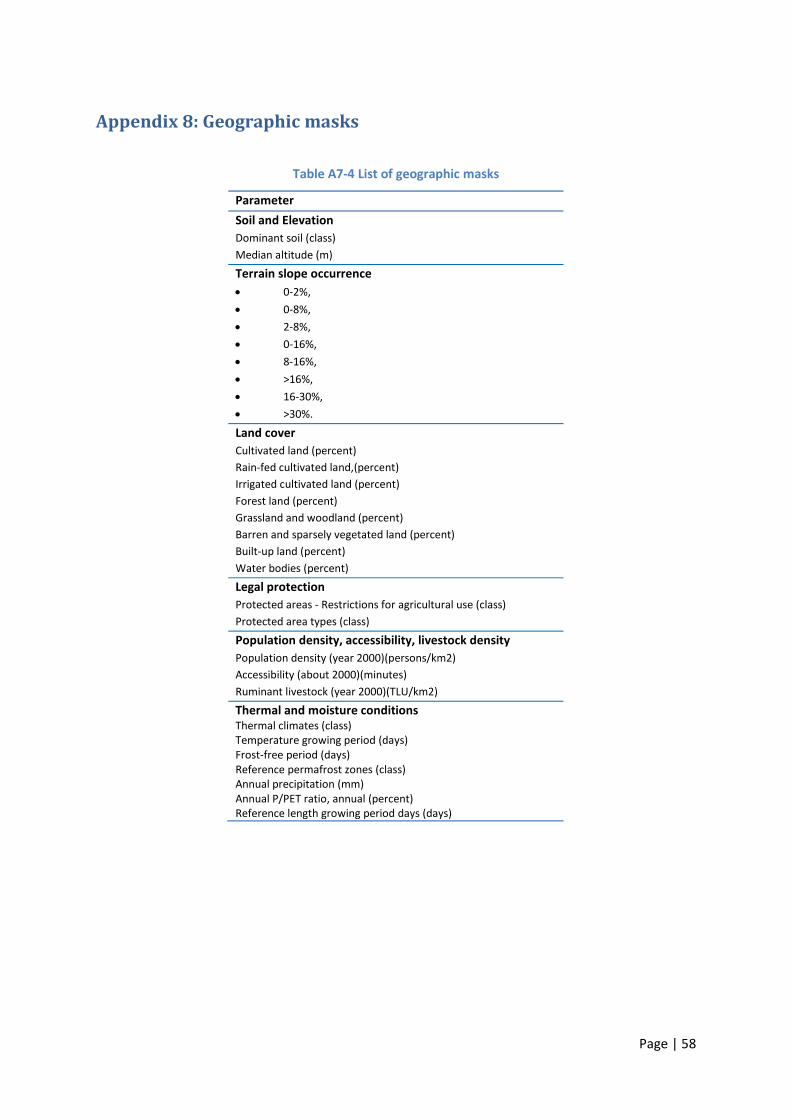
Page | 58
Appendix 8: Geographic masks
Table A7-4 List of geographic masks
Parameter
Soil and Elevation
Dominant soil (class)
Median altitude (m)
Terrain slope occurrence
0-2%,
0-8%,
2-8%,
0-16%,
8-16%,
>16%,
16-30%,
>30%.
Land cover
Cultivated land (percent)
Rain-fed cultivated land,(percent)
Irrigated cultivated land (percent)
Forest land (percent)
Grassland and woodland (percent)
Barren and sparsely vegetated land (percent)
Built-up land (percent)
Water bodies (percent)
Legal protection
Protected areas - Restrictions for agricultural use (class)
Protected area types (class)
Population density, accessibility, livestock density
Population density (year 2000)(persons/km2)
Accessibility (about 2000)(minutes)
Ruminant livestock (year 2000)(TLU/km2)
Thermal and moisture conditions Thermal climates (class) Temperature growing period (days) Frost-free period (days) Reference permafrost zones (class) Annual precipitation (mm) Annual P/PET ratio, annual (percent) Reference length growing period days (days)
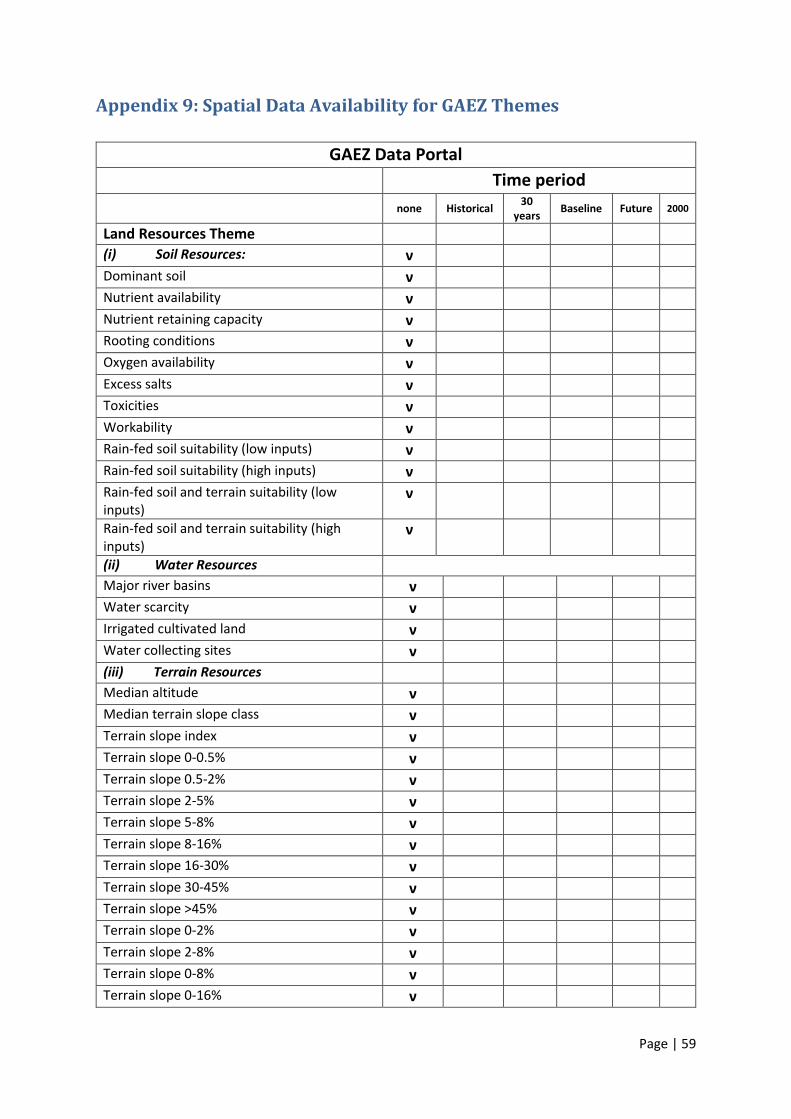
Page | 59
Appendix 9: Spatial Data Availability for GAEZ Themes
GAEZ Data Portal
Time period none Historical
30 years
Baseline Future 2000
Land Resources Theme
(i) Soil Resources: ν
Dominant soil ν
Nutrient availability ν
Nutrient retaining capacity ν
Rooting conditions ν
Oxygen availability ν
Excess salts ν
Toxicities ν
Workability ν
Rain-fed soil suitability (low inputs) ν
Rain-fed soil suitability (high inputs) ν
Rain-fed soil and terrain suitability (low inputs)
ν
Rain-fed soil and terrain suitability (high inputs)
ν
(ii) Water Resources
Major river basins ν
Water scarcity ν
Irrigated cultivated land ν
Water collecting sites ν
(iii) Terrain Resources
Median altitude ν
Median terrain slope class ν
Terrain slope index ν
Terrain slope 0-0.5% ν
Terrain slope 0.5-2% ν
Terrain slope 2-5% ν
Terrain slope 5-8% ν
Terrain slope 8-16% ν
Terrain slope 16-30% ν
Terrain slope 30-45% ν
Terrain slope >45% ν
Terrain slope 0-2% ν
Terrain slope 2-8% ν
Terrain slope 0-8% ν
Terrain slope 0-16% ν

Page | 60
Terrain slope >16% ν
Terrain slope >30% ν
(iv) Land Cover
Dominant land cover pattern ν
Cultivated land ν
Rain-fed cultivated land ν
Irrigated cultivated land ν
Forest land ν
Grassland &woodland ν
Barren and sparsely vegetated land ν
Built-up land ν
Waterbodies ν
(v) Protected Areas*
Protected area types
Protected areas - Restrictions for agricultural use
(vi) Selected socio economic and demographic data
Population density (year 2000) ν
Ruminant livestock (year2000) ν
Accesibility (about 2000) ν
Agro–climatic Resources Theme
(i) Thermal regimes:
Mean Annual temperature ν ν ν
Annual temperature range ν ν
Thermal climates ν ν
Thermal zones ν ν
Temperature growing periods ν ν ν
Frost-free period ν ν ν
Tsum during temperature growing period ν ν ν
Tsum during frost free period ν ν ν
Air frost number, ν ν ν
Snow adjusted air frost number ν ν
Reference permafrost zones ν
(ii) Moisture regimes
Annual Precipitation ν ν ν
Annual Precipitation (1961-90) CV (%) ν ν ν
Annual Precipitation (1961-90) SD (mm) ν ν ν
Fournier index ν ν ν
Fournier index (1961-90) CV (%) ν ν ν
Fournier index (1961-90) SD (mm) ν ν ν
Reference evapotranspiration ν ν ν
Annual P/PET ratio ν ν ν
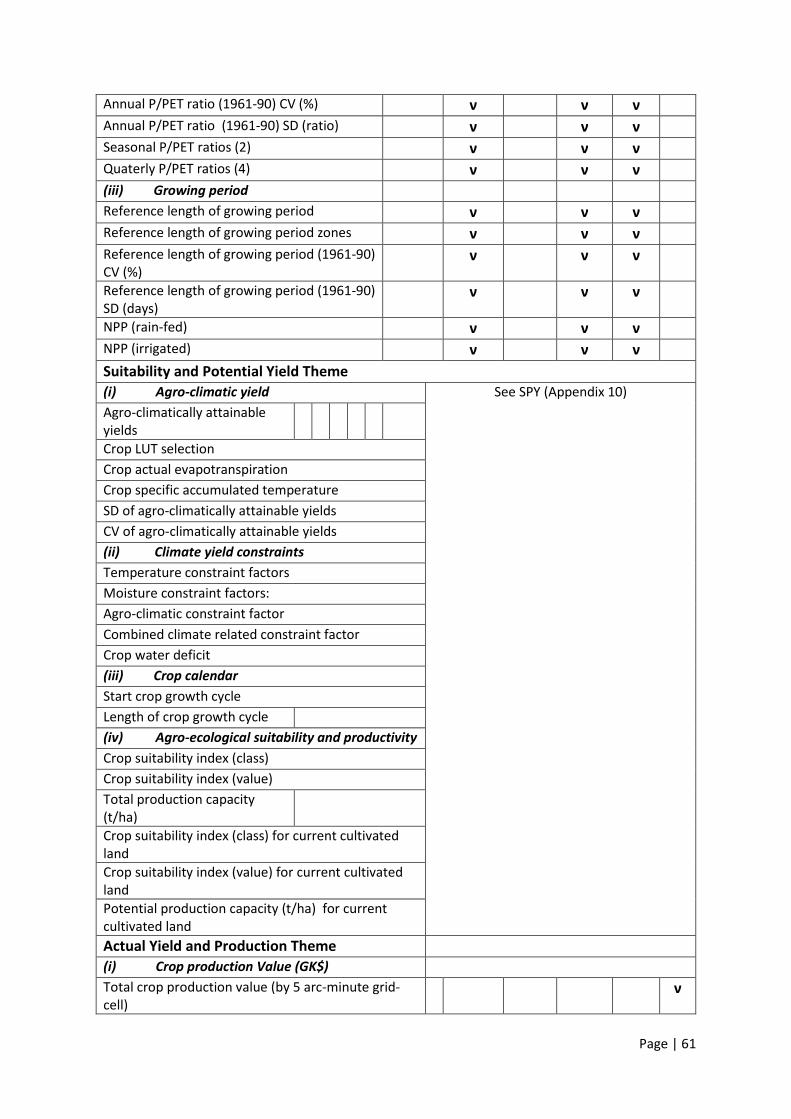
Page | 61
Annual P/PET ratio (1961-90) CV (%) ν ν ν
Annual P/PET ratio (1961-90) SD (ratio) ν ν ν
Seasonal P/PET ratios (2) ν ν ν
Quaterly P/PET ratios (4) ν ν ν
(iii) Growing period
Reference length of growing period ν ν ν
Reference length of growing period zones ν ν ν
Reference length of growing period (1961-90) CV (%)
ν ν ν
Reference length of growing period (1961-90) SD (days)
ν ν ν
NPP (rain-fed) ν ν ν
NPP (irrigated) ν ν ν
Suitability and Potential Yield Theme
(i) Agro-climatic yield See SPY (Appendix 10)
Agro-climatically attainable yields
Crop LUT selection
Crop actual evapotranspiration
Crop specific accumulated temperature
SD of agro-climatically attainable yields
CV of agro-climatically attainable yields
(ii) Climate yield constraints
Temperature constraint factors
Moisture constraint factors:
Agro-climatic constraint factor
Combined climate related constraint factor
Crop water deficit
(iii) Crop calendar
Start crop growth cycle
Length of crop growth cycle
(iv) Agro-ecological suitability and productivity
Crop suitability index (class)
Crop suitability index (value)
Total production capacity (t/ha)
Crop suitability index (class) for current cultivated land
Crop suitability index (value) for current cultivated land
Potential production capacity (t/ha) for current cultivated land
Actual Yield and Production Theme
(i) Crop production Value (GK$)
Total crop production value (by 5 arc-minute grid-cell)
ν
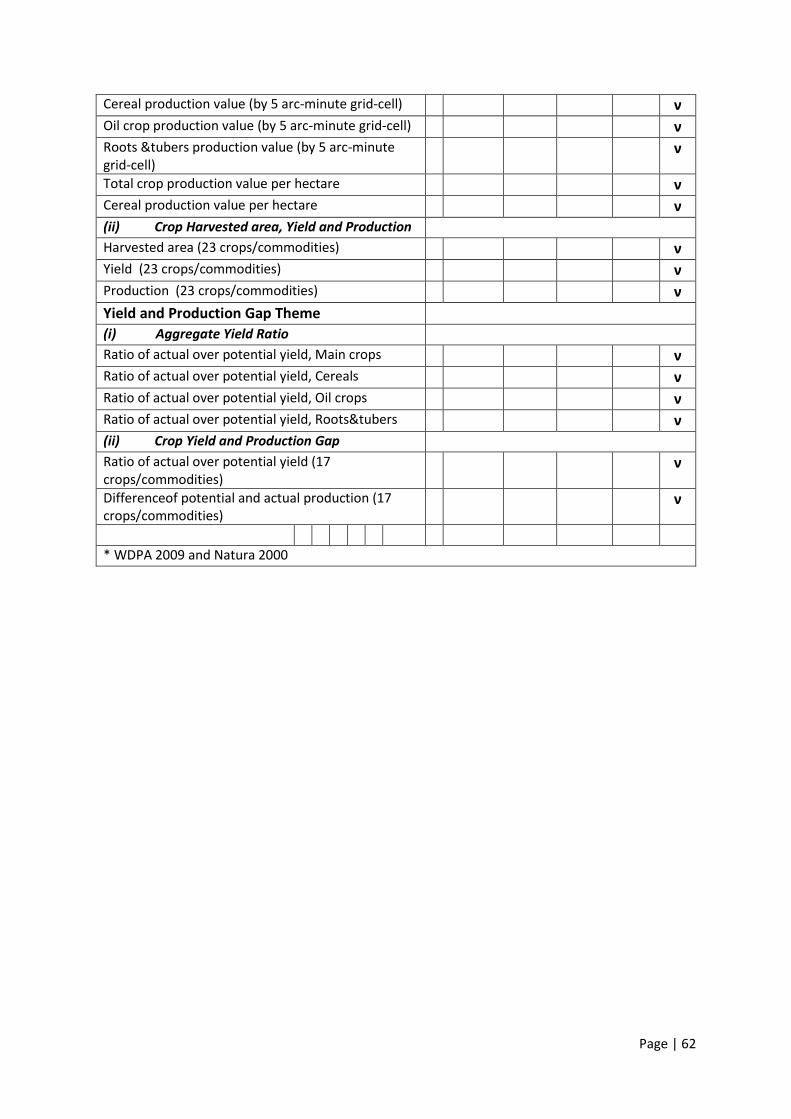
Page | 62
Cereal production value (by 5 arc-minute grid-cell) ν
Oil crop production value (by 5 arc-minute grid-cell) ν
Roots &tubers production value (by 5 arc-minute grid-cell)
ν
Total crop production value per hectare ν
Cereal production value per hectare ν
(ii) Crop Harvested area, Yield and Production
Harvested area (23 crops/commodities) ν
Yield (23 crops/commodities) ν
Production (23 crops/commodities) ν
Yield and Production Gap Theme
(i) Aggregate Yield Ratio
Ratio of actual over potential yield, Main crops ν
Ratio of actual over potential yield, Cereals ν
Ratio of actual over potential yield, Oil crops ν
Ratio of actual over potential yield, Roots&tubers ν
(ii) Crop Yield and Production Gap
Ratio of actual over potential yield (17 crops/commodities)
ν
Differenceof potential and actual production (17 crops/commodities)
ν
* WDPA 2009 and Natura 2000

Appendix 10: Spatial Data Availability for Suitability and Potential Yield Assessment
Agroclimatic Yield
Attainable Yield Attainable Yield Attainable Yield
Rain-fed Rain-fed Rain-fed
Crop Crop type Crop/LUT
input Time period input Time period input Time period
Historical 30 years Baseline Future Historical 30 years Baseline Future Historical 30 years Baseline Future
H √ √ √ √ H √ √ √ √ H √ √ √
I
√ √ I
√ √ I
√
L
√ √ L
√ √ L
√
Attainable Yield Attainable Yield Attainable Yield
Irrigated Irrigated Irrigated
Crop Crop type Crop/LUT
input Time period input Time period input Time period
Historical 30 years Baseline Future Historical 30 years Baseline Future Historical 30 years Baseline Future
H
√ √ H
√ √ H
√
I
√ √ I
√ √ I
√
L
L
L
Crop LUT selection Crop LUT selection Crop LUT selection
Rain-fed Rain-fed Rain-fed
Crop Crop type Crop/LUT
input Time period input Time period input Time period
Historical 30 years Baseline Future Historical 30 years Baseline Future Historical 30 years Baseline Future
H
√ √ √ H
√ √ √ H not applicable
I
√ √ I
√ √ I
L
√ √ L
√ √ L
Crop LUT selection Crop LUT selection Crop LUT selection Irrigated Irrigated Irrigated
Crop Crop type Crop/LUT

Page | 64
input Time period input Time period input Time period Historical 30 years Baseline Future Historical 30 years Baseline Future Historical 30 years Baseline Future H
√ √ H
√ √ H not applicable
I
√ √ I
√ √ I
L
L
L
Crop specific actual evapotranspiration Crop specific actual evapotranspiration Crop specific actual evapotranspiration Rain-fed Rain-fed Rain-fed
Crop Crop type Crop/LUT input Time period input Time period input Time period Historical 30 years Baseline Future Historical 30 years Baseline Future Historical 30 years Baseline Future H
√ √ √ H
√ √ √ H
√ √
I
√ √ I
√ √ I
√ L
√ √ L
√ √ L
√
Crop specific actual evapotranspiration Crop specific actual evapotranspiration Crop specific actual evapotranspiration Irrigated Irrigated Irrigated
Crop Crop type Crop/LUT input Time period input Time period input Time period Historical 30 years Baseline Future Historical 30 years Baseline Future Historical 30 years Baseline Future H
√ √ H
√ √ H
√
I
√ √ I
√ √ I
√ L
L
L
Crop specific acumulated temperature Crop specific acumulated temperature Crop specific acumulated temperature Rain-fed Rain-fed Rain-fed
Crop Crop type Crop/LUT input Time period input Time period input Time period Historical 30 years Baseline Future Historical 30 years Baseline Future Historical 30 years Baseline Future H
√ √ √ H
√ √ √ H
√ √
I
√ √ I
√ √ I
√ L
√ √ L
√ √ L
√
Crop specific acumulated temperature Crop specific acumulated temperature Crop specific acumulated temperature Irrigated Irrigated Irrigated
Crop Crop type Crop/LUT input Time period input Time period input Time period Historical 30 years Baseline Future Historical 30 years Baseline Future Historical 30 years Baseline Future H
√ √ H
√ √ H
√
I
√ √ I
√ √ I
√ L
L
L
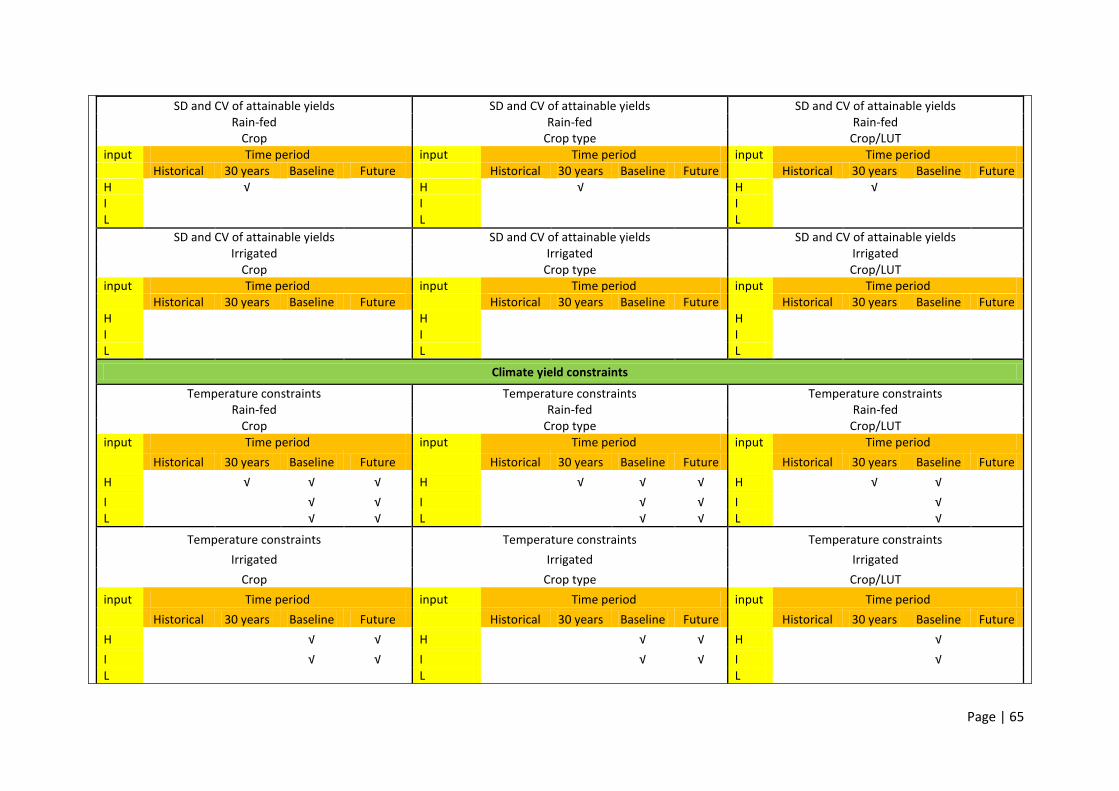
Page | 65
SD and CV of attainable yields SD and CV of attainable yields SD and CV of attainable yields Rain-fed Rain-fed Rain-fed
Crop Crop type Crop/LUT input Time period input Time period input Time period Historical 30 years Baseline Future Historical 30 years Baseline Future Historical 30 years Baseline Future H
√
H
√
H
√
I
I
I
L
L
L
SD and CV of attainable yields SD and CV of attainable yields SD and CV of attainable yields Irrigated Irrigated Irrigated
Crop Crop type Crop/LUT input Time period input Time period input Time period Historical 30 years Baseline Future Historical 30 years Baseline Future Historical 30 years Baseline Future H
H
H
I
I
I
L L L
Climate yield constraints
Temperature constraints Temperature constraints Temperature constraints Rain-fed Rain-fed Rain-fed
Crop Crop type Crop/LUT input Time period input Time period input Time period
Historical 30 years Baseline Future Historical 30 years Baseline Future Historical 30 years Baseline Future
H
√ √ √ H
√ √ √ H
√ √
I
√ √ I
√ √ I
√ L
√ √ L
√ √ L
√
Temperature constraints Temperature constraints Temperature constraints
Irrigated Irrigated Irrigated
Crop Crop type Crop/LUT
input Time period input Time period input Time period
Historical 30 years Baseline Future Historical 30 years Baseline Future Historical 30 years Baseline Future
H
√ √ H
√ √ H
√
I
√ √ I
√ √ I
√ L
L
L

Page | 66
Moisture constraints Moisture constraints Moisture constraints Rain-fed Rain-fed Rain-fed
Crop Crop type Crop/LUT
input Time period input Time period input Time period
Historical 30 years Baseline Future Historical 30 years Baseline Future Historical 30 years Baseline Future H √ √ √ √ H √ √ √ √ H √ √ √
I
√ √ I
√ √ I
√
L
√ √ L
√ √ L
√
Moisture constraints Moisture constraints Moisture constraints Irrigated Irrigated Irrigated
Crop Crop type Crop/LUT
input Time period input Time period input Time period Historical 30 years Baseline Future Historical 30 years Baseline Future Historical 30 years Baseline Future H
√ √ √ H
√ √ √ H
√ √
I
√ √ I
√ √ I
√ L
L
L
Agro-climatic constraints Agro-climatic constraints Agro-climatic constraints Rain-fed Rain-fed Rain-fed
Crop Crop type Crop/LUT
input Time period input Time period input Time period
Historical 30 years Baseline Future Historical 30 years Baseline Future Historical 30 years Baseline Future
H
√ √ H
√ √ H
√
I
√ √ I
√ √ I
√
L
√ √ L
√ √ L
√
Agro-climatic constraints Agro-climatic constraints Agro-climatic constraints
Irrigated Irrigated Irrigated
Crop Crop type Crop/LUT
input Time period input Time period input Time period
Historical 30 years Baseline Future Historical 30 years Baseline Future Historical 30 years Baseline Future
H
√ √ H
√ √ H
√
I
√ √ I
√ √ I
√
L
L
L
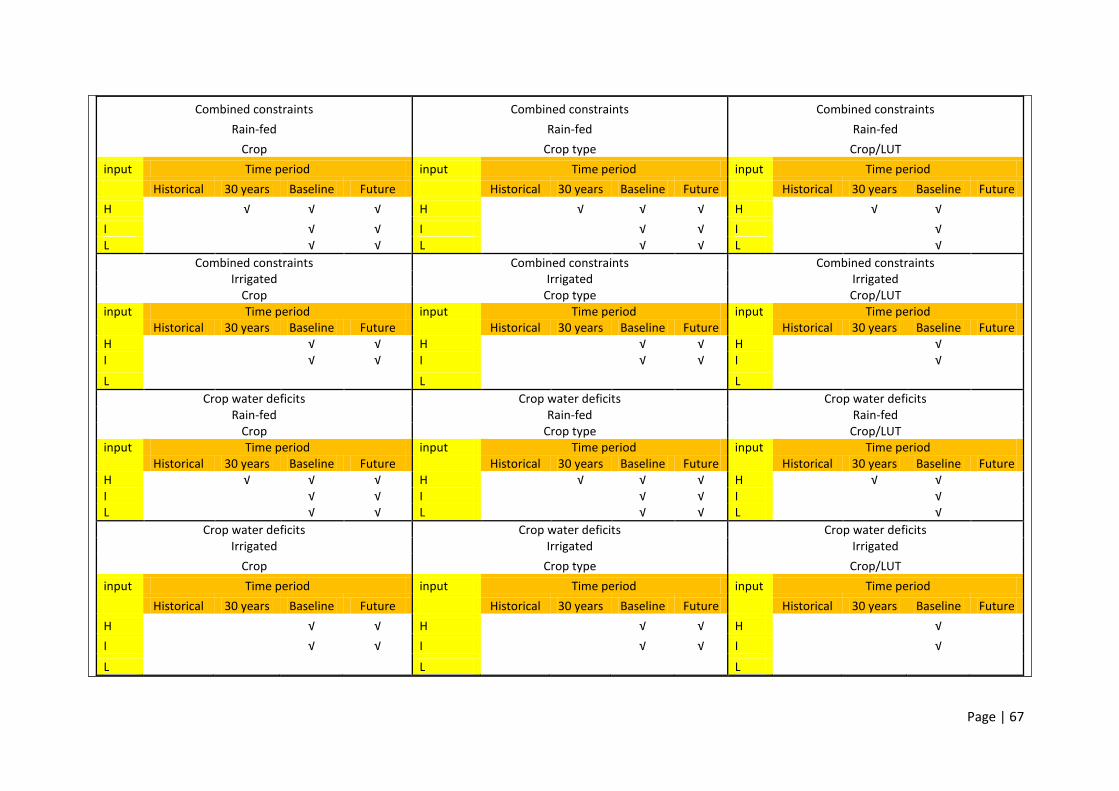
Page | 67
Combined constraints Combined constraints Combined constraints
Rain-fed Rain-fed Rain-fed
Crop Crop type Crop/LUT
input Time period input Time period input Time period
Historical 30 years Baseline Future Historical 30 years Baseline Future Historical 30 years Baseline Future
H
√ √ √ H
√ √ √ H
√ √
I
√ √ I
√ √ I
√ L
√ √ L
√ √ L
√
Combined constraints Combined constraints Combined constraints Irrigated Irrigated Irrigated
Crop Crop type Crop/LUT input Time period input Time period input Time period Historical 30 years Baseline Future Historical 30 years Baseline Future Historical 30 years Baseline Future H
√ √ H
√ √ H
√
I
√ √ I
√ √ I
√
L
L
L
Crop water deficits Crop water deficits Crop water deficits Rain-fed Rain-fed Rain-fed
Crop Crop type Crop/LUT input Time period input Time period input Time period Historical 30 years Baseline Future Historical 30 years Baseline Future Historical 30 years Baseline Future H
√ √ √ H
√ √ √ H
√ √
I
√ √ I
√ √ I
√ L
√ √ L
√ √ L
√
Crop water deficits Crop water deficits Crop water deficits Irrigated Irrigated Irrigated
Crop Crop type Crop/LUT
input Time period input Time period input Time period
Historical 30 years Baseline Future Historical 30 years Baseline Future Historical 30 years Baseline Future
H
√ √ H
√ √ H
√
I
√ √ I
√ √ I
√
L L L

Page | 68
Crop calendar
Start and length of growth cycle* Start and length of growth cycle* Start and length of growth cycle*
Rain-fed Rain-fed Rain-fed
Crop Crop type Crop/LUT
input Time period input Time period input Time period
Historical 30 years Baseline Future Historical 30 years Baseline Future Historical 30 years Baseline Future
H
√ √ H
√ √ H
√
I
√ √ I
√ √ I
√
L
√ √ L
√ √ L
√
Start and length of growth cycle* Start and length of growth cycle* Start and length of growth cycle*
Irrigated Irrigated Irrigated
Crop Crop type Crop/LUT
input Time period input Time period input Time period
Historical 30 years Baseline Future Historical 30 years Baseline Future Historical 30 years Baseline Future
H
H
H
I
I
I
L L L
* Crop calendar: (i) Annual crops only. (ii) Length of growth cycle only for crops and crop types
Agro-ecological suitability and productivity
Crop suitability index (class and value) Crop suitability index (class and value) Crop suitability index (class and value)
Rain-fed (all land) Rain-fed (all land) Rain-fed (all land)
Crop Crop type Crop/LUT
input Time period input Time period input Time period
Historical 30 years Baseline Future Historical 30 years Baseline Future Historical 30 years Baseline Future
H
√ √ H
H
I
√ √ I
I
L √ √ L L

Page | 69
Crop suitability index (class and value) of current cultivated land
Crop suitability index (class and value) of current cultivated land
Crop suitability index (class and value) of current cultivated land
Rain-fed Rain-fed Rain-fed Crop Crop type Crop/LUT
input Time period input Time period input Time period Historical 30 years Baseline Future Historical 30 years Baseline Future Historical 30 years Baseline Future H
√ √ H
H
I
√ √ I
I
L √ √ L L
Crop suitability index (class and value) Crop suitability index (class and value) Crop suitability index (class and value) Irrigated* (irrigated cultivated land) Irrigated* (irrigated cultivated land) Irrigated* (irrigated cultivated land)
Crop Crop type Crop/LUT input Time period input Time period input Time period Historical 30 years Baseline Future Historical 30 years Baseline Future Historical 30 years Baseline Future H
√ √ H
H
I
√ √ I
I
L
L
L
Crop suitability index (class and value) Crop suitability index (class and value) Crop suitability index (class and value)
Irrigated Gravity*(irrigated cultivated land) Irrigated Gravity*(irrigated cultivated land) Irrigated Gravity*(irrigated cultivated land)
Crop Crop type Crop/LUT
input Time period input Time period input Time period
Historical 30 years Baseline Future Historical 30 years Baseline Future Historical 30 years Baseline Future
H
√ √ H
H
I
√ √ I
I
L
L
L
Crop suitability index (class and value) Crop suitability index (class and value) Crop suitability index (class and value)
Irrigated Sprinkler*(irrigated cultivated land) Irrigated Gravity*(irrigated cultivated land) Irrigated Gravity*(irrigated cultivated land)
Crop Crop type Crop/LUT
input Time period input Time period input Time period
Historical 30 years Baseline Future Historical 30 years Baseline Future Historical 30 years Baseline Future
H
√ √ H
H
I
√ √ I
I
L
L
L
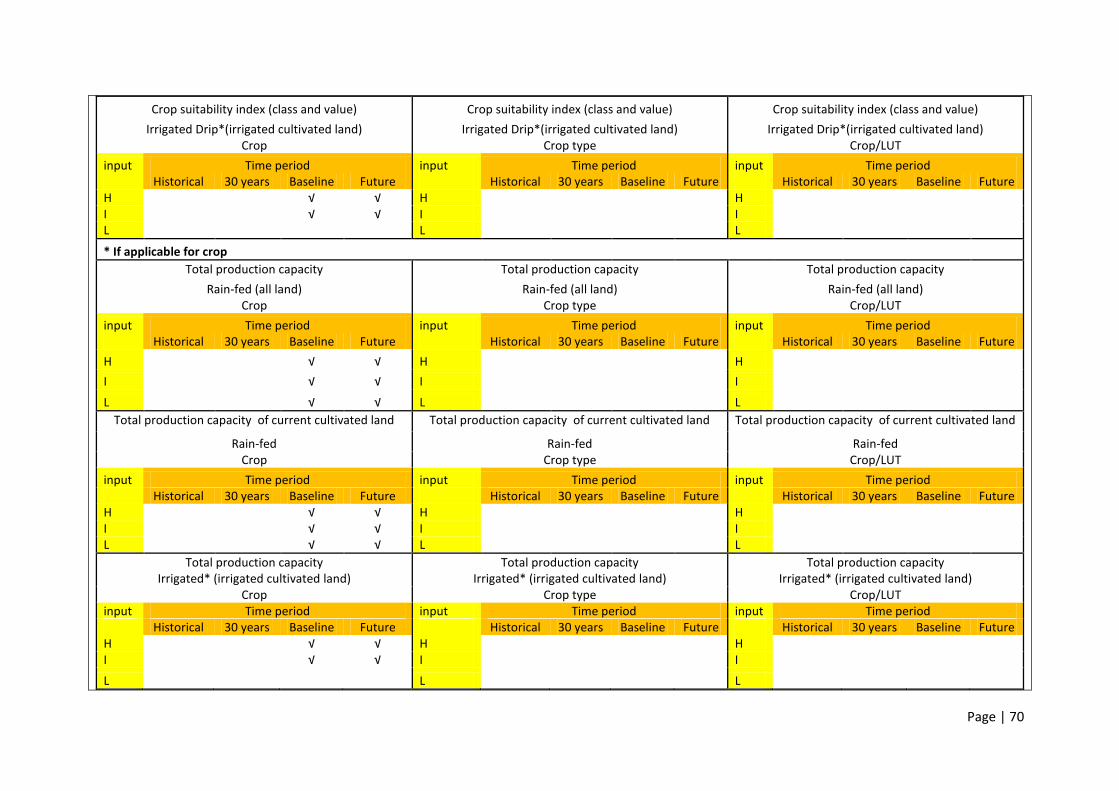
Page | 70
Crop suitability index (class and value) Crop suitability index (class and value) Crop suitability index (class and value)
Irrigated Drip*(irrigated cultivated land) Irrigated Drip*(irrigated cultivated land) Irrigated Drip*(irrigated cultivated land) Crop Crop type Crop/LUT
input Time period input Time period input Time period Historical 30 years Baseline Future Historical 30 years Baseline Future Historical 30 years Baseline Future H
√ √ H
H
I
√ √ I
I
L L L
* If applicable for crop
Total production capacity Total production capacity Total production capacity
Rain-fed (all land) Rain-fed (all land) Rain-fed (all land) Crop Crop type Crop/LUT
input Time period input Time period input Time period Historical 30 years Baseline Future Historical 30 years Baseline Future Historical 30 years Baseline Future
H
√ √ H
H
I
√ √ I
I
L
√ √ L
L
Total production capacity of current cultivated land Total production capacity of current cultivated land Total production capacity of current cultivated land
Rain-fed Rain-fed Rain-fed Crop Crop type Crop/LUT
input Time period input Time period input Time period Historical 30 years Baseline Future Historical 30 years Baseline Future Historical 30 years Baseline Future H
√ √ H
H
I
√ √ I
I
L √ √ L L
Total production capacity Total production capacity Total production capacity Irrigated* (irrigated cultivated land) Irrigated* (irrigated cultivated land) Irrigated* (irrigated cultivated land)
Crop Crop type Crop/LUT input Time period input Time period input Time period Historical 30 years Baseline Future Historical 30 years Baseline Future Historical 30 years Baseline Future H
√ √ H
H
I
√ √ I
I
L L L
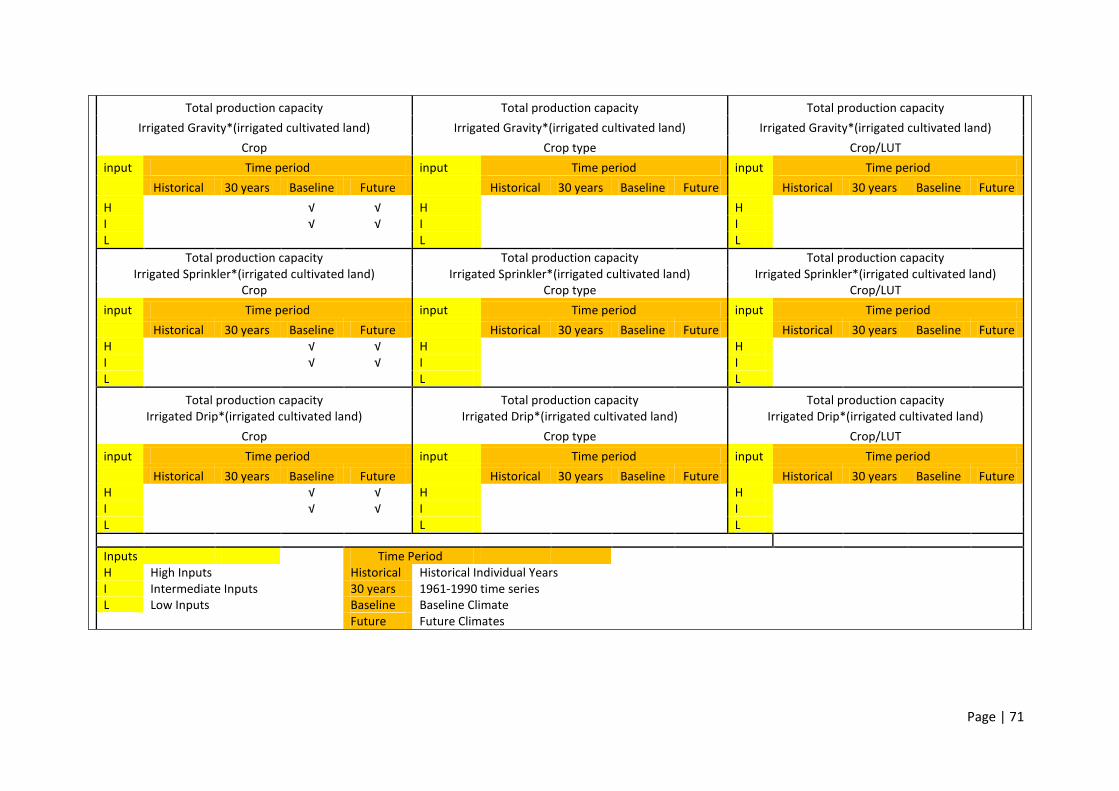
Page | 71
Total production capacity Total production capacity Total production capacity
Irrigated Gravity*(irrigated cultivated land) Irrigated Gravity*(irrigated cultivated land) Irrigated Gravity*(irrigated cultivated land)
Crop Crop type Crop/LUT
input Time period input Time period input Time period
Historical 30 years Baseline Future Historical 30 years Baseline Future Historical 30 years Baseline Future
H
√ √ H
H
I
√ √ I
I
L
L
L
Total production capacity Total production capacity Total production capacity Irrigated Sprinkler*(irrigated cultivated land) Irrigated Sprinkler*(irrigated cultivated land) Irrigated Sprinkler*(irrigated cultivated land)
Crop Crop type Crop/LUT
input Time period input Time period input Time period
Historical 30 years Baseline Future Historical 30 years Baseline Future Historical 30 years Baseline Future H
√ √ H
H
I
√ √ I
I
L
L
L
Total production capacity Total production capacity Total production capacity Irrigated Drip*(irrigated cultivated land) Irrigated Drip*(irrigated cultivated land) Irrigated Drip*(irrigated cultivated land)
Crop Crop type Crop/LUT
input Time period input Time period input Time period
Historical 30 years Baseline Future Historical 30 years Baseline Future Historical 30 years Baseline Future H
√ √ H
H
I
√ √ I
I
L L L
Inputs
Time Period
H High Inputs
Historical Historical Individual Years
I Intermediate Inputs 30 years 1961-1990 time series
L Low Inputs
Baseline Baseline Climate
Future Future Climates

Food and Agriculture Organization of the United Nations
GAEZGlobal Agro-ecological Zones
I I A S A
International Institutefor Applied Systems Analysis
GAEZ v3.0
Global Agro-ecological Zones
User’s Guide


