
Slide 1
FY2015 Half Year Results
Tony Caruso – CEO & Managing Director
Chris Kneipp – Chief Financial Officer
Presentation
26 February 2015
For
per
sona
l use
onl
y

Slide 2
Key Messages
� Maintaining a dominant market position which places us well as the sector recovers
� Completed DMS acquisition
� Key Strategic acquisition
� Further diversification of the business
� Integration is going very well
� Strong balance sheet after a substantial investment
� Market conditions forecast to remain subdued through the remainder of H2
For
per
sona
l use
onl
y

Slide 3
Half Year result in line with market guidance amid tough market conditions
� Revenue of $77.7 million (guidance range of $75-$80 million)
� Underlying EBITDA of $3.8 million
� Underlying NPAT of $0.013 million (guidance of break even)
� Statutory NPAT loss of $5.8 million after impairment
� $7.2 million of free cash flow generated in H1
� Net debt $4.8 million after DMS acquisition
� No profit or loss recognised from DMS up to 31 December 2014
� Interim Dividend of 1 cps
For
per
sona
l use
onl
y

Slide 4
Productivity with a safety always focus
� Group TRIFR 3.54 (based on internal reporting standard on Projects)
� HSEQ leading safety targets 100% compliant on all major projects
� Integration of DMS people and systems underway
Project Hours worked and TRIFR
5.225.85 5.56
3.48 3.133.54
0.00
1.00
2.00
3.00
4.00
5.00
6.00
7.00
0
500000
1000000
1500000
2000000
2500000
Hours Worked GROUP TRIFR(200,000 hours)
TRIFR 3.54
LTIFR 0.66
Man Hours
716,619
For
per
sona
l use
onl
y

Slide 5
Margin pressure in some areas as customers pursue cost reductions
� Revenue in line with previous corresponding period
� Underlying Net profit reduced from lower EBITDA margins
� Underlying EBITDA margin reduced from 6.9% in previous corresponding period to 4.9%, primarily resulting from;
� Reduced equipment utilisation
� Contraction in margins due to current market climate
� Continued third party hire equipment obligations ($0.8 million)
For
per
sona
l use
onl
y

Slide 6
� Revenue increased on PCP from short term contracts
� Margins impacted from;
� Reduced equipment utilisation
� Contraction due to current market climate
� Continued third party hire equipment obligations ($0.8 million)
� Renewed the Anglo Coal Underground Development Services Contract
� Anglo Grosvenor Underground Mine moving towards production
� Development fleet utilisation decreased
� No evidence of insourcing and less labour hire tenders
� Tendering environment more competitive and major projects being deferred
� Broadmeadow roadway development project completed and demobilised
� Tender pipeline predominately lower value short term projects
The underground division continues to maintain a very dominant market position
For
per
sona
l use
onl
y

Slide 7
Our other divisions continue to round out the services we provide to our customers
ENGINEERING
� Workshop throughput was down
� Margins impacted by reduced revenue and pricing competition
� Consumables revenue has increased
� DMS acquisition will provide product diversification and increasing NSW market share
SERVICES
� Competitive environment outside of niche areas
� Goodwill impairment resulting from limited construction pipeline
� Pipeline work has been deferred
MYNESIGHT
� Training activity remained constant
� Market share has increased
� Expanding into oversees markets For
per
sona
l use
onl
y

Slide 8
Strong Balance Sheet maintained after substantial investment
Balance Sheet
� Net Debt $4.8 million post the DMS acquisition
� Loans and borrowings increased to fund the DMS acquisition
0
5
10
15
20
25
30
MIL
LIO
NS
(A
UD
)
HY2015 Cash Flow
For
per
sona
l use
onl
y

Slide 9
Acquiring DMS will mean a more diversified business creating more growth opportunities
• DMS acquired effective 1 January. No results reported H1 FY15.
• Delivered $3.5 million in annualised overhead synergies with further potential synergies
• Integration has progressed ahead of schedule
• New business division (Mastertec) created to group service offerings and simplify reporting
• Secured new work at a strategic East Coast Port and now tendering for another
• Tendering pipeline has increased materially since the acquisition
• H2 will be influenced by timing of shutdowns and other maintenance projects
• Contracting/tendering activity differs to Mastermyne’sbusiness
For
per
sona
l use
onl
y
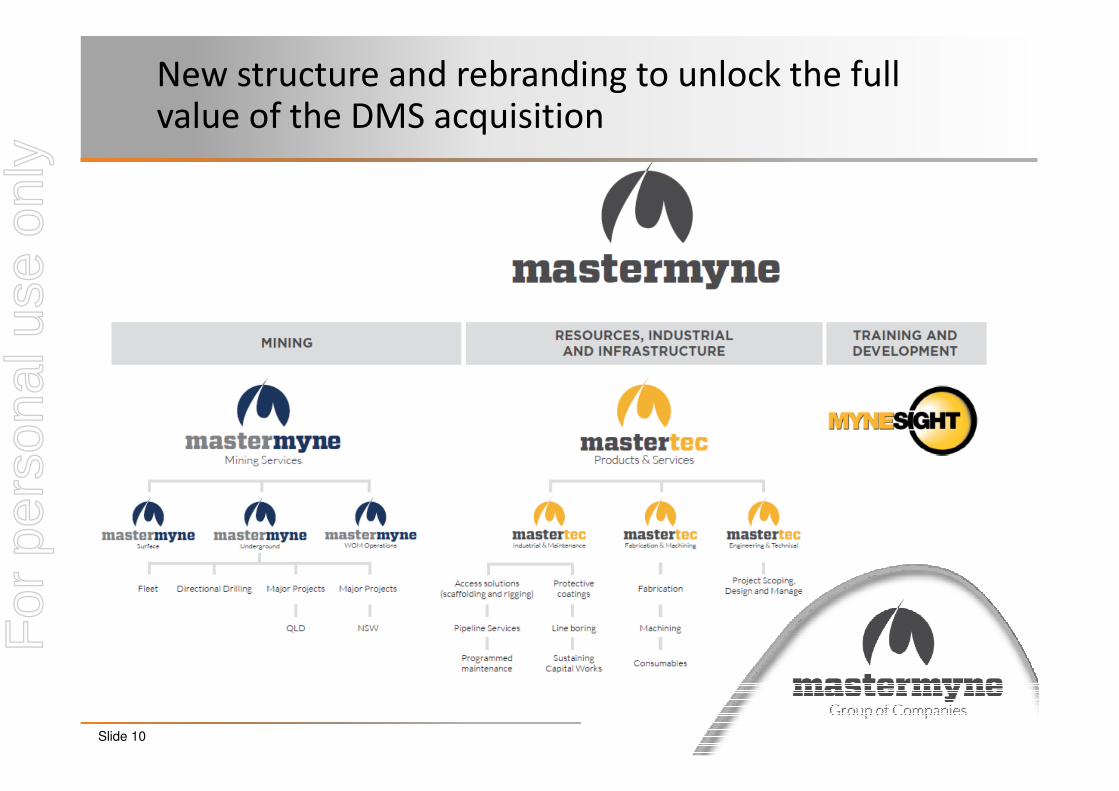
Slide 10
New structure and rebranding to unlock the full value of the DMS acquisition
For
per
sona
l use
onl
y

Slide 11
Diversified business creates significant new market and customer opportunities
Whitehaven Mine
Ulan West Mine
Austar Mine
Metropolitan Mine
Wambo Mine
Angus Place Mine
Appin Mine
Westcliff Mine
Dendrobium Mine
Dalrymple Bay Coal Terminal
Saraji Mine
Peak Downs Mine
Hail Creek Mine
Dalrymple Bay Coal Terminal
Blackwater Mine
Gregory / Crinum Mine
Caval Ridge Mine
Riverside Mine
South Walker Mine
Lake Lyndsay
German Creek Mine
Foxleigh Mine
Dawson Mine
Callide Mine
Moranbah North Mine
Grasstree Mine
Grosvenor Mine
Kestrel Mine
Crinum Mine
Broadmeadow Mine
Carborough Downs Mine
DMS Sites
MYE Sites
For
per
sona
l use
onl
y

Slide 12
� Workforce after the DMS acquisition is 922
� Remuneration across the sector is continuing to reduce towards award levels
� Smaller competitors have developed an advantage in not having industrial instruments that limit their ability to further decrease labour rates
490 518
823
1088
754 733669
253
FY2009 FY2010 FY2011 FY2012 FY2013 FY2014 HY2015
Mastermyne Group DMS
Employee Numbers (FTE)
We are continuing to remain competitive on our labour costs
For
per
sona
l use
onl
y

Slide 13
The second half will see continuing tough conditions with similar results to H1
• Operator costs have reduced and coal prices expected to remain stable
• Major projects continue to be deferred
• Increased activity on the Grosvenor project
• Secured approx. $18 million in short term projects
• Equipment utilisation expected to remain at low levels
• Tendering dominated by short term low value projects
• Order book of $317 million with $80 million in H2
• 2HY guidance: Revenue range $95 - $100 million, NPAT $0.8 to $1.2 million
For
per
sona
l use
onl
y

Slide 14
Key Messages
� Maintaining a dominant market position which places us well as the sector recovers
� Completed DMS acquisition
� Key Strategic acquisition
� Further diversification of the business
� Integration is going very well
� Strong balance sheet after a substantial investment
� Market conditions forecast to remain subdued through the remainder of H2
For
per
sona
l use
onl
y

Slide 15
Appendices
For
per
sona
l use
onl
y

Slide 16
Corporate Overview
Capital Structure 12 Month Trading History
Share price as at 24 February ($) 0.32
Shares on issue (m) 91.1
Market cap ($m) 29.1
Net Debt as at 30 June 2014 ($m) 4.8
Enterprise value ($m) 33.9
Board
Col Bloomfield Non-executive Chairman
Anthony (Tony) Caruso Managing Director
Andrew Watts Non-Executive Director
James Wentworth Non-executive Director
Darren Hamblin Non-executive Director
Substantial Shareholders Shareholder Composition
Andrew Watts 12.4%
Darren Hamblin 10.7%
Kenneth, Kamon
Maui Capital
Paradice Investment Management
Wilson Investment Group
9.1%
6.9%
6.4%
5.5%
28%
30%
42%
Board andManagement
InstitutionalInvestors
RetailInvestors
0
1,000
2,000
3,000
4,000
5,000
6,000
7,000
8,000
9,000
10,000
$0.00
$0.10
$0.20
$0.30
$0.40
$0.50
$0.60
$0.70
$0.80
Volume traded ('000s) Share price ($)
For
per
sona
l use
onl
y

Slide 17
HY 2015 ResultsFinancial Summary
Summary Income Statement
($’000) HY2015 HY2014 Change(%)
Total Revenue77,739 77,270 0.6%
Statutory EBITDA2,039 5,351 (61.9%)
Statutory EBITA(1,366) 1,954 (169.9%)
Goodwill impairment(4,538) -
Statutory Profit/(loss) before tax(6,197) 1,207 (613.4%)
Tax benefit/(expenses)447 (435)
Statutory profit/(loss) after tax(5,750) 772 (844.8%)
Adjustments1,2,36,288 -
Underlying EBITDA3,789 5,351 (29.2%)
Underlying profit/(loss) after tax13 1,207 (98.9%)
Underlying EBITDA margins4.87% 6.93% (2.05%)
EPS (cps) (7.6) 1 (860%)
DPS (cps) 1 1 0%
1. Adjustments include $4.538 million impairment of goodwill2. Adjustments include $1.407 million transaction and implementation costs associated with
the DMS acquisition3. Adjustments include $0.343 million restructuring costs
For
per
sona
l use
onl
y

Slide 18
UndergroundUndergroundUndergroundUnderground EngineeringEngineeringEngineeringEngineering ServicesServicesServicesServices
($’000)($’000)($’000)($’000) DecDecDecDec----14141414 DecDecDecDec----13131313 DecDecDecDec----14141414 DecDecDecDec----13131313 DecDecDecDec----14141414 DecDecDecDec----13131313
External Revenue69,095 66,324 8,644 9,764 - 1,182
Inter Segment Revenue**** 3,104 680 638 563 - 62
Total Divisional RevenuesTotal Divisional RevenuesTotal Divisional RevenuesTotal Divisional Revenues72,199 72,199 72,199 72,199 67,004 67,004 67,004 67,004 9,282 9,282 9,282 9,282 10,327 10,327 10,327 10,327 ---- 1,244 1,244 1,244 1,244
Profit Before TaxProfit Before TaxProfit Before TaxProfit Before Tax (4,538)
PBT%PBT%PBT%PBT% (90)(90)(90)(90) 393 393 393 393 446 446 446 446 1,063 1,063 1,063 1,063 (4,821)(4,821)(4,821)(4,821) (129)(129)(129)(129)
*Intersegment revenues are arms length transactions between the divisions for goods and services provided including capital equipment.
HY 2015 ResultsDivisional Performance
For
per
sona
l use
onl
y

Slide 19
$AUD (000's) DecDecDecDec----14141414 DecDecDecDec----13131313
EBITDA (Statutory)EBITDA (Statutory)EBITDA (Statutory)EBITDA (Statutory) 2,0392,0392,0392,039 5,3515,3515,3515,351
Movements in Working Capital 8,319 6,503
Non cash items 8 6
Net Interest Costs (413) (685)
Income tax payments (499) (1,401)
Net Operating Cash FlowNet Operating Cash FlowNet Operating Cash FlowNet Operating Cash Flow 9,4549,4549,4549,454 9,7749,7749,7749,774
Proceeds from exercise of share options 146
Net Capex (includes intangibles) (455) (1,108)
Net borrowings/(repayments) 8,684 (4,112)
Interest Received 120 160
Acquisition of Subsidiary (10,581)
Free Cash FlowFree Cash FlowFree Cash FlowFree Cash Flow 7,2227,2227,2227,222 4,8604,8604,8604,860
Dividends (1,057) (2,713)
Net increase/(decrease) in cash and cash equivalentsNet increase/(decrease) in cash and cash equivalentsNet increase/(decrease) in cash and cash equivalentsNet increase/(decrease) in cash and cash equivalents 6,1656,1656,1656,165 2,1472,1472,1472,147
Cash and cash equivalents at beginning of period 8,810 10,223
Cash and cash equivalents at end of periodCash and cash equivalents at end of periodCash and cash equivalents at end of periodCash and cash equivalents at end of period 14,97514,97514,97514,975 12,37012,37012,37012,370
HY2015 ResultsWorking Capital & Cash Flow
For
per
sona
l use
onl
y

Slide 20
HY2015 Results
$AUD (000's) Dec-14 Jun-14
Assets
Cash and cash equivalents 14,975 8,810
Trade and other receivables 28,074 37,917
Inventories 3,447 2,742
Current Tax Assets 839
Total current assets 47,335 49,469
Property, plant and equipment 32,631 27,732
Intangible assets 21,128 19,642
Total non-current assets 53,759 47,374
Total assets 101,094 96,843
Liabilities
Trade and other payables 14,260 16,265
Loans and borrowings 5,168 5,102
Employee benefits 7,058 6,655
Current tax payable - 10
Total current liabilities 26,486 28,032
Loans and borrowings 14,633 5,941
Employee benefits 261 145
Deferred tax liabilities 1,725 2,063
Total non-current liabilities 16,619 8,149
Total liabilities 43,105 36,181
Net assets 57,989 60,662
Working Capital & Cash Flow
For
per
sona
l use
onl
y

Slide 21
�Total Order Book - $317 million (includes DMS)
�To be delivered in H2 FY15 - $80 million
2009 2010 2011 2012 2013 2014 2015 2016 2017 2018
Carborough Downs Framework Agreement
Kestrel Strata Support
DBCT Scaffolding Services
Broadmeadow Conveyor Installation
Crinum Mine
Dendrobium Mine Services
Appin Area 9
Westcliff Colliery
Anglo Moranbah Region Drivage Contract
Anglo Moranbah Region Umbrella Contract
Financial Years
Previous Contracts Current Contract Option
Orderbook
For
per
sona
l use
onl
y
Slide 22
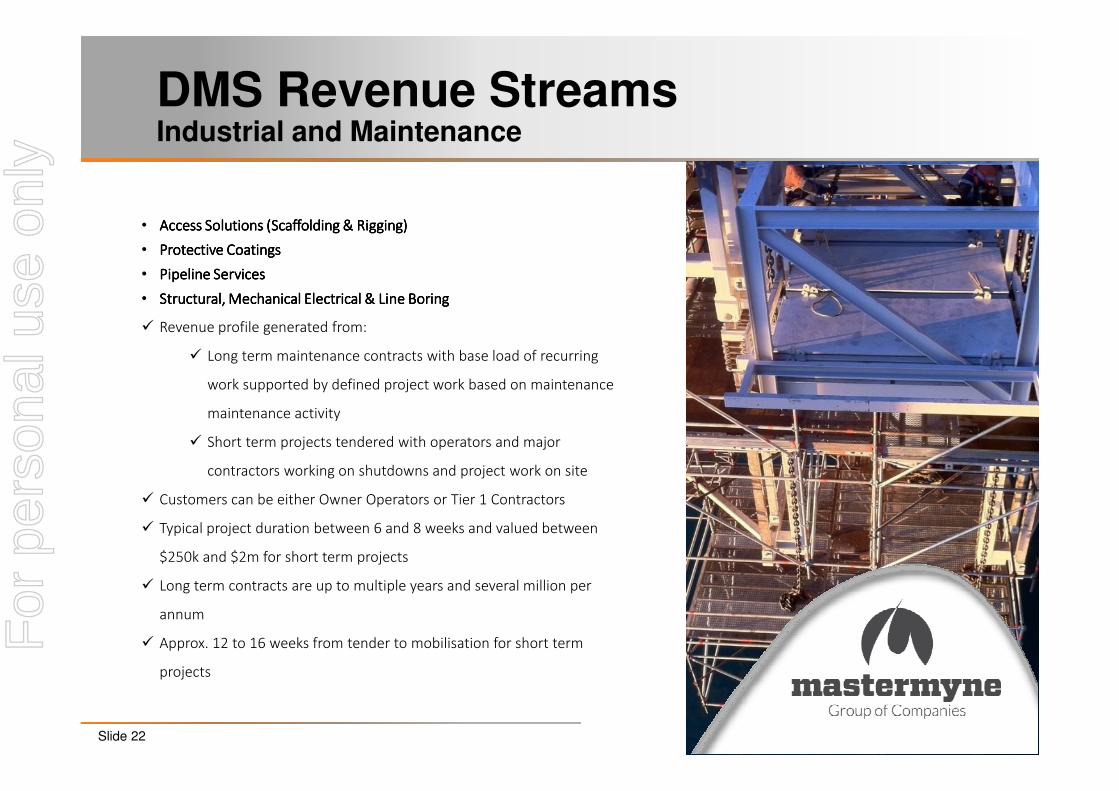
• Access Access Access Access Solutions Solutions Solutions Solutions (Scaffolding (Scaffolding (Scaffolding (Scaffolding & Rigging)& Rigging)& Rigging)& Rigging)
• Protective CoatingsProtective CoatingsProtective CoatingsProtective Coatings
• Pipeline ServicesPipeline ServicesPipeline ServicesPipeline Services
• Structural, Mechanical Electrical & Line BoringStructural, Mechanical Electrical & Line BoringStructural, Mechanical Electrical & Line BoringStructural, Mechanical Electrical & Line Boring
� Revenue profile generated from:
� Long term maintenance contracts with base load of recurring
work supported by defined project work based on maintenance
maintenance activity
� Short term projects tendered with operators and major
contractors working on shutdowns and project work on site
� Customers can be either Owner Operators or Tier 1 Contractors
� Typical project duration between 6 and 8 weeks and valued between
$250k and $2m for short term projects
� Long term contracts are up to multiple years and several million per
annum
� Approx. 12 to 16 weeks from tender to mobilisation for short term
projects
Industrial and MaintenanceDMS Revenue Streams
For
per
sona
l use
onl
y

Slide 23
• FabricationFabricationFabricationFabrication
• Machining Machining Machining Machining
• ConsumablesConsumablesConsumablesConsumables
� Jobbing shop with work secured by quoting new customers or repeat
customers.
� Typically 6 to 8 weeks pipeline visibility
� Jobs range in size from thousands of dollars up to major work packages
packages of several million
� Consumables revenue is either one off sales or through Forward
Purchasing Agreements (FPA) for agreed list of items supplied over a
contract period
Fabrication and MachiningDMS Revenue Streams
For
per
sona
l use
onl
y

Slide 24
Disclaimer and Important NoticeThe following disclaimer applies to this presentation and any information provided regarding the information contained in this presentation (the Information). You
are advised to read this disclaimer carefully before reading or making any other use of this presentation or any information contained in this presentation.
Except as required by law, no representation or warranty, express or implied, is made as the fairness, accuracy, completeness, reliability or correctness of the
Information, opinions and conclusions, or as to the reasonableness of any assumption contained in this document. By receiving this document and to the extent
permitted by law, you release Mastermyne Group Limited (“Mastermyne”), and its officers, employees, agents and associates from any liability (including in
respect of direct, indirect or consequential loss or damage or loss or damage arising by negligence) arising as a result of the reliance by you or any other person
on anything contained in or omitted from this document.
Statements contained in this material, particularly those regarding the possible or assumed future performance, costs, dividends, returns, production levels or
rates, prices, reserves, potential growth of Mastermyne, industry growth or other trend projections and any estimated company earnings are or may be forward
looking statements. Such statements relate to future events and expectations and as such involve known and unknown risks and uncertainties, many of which are
outside the control of, and are unknown to, Mastermyne and its officers, employees, agents or associates. In particular, factors such as variable climatic
conditions and regulatory decisions and processes may cause or may affect the future operating and financial performance of Mastermyne. Actual results,
performance or achievement may vary materially from any forward looking statements and the assumptions on which those statements are based. The
Information also assumes the success of Mastermyne’s business strategies. The success of the strategies is subject to uncertainties and contingencies beyond
Mastermyne’s control, and no assurance can be given that the anticipated benefits from the strategies will be realised in the periods for which forecasts have
been prepared or otherwise. Given these uncertainties, you are cautioned to not place undue reliance on any such forward looking statements. Mastermyne
undertakes no obligation to revise the forward looking statements included in this presentation to reflect any future events or circumstances.
In addition, Mastermyne’s results are reported under Australian International Financial Reporting Standards, or AIFRS. This presentation includes references to
EBITA and NPAT. These references to EBITA and NPAT should not be viewed in isolation or considered as an indication of, or as an alternative to, measures
AIFRS or as an indicator of operating performance or as an alternative to cash flow as a measure of liquidity.
The distribution of this Information in jurisdictions outside Australia may be restricted by law and you should observe any such restrictions. This Information does
not constitute investment, legal, accounting, regulatory, taxation or other advice and the Information does not take into account any investment objectives or legal,
accounting, regulatory, taxation or financial situation or particular needs. You are solely responsible for forming your own opinions and conclusions on such
matters and the market and for making your own independent assessment of the Information. You are solely responsible for seeking independent professional
advice in relation to the Information and any action taken on the basis of the Information. No responsibility or liability is accepted by Mastermyne or any of its
officers, employees, agents or associates, nor any other person, for any of the Information or for any action taken by you or any of your officers, employees,
agents or associates on the basis of the Information.
For
per
sona
l use
onl
y

Slide 25
CONTACT www.mastermyne.com.auwww.mastermyne.com.auwww.mastermyne.com.auwww.mastermyne.com.au
Information for Investors / Analysts:Information for Investors / Analysts:Information for Investors / Analysts:Information for Investors / Analysts:
Tony Caruso – Managing Director:
(07) 4963 0400
Chris Kneipp– Company Secretary:
(07) 4963 0400
Colin Bloomfield – Chairman:
(07) 4963 0400
For
per
sona
l use
onl
y


