
Fundamentals ofSelf-Funded Health Plans
SIIA National Educational Conference & ExpoSIIA National Educational Conference & ExpoOctober 5, 2014
Phoenix, Arizona
Presented by Ron DewsnupPresident & General Manager
Allegiance Benefit Plan Management, Inc.
1

Introduction• This is a beginner-level session that will describe how
self-insured group health plans are structured, how todetermine whether self-insurance is an appropriateplan funding option, regulatory requirements andbusiness partner selection.– Why self fund
– Design
– Financing
– Excess loss
– Reserves
– Reports
– Management
2

Why self fund
The employer pays claimsand administrative expensesdirectly rather than throughpremiums to an insurancecompany.
What isself-funding?
company.
3

Why self fundC
ost
FullyInsured
Self Funded withStop Loss
FullySelf Funded
Risk
4

Why self fund• Self funded expenses
– Claims– Administration
• Payment• Health mgmt• Compliance
– Excess loss premiums– Reserves– Advisory services
• Fully insured premiums– Premiums
• Claims• Risk charges• Profit• Administration
– Payment– Health mgmt– Compliance (State v. Federal)
• Premium taxes• Reserves• Reserves• Advisory services
$-
$2,000,000.00
$4,000,000.00
$6,000,000.00
$8,000,000.00
$10,000,000.00
$12,000,000.00
$14,000,000.00
Self Funded Fully Insured
Possible Risk
Probable Savings
Profit
Premium Taxes
Risk Charges
Network Access
Utilization Management
Administration
Change in Reserves
Stop Loss Premiums
Claims
5

Why Self Fund
Admin 3.5%
Health Care Mgmt 1.1% Network Access 0.8%
Advisory 0.6%
Claims Expense 94%
Claims 88.3%SL Premiums 4.4%Change in Reserve 1.3%
6

$4,000
$5,000
$6,000
$7,000
$8,000
$9,000
Why self fundIn this example, claims costs are lower than expected in years 1, 3, & 4
$0
$1,000
$2,000
$3,000
$4,000
1st Year 2nd Year 3rd Year 4th Year
Actual Claims
7

Why self fund• Advantages
– Benefit design flexibility
– Cash flow management
– Reduced premium taxes
– Lower insurance company– Lower insurance company
• Profits
• Risk charges
8

Why self fund• Focus on attention on areas of impact
– Education on utilization and impact
– Education on and incentives for healthier lifestyles
– Health care management interventions– Health care management interventions
– Management of high cost claims
– Management of chronic conditions
9

Developing plan design• Traditional insurance principles
The consumer budgets and plansfor predictable costs
and seeks insurance coveragefor “catastrophic” expenses.
• “Consumer driven health care” attempts to
– Return to traditional insurance principles, and
– Re-establish the financial discussion betweenprovider and patient (supply and demand).
10

Developing plan design• Relying on traditional principles and
consumerism
– The model plan:
• Ensures a significant financial stake (high deductibles)
• Automatically incorporates inflation adjustments• Automatically incorporates inflation adjustments
• Is simple in concept and communication
• Doesn’t simply “squeeze the balloon”
• Facilitates tax advantaged savings
• Educates the consumer on costs and options
• Provides adequate catastrophic coverage.
11

Developing plan design• Deductibles & out of pocket maximums
Spo
nso
red
Hea
lth
Ben
efit
s,2
01
3So
urc
e:K
aise
rH
RET
Surv
eyo
fEm
plo
yer-
Spo
nso
red
Hea
lth
Ben
efit
s,2
01
3
12

Developing plan design• Deductibles & out of pocket maximums
$400
$500
$600
$700
$800
$-
$100
$200
$300
1960 1965 1970 1975 1980 1985 1990 1995 2000 2005 2010
1960=$100 1970=$100
• Impact of inflation on deductibles– $100 in 1960 = $804 in 2014 (CPI only)– $100 in 1970 = $613 in 2014 (CPI only)
• If medical inflation > CPI by 2.5 points– $100 in 1960 = $3,045 in 2013– $100 in 1970 = $1,608 in 2014
13

Developing plan design• Deductibles & out of pocket maximums
– The effect of leveraging
2013 2014 Change
Medical Expense $ 1,750 $ 1,837.50 5.00%
Trend
Deductible 750 750.00 0%
Plan Pays $ 1,000 $ 1,087.50 8.75%
Impact
14

Developing plan design• Network discounts
– Steerage
• Deductible
• Coinsurance
• Out of pocket maximum• Out of pocket maximum
– Non-network benefits
• Percentile of R&C
• Maximum allowable fee
• Out-of-network discounts
• Only if already available in-network
15

Developing plan design• Value of network benefit differential
Non-Network Network
Benefits 70% 90%
OV MSRP $70.00 $70.00
Plan pays $49.00 $49.00
Allowed $54.44
$ not allowed $15.56
Min Discount % 22.2%
16

Developing plan design• Discounts or net savings?
– Hospitals
Hospital A Hospital B
40% 20% % Discount
$ 12,000 $ 7,500 MSRP
– Better benefit for better value• Assuming similar quality outcomes
$ 12,000 $ 7,500 MSRP
$ 4,800 $ 1,500 $ Discount
$ 7,200 $ 6,000 Allowed plan charges
17

Developing plan design
Option A Option B Option C
Deductible
• In-network
• Out of network
$1,000/$2,000
$2,000/$4,000
$1,500/$3,000
$3,000/$6,000
$2,000/$4,000
$4,000/$8,000
Co-insuranceCo-insurance
• In-network
• Out of network
80%
60%
80%
60%
80%
60%
Out of Pocket
• In-network
• Out of network
$6,350/$12,700
$6,350/$12,700
$6,350/$12,700
$6,350/$12,700
$6,350/$12,700
$6,350/$12/700
18

Developing plan design• Same catastrophic coverage
– Easier to accept up-front risk if
• Back end– Is capped
– Not too high
– Place risk on controllable expense– Place risk on controllable expense
• i.e., first dollars not last dollars
19

Developing plan design• Co-pays
– Hold over from “managed care”
– Block automatic inflation adjustment
– Remove consumer’s need to understand price
– Motivate consumer to get more services– Motivate consumer to get more services
• Coinsurance
– Simple
– Inflation adjusted
– Involves the consumer on all transactions
20

Developing plan design• Scheduling benefits
– Fully scheduled benefit
– RVU conversion
– No-balance bill contract
– Maximum Eligible Expense– Maximum Eligible Expense
– Schedule certain high costs areas• Implants
• J-codes
– Schedule and move to centers of excellence• Transplants
• Include travel reimbursement to COEs
21

Developing plan design• “Essential Benefits” (current definition)
– Inpatient care, outpatient hospital, & emergency services
– Office visits
– DME and other medical equipment,
– Prescription medications
– Rehab therapies– Rehab therapies
– Mental health & substance abuse services
– Preventive care• The evidence-based items or services that have a rating of A or B
in the current recommendations of the U.S. Preventive ServicesTask Force
– Maternity
– Well-child care, including dental & vision
22

Developing plan design• Value-based plan design
– Pay 100% for generic
• Diabetic drugs and supplies
• Blood pressure medication
• Treatment of lipid problems• Treatment of lipid problems
23

Developing plan design• Wellness
– Testing and reporting
• Blood panels
• Health risk assessments
– Incentives v. disincentives– Incentives v. disincentives
• Participation based
• Outcomes based
• No more than 30% (50% for smoking)
24

Developing plan design• Outcomes based wellness
First stage wellness programBiometric screeningsEducational programsHealth coachingParticipation-based incentives
Next stage wellness programDrive financial accountability through outcomes based incentivesDrive financial accountability through outcomes based incentivesImprove health through
On-line / on-site health coachingPersonalized, web-based portalIndividual and team based goal setting and tracking tools
Reduce risk through reporting, monitoring, tracking and remindersLower costs through risk based plan designs
Additional expansion opportunitiesPCMH for chronic cases and gaps in careEmbedded care coordinationCompliance incentive for providersShared savings incentives
25

Developing plan design• Chronic Condition Management
– Interventions for
• Non-compliant individuals with ongoing, chronicconditions
• High utilization– Medical services (e.g., emergency room)
– Medications
26

Developing plan design• Minimum Essential Coverage
– What is it?
• “The type of coverage an individual needs to meet theindividual responsibility requirement under theAffordable Care Act.” (HealthCare.gov)
• Not “essential health benefits”• Not “essential health benefits”
• Not “minimum value”
27
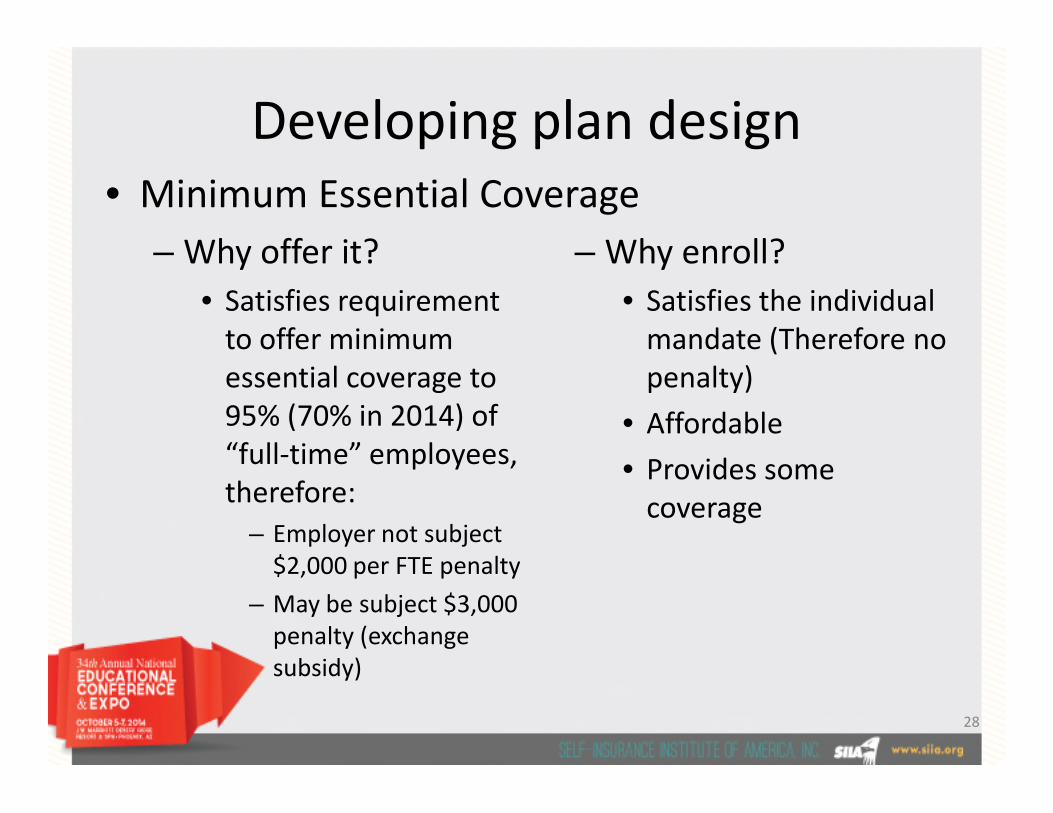
Developing plan design
– Why offer it?
• Satisfies requirementto offer minimumessential coverage to95% (70% in 2014) of
– Why enroll?
• Satisfies the individualmandate (Therefore nopenalty)
• Affordable
• Minimum Essential Coverage
95% (70% in 2014) of“full-time” employees,therefore:
– Employer not subject$2,000 per FTE penalty
– May be subject $3,000penalty (exchangesubsidy)
• Affordable
• Provides somecoverage
28

• Normal market– Increased demand
– Increased price
– Increased profit
– Increased supply
Plan financing• Health care market
– Increased demand
– Increased price
– Increased profit
– Increased supply– Increased supply
– Decreased price
– Equilibrium
– Increased supply
– Increased demand
– Cycle repeats
ReasonsConsumer ≠ payer
Priority of health care
Etc.29

Plan financing• Illustrative health care cost trend
Price Inflation 3.00% 2.50%
Utilization 1.50% 0.25%
New technology 1.00% 0.25%
Leveraging 1.00% 0.25%Leveraging 1.00% 0.25%
Cost shifting 1.00% 0.50%
Demographic shifts 0.50% 0.50%
Defensive medicine 0.50% 0.50%
Other 0.50% 0.25%
Total 9.00% 5.00%
30

Plan financing• Causes of cost increases
– Components of trend• Advances in technology• Shortage of skilled workers (labor
costs)• Demographics: aging of the
population
• Epidemiological changes• Introduction of new diseases• Increased incidence of current
disease states• Regulations (unfunded
Dr. Edward F. X. HughesLuminX User Group Conference
population• Access through health insurance• Health insurance v. health
benefit• Increased access with 3rd party
payer• Government programs (e.g.
Medicare)
• Regulations (unfundedmandates)
• Medical liability• Excess institutional capacity• Excess specialists• Suboptimal decision making• Lack of knowledge among
consumers
31

Plan financing• Calculating costs
– Components
• Claims
• Excess loss premiums
• Administrative fees• Administrative fees
• Health care management fees
• Network access fees
• Advisory services
• Change in reserve requirements
32

Plan financingEnrollment Claims
EmployeeOnly
Employee +Spouse
Ee + Non-SpDep
Ee + Sp + Non-Sp Dep
Total Medical Rx Total
Jul-12 831 303 317 525 1,976 $ 872,105 $ 228,894 1,101,000Aug-12 834 307 321 510 1,972 $ 585,921 $ 228,419 814,340Sep-12 840 309 318 512 1,979 $ 650,367 $ 229,136 879,503Oct-12 845 310 328 520 2,003 $ 1,004,002 $ 231,793 1,235,795Nov-12 850 313 326 521 2,010 $ 661,476 $ 232,597 894,072Dec-12 844 312 325 521 2,002 $ 1,149,692 $ 231,689 1,381,382Jan-13 850 328 336 525 2,039 $ 598,265 $ 236,121 834,386Feb-13 863 326 343 518 2,050 $ 665,327 $ 237,191 902,518Mar-13 869 325 345 521 2,060 $ 707,661 $ 238,315 945,976Apr-13 870 324 347 523 2,064 $ 813,152 $ 238,795 1,051,947May-13 864 318 350 526 2,058 $ 822,608 $ 238,162 1,060,770May-13 864 318 350 526 2,058 $ 822,608 $ 238,162 1,060,770Jun-13 867 316 347 527 2,057 $ 752,483 $ 237,980 990,463Jul-13 862 308 347 533 2,050 $ 1,636,981 $ 237,211 1,874,192
Aug-13 856 305 349 528 2,038 $ 1,099,860 $ 235,842 1,335,702Sep-13 860 313 343 511 2,027 $ 801,817 $ 234,555 1,036,372Oct-13 868 318 348 515 2,049 $ 1,986,859 $ 237,171 2,224,030Nov-13 864 318 348 516 2,046 $ 1,425,784 $ 236,786 1,662,569Dec-13 867 312 350 522 2,051 $ 2,752,663 $ 237,330 2,989,993Jan-14 865 322 353 531 2,071 $ 790,002 $ 239,993 1,029,995Feb-14 871 324 361 537 2,093 $ 810,911 $ 242,543 1,053,454Mar-14 881 324 360 538 2,103 $ 1,404,155 $ 243,667 1,647,822Apr-14 884 324 361 548 2,117 $ 1,448,233 $ 245,219 1,693,452May-14 874 321 360 542 2,097 $ 726,801 $ 242,977 969,778Jun-14 871 326 365 546 2,108 $ 855,874 $ 244,286 1,100,160
Total 20,650 7,606 8,248 12,616 49,120 25,022,999 5,686,672 30,709,671Average 860 317 344 526 2,047 1,042,625 236,945 1,279,570
33
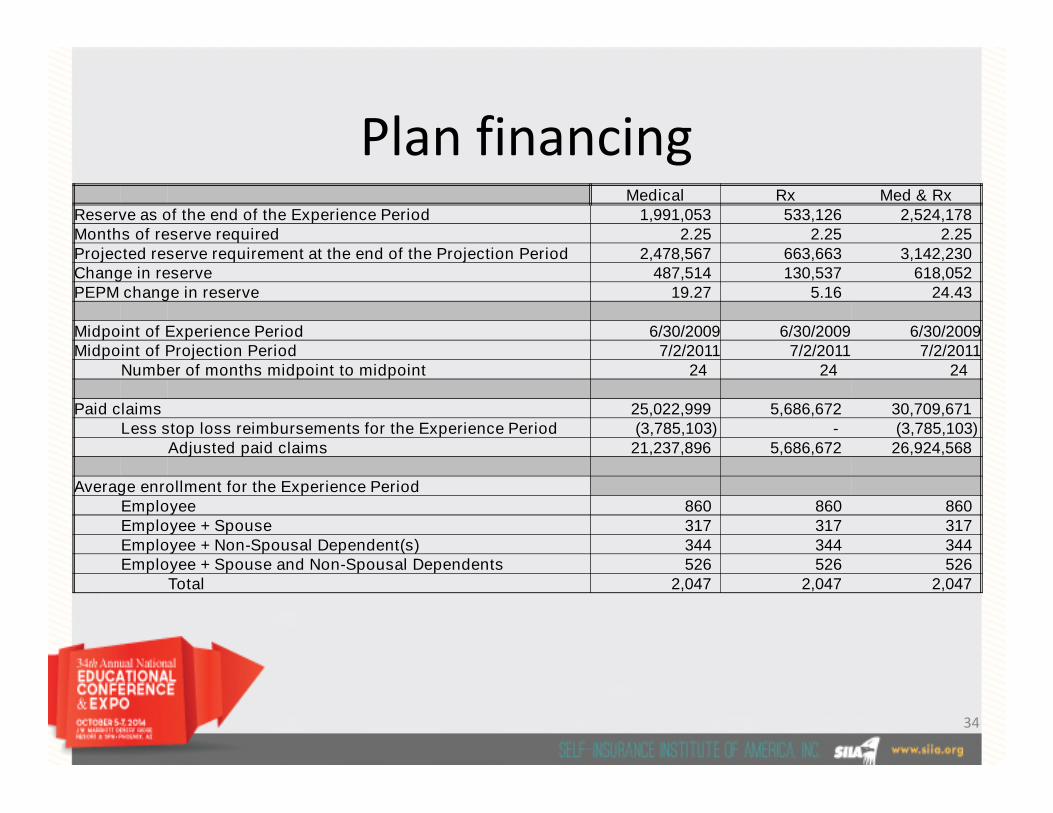
Plan financingMedical Rx Med & Rx
Reserve as of the end of the Experience Period 1,991,053 533,126 2,524,178Months of reserve required 2.25 2.25 2.25Projected reserve requirement at the end of the Projection Period 2,478,567 663,663 3,142,230Change in reserve 487,514 130,537 618,052PEPM change in reserve 19.27 5.16 24.43
Midpoint of Experience Period 6/30/2009 6/30/2009 6/30/2009Midpoint of Projection Period 7/2/2011 7/2/2011 7/2/2011
Number of months midpoint to midpoint 24 24 24
Paid claims 25,022,999 5,686,672 30,709,671Paid claims 25,022,999 5,686,672 30,709,671Less stop loss reimbursements for the Experience Period (3,785,103) - (3,785,103)
Adjusted paid claims 21,237,896 5,686,672 26,924,568
Average enrollment for the Experience PeriodEmployee 860 860 860Employee + Spouse 317 317 317Employee + Non-Spousal Dependent(s) 344 344 344Employee + Spouse and Non-Spousal Dependents 526 526 526
Total 2,047 2,047 2,047
34

Plan financingMedical Rx Med & Rx
Average adjusted paid claims PEPM 431.78 115.61 547.39Trend 10.5% 10.5% 10.5%Midpoint to midpoint trended adjusted paid claims PEPM 522.57 139.92 662.50Change in PEPM reserves 19.27 5.16 24.43
Projected claims PEPM 541.85 145.09 686.93Average enrollment for the Projection Period
Employee 871 871 871Employee + Spouse 326 326 326Employee + Non-Spousal Dependent(s) 365 365 365Employee + Spouse and Non-Spousal Dependents 546 546 546
Total 2,108 2,108 2,108Total 2,108 2,108 2,108
Total claims fund expectations 13,706,539 3,670,071 17,376,610Risk corridor 0.00% 0.00%
Risk adjusted claims fund expections 13,706,539 3,670,071 17,376,610
Expected fixed costs at projected enrollment 535,010 - 535,010Premiums at projected enrollment 1,459,424 1,459,424
Total expected claims, premiums, and costs 15,700,973 3,670,071 19,371,044Fund expense load 0.00% 0.00%
Total fund expectations 15,700,973 3,670,071 19,371,044
35

Plan financing• Calculating contributions
X = (Y÷12) / [A + (B•Ra) + (C•Rb) + (D•Rc)]
Where: X = Single monthly premium equivalentY = Total projected annual cost of the planY = Total projected annual cost of the planA = Projected number of enrollees in Employee onlyB = Projected number of enrollees in Employee + SpC = Projected number of enrollees in Employee + ChD = Projected number of enrollees in Employee + Sp + ChRa= Relative risk factor for Employee + Sp coverageRb= Relative risk factor for Employee + Ch coverage
Rc= Relative risk factor for Employee + SP + Ch coverage
36

Plan financing• Calculating contributions
X = ($19,371,044 ÷12) / [871 + (326 • 2.0) + (365 • 1.7) + (546 • 3.4)]
X = $1,614,254 / (871 + 652 + 621 + 1,856)
X = (Y÷12) / [A + (B•Ra) + (C•Rb) + (D•Rc)]
X = $1,614,254 / (871 + 652 + 621 + 1,856)
X = $1,614,254 / 4,000
Employee + Sp = $807.13Employee + Ch = $686.05
Employee + Sp + Ch = $1,372.12
X = $403.56
37

Plan financingOption A Option B Option C
Deductible
• In-network
• Out of network
$1,000/$2,000
$2,000/$4,000
$1,500/$3,000
$3,000/$6,000
$2,000/$4,000
$4,000/$8,000
Co-insurance
• In-network 80% 80% 80%
• Out of network 60% 60% 60%
Out of Pocket
• In-network
• Out of network
$6,350/$12,700
$6,350/$12,700
$6,350/$12,700
$6,350/$12,700
$6,350/$12,700
$6,350/$12/700
Potential Value 105% 100% 95%
38

Plan financing
Option A Option B Option C
Enrollee $ 423.74 $ 403.56 $ 383.38
Enrollee + Spouse $ 847.49 $ 807.13 $ 766.77
Enrollee + Non-Spousal Dependents $ 720.35 $ 686.05 $ 651.75
Enrolee + Spouse + Dependents $1,440.73 $1,372.12 $1,303.51
105% 100% 95%
39

Plan financing• Calculating contributions
– Budgeting
• Outlays
• Reserves
– Employee contributions– Employee contributions
– COBRA rates
40

Plan financing
41

Plan financing
42

Plan financing• Employee contribution strategies
– National average employee contribution
• Employee ≈ 82%
• Employee + Dependents ≈ 71%
– Percentage of cost– Percentage of cost
– Defined $ amount
– Same across options!
– In trust vs. general assets
43

Plan financing• Employee contributions
Option A Option B Option C
Enrollee$ 423.74 $ 403.56 $ 383.38$ 343.03 $ 343.03 $ 343.03$ 80.71 $ 60.53 $ 40.36
Enrollee + Spouse$ 847.49 $ 807.13 $ 766.77$ 564.99 $ 564.99 $ 564.99$ 282.50 $ 242.14 $ 201.78$ 282.50 $ 242.14 $ 201.78
Enrollee + Non-Spousal Dependents
$ 720.35 $ 686.05 $ 651.75$ 480.24 $ 480.24 $ 480.24$ 240.12 $ 205.82 $ 171.51
Enrolee + Spouse +Dependents
$1,440.73 $1,372.12 $1,303.51$ 960.48 $ 960.48 $ 960.48$ 480.24 $ 411.64 $ 343.03
Assumed Value 105% 100% 95%
44

Excess loss coverage• Excess loss coverage
– Claims basis• 12/12
• Run out
Incurred
1 2 3 4 5 6 7 8 9 10 11 12
Incurred
Paid
• Run out– 12/15– 12/24
• Run in– 15/12– 24/12
1 2 3 4 5 6 7 8 9 10 11 12-3 -2 -1
Paid
Incurred
1 2 3 4 5 6 7 8 9 10 11 12 1 2 3
Paid
45

Excess loss coverage• Excess loss coverage
• Aggregating specific – an additional corridor– Acceptance of an additional layer of risk
– In return for lower fixed costsSpecific
Deductible
John SallyTom
Excess LossInsurer Pays
EmployerPays
Aggregating SpecificCorridor*
JaneGeorge
*For the aggregate of all specific claims
46
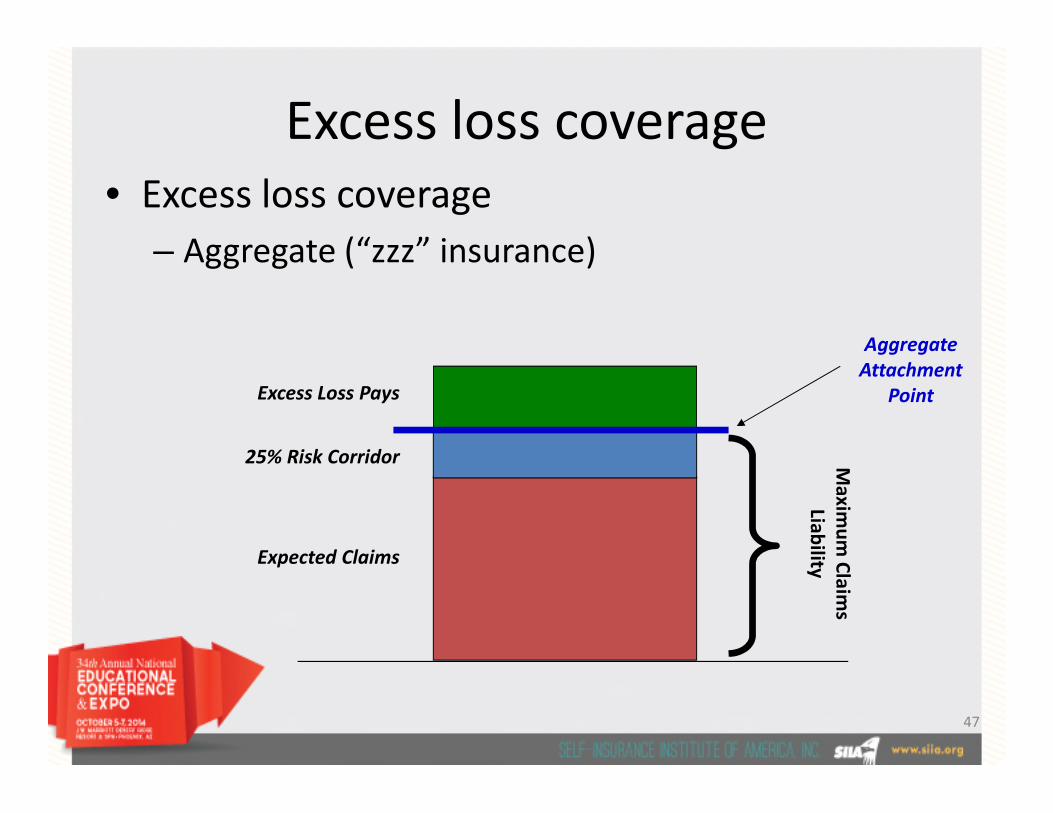
Excess loss coverage• Excess loss coverage
– Aggregate (“zzz” insurance)
Excess Loss Pays
AggregateAttachment
Point
Expected Claims
25% Risk Corridor Maxim
um
Claim
sLiab
ility
Point
47

Excess loss coverage• Fully insured 105% to 110% of expected
30%35%40%45%50%
Pro
bab
ilit
yo
fE
xceed
ing
0%5%
10%15%20%25%
100% 110% 115% 120% 125%
Aggregate Attachment Point
Pro
bab
ilit
yo
fE
xceed
ing
48

Excess loss coverage• Excess loss coverage
– No holes
• Eligibility
• Covered benefits
• Exclusions• Exclusions
• “Follow the fortunes of the plan”
• Plan interpretations– Administrator v. carrier
49

Excess loss coverage• Excess loss coverage
– Disclosure (at underwriting and on-going)• Trigger diagnoses
– UR
– Claims
• Case management notes• Case management notes
• Claims– >= 50% of specific deductible
– 1st report
– Updates
• Experimental and investigational
• If in doubt, disclose it!!!
50

Excess loss coverage• Alternative risk financing vehicles
– Captives• Single employer
• Dedicated cell
• Formulation of a captive insurance company
– Potential risk flow– Potential risk flow• Carrier takes the risk (usually retains a portion)
• Reinsures some or all
• Reinsurer retrocedes to captive
• Captive purchases specific and pool cover
51

Plan reserves• Why do we need them
– Termination liability
– Cash flow protection
– Prudent accrual accounting
– Ability to smooth cost changes from year to year– Ability to smooth cost changes from year to year
52

Plan reservesAmount Factor Extension
Calculation of Asset Risk1Off Balance Sheet-Security Deposit with DOI $ 775,000 0.010 $ 8,0002Class 1 Bonds $ 6,000,000 0.003 $ 18,0003Class 2 Bonds $ 4,000,000 0.010 $ 40,0004Cash $ 4,500,000 0.003 $ 14,0005US Treasury Obligations $ 3,000,000 - $ -6Preferred Stocks $ - 0.065 $ -7Common Stocks & Mutual Funds $ - 0.150 $ -8Property and equipment assets $ - 0.100 $ -9 Asset Risk RBC $ 18,275,000 a $ 80,000
Calculation of Underwriting Risk Med Dental Other1Premium, net of reinsurance e $ 79,469,000 $ 1 $ 12Net Incurred Claims f $ 69,504,000 $ 1 $ 13UW Risk Claims Ratio f/e 0.875 1.000 1.0004UW Risk Factor 0.125 0.120 0.1305 UW Risk RBC $ 8,679,562 $ 0 $ 0
b $ 8,679,562Calcualtion of Credit RiskCalcualtion of Credit Risk
1Reinsurance Recoverable $ 100,000 0.005 $ 1,0002Investment Income Receivable $ 125,000 0.010 $ 1,000
3Due from affiliates $ - 0.050 $ -4 Credit Risk c $ 2,000
Calculation of Business Risk1Admin Expenses X Factor $ 9,941,000 0.057 $ 567,0002Non-underwritten and Limited Business Risk $ - - $ -3Premiums Subject to Guaranty Fund Assess $ - 0.005 $ -
4Excessive Growth > safe harbor level $ - 0.500 $ -5 Business Risk d $ 567,000
Company Action Level (CAL) SQRT(a^2+b^2+c^2+d^2) $ 8,698,430Regulatory Action Level ACL*1.5 $ 6,523,823Authorized Control Level (ACL) CAL/2 $ 4,349,215Mandatory Control Level ACL*.70 $ 3,044,451
E(Loss) $ 499,000Total Adjusted RBC 1.5 $ 12,624,126
Excess (Deficiency) versus CAL $ 3,925,69653

Plan reserves• Setting reserves
– Types• Claims
– Adjudicated but not paid
– Received but not adjudicated
– Incurred but not received
• Administrative• Administrative– Claims payment
– Network access
– Legal / consultative
• Risk factor– Offset for confidence level on projections
• Rate stabilization– Smoothing mechanism for gains and losses
54

Plan reserves• Setting reserves
– Necessary information
• Historical data on monthly claims run out
• Changes in submission characteristics
• Changes in payment characteristics• Changes in payment characteristics
• Known large claims yet to be received
– Building reserves
– Annual change in reserves
55

Plan reserves• Setting reserves
Jan Feb Mar Apr May Jun Jul Aug Sep Oct Nov DecJan 13Feb 13Mar13Apr 13May13Jun 13Jul 13
Aug 13Sep 13Sep 13Oct 13Nov 13Dec 13Jan 14Feb 14Mar 14Apr 14
May 14Jun 14
Total
56
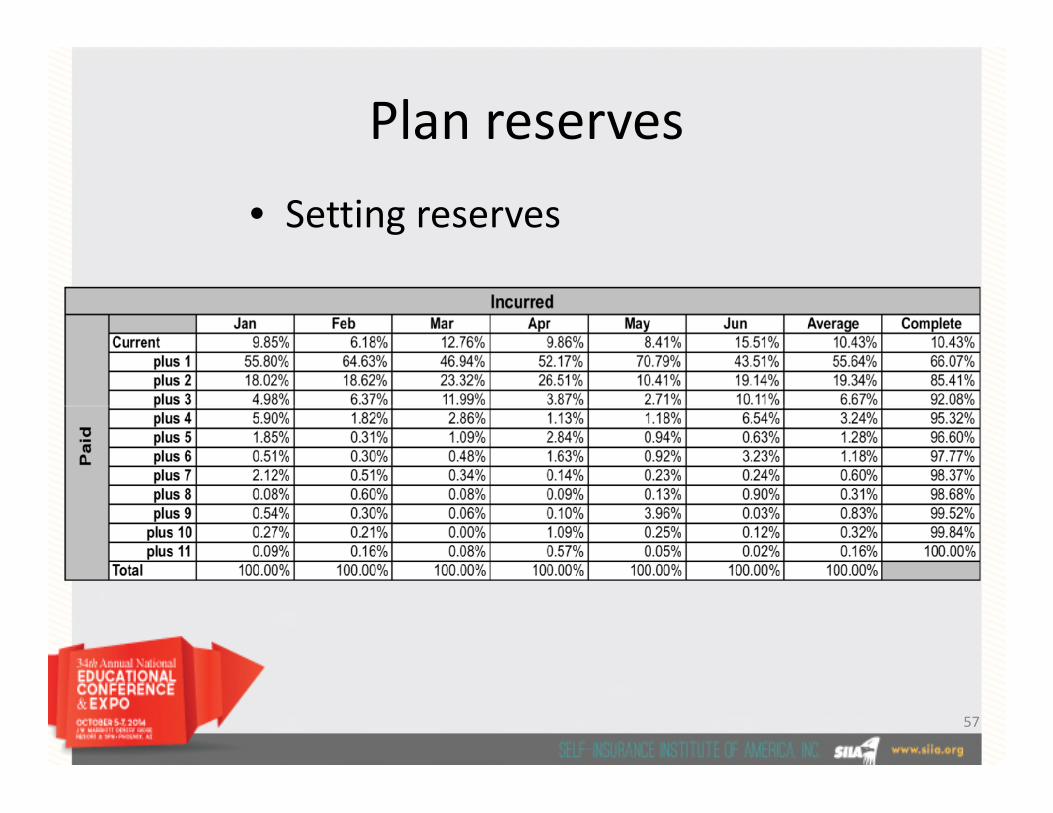
Plan reserves
• Setting reserves
57

Reports• Data ≠ information
– Decision making assistance• What are the issues• How are they developing• What are the causes• How can we intervene• What’s the anticipated impact of the intervention• What’s the anticipated impact of the intervention
• Correlation ≠ causality– Correlation
• Shows the level of probability that• Two or more events accompany one another
– Causality• Shows that one event is caused by the other
58

Reports• Decision making assistance
– Comparisons to• Normative data• Prior periods
– Standard information requests• Charges / payments / discounts / exclusions• Payments per enrollee and member• Large cases• Distribution of payments• Admissions / days / ALOS• Admissions / days / ALOS
– Resources to research• Specific diagnoses• Treatments• Costs• Options
– Information on healthy lifestyle and impact on• Quality of life• Plan costs
59

Reports• National claims trend
9.7%10.3%
14.7%
13.0%
10.6% 9.0%
8.0% 8.0% 8.0% 8.0%
7.0%8.0%
10.0%
12.0%
14.0%
16.0%
7.5%
8.5%8.0%
6.0% 6.0%
7.0%
6.0%5.4% 5.2%
4.1% 4.4%
6.8% 6.9% 7.0%
-2.0%
0.0%
2.0%
4.0%
6.0%
8.0%
1999 2000 2001 2002 2003 2004 2005 2006 2007 2008 2009 2010 2011 2012 2013 2014
Helath care trend after plan and contribution changes Health care trend before plan and contribution changes CPI-U
60

Reports >=105% of norm
<105% of norm, >=95% of norm
<95% of norm
Metrics
Actual
NormAdjusted
Norm
Comparison withAdjusted Norm
Jul 2012 thruJun 2014
Jul 2012 thru Jun2014
ER Visit UtilizationER Visits* / 1000 192.4 260.7 220.5 87.3%ER Claimants (M/1000) 239.7 170.5 150.2 159.6%ER Visits per ER Claimant 1.4 1.5 1.5 95.9%
ER Visits resulting in an Admission 33.8 37.3 32.6 103.7%ER Visits resulting in an Admission 33.8 37.3 32.6 103.7%Inpatient Utilization
Inpatient Days / 1000 272.0 336.8 330.0 82.4%Inpatient Claimants (M/1000) 122.0 73.7 74.3 164.3%Average Length of Stay 4.3 4.8 4.5 95.5%Total Admissions* / 1000 62.7 70.4 71.5 87.7%Re-admissions / 1000 4.368Total Inpat Re-admission Rate 0.120 0.120 0.113 105.4%
Imaging UtilizationCT Scan / 1000 57.4 65.8 61.4 93.5%MRI Scan / 1000 66.4 68.5 68.1 97.5%
61

Reports >=105% of norm
<105% of norm, >=95% of norm
<95% of norm
MetricActual
Norm⁺Adjusted
Norm
Comparisonto Adjusted
NormFull Cycle Full Cycle
PEPM SummaryMedical Plan Paid PEPM $ 560.95 $ 532.05 $ 588.90 95.3%Pharmacy Plan Paid PEPM $ 95.60 $ 113.48 $ 116.79 81.9%
PMPM SummaryMedical Plan Paid PMPM $ 281.70 $ 263.40 $ 263.68 106.8%Pharmacy Plan Paid PMPM $ 48.01 $ 56.18 $ 55.71 86.2%
Cycle Period: Paid Claims Jul 2012 thru Jun 2014; Normative Data: Age-Gender-Geography
Pharmacy Plan Paid PMPM $ 48.01 $ 56.18 $ 55.71 86.2%Place of Service Summary (PEPM)
Inpatient Hospital Plan Paid $ 177.51 $ 178.27 $ 219.31 80.9%Outpatient Hospital Plan Paid $ 168.42 $ 162.97 $ 168.33 100.1%Office Plan Paid $ 114.35 $ 112.09 $ 120.22 95.1%Emergency Room Plan Paid $ 34.12 $ 30.89 $ 30.58 111.6%
Place of Service Summary (PMPM)Inpatient Hospital Plan Paid $ 89.14 $ 88.25 $ 91.79 97.1%Outpatient Hospital Plan Paid $ 84.58 $ 80.68 $ 79.36 106.6%Office Plan Paid $ 57.42 $ 55.49 $ 54.88 104.6%Emergency Room Plan Paid $ 17.14 $ 15.29 $ 14.28 120.0%
62

ReportsRISK INDEX
Low <= 8Medium 9-20
High >=20
CARE GAP INDEXLow <= 2
Medium 3-4High >=5 >=105% of norm
<105% of norm, >=95% of norm
<95% of norm
Metric
Actual
Norm⁺Adjusted
Norm
Comparisonto Adjusted
Norm
Full Cycle Full Cycle
Demographics
Average Age 35.92 35.7 38.8 92.6%
% Male 49.5 48.3 46.1 107.5%
Cycle Period: Paid Claims Jul 2012 thru Jun 2014; Normative Data: Age-Gender-Geography
% Male 49.5 48.3 46.1 107.5%
Quality and Risk
Average Risk Index 4.23 5.76 5.71 74.1%
Average Care Gap Index 0.99 1.14 1.15 86.5%
Utilization Metrics
Inpatient Days Per 1000 272.0 336.8 330.0 82.4%
Total Admissions Per 1000 62.7 70.4 71.5 87.7%
ER Visits Per 1000 192.4 260.7 220.5 87.3%
Total Office Visits Per 1000 3,903.8 4,220.2 3,995.4 97.7%
Urgent Care Visits Per 1000 101.9- - -
% Generic Drugs 86.3 79.9 79.8 108.1%
63
Reports >=105% of norm
<105% of norm, >=95% of norm
<95% of norm
Metrics
Actual
NormAdjusted
Norm
Comparison withAdjusted Norm
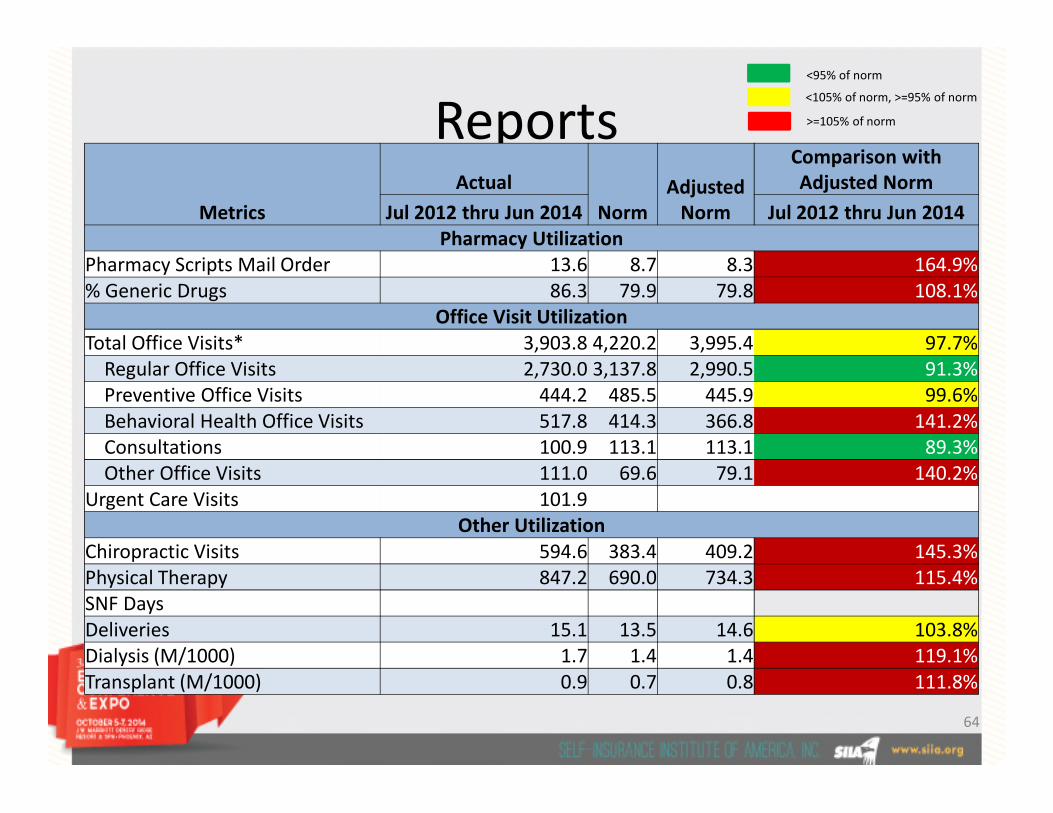
Jul 2012 thru Jun 2014 Jul 2012 thru Jun 2014Pharmacy Utilization
Pharmacy Scripts Mail Order 13.6 8.7 8.3 164.9%% Generic Drugs 86.3 79.9 79.8 108.1%
Office Visit UtilizationTotal Office Visits* 3,903.8 4,220.2 3,995.4 97.7%
Regular Office Visits 2,730.0 3,137.8 2,990.5 91.3%Preventive Office Visits 444.2 485.5 445.9 99.6%Preventive Office Visits 444.2 485.5 445.9 99.6%Behavioral Health Office Visits 517.8 414.3 366.8 141.2%Consultations 100.9 113.1 113.1 89.3%Other Office Visits 111.0 69.6 79.1 140.2%
Urgent Care Visits 101.9Other Utilization
Chiropractic Visits 594.6 383.4 409.2 145.3%Physical Therapy 847.2 690.0 734.3 115.4%SNF DaysDeliveries 15.1 13.5 14.6 103.8%Dialysis (M/1000) 1.7 1.4 1.4 119.1%Transplant (M/1000) 0.9 0.7 0.8 111.8%
64

ReportsActual % Change
Row Type label June 11 - May12
June 12 - May13
June 13 - May14
June 13 -May 14
Total Charges $21,710,229 $70,142,269 $64,532,800 -8.0%
Claims Payment Reductions $14,317,598 $43,802,138 $39,833,865 -9.1%
Plan Benefit Design $1,379,606 $3,622,365 $3,184,294 -12.1%
Other $7,427,655 $21,349,190 $18,833,869 -11.8%
PPO Discounts $5,510,338 $18,830,583 $17,815,702 -5.4%
Total Claims Paid $7,392,630 $26,340,131 $24,698,936 -6.2%
Payments as % of Charges 34% 38% 38% 0.7%
Reinsurance Reimbursements $132,450 $509,617 $1,068,541 109.7%
Claims Cost - Total $7,260,180 $25,830,513 $23,630,395 -8.5%
Enrollee $4,131,025 $14,608,423 $12,199,162 -16.5%
Spouse $2,311,779 $7,999,005 $7,841,673 -2.0%
Dependent $817,375 $3,223,085 $3,589,559 11.4%
Census Count - Member 1756 4147 4119 -0.7%
Comments: Total Plan Cost/Enrollee is down 7.7%
from prior year Claims cost net reinsurance
reimbursements is down 8.5% in themost recent 12 months.
Reinsurance Reimbursements are up109.7% over the prior 12 monthperiod.
Average claims cost per member isCensus Count - Member 1756 4147 4119 -0.7%
Enrollee 775 1823 1811 -0.7%
Spouse 392 927 907 -2.2%
Dependent 588 1397 1402 0.3%
Average Claims Cost - Member $144 $519 $478 -7.9%
Enrollee $185 $668 $562 -15.9%
Spouse $205 $719 $721 0.2%
Dependent $48 $192 $214 11.1%
Other Expenses $195,520 $459,858 $460,495 0.1%
Fixed Network Access Fees $51,161 $120,291 $119,306 -0.8%
Administration Fees $144,359 $339,568 $341,189 0.5%
Total Plan Cost $7,455,701 $26,290,372 $24,090,889 -8.4%
Total Plan Cost/Enrollee $335 $1,202 $1,109 -7.7%
Large Claims Total (>$25000) $1,092,012 $4,255,493 $4,288,664 0.8%
Number of Members 20 92 86 -6.5%
Average Total/Member $14,584 $46,601 $48,190 3.4%
No of Claims 41635 141573 130057 -8.1%
Average Claims Cost $74 $188 $189 0.3%
Number of Admissions 95 281 250 -11.0%
Number of In-Patient Days 343 1041 900 -13.5%
Average Length of Stay 3.61 3.70 3.60 -2.8%
Average claims cost per member is7.9% below the prior year
The average claims cost per dependentis up 11.1% over prior year.
65
Reports• Sources of normative and plan information
– Third party administrator
– Preferred provider organization
– Pharmacy benefit manager
– Advisor– Advisor
– Research institutions
• Kaiser family foundation
• Employee benefits research institute
• U.S. government departments
66
Reports
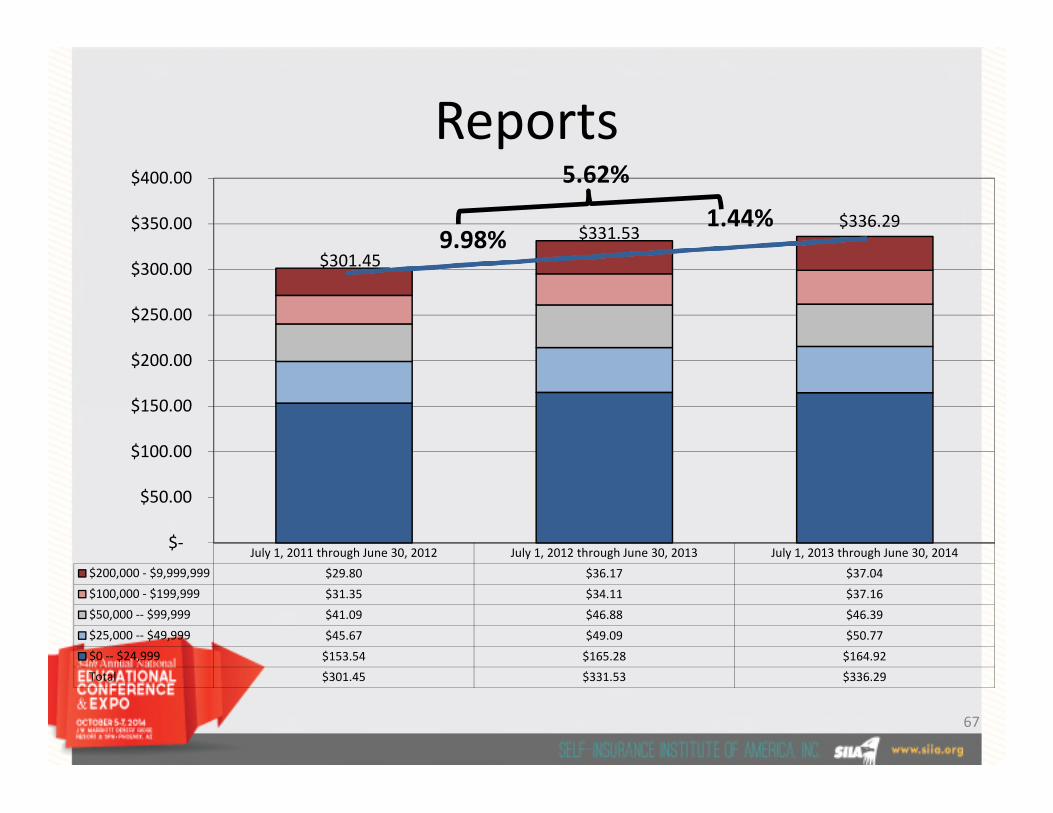
$301.45
$331.53$336.29
$150.00
$200.00
$250.00
$300.00
$350.00
$400.00
1.44%9.98%
5.62%
July 1, 2011 through June 30, 2012 July 1, 2012 through June 30, 2013 July 1, 2013 through June 30, 2014
$200,000 - $9,999,999 $29.80 $36.17 $37.04
$100,000 - $199,999 $31.35 $34.11 $37.16
$50,000 -- $99,999 $41.09 $46.88 $46.39
$25,000 -- $49,999 $45.67 $49.09 $50.77
$0 -- $24,999 $153.54 $165.28 $164.92
Total $301.45 $331.53 $336.29
$-
$50.00
$100.00
$150.00
67

Reports
SECONDARY9%
OUT OFNETWORK
4%
Distribution of Claims - Prior Period
SECONDARY6%
OUT OFNETWORK
4%
Distribution of Claims - Current Period
PRIMARY87%
PRIMARY90%
68

Reports• Claimant stratification at $100,000
7/11 - 6/12 7/12 - 6/13 7/13 - 6/14 2 Year CAGR
Enrollee Months 788,544 903,250 1,067,865 16.37%Member Months 1,604,707 1,800,022 1,974,571 10.93%Dollars $ 483,744,888 $ 596,767,994 $ 664,023,086 17.16%
< $100,000 $ 385,604,650 $ 470,264,473 $ 517,504,908 15.85%> = $100,000 $ 98,140,237 $ 126,503,522 $ 146,518,178 22.19%
PEPM $ 613.47 $ 660.69 $ 621.82 0.68%< $100,000 $ 489.01 $ 520.64 $ 484.62 -0.45%< $100,000 $ 489.01 $ 520.64 $ 484.62 -0.45%> = $100,000 $ 124.46 $ 140.05 $ 137.21 5.00%
PMPM $ 301.45 $ 331.53 $ 336.29 5.62%< $100,000 $ 240.30 $ 261.25 $ 262.08 4.44%> = $100,000 $ 61.16 $ 70.28 $ 74.20 10.15%
Claimants 135,786 159,831 159,381 8.34%< $100,000 135,271 159,189 158,644 8.30%> = $100,000 515 642 737 19.63%
Claims per 1000 Enrollees 2,261.4 2,285.4 2,000.7 -5.94%<$100,000 2,252.8 2,276.2 1,991.5 -5.98%>= $100,000 6.7 9.2 9.3 17.35%
Average Paid in Excess of $100,000 $ 90,564 $ 97,046 $ 98,803 4.45%
69
50%
15%
14%
10%
11%
49%
15%
14%
11%
11%
51%
15%
14%
10%
10%
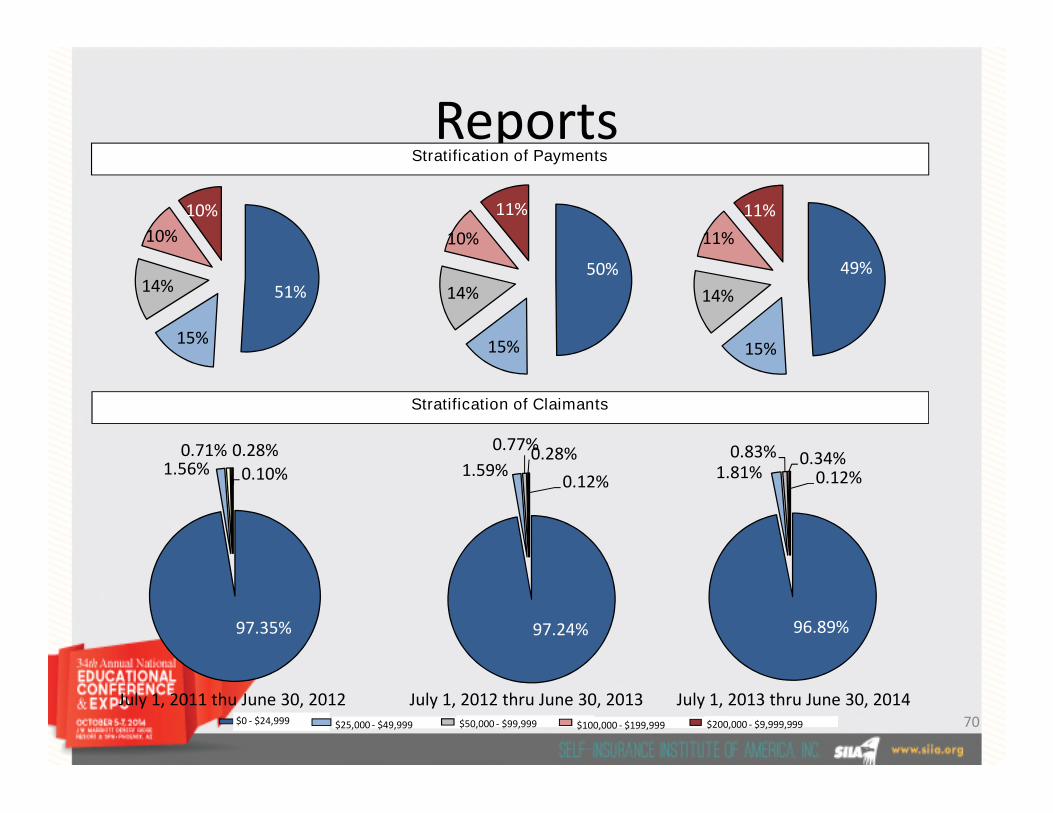
ReportsStratification of Payments
Stratification of Claimants
97.24%
1.59%
0.77%0.28%
0.12%
$0 - $24,999 $25,000 - $49,999 $50,000 - $99,999 $100,000 - $199,999 $200,000 - $9,999,999
Stratification of Claimants
97.35%
1.56%0.71% 0.28%
0.10%
96.89%
1.81%0.83% 0.34%
0.12%
July 1, 2011 thu June 30, 2012 July 1, 2012 thru June 30, 2013 July 1, 2013 thru June 30, 201470

Reports
Claimant7/1/2011-6/30/2012 7/1/2012-6/30/2013 7/1/2013-6/30/2014
Paid Count Paid Count Paid Count
Dependent 16.6% 15.3% 19.0% 14.5% 20.9% 14.8%
52.7% 56.8% 50.0% 54.2% 48.2% 53.5%Employee 52.7% 56.8% 50.0% 54.2% 48.2% 53.5%
Spouse 30.6% 27.7% 30.8% 30.9% 30.7% 31.3%
Other 0.1% 0.2% 0.2% 0.3% 0.3% 0.4%
Grand Total 100.0% 100.0% 100.0% 100.0% 100.0% 100.0%
71

ReportsMajor Diagnostic CategoryLarge Claimants >$100,000
7/1/2011-6/30/2012
7/1/2012-6/30/2013
7/1/2013-6/30/2014
Paid Count Paid Count Paid Count
Neoplasms 31.2% 31.4% 31.0% 29.2% 28.5% 30.0%
Circulatory System 15.0% 16.3% 16.0% 18.8% 13.6% 15.7%
Injury & Poisoning 7.1% 7.6% 8.0% 7.7% 8.9% 8.6%
Musculoskeletal 7.6% 9.9% 8.6% 10.6% 7.2% 9.2%
Digestive 5.1% 4.3% 5.0% 5.3% 6.2% 6.1%
Infectious and Parasitic Diseases 2.6% 2.3% 2.9% 2.3% 6.2% 3.8%
Genitourinary 10.7% 7.0% 5.5% 5.0% 4.5% 3.8%
Prescription Drugs 1.2% 1.7% 1.6% 1.9% 3.8% 3.8%Prescription Drugs 1.2% 1.7% 1.6% 1.9% 3.8% 3.8%
Congenital Anomalies 5.2% 3.9% 2.0% 1.9% 3.8% 2.1%
Nervous System and Sense Organs 1.4% 1.9% 2.4% 2.3% 3.7% 3.9%
Conditions Originating in the Perinatal Period 3.2% 3.9% 5.9% 3.9% 3.5% 3.4%
Endocrine, Nutritional and Metabolic 4.3% 3.7% 3.0% 2.8% 3.3% 3.0%
Respiratory 1.9% 1.7% 3.5% 2.8% 2.2% 2.4%
Supplementary Factors Influencing Health 0.1% 0.2% 0.5% 0.6% 1.3% 0.7%
Blood and Blood Forming Organs 0.4% 0.4% 1.1% 0.9% 1.1% 1.0%
Mental Disorders 1.4% 1.9% 1.3% 1.7% 0.9% 1.1%
Complications of Pregnancy, Childbirth , etc. 0.2% 0.2% 0.5% 0.8% 0.8% 0.7%
Symptoms, Signs and Ill-Defined Conditions 1.1% 1.0% 0.7% 0.9% 0.3% 0.4%
Skin and Subcutaneous Tissue 0.5% 0.8% 0.3% 0.5% 0.2% 0.3%
Total 100.0% 100.0% 100.0% 100.0% 100.0% 100.0%
72

Compliance Update• 2010
– Restrictions on annual limits on EHBs.– Appeals process and external review– Dependent coverage for children <26– Early retiree reinsurance program
(ERRP)– No lifetime limits on essential health
benefits– Nondiscrimination– Patient protections (primary care
provider designations, ER services,etc.)
– Pre-X prohibition for those <19
• 2011– HSA/Archer MSA penalty tax increase– Medical loss ratio (MLR) requirements– OTC drug restrictions– Rate increases (review and disclosure
rules)– Simple cafeteria plans– Wellness programs (small business
grants)
• 2012:– CO-OPs– Patient-Centered Outcomes Research
(PCOR) Fees
• 2014:– Life/Annual limits prohibited on
essential health benefits (previouslyrestricted 2010)
– Automatic enrollment (regs to come)– Clinical trial coverage– Essential health benefits package)– Cost-sharing limitations– Excessive waiting periods prohibited– Exchanges– Guaranteed availability of coverage– Guaranteed renewability of coverage– Nondiscrimination against health care– Pre-X prohibition for those <19
– Preventive health services– Quality of care reporting– Rescission prohibition– Small business health care tax credit– Tax-free coverage to children <27– Temporary high risk pool: PCIP
program– Transparency in Coverage Reporting
and Cost-Sharing Disclosure– Wellness programs (technical
assistance)
(PCOR) Fees– Summary of benefits and coverage
(SBC)– W-2 reporting (cost of employer-
sponsored health coverage)
• 2013:– Code § 213 medical deduction
threshold increase– Exchange notice to current employees– Health FSA $2,500 cap– HIPAA electronic transactions and
operating rules Staggered fromJanuary 2013 to January 2016
– Nondiscrimination against health careproviders
– Nondiscrimination based on healthstatus
– Pre-X prohibition (for all, not justunder age 19)
– Reinsurance payments– Individual mandate
• 2015:– Shared responsibility for employers
(play or pay penalty tax)– Reporting of health insurance
coverage
73

Cost management
Gartner Hype Curve
Technology Adoption Curve 100%
75%
Peak ofInflated
Expectations
Plateau of ProductivityTh
eC
has
m
50%
25%
2.5%Innovators
13.5%Early
Adopters
34%Early Majority
34%Late Majority
16%Laggards
TechnologyTrigger
Trough ofDisillusionment
The
Ch
asm
74

Cost management• Transparency
75

Cost management• Transparency
76
Cost management
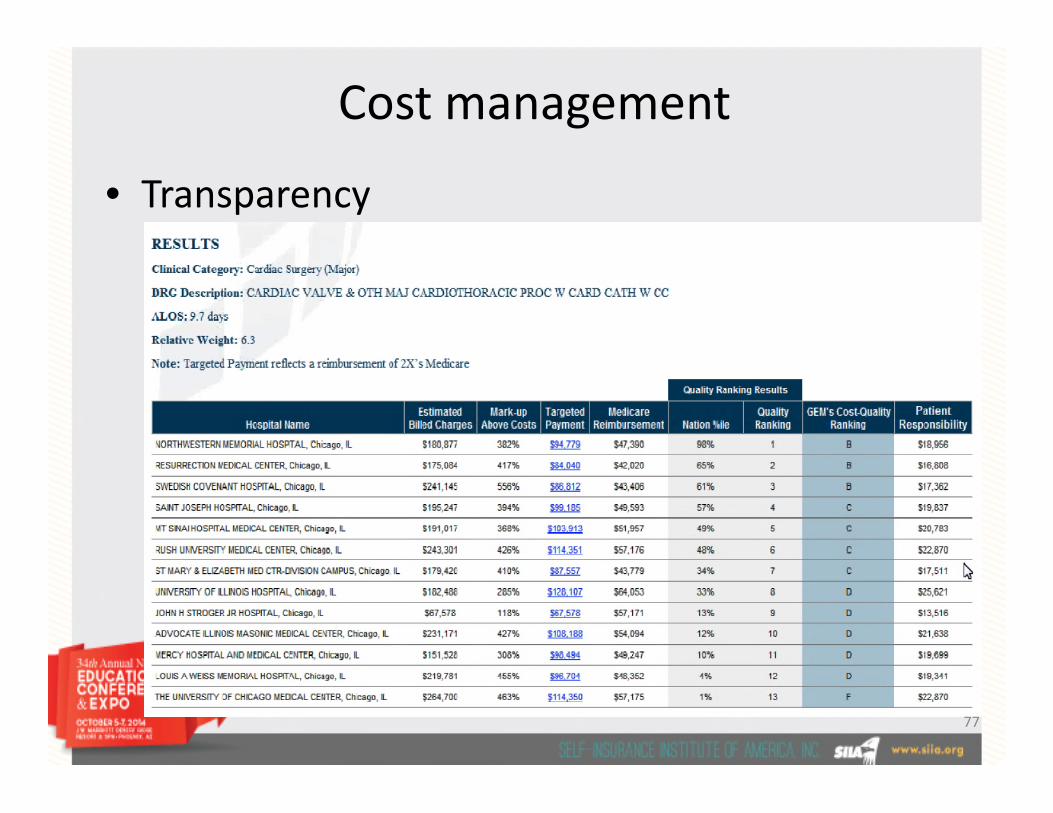
• Transparency
77

Cost management• In-country medical tourism
– Other examples
78

Cost management• Provider reimbursement methodologies
– Spectrum of risks
• Limited providerfinancial risk;
• Risk of patientover-treatment
• High providerfinancial risk;
• Risk of patientunder-treatment
Fee for Service Per DiemEpisode of Care
(EPC)Multi-provider
EPCPopulation
Shared Savings
ConditionSpecific
capitationFull Capitation
over-treatment under-treatment
79

Cost management• Provider reimbursement methodologies
$20,000
$40,000
$60,000
$80,000Total Hip Replacements - All Facilities
$0
0 10 20 30 40 50 60
$0
$20,000
$40,000
$60,000
$80,000
0 20 40 60 80 100 120 140
Total Knee Replacements - All Facilities
80

Cost management• Provider reimbursement methodologies
– Bundled payments
• Benefits of a Bundled Payment Pricing Strategy:– Increased cost transparency
– Improved care quality and service efficiency
– Enhanced cost predictability– Enhanced cost predictability
– Expansion to other service lines
• Payer facilitates payment– For date of admission through the date of discharge
– For lengths of stay of four (4) days or less, excluding admissionthrough the emergency department
the Maximum Facility Knee Allowable rate, the Total Bundled Payment Allowable rate and the MaximumFacility Hip Allowable rate set forth above, will increase annually at the same rate as the increase in the
Consumer Price Index Urban (CPI-U) released by the United States Department of Labor Bureau of LaborStatistics for March of the effective year. This annual increase shall not exceed 3%.
81

Cost management• Provider reimbursement methodologies
– Reference-based pricing• Purpose
– Evaluate charges and payments by facility against an accepted reference(Medicare)
• Methodology– Extracted facility-based claim sample proportionately
According to bill type» According to bill type
• Inpatient
• Outpatient
» According to provider payments represented in the book of business
» According to service mix based on primary diagnosis
– Sent claims to an independent third-party repricer
» To group claims by DRG and APC
» To reprice claims based on published Medicare methods andconversion factors specific to each facility
82

Cost management• Provider reimbursement methodologies
– Reference-based pricing
• Facility variation
270%
290%
310%
330%
150%
170%
190%
210%
230%
250%
270%
Facility Specific Utilization Normalized Utilization
83


