FRUITS AND VEGETABLESMARKET OF RUSSIA

2
ContentP 3GENERAL OVERVIEW
p 5Apples
p 5Fruit Import Analysis by Main Crop
p 8Grapes
p 7Bananas
Potatoes p 9
Citrus p 10
Oranges p 11
Lemon p 12
Mandarins p 13
Grapefruits p 14
CONCLUSION p 15

3
I - General Overview Over the last few years, the Russian economy grew at an average rate of 1.3%1 and with a GDP hovering at around US$ 2.5 trillion in 2013 distributed across the Services sectors (58.3%), Industry (37.5%) and Agriculture (4.2%).The Agriculture, Industry, and Services sectors employ around 9.7%, 27.8%, and 62.5% of the labor force respectively. Russia is one of the world's leading importers of food, partly because of its arid climate and inconsistent rainfall, suboptimal investments in the sector which led to some inef�ciencies in food production and running down of livestock numbers.2
STATISTICS
In Russia, 10.6% of the average food basket goes to fresh fruits and vegetables. The average household’s weekly spending for food products ranges from 3,632 rubles ($114.29) in Moscow to 2,809 ($89.27) rubles in a city less than 500,000 citizens, according to the RBK Department of Consulting research.3
Russia is highly dependent on imported fruits which make up almost 50% of Russian fruit sales. Most imported fruits are available during the �rst six months of the year and consumption peaks from October to May. Imports are lowest in the summer (July-September) when the market is full of cheap local fruits from Russia, Moldova, Ukraine and the Central Asia republics, as well as the Middle East.
In 2013, Russia bought around €1 076 million worth of fresh and processed fruit and €769 million worth of fresh and processed vegetables. The fast growing sales to Russia include tomatoes (from €6 million in 1999 to €116.5 million in 2011), potatoes (from €7 million in 1999 to €198.5 million in 2011), apples (from €53 million to €284 million), and pears (from €19 million to €169 million), among others.4
The largest Russian Fruits Suppliers are: Ecuador (bananas), Poland (apples), Turkey (citrus, grapes, and stone fruits), China (apples, citrus, stone fruits), Argentina (apples, pears, and citrus), and Chile (grapes). In general, imported fruit is expensive in Russian retail outlets. Importers typically mark up by around 5%, while the supermarket mark-up varies from 10-30% and specialized fruit stalls mark-up much as 100% depending on the fruit variety.In terms of vegetables, tomatoes are the largest imported items, followed by Potatoes and then Onions and Garlic.5
1 The Economist Group, Economist Intelligent Unit.2 Russia, June 2014, Global Finance Magazine. 3 Doornhof & Oving “Developments in the Fruits & Vegetables sector in Russian Federation”, Business Boost International.4 “Monitoring Agri-Trade Policy: The EU and major world players in Fruit and Vegetables Trade”, July 2012, European Commission.5 Federal State Statistics Service, Russian Federation.
Fruit Import % | 2013
Other
Grapefruit
Grapes
Lemons
Pears
Oranges
Soft Citrus
Bananas
Apples
Source: Fruit and VegetableFacts, Horti Daily
4
6 Federal Service for Veterinary and Phytosanitary Surveiilance7 “End Market Study for Fresh and Dried Fruits in Russia”, USAID, September 2011
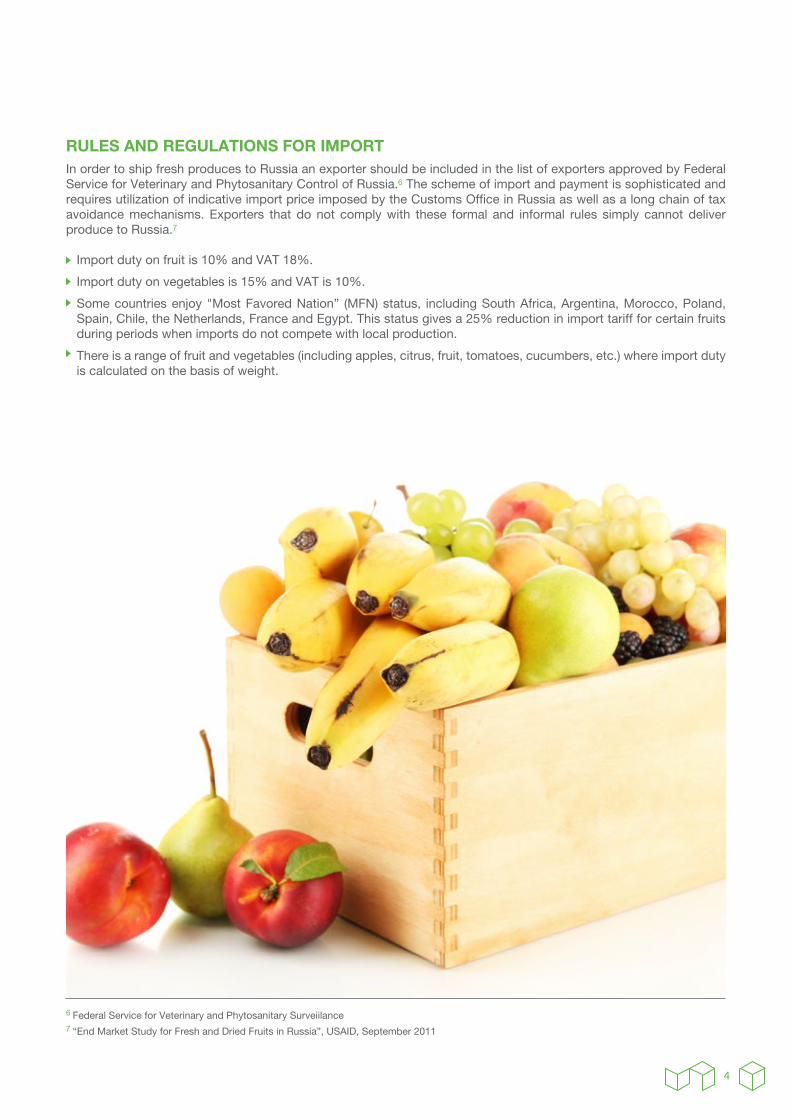
RULES AND REGULATIONS FOR IMPORTIn order to ship fresh produces to Russia an exporter should be included in the list of exporters approved by Federal Service for Veterinary and Phytosanitary Control of Russia.6 The scheme of import and payment is sophisticated and requires utilization of indicative import price imposed by the Customs Of�ce in Russia as well as a long chain of tax avoidance mechanisms. Exporters that do not comply with these formal and informal rules simply cannot deliver produce to Russia.7
Import duty on fruit is 10% and VAT 18%. Import duty on vegetables is 15% and VAT is 10%.
Some countries enjoy "Most Favored Nation” (MFN) status, including South Africa, Argentina, Morocco, Poland, Spain, Chile, the Netherlands, France and Egypt. This status gives a 25% reduction in import tariff for certain fruits during periods when imports do not compete with local production. There is a range of fruit and vegetables (including apples, citrus, fruit, tomatoes, cucumbers, etc.) where import duty is calculated on the basis of weight.
65
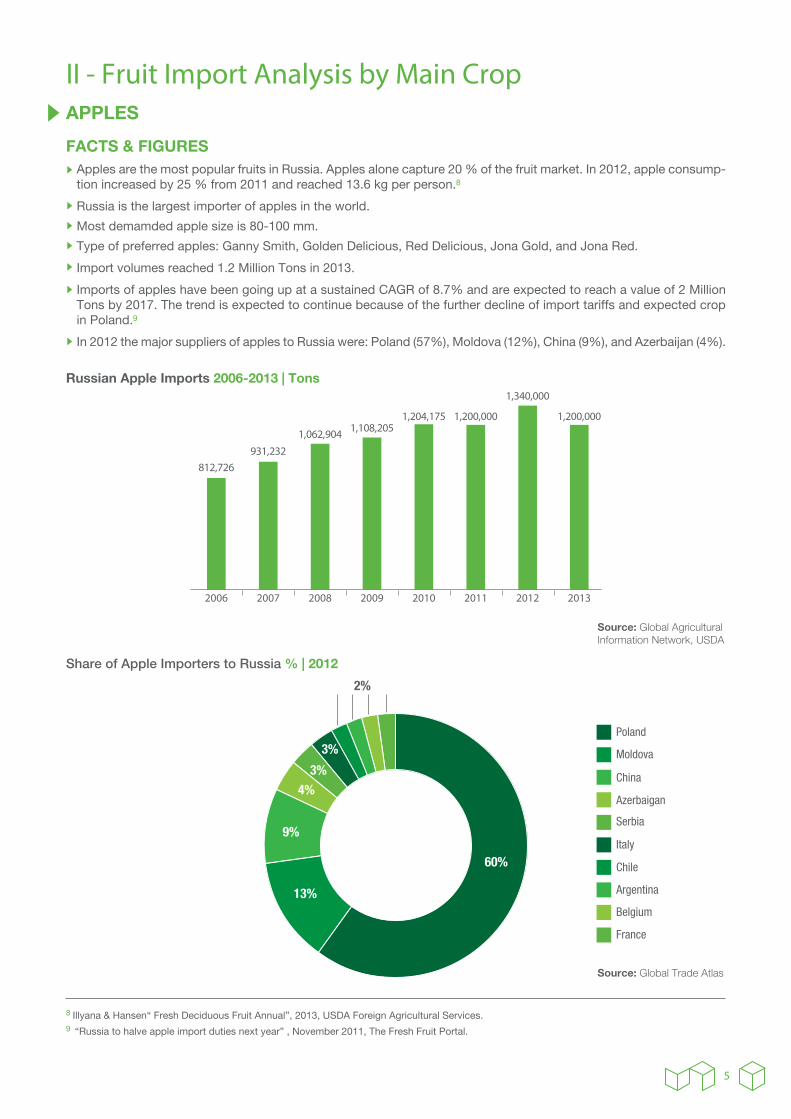
II - Fruit Import Analysis by Main CropAPPLES
FACTS & FIGURESApples are the most popular fruits in Russia. Apples alone capture 20 % of the fruit market. In 2012, apple consump-tion increased by 25 % from 2011 and reached 13.6 kg per person.8
Russia is the largest importer of apples in the world.
Most demamded apple size is 80-100 mm. Type of preferred apples: Ganny Smith, Golden Delicious, Red Delicious, Jona Gold, and Jona Red. Import volumes reached 1.2 Million Tons in 2013. Imports of apples have been going up at a sustained CAGR of 8.7% and are expected to reach a value of 2 Million Tons by 2017. The trend is expected to continue because of the further decline of import tariffs and expected crop in Poland.9
In 2012 the major suppliers of apples to Russia were: Poland (57%), Moldova (12%), China (9%), and Azerbaijan (4%).
Russian Apple Imports 2006-2013 | Tons
Share of Apple Importers to Russia % | 2012
Source: Global Agricultural Information Network, USDA
Source: Global Trade Atlas
Moldova
Azerbaigan
Serbia
Italy
Argentina
Chile
France
Belgium
China
Poland
8 Illyana & Hansen“ Fresh Deciduous Fruit Annual”, 2013, USDA Foreign Agricultural Services. 9 “Russia to halve apple import duties next year” , November 2011, The Fresh Fruit Portal.
16%
4%4%
200820072006 2009 2010 2011 2012 2013
812,726931,232
1,062,904 1,108,2051,204,175 1,200,000 1,200,000
1,340,000

66
The duties on apples dropped to 0.048 euros per kilogram and are expected to decrease to 0.03 euros per kilogram by 2017.10 The best time period for apple harvesting is around the period of November-December but if properly stored through controlled atmosphere, apples can be sold through April/May.11 Sizing and grading is extremely important for the different sectors of the business.
As of June 2014, the price of 1kg of apples was at $1.8113.12
10 Northwest Horticural Council, Russia 11 “End Market Study for Fresh and Dried Fruits in Russia”, USAID, September 201112 “Food Prices in Russia”, June 2014, Numbeo
7
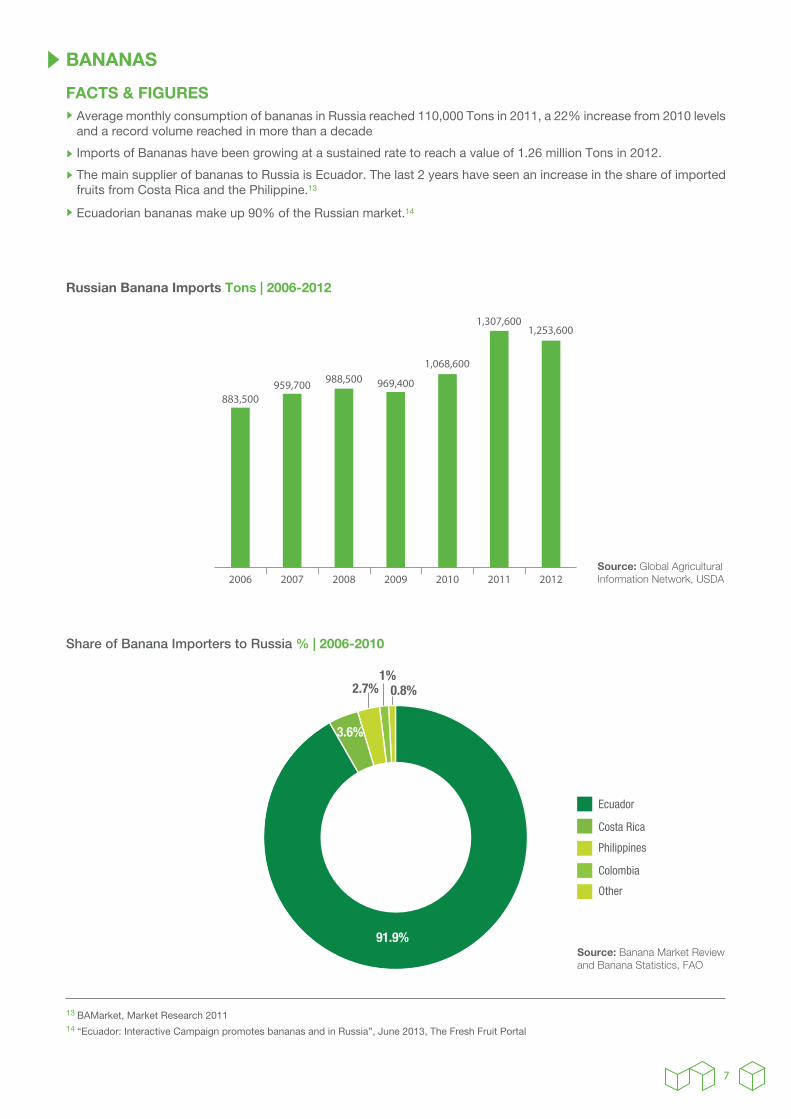
BANANAS
FACTS & FIGURESAverage monthly consumption of bananas in Russia reached 110,000 Tons in 2011, a 22% increase from 2010 levels and a record volume reached in more than a decade
Imports of Bananas have been growing at a sustained rate to reach a value of 1.26 million Tons in 2012.
The main supplier of bananas to Russia is Ecuador. The last 2 years have seen an increase in the share of imported fruits from Costa Rica and the Philippine.13
Ecuadorian bananas make up 90% of the Russian market.14
Russian Banana Imports Tons | 2006-2012
Source: Global Agricultural Information Network, USDA200820072006 2009 2010 2011 2012
Source: Banana Market Review and Banana Statistics, FAO
Colombia
Other
Philippines
Costa Rica
Ecuador
Share of Banana Importers to Russia % | 2006-2010
13 BAMarket, Market Research 2011 14 “Ecuador: Interactive Campaign promotes bananas and in Russia”, June 2013, The Fresh Fruit Portal
GRAPES
FACTS & FIGURESIn 2012 grape per capita consumption in Russia reached 3.5 kg, up from 3.1 kg in 2011. Grapes are available all year round in Russia.
Peak consumption months are August-November (66 % of annual sales).15
Russia‘s production of table grapes stood at 51,070 MT in 2012 and expected to reach 56,760 MT in 2013.16
Russia remains one of the top importers of grapes in the world.
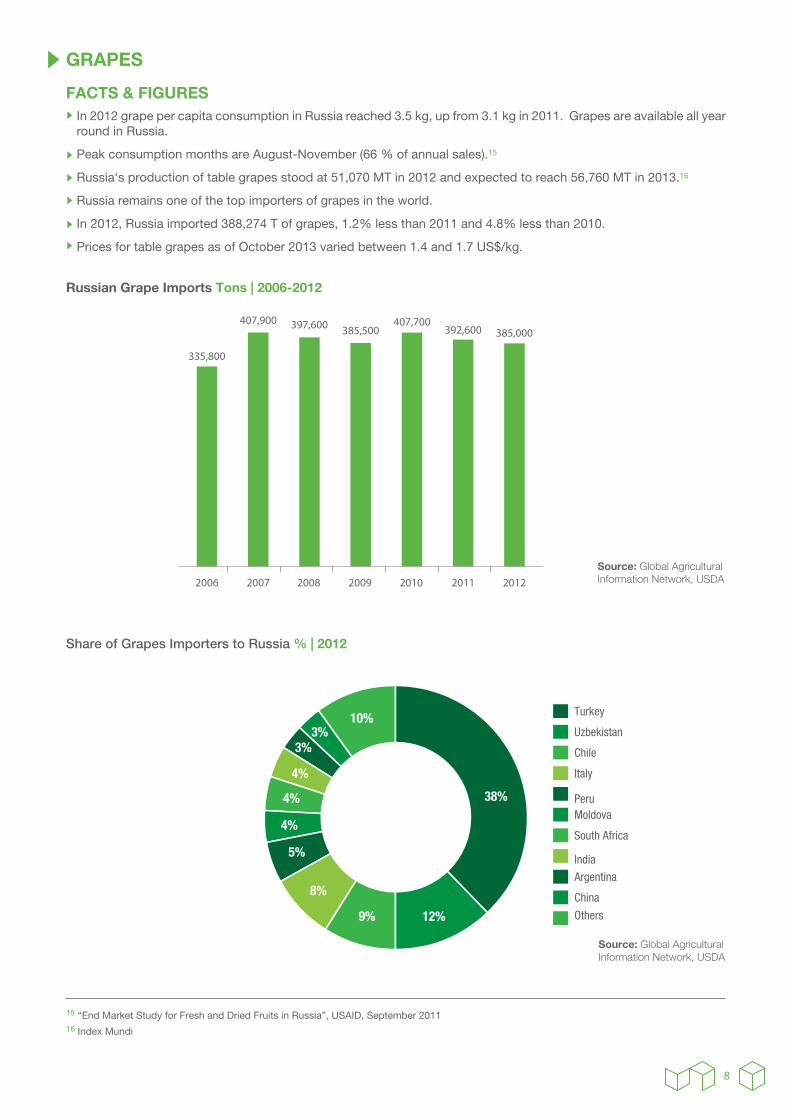
In 2012, Russia imported 388,274 T of grapes, 1.2% less than 2011 and 4.8% less than 2010.
Prices for table grapes as of October 2013 varied between 1.4 and 1.7 US$/kg.
Russian Grape Imports Tons | 2006-2012
Source: Global Agricultural Information Network, USDA2006 2007 2008 2009 2010 2011 2012
Source: Global Agricultural Information Network, USDA
Share of Grapes Importers to Russia % | 2012
Others
China
Argentina
India
South Africa
MoldovaPeru
Italy
Chile
Uzbekistan
Turkey
68
15 “End Market Study for Fresh and Dried Fruits in Russia”, USAID, September 201116 Index Mundi
POTATOES
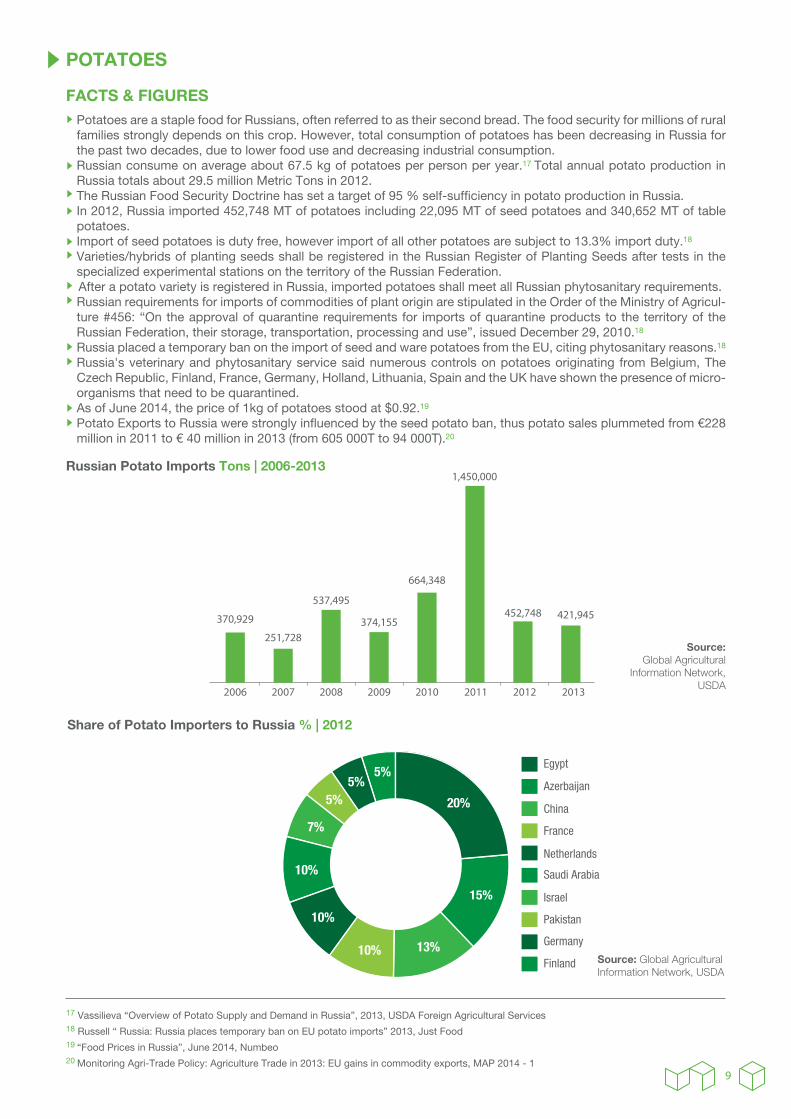
FACTS & FIGURESPotatoes are a staple food for Russians, often referred to as their second bread. The food security for millions of rural families strongly depends on this crop. However, total consumption of potatoes has been decreasing in Russia for the past two decades, due to lower food use and decreasing industrial consumption.Russian consume on average about 67.5 kg of potatoes per person per year.17 Total annual potato production in Russia totals about 29.5 million Metric Tons in 2012.The Russian Food Security Doctrine has set a target of 95 % self-suf�ciency in potato production in Russia.In 2012, Russia imported 452,748 MT of potatoes including 22,095 MT of seed potatoes and 340,652 MT of table potatoes. Import of seed potatoes is duty free, however import of all other potatoes are subject to 13.3% import duty.18
Varieties/hybrids of planting seeds shall be registered in the Russian Register of Planting Seeds after tests in the specialized experimental stations on the territory of the Russian Federation. After a potato variety is registered in Russia, imported potatoes shall meet all Russian phytosanitary requirements.Russian requirements for imports of commodities of plant origin are stipulated in the Order of the Ministry of Agricul-ture #456: “On the approval of quarantine requirements for imports of quarantine products to the territory of the Russian Federation, their storage, transportation, processing and use”, issued December 29, 2010.18
Russia placed a temporary ban on the import of seed and ware potatoes from the EU, citing phytosanitary reasons.18
Russia's veterinary and phytosanitary service said numerous controls on potatoes originating from Belgium, The Czech Republic, Finland, France, Germany, Holland, Lithuania, Spain and the UK have shown the presence of micro-organisms that need to be quarantined. As of June 2014, the price of 1kg of potatoes stood at $0.92.19
Potato Exports to Russia were strongly in�uenced by the seed potato ban, thus potato sales plummeted from €228 million in 2011 to € 40 million in 2013 (from 605 000T to 94 000T).20
9
Russian Potato Imports Tons | 2006-2013
2006 2007 2008 2009 2010 2011 2012 2013
Source: Global Agricultural Information Network, USDA
Finland
Germany
Pakistan
Israel
Saudi Arabia
Netherlands
France
China
Azerbaijan
Egypt
Share of Potato Importers to Russia % | 2012
17 Vassilieva “Overview of Potato Supply and Demand in Russia”, 2013, USDA Foreign Agricultural Services18 Russell “ Russia: Russia places temporary ban on EU potato imports” 2013, Just Food19 “Food Prices in Russia”, June 2014, Numbeo20 Monitoring Agri-Trade Policy: Agriculture Trade in 2013: EU gains in commodity exports, MAP 2014 - 1
Source:Global Agricultural
Information Network,USDA
2006
CITRUS
FACTS & FIGURESCitrus is the second most popular fruit after apple, especially in the winter period when mandarins and oranges are traditionally perceived as one of the symbols of New Year celebrations and other winter festivals.
Russia doesn’t grow citrus and therefore is entirely dependent on imports for consumption of oranges, grapefruits, mandarins, lemons, and limes.
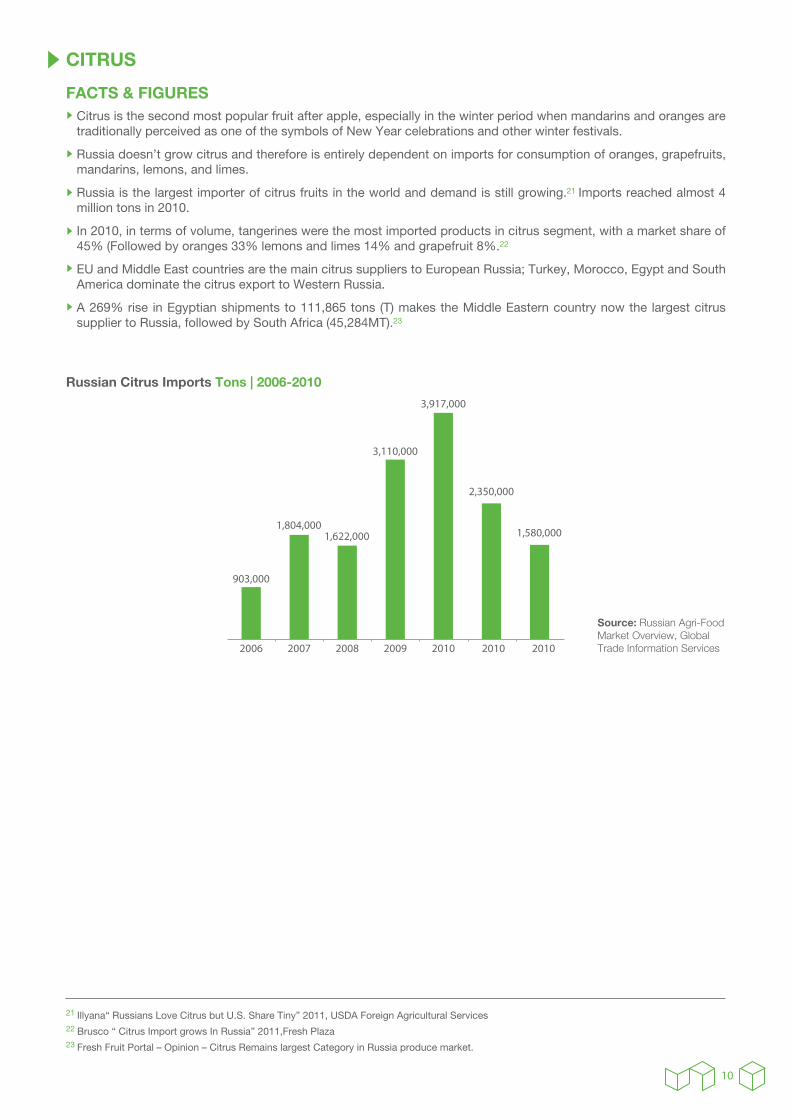
Russia is the largest importer of citrus fruits in the world and demand is still growing.21 Imports reached almost 4 million tons in 2010.
In 2010, in terms of volume, tangerines were the most imported products in citrus segment, with a market share of 45% (Followed by oranges 33% lemons and limes 14% and grapefruit 8%.22
EU and Middle East countries are the main citrus suppliers to European Russia; Turkey, Morocco, Egypt and South America dominate the citrus export to Western Russia.
A 269% rise in Egyptian shipments to 111,865 tons (T) makes the Middle Eastern country now the largest citrus supplier to Russia, followed by South Africa (45,284MT).23
10
Russian Citrus Imports Tons | 2006-2010
Source: Russian Agri-Food Market Overview, Global Trade Information Services2007 2008 2009 2010 2010 2010
21 Illyana“ Russians Love Citrus but U.S. Share Tiny” 2011, USDA Foreign Agricultural Services22 Brusco “ Citrus Import grows In Russia” 2011,Fresh Plaza23 Fresh Fruit Portal – Opinion – Citrus Remains largest Category in Russia produce market.
ORANGES
FACTS & FIGURESOranges are the second most popular citrus fruit in Russia with 6.5% around share of the fruit market.
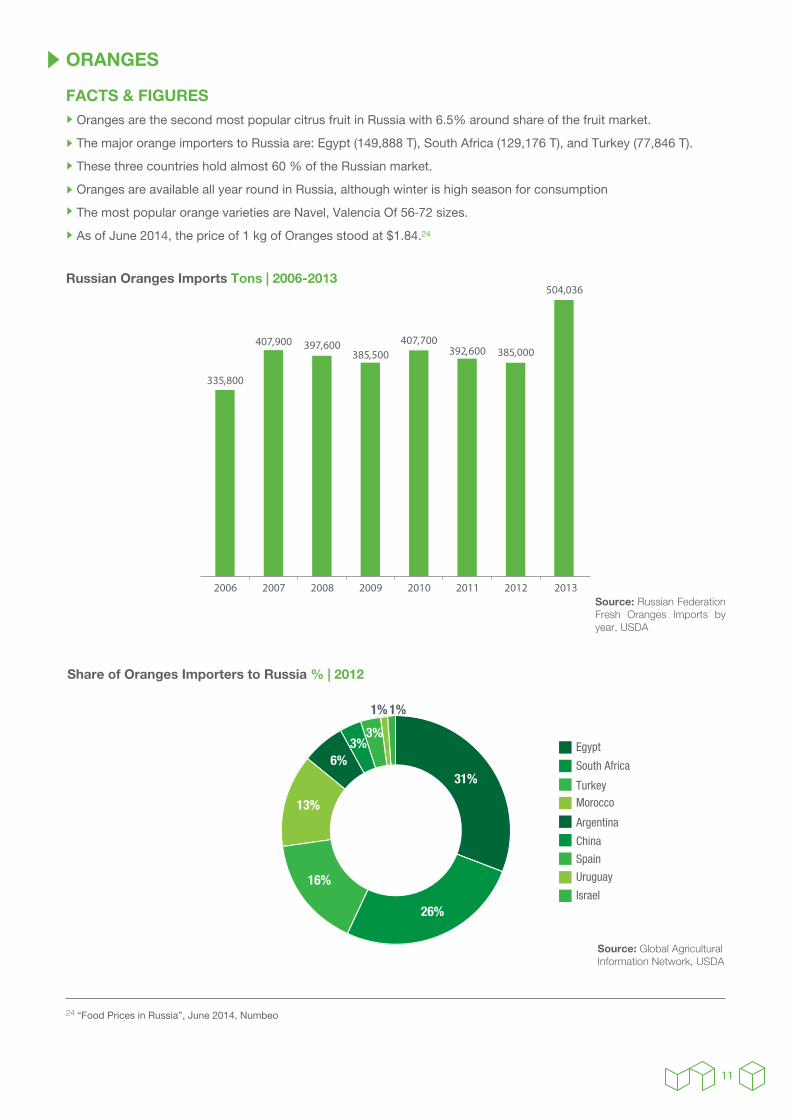
The major orange importers to Russia are: Egypt (149,888 T), South Africa (129,176 T), and Turkey (77,846 T).
These three countries hold almost 60 % of the Russian market.
Oranges are available all year round in Russia, although winter is high season for consumption
The most popular orange varieties are Navel, Valencia Of 56‐72 sizes.
As of June 2014, the price of 1 kg of Oranges stood at $1.84.24
Share of Oranges Importers to Russia % | 2012
Israel
Uruguay
Spain
China
Argentina
Morocco
Turkey
South Africa
Egypt
Source: Global Agricultural Information Network, USDA
Russian Oranges Imports Tons | 2006-2013
Source: Russian Federation Fresh Oranges Imports by year, USDA
335,800
407,900 397,600385,500
407,700392,600 385,000
504,036
2006 2007 2008 2009 2010 2011 2012 2013
11
24 “Food Prices in Russia”, June 2014, Numbeo
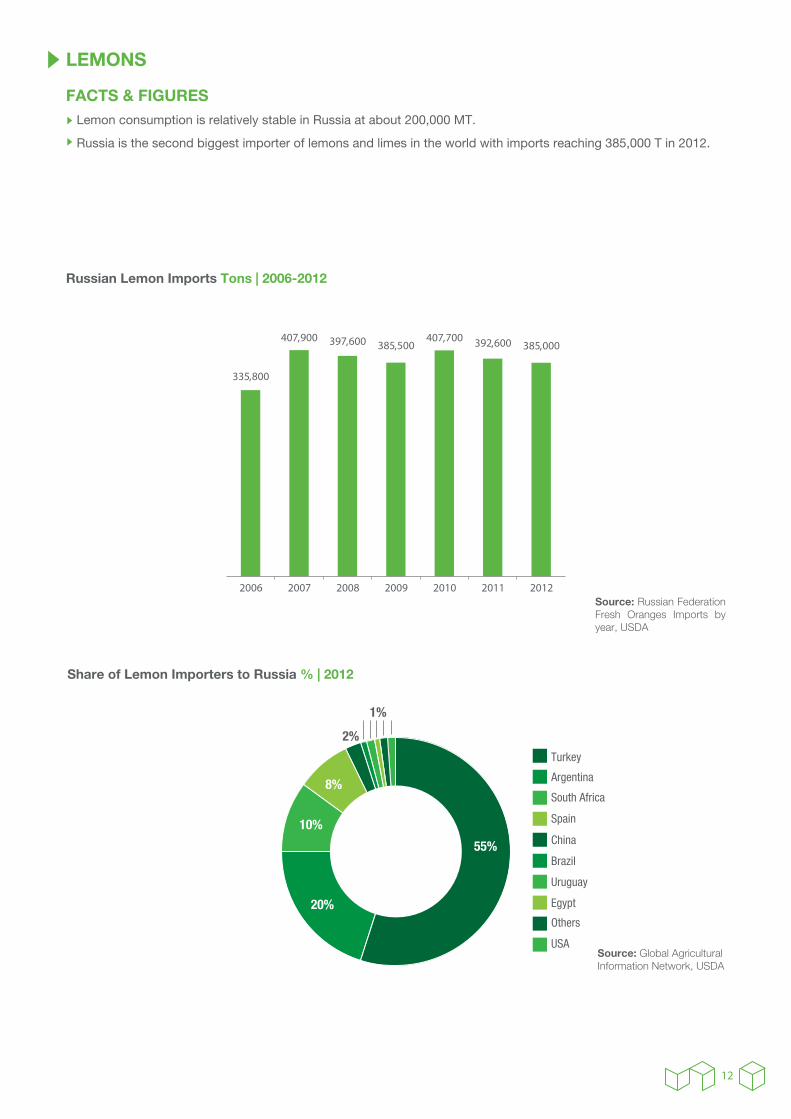
LEMONS
FACTS & FIGURESLemon consumption is relatively stable in Russia at about 200,000 MT.
Russia is the second biggest importer of lemons and limes in the world with imports reaching 385,000 T in 2012.
Source: Global Agricultural Information Network, USDA
Share of Lemon Importers to Russia % | 2012
USA
Others
Egypt
Uruguay
Brazil
China
Spain
South Africa
Argentina
Turkey
Russian Lemon Imports Tons | 2006-2012
Source: Russian Federation Fresh Oranges Imports by year, USDA
335,800
407,900 397,600 385,500407,700 392,600 385,000
2006 2007 2008 2009 2010 2011 2012
12
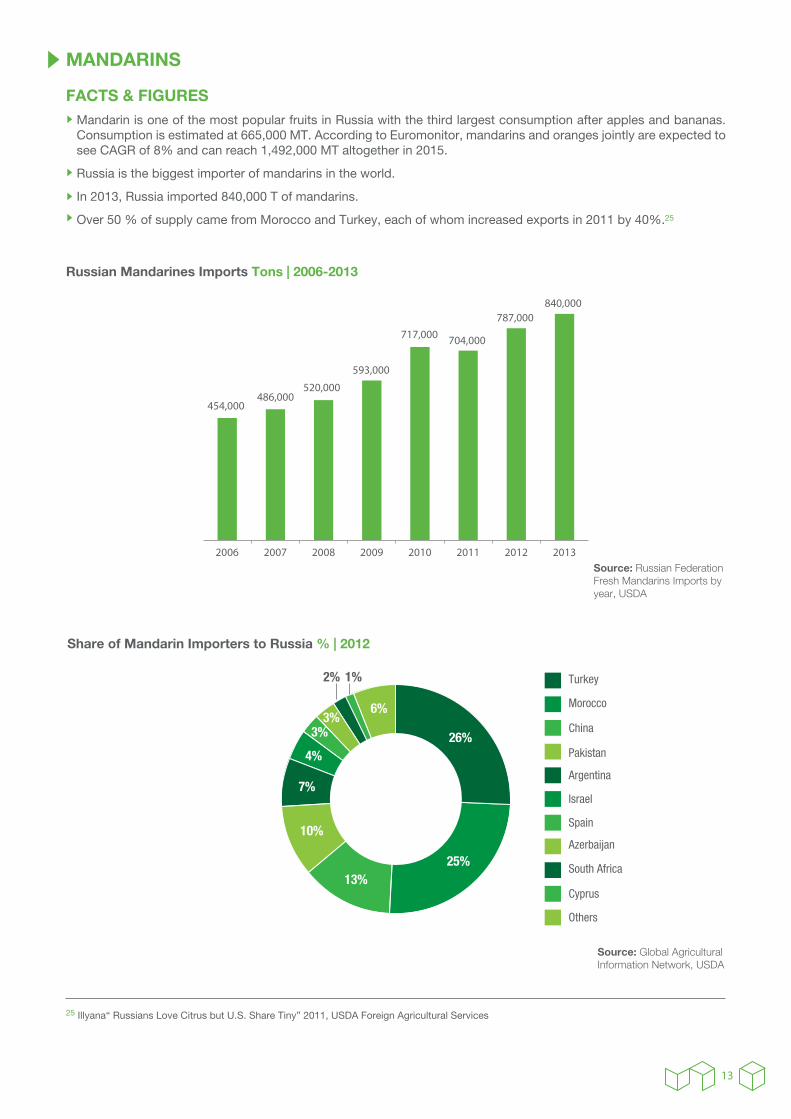
MANDARINS
FACTS & FIGURESMandarin is one of the most popular fruits in Russia with the third largest consumption after apples and bananas. Consumption is estimated at 665,000 MT. According to Euromonitor, mandarins and oranges jointly are expected to see CAGR of 8% and can reach 1,492,000 MT altogether in 2015.
Russia is the biggest importer of mandarins in the world.
In 2013, Russia imported 840,000 T of mandarins.
Over 50 % of supply came from Morocco and Turkey, each of whom increased exports in 2011 by 40%.25
Source: Russian Federation Fresh Mandarins Imports by year, USDA
Russian Mandarines Imports Tons | 2006-2013
2006 2007 2008 2009 2010 2011 2012 2013
Others
Cyprus
South Africa
Azerbaijan
Spain
Israel
Argentina
Pakistan
China
Morocco
Turkey
Share of Mandarin Importers to Russia % | 2012
Source: Global Agricultural Information Network, USDA
25 Illyana“ Russians Love Citrus but U.S. Share Tiny” 2011, USDA Foreign Agricultural Services
13
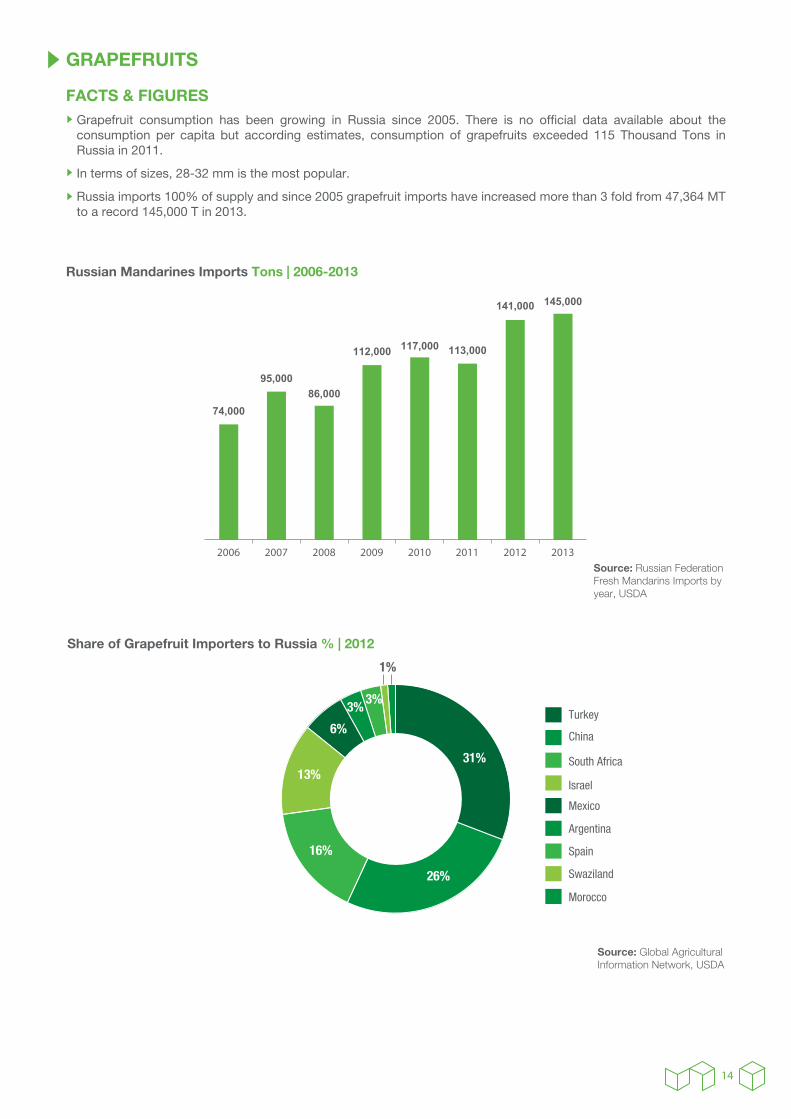
GRAPEFRUITS
FACTS & FIGURESGrapefruit consumption has been growing in Russia since 2005. There is no of�cial data available about the consumption per capita but according estimates, consumption of grapefruits exceeded 115 Thousand Tons in Russia in 2011.
In terms of sizes, 28-32 mm is the most popular.
Russia imports 100% of supply and since 2005 grapefruit imports have increased more than 3 fold from 47,364 MT to a record 145,000 T in 2013.
Source: Russian Federation Fresh Mandarins Imports by year, USDA
Russian Mandarines Imports Tons | 2006-2013
74,000
95,00086,000
112,000 117,000 113,000
141,000 145,000
2006 2007 2008 2009 2010 2011 2012 2013
Share of Grapefruit Importers to Russia % | 2012
Source: Global Agricultural Information Network, USDA
Morocco
Swaziland
Spain
Argentina
Mexico
Israel
South Africa
China
Turkey
14
III - ConclusionFinally, it is clear that the Russian market for fruits and vegetables is an attractive one for Lebanese exports. The demand for imports of fresh fruits and vegetables is high and the prices are moderate. Also we can make advan-tage of the months of low production in Russia where they depend more strongly on imports. However in order for this to be done, certain regulations set by the Russian Federation for trade should be followd including hygenic safety and inspection of products, packaging, importers status and other factors.
15