Munich Personal RePEc Archive
From value chain analysis to global value
chain analysis: fresh orange export sector
in mediterranean partner countries
Sausman, Christopher and Garcia, Marian and Fearne,
Andrew and Felgate, Melanie and Ait el mekki, Akka and
Cagatay, Selim and Soliman, Ibrahim and Thabet, Boubaker
and Thabet, Chokri and Ben saïd, Mohamed and Laajimi,
Abderraouf and Al ashkar, Haitham and El hadad-gauthier,
Fatima and Mili, Samir and Martínez, Carolina
Kent Business School, University of Kent, Canterbury, UK, KentBusiness School, University of Kent, Canterbury, UK, Kent BusinessSchool, University of Kent, Canterbury, UK, Kent Business School,University of Kent, Canterbury, UK, Department of AgriculturalEconomics, ENA Meknes, Meknes, Morocco, Department ofEconomics, Akdeniz University, Antalya, Turkey, Department ofAgricultural Economics, Zagazig University, Zagazig, Egypt,Department of Agricultural Economics and Food Management,Institut National Agronomique, Tunis, Tunisia, Department of
Agricultural Economics and Food Management, Institut NationalAgronomique, Tunis, Tunisia, Department of AgriculturalEconomics and Food Management, Institut National Agronomique,Tunis, Tunisia, Department of Agricultural Economics and FoodManagement, Institut National Agronomique, Tunis, Tunisia,National Agricultural Policy Centre, Damascus, Syria,Mediterranean Agronomic Institute of Montpellier (CIHEAM-IAM),Montpellier, France, Centre for Human and Social Sciences, SpanishNational Research Council (CSIC), Madrid, Spain, Centre forHuman and Social Sciences, Spanish National Research Council(CSIC), Madrid, Spain
20 June 2015
Online at https://mpra.ub.uni-muenchen.de/66481/
MPRA Paper No. 66481, posted 07 Sep 2015 16:43 UTC
Chapter 8
From Value Chain Analysis to Global
Value Chain Analysis: Fresh Orange
Export Sector in Mediterranean Partner
Countries
Christopher Sausman, Marian Garcia, Andrew Fearne,
Melanie Felgate, Akka Ait El Mekki, Selim Cagatay,
Ibrahim Soliman, Boubaker Thabet, Chokri Thabet,
Mohamed Ben Saïd, Abderraouf Laajimi, Haitham Al Ashkar,
Fatima El Hadad-Gauthier, Samir Mili and Carolina Martínez
8.1 Introduction
Preceding chapters outlined some of the challenges facing Mediterranean Partner
Countries (MPCs), from stubborn rural poverty to a crisis in its rapidly changing
demographics. The region is facing a predicament over agricultural policy and
competitiveness in its agri-food sector. MPCs and the wider region of the Middle
C. Sausman � M. Garcia (&) � A. Fearne � M. FelgateKent Business School, University of Kent, Canterbury, UKe-mail: [email protected]
A.A.E. MekkiDepartment of Agricultural Economics, ENA Meknes, Meknes, Morocco
S. CagatayDepartment of Economics, Akdeniz University, Antalya, Turkey
I. SolimanDepartment of Agricultural Economics, Zagazig University, Zagazig, Egypt
B. Thabet � C. Thabet � M.B. Saïd � A. LaajimiDepartment of Agricultural Economics and Food Management,Institut National Agronomique, Tunis, Tunisia
H.A. AshkarNational Agricultural Policy Centre, Damascus, Syria
F.E. Hadad-GauthierMediterranean Agronomic Institute of Montpellier (CIHEAM-IAM), Montpellier, France
S. Mili � C. MartínezCentre for Human and Social Sciences, Spanish National Research Council (CSIC),Madrid, Spain
© Springer International Publishing Switzerland 2015M. Petit et al. (eds.), Sustainable Agricultural Development,Cooperative Management, DOI 10.1007/978-3-319-17813-4_8
197
East and North African (MENA) are failing to meet the challenge of averting heavy
rural-urban migration and the current policy strategy has not brought the economic
growth to the region that it desperately needs (Baldacci et al. 2008). Poor economic
opportunities are pushing rural households into the city where instead of finding
new prospects, poverty is merely concentrated in urban slums and unemployment
continues to be a looming threat for the region (Nabli 2004). The population
in MPCs that depend on agriculture coupled with a job crisis that must be con-
fronted over the next decade suggests that the agri-food sector is, at least in the
short term, the only realistic sector to bring economic improvements to rural areas
in MENA. Yet growth in value-added agriculture in MENA is on par with sub-
Saharan Africa and is significantly less than all other developing regions
(Binswanger-Mkhize and McCalla 2010). Agricultural policies in the region con-
tinue to link competitiveness, with volume being the overarching aim (Lindberg
et al. 2006). All of this suggests that the region presents fertile ground to test a new
value-orientated tool that goes beyond ‘conventional industry studies’ (Kaplinsky
and Morris 2002).
The present chapter contrasts with other chapters in this book. Rather than an
analysis from the subject area of economics, a method that is more aligned with the
business management discipline is presented.
Using a methodology adapted from the work of Taylor (2005) and taken from
the Supply Chain Management (SCM) literature, this chapter applies a Global
Value Chain Analysis (GVCA) which identifies where value is created in the eyes
of the end consumer and highlights bottlenecks based on the flow of materials, the
flow of information and the strength of relationships between actors, from spot
market and opportunistic to integrated and trusting relations. The contribution is
primarily methodological in that it is an attempt to link process tracing and con-
sumer-orientated demand pull concepts in the SCM literature (Collins 2009; Fearne
2009) with creating policy recommendations within the context of export
competitiveness.
The chapter begins with a literature review of value chain thinking concepts and
a review of past methodological approaches in the SCM literature to value chain
analysis, leading to our justification for contributing to the literature with a sectoral
level of analysis and combining it with qualitative key informant information to
create policy recommendations. Then an overview of the fresh orange sector in the
region is described and justification for using MPCs as a context is offered. Based
on the methodology we adapt from Taylor (2005) which provides a multi-faceted
view of the global value chain, a set of insights are gathered about the nature of
value creation and where constraints exist. Resulting policy recommendations
provide examples of how a value-chain-centric approach could be used to highlight
innovative policy solutions to MPCs’ agri-food export sector, for instance, dis-
seminating consumer information to relevant stakeholders and incentivising
investment in supply chain activities that add value for European consumers. A
broad aim of our chapter is to generate a discussion over how value chain thinking
can be used as a tool to inform policy debate.
198 C. Sausman et al.
8.2 From Value Chain Analysis to Global Value Chain
Analysis
The concept of a value chain was first introduced by David and Goldberg (1957)
and popularised by Porter (1990). The value chain presents the input-output
structure of supply chains as one which is composed of particular value-adding
activities. Value chain thinking starts from the basic and widely held assumption
that the value of a finished product is decided by the final consumer and thus, the
value chain is defined as the activities that add value to a product from basic raw
materials to the final consumer (Lindic and da Silva 2011; Slywotzky and Morrison
1997; Soosay et al. 2012; Walters and Lancaster 2000). It therefore advocates a
demand pull strategy where consumer value dictates the value attributed to activ-
ities along the chain rather than a supply-push approach (Walters and Lancaster
2000). The end result from this line of thinking is that all components of the value
chain play a role in formulating and creating consumer value; therefore a weakness
with one component has an adverse effect on the creation of value for the whole
value chain.
Value chain thinking requires this broad analysis because constraints or
opportunities can exist in any part of the chain (Campbell 2008), rather than just
focusing on a single actor which only tells a fraction of the story. Effective chain
practises, built on holistic concepts of strong strategic partnerships founded on
inter-firm trust and a high degree of quantity and quality in information sharing
between firms, create a competitive advantage that, in turn, improves organizational
performance, and conversely, a spot market relationship where little information is
shared and relations are opportunistic and could have a detrimental impact on
performance (Carson et al. 2003; Delbufalo 2012; Dyer and Singhe 1998; Handfeld
and Bechtel 2002; Kannana and Tanb 2005; Li et al. 2006; Zaheer et al. 1998). This
presents a strong argument against firms acting in ‘functional silos’ (Christopher
2011). The implication is that competition is moving away from ‘between firms’ to
‘between value chains’ where it is the entire chain which becomes the vehicle for
adding value and eliminating waste and not the individual organization in isolation
(McGuffog and Wadsley 1999). This holistic, multi-dimensional view of agri-food
chains sets the conceptual basis for Value Chain Analysis (VCA).
There is a variety of different approaches and conceptions of what constitutes a
VCA, each stemming from different sub-disciplines in the literature.1 One such
approach is from SCM where VCA finds its origins in Value Stream Mapping
(VSM) (Womack and Jones 1994). VSM is a lean manufacturing method, based on
the work by Hines and Rich (1997), to analyse the efficiency of material and
information flows between segments in the value chain with the aim of eliminating
waste through the facilitation of efficient flows. This kind of technique to eliminate
waste has a strong record of revealing and eliminating waste along the value chain
1Trienekens (2011) outlines four distinct theoretical models for VCA; Global Value Chains, SCM,New Institutional Economics and the Network Approach.
8 From Value Chain Analysis to Global Value Chain Analysis … 199
(Francis 2000; Jones and Simons 2000). VCA borrows from this but with the added
dimension of relationships between chain members which relates to the organisa-
tion, management and control of the chain (Taylor 2005) and has a significant
impact on supply chain outcomes (Christopher and Juttner 2000; Cousins and
Menguc 2006; Li et al. 2006). In line with Porter’s (1990) notion of value addition
and based on the idea that consumers have the final say on what constitutes value
(Slater and Narver 1992), a number of studies have incorporated consumer research
into the methodology (Adhikari et al. 2012; Bonney et al. 2007, 2008; Soosay et al.
2012).
Therefore, in accordance to its evolution in the SCM literature, VCA is a
diagnostic tool to assess the strengths and weaknesses within a value chain based on
three constructs: (1) the material flow, judged based on where value lies in the eyes
of final consumers, identifying where investment should be targeted and what
activities should be eliminated; (2) the dynamics of information flow between
actors; and (3) the strength of relationships, constructed from notions of trust and
commitment between actors. VCA looks at the stages a product goes through, all
the way from raw materials to final consumption (Rieple and Singh 2010). While
VCA has had a strong presence in the motor and I.T. sectors, the agricultural sector
presents a more challenging picture of transactional, arms-length relationships
between partners (Simons et al. 2003).
A number of studies have built on the VCA tool to analyse different dimensions
of agricultural value chains and competitiveness, demonstrating the versatility of
VCA to tackle a variety of concepts and issues. Bonney et al. (2007) use VCA to
identify the processes and key factors for co-innovation between value chain
stakeholders. Expanding the scope of VCA to environmental sustainability, Soosay
et al. (2012) modify the methodology into Sustainable Value Chain Analysis
(SVCA) by quantifying the environmental impacts of activities in the value chain.
Focusing on the notion of consumer value, Adhikari et al. (2012) demonstrates how
segmentation could be a powerful tool for reforming the tomato value chain in
Nepal.
While the applications of VCA have varied, to date it has tended to be utilized as
an in-depth tool bounded by an inter-/intra-firm unit of analysis (Fearne et al. 2012).
However because current methods choose contextual depth over generalizability, a
single chain method restricts the ability to make the broader generalizations nec-
essary to inform agricultural policy. The findings from VCA studies within the
SCM literature have been mostly restricted to the chain in question. In the past,
research on agricultural policy has been informed by conventional industry studies
from the economics profession based on a focus on size and growth, especially in
terms of gross output rather than value addition (Kaplinsky and Morris 2002). The
necessary step to bring VCA into relevance for policy makers would be to make a
move towards a sectoral level of analysis (Schmitz 2005).
To reflect a change in the unit of analysis, we shift terms from ‘value chain’ to a
‘Global Value Chain’ (GVC) defined as value-adding activities that typify an
industry and go beyond borders, typically from developing country suppliers to
developed country consumers, and representing a multitude of stakeholders bound
200 C. Sausman et al.
by their participation in the same sector (Gereffi 1999; Gereffi et al. 2005;
Kaplinsky 2000; Kaplinsky and Morris 2002). Mirroring the change in the unit of
analysis, we also redefine the method of VCA to Global Value Chain Analysis
(GVCA). It is important to note that we use this term not for the same purposes as in
the framework offered by Gereffi et al. (2005) and Humphrey and Schmitz (2002).
These authors’ framework is more in line with the governance paradigm of power
relationships and lead firm coordination, rather than the lean concepts contained in
SCM. Therefore, while there have been policy implications drawn from the GVC
governance framework (Kaplinsky and Morris 2002; Schmitz 2005), these impli-
cations have not been fully considered in a SCM approach to policy problems.
The novelty of our contribution is the combination of a methodology developed
by Taylor (2005) with a GVC aggregated view of the fresh orange sector, placed
within the context of sustainable development in the Middle East. There is scope for
making a methodological contribution to the literature by demonstrating the lessons
learnt in adapting VCA from a single value chain with a low number of participants
and a narrowly defined value stream, reflecting current VCA methods in SCM,
towards a more aggregated level that involves a larger sample of participants. At the
same time, we also wish to demonstrate how value chain thinking can be utilized as
a lens to view policy.
8.3 Research Methods
8.3.1 Data Collection
As noted in the review of the literature, the research methods used in the study are
different to those used in previous VCA in that we take process tracing from the
SCM literature and aggregate it to the industry level as a means to generate broad
policy recommendations. As a result, the research was expanded from a small
number of participants to a larger sample. Participants included:
• Citrus input suppliers who provide fertilizer and pesticides to growers
• Orange growers
• Extension services that, despite not participating in the flow of materials, pro-
vide advice and training to growers
• Orange packers
• Citrus exporters
• Citrus buyers from UK, France, Germany, Spain and Russia
• Consumers from UK, France, Germany and Russia
European countries were chosen based on their prominence as destination
markets for oranges coming from the region. The data that makes up the GVCA
comes from both quantitative and qualitative sources through survey and interview
methods. Two areas are examined as part of the methodology: consumer value and
global value chain dynamics (material flow, information flow and relationships).
8 From Value Chain Analysis to Global Value Chain Analysis … 201
Consumer value was constructed through three exploratory focus groups in the
UK, with eight participants in each, and segmented by place of shop, to build a
basic understanding of shoppers’ attitudes towards oranges. From this, formalized
surveys were implemented in France, Germany, UK and Russia using consumer
panels. Consumer surveys were completed by 1031 participants in total, out of
which 266 were from the UK, 248 from France, 258 from Germany and 259 from
Russia. The whole sample had a gender split of 50/50 and a one third split across
three age groups: 18–34 years; 35–64 years; and 65+ years. All survey respondents
were responsible for most of the household food shopping and were themselves a
consumer of oranges. To enhance the consumer element of the GVCA, the study
incorporated Dunnhumby’s UK consumer data using two years of Tesco super-
market transactions from the period 23rd February 2009 to 14th February 2011.
A European buyers’ survey was also implemented and completed by 27 par-
ticipants. Out of the sample respondents, there were: three from the UK; 19 from
France; two from Germany; and one from Russia. To enhance the data, secondary
data was used from a study on Spanish orange buyers (Mili and Martínez 2012),
even though Spanish consumers were not analysed in the consumer value construct.
In addition to the above data sources associated with consumer value and
European buyers, surveys were distributed to stakeholders along the fresh orange
value chain for all five case study countries:
• Egypt—surveys from stakeholders completed by: 10 input suppliers; 1 exten-
sion/agronomy service; 31 citrus growers; 9 citrus packers; 10 exporters;
3 logistic companies; and 27 European buyers.
• Morocco—surveys from stakeholders completed by: 7 input suppliers;
4 extension/agronomy services; 45 citrus growers; 7 citrus packers; 12 export-
ers; 5 logistic companies; and 27 buyers.
• Syria—surveys from stakeholders completed by: 9 input suppliers; 14 exten-
sion/agronomy services; 113 citrus growers; 15 citrus packers; 12 exporters; 11
logistic companies; and 27 European buyers. Interviews were also carried out
with: one fertilizer and pesticide input supplier; one agent; and a chamber of
commerce meeting, including one farmer/packing house/export owner who
became a principle informant.
• Tunisia—surveys from stakeholders completed by: 20 input suppliers; 9 exten-
sion/agronomy services; 89 citrus growers; 11 citrus packers; 12 exporters;
6 logistic companies; and 27 buyers.
• Turkey—surveys from stakeholders completed by: 10 input suppliers;
10 extension/agronomy services; 107 citrus growers; 50 citrus packers; 30
exporters; 10 logistic companies; and 27 buyers. Interviews were also carried out
with: one fertilizer and pesticide input supplier; two growers; two packaging/
exporting firms; and one logistics firm.
Surveys distributed to stakeholders were concerned with information flow and
relationship constructs throughout the chain. Interviews with Syrian and Turkish
stakeholders also sought to qualitatively measure these constructs, as well as setting
the basis for mapping the material flow. To augment the data gained from these
202 C. Sausman et al.
interviews, key informant information compiled from local experts were utilized to
better understand how materials flowed through the chain and to generate policy
implications from the research.
8.3.2 Data Analysis
Findings from focus groups were thematically organized into a list of potential
attributes that informed the survey tool for consumer panels. From our consumer
panel surveys, orange attributes were ranked based on a mean average of our 5-
point Likert scale, from ‘not at all important’ = 1 to ‘very important’ = 5, such that a
framework could be developed where activities in the value chain are judged based
on their contribution (or lack of contribution) towards attributes regarded as
important to European consumers. In addition, a comparison of means using
independent t-tests and one-way ANOVA tests were undertaken to determine how
gender, age group and country of residence impacted on attitudes towards fresh
oranges. We also analyzed promotional data to understand the impact on orange
sales using a multiple regression model developed by Felgate et al. (2011). The
model used to measure the effect of promotions was specified as follows:
SALESit ¼ b0 þ b1PCit1 þ b2YXit2 þ b3BOGOFit3þ b4EXFit4
þ b4MBit5 þ b4SPit6 þ eit
In the model, SALES represents the dependant variable sales value per store for
a given product sub-group, i, in a given time period, t. Sales value per store was
used rather than total sales, since it takes into account fluctuations in distribution
over the time period and growth in the total number of Tesco stores. The parameters
of the model are β0, which represents a fixed unknown parameter, and a series of 0–
1 dummy variables representing the different types of price promotion for product
sub-group i in the time period t. The types of promotion incorporated in the model
were price cuts (PC), Y for £X offers (YX), buy one-get-one-free (BOGOF), extra
free promotions (EXF), 3-for-2 multi-buy promotions (MB) and special promo-
tional packs (SP). The error term, e, incorporates all the immeasurable factors which
may also be influencing sales aside from promotions.
The material flow was thematically analysed from qualitative interviews and key
informant information. A ‘map of the chain’ was created which shows all the
activities along the chain (Fig. 9.1). The efficiency and effectiveness of the material
flow in the fresh orange global value chain is judged based on:
• Timeliness in allowing continuous, efficient flow through processing, while
avoiding unnecessary inventory and product movements;
• Minimising waste caused by unnecessary processing or by production of
unusable raw material or by-products; and
• Maximising areas for adding value.
8 From Value Chain Analysis to Global Value Chain Analysis … 203
From the classification of consumer attributes and the evaluation of whether
activities were necessary to bring the product to market from qualitative interviews
and key informants, we labelled activities along the chain as: value adding (V);
non-value adding but necessary (N); or wasteful (W).In addition to the material
flow, mean averages were taken from stakeholder surveys based on a 5-point Likert
scale, ranging from ‘strongly disagree’ = 1 to ‘strongly agree’ = 5, with a set of
statements reflecting information flows and strength of relationships. Qualitative
interviews supplemented survey data such that triangulation could take place and a
more in-depth understanding of potential barriers and enablers could be imple-
mented. Using our GVCA findings, key informants proposed policy
recommendations.
8.4 The Fresh Orange Export Sector in Mediterranean
Partner Countries
The Food and Agriculture Organization (FAO) data (2013) shows that the value of
global orange exports increased significantly during the period of 2000–2008,
although a small decline took place between 2004 and 2005. From 2000 to 2008,
the value of global orange exports doubled with an increase of 122.1 %. Spain, US
and South Africa are the three largest orange exporters with respect to value. Spain
dominates the European market with over 50 % of its export quantity and value for
fresh oranges going to Germany and France alone (FAO 2013).
Within the region, fresh fruit is the third largest crop and citrus dominates fresh
fruit production (Montgomery 2009). The quantity of exported oranges from case
study countries varies significantly, from 821,812 tonnes exported from Egypt in
2009 compared to 18,016 tonnes exported by Syria (FAO 2013). Egypt represents a
unique case where the growth in exports has exponentially risen by 1343 %
between 2000–2008; between 2007 and 2008 alone, export value rose by 141 %
(FAO 2013). In 2008, Egypt overtook Morocco to become the highest orange
exporter (by value) within the selected case study countries. Case study countries
have in general seen growth in the value of fresh orange exports since 2005,
although Morocco and Tunisia reached a peak in 2008 and then fell slightly in
2009.
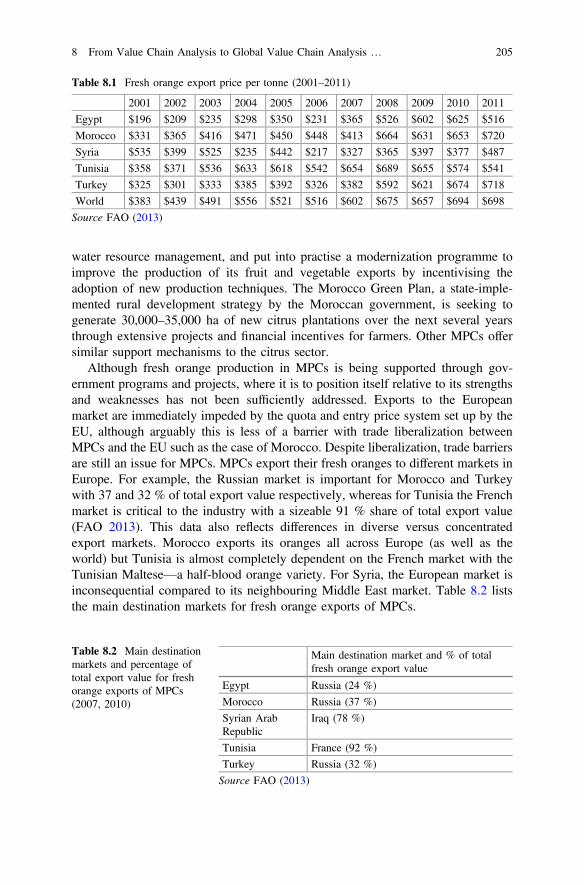
As Table 8.1 shows, the fresh orange export price per tonne for MPCs and
globally has risen substantially since 2005, reflecting wider global food inflation
figures (World Bank 2012). In 2011, only Turkey and Morocco have a higher
export price than the world average and other MPCs are substantially lower. Indeed
from the FAO data (2013), the leading exporters in the world market such as Spain
and the US are able to capture significantly higher prices for their exported oranges
than MPCs.
Many countries in the MPCs have initiated programs that directly have an
impact on orange production. The Egyptian government has implemented the
‘Sustainable Agriculture Development Program’ to improve irrigation systems and
204 C. Sausman et al.
water resource management, and put into practise a modernization programme to
improve the production of its fruit and vegetable exports by incentivising the
adoption of new production techniques. The Morocco Green Plan, a state-imple-
mented rural development strategy by the Moroccan government, is seeking to
generate 30,000–35,000 ha of new citrus plantations over the next several years
through extensive projects and financial incentives for farmers. Other MPCs offer
similar support mechanisms to the citrus sector.
Although fresh orange production in MPCs is being supported through gov-
ernment programs and projects, where it is to position itself relative to its strengths
and weaknesses has not been sufficiently addressed. Exports to the European
market are immediately impeded by the quota and entry price system set up by the
EU, although arguably this is less of a barrier with trade liberalization between
MPCs and the EU such as the case of Morocco. Despite liberalization, trade barriers
are still an issue for MPCs. MPCs export their fresh oranges to different markets in
Europe. For example, the Russian market is important for Morocco and Turkey
with 37 and 32 % of total export value respectively, whereas for Tunisia the French
market is critical to the industry with a sizeable 91 % share of total export value
(FAO 2013). This data also reflects differences in diverse versus concentrated
export markets. Morocco exports its oranges all across Europe (as well as the
world) but Tunisia is almost completely dependent on the French market with the
Tunisian Maltese—a half-blood orange variety. For Syria, the European market is
inconsequential compared to its neighbouring Middle East market. Table 8.2 lists
the main destination markets for fresh orange exports of MPCs.
Table 8.1 Fresh orange export price per tonne (2001–2011)
2001 2002 2003 2004 2005 2006 2007 2008 2009 2010 2011
Egypt $196 $209 $235 $298 $350 $231 $365 $526 $602 $625 $516
Morocco $331 $365 $416 $471 $450 $448 $413 $664 $631 $653 $720
Syria $535 $399 $525 $235 $442 $217 $327 $365 $397 $377 $487
Tunisia $358 $371 $536 $633 $618 $542 $654 $689 $655 $574 $541
Turkey $325 $301 $333 $385 $392 $326 $382 $592 $621 $674 $718
World $383 $439 $491 $556 $521 $516 $602 $675 $657 $694 $698
Source FAO (2013)
Table 8.2 Main destinationmarkets and percentage oftotal export value for freshorange exports of MPCs(2007, 2010)
Main destination market and % of totalfresh orange export value
Egypt Russia (24 %)
Morocco Russia (37 %)
Syrian ArabRepublic
Iraq (78 %)
Tunisia France (92 %)
Turkey Russia (32 %)
Source FAO (2013)
8 From Value Chain Analysis to Global Value Chain Analysis … 205
The trade system facing orange exporters, coupled with large-scale competitor
countries in the US and South America, goes against a strategy where cost disad-
vantages may push agri-food stakeholders out of the chain if they do not switch to
the creation of value for their respective end consumers (Drucker 1999). It has been
argued that previous agricultural policy in the region has not brought the gains that
the agri-food sector desperately needs (Baldacci et al. 2008). In the past, agricul-
tural policy in the region has focused mainly on market liberalization (although still
protective of some agricultural sectors) and linked competitiveness exclusively to
volume and production yields (Lindberg et al. 2006). Although policy based on
maximising productivity has merit and is certainly not dismissed here, there is room
for introducing a new approach to competitiveness.
8.5 Findings
8.5.1 Consumer Value
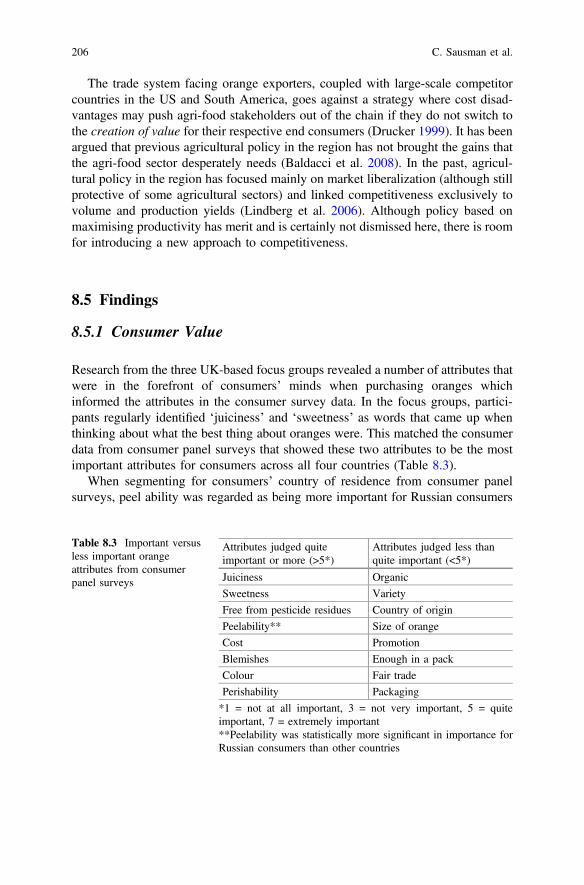
Research from the three UK-based focus groups revealed a number of attributes that
were in the forefront of consumers’ minds when purchasing oranges which
informed the attributes in the consumer survey data. In the focus groups, partici-
pants regularly identified ‘juiciness’ and ‘sweetness’ as words that came up when
thinking about what the best thing about oranges were. This matched the consumer
data from consumer panel surveys that showed these two attributes to be the most
important attributes for consumers across all four countries (Table 8.3).
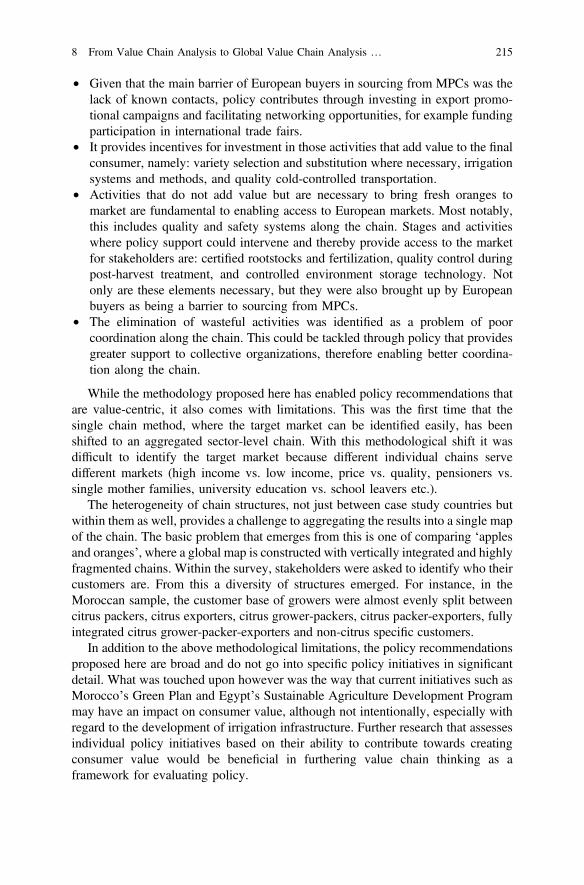
When segmenting for consumers’ country of residence from consumer panel
surveys, peel ability was regarded as being more important for Russian consumers
Table 8.3 Important versusless important orangeattributes from consumerpanel surveys
Attributes judged quiteimportant or more (>5*)
Attributes judged less thanquite important (<5*)
Juiciness Organic
Sweetness Variety
Free from pesticide residues Country of origin
Peelability** Size of orange
Cost Promotion
Blemishes Enough in a pack
Colour Fair trade
Perishability Packaging
*1 = not at all important, 3 = not very important, 5 = quiteimportant, 7 = extremely important**Peelability was statistically more significant in importance forRussian consumers than other countries
206 C. Sausman et al.
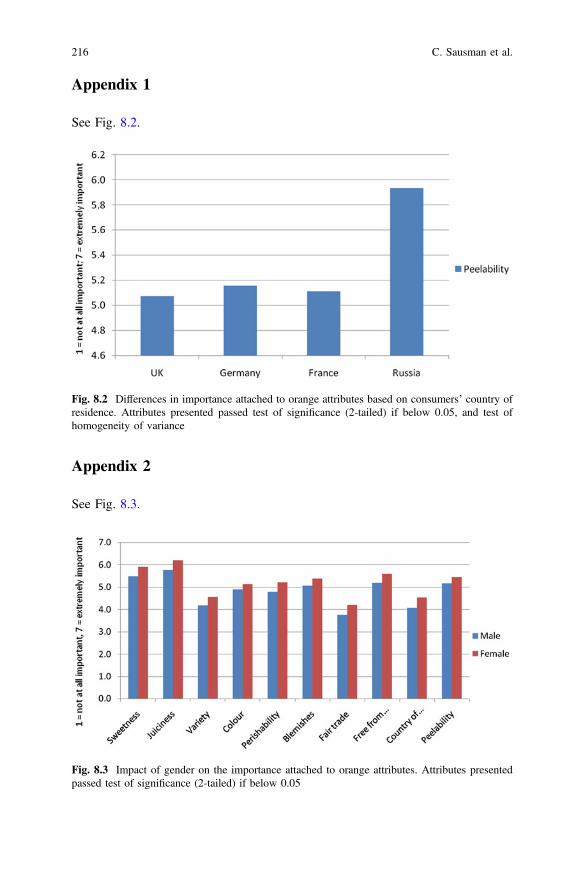
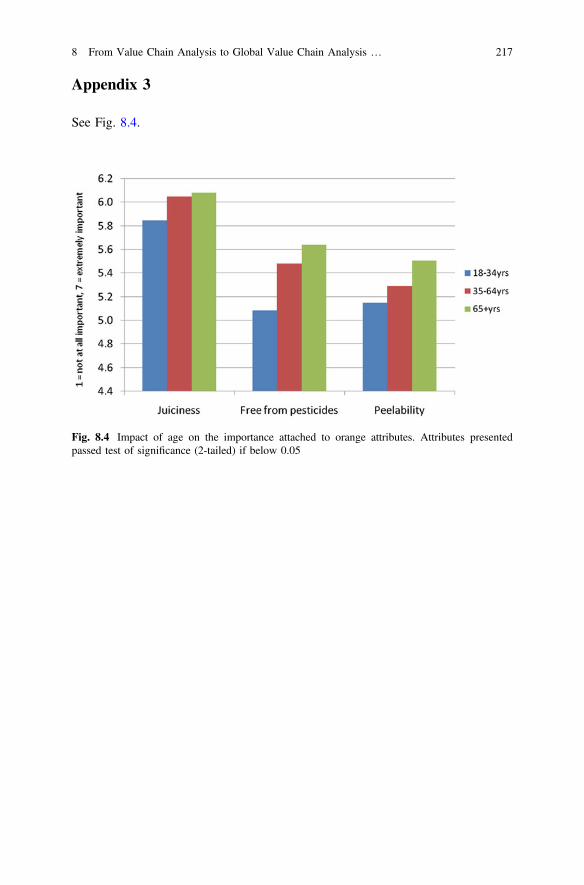
than the other three European countries. When segmenting for age and gender,
female consumers and those which were considered older attached greater impor-
tance to attributes considered generally important by the whole sample, suggesting
that these segments are more sensitive to orange characteristics during the pur-
chasing decision than other consumer types. This corresponded with the UK loyalty
card data which showed that the main consumers of oranges are pensioners; older
families and affluent households were the most dominant purchasers of oranges.
Organic oranges appeared to accentuate the effect of affluence where up-market
consumers were almost twice as likely to purchase organic than the average
consumer.
Using the model developed by Felgate et al. (2011), the effect of promotions on
orange sales indicated that, in general, promotions do not have a particularly strong
effect on sales and that in some cases it actually had a negative impact. When
looking at the impact of promotions on sales of oranges in total, at an aggregated
level, only price cuts and buy-one-get-one-free promotions were found to have a
significant impact. Promotions were found in total to account for 16.7 % of the
change in sales of oranges at the aggregated level. Price cuts were found on average
to increase sales per store by £113 per week, while buy-one-get-one-free promo-
tions increased sales by £158 per week, per store. This paralleled with the consumer
panel surveys that showed that oranges on promotion was not an attribute con-
sumers found to be particularly important during the purchasing decision.
8.5.2 Perceptions of European Buyers
The buyers’ research showed that when deciding whom they source their oranges
from, participant buyers look for a large range of characteristics—9 out of 13
characteristics were rated more than ‘quite important’. Of the 27 buyers who were
interviewed, few judged case study country suppliers in terms of how they com-
pared to their best suppliers. In the case of Syria, nothing could be concluded
because no buyers interviewed sourced their oranges from Syria and therefore were
not able to be judged. This outcome indicates that Syrian oranges are not well
known in the European market, mirroring export data that shows that Syrian fresh
orange exports do not primarily go to European consumers (FAO 2013).
Where European buyers judged the supply of fresh oranges from individual case
study countries, results were mixed. Egypt has a good rating for volume and cost
but rated poorly for the willingness of suppliers to collaborate with buyers
for mutual advantage. Turkey failed in its quality of oranges in the eyes of
European buyers, an attribute that buyers identified as important in their sourcing
decisions. The open-ended answers indicated that one of the principle barriers
behind why European buyers do not source more oranges from case study countries
is a lack of contacts with exporters, suggesting that it is not necessarily the quality
of relationships between exporters and importers in the value chain that is the
8 From Value Chain Analysis to Global Value Chain Analysis … 207
principal bottleneck, but rather the existence of relationships at all. This has
implications for policy in terms of promotional activity as a common good for the
GVC, an issue further discussed in Sect. 8.6.
For Spanish buyers, the attributes they consider to be important to consumers
and the characteristics of suppliers that are important to themselves mirror many of
those identified by other European buyers. Moroccan suppliers are the dominant
supplier of Spanish oranges and the reasons provided for this were based on the low
cost of oranges they supply, although the quality of oranges was brought up as a
concern. Other MPC suppliers were stated as having deficiencies based on post-
harvest handling and cultural differences, particularly concerning conflicts in
delivery times where suppliers injected a level ‘flexibility’ in this regard compared
to the tighter schedule required by Spanish buyers. In addition, pre-payment rep-
resented a barrier to sourcing from case study countries. Logistics was also iden-
tified as being a problem where the poor quality of transportation led to perished
and wasted produce when received by Spanish buyers, correlating with findings
from the ‘mapping the chain’ stage where transportation is identified as a value-
adding activity. Related to this was the idea of reputation ‘contagion’, where
because a Spanish buyer received wasted oranges from an Egyptian supplier, the
buyer then cut off future dealings with all Egyptian suppliers rather than just the
single exporter.
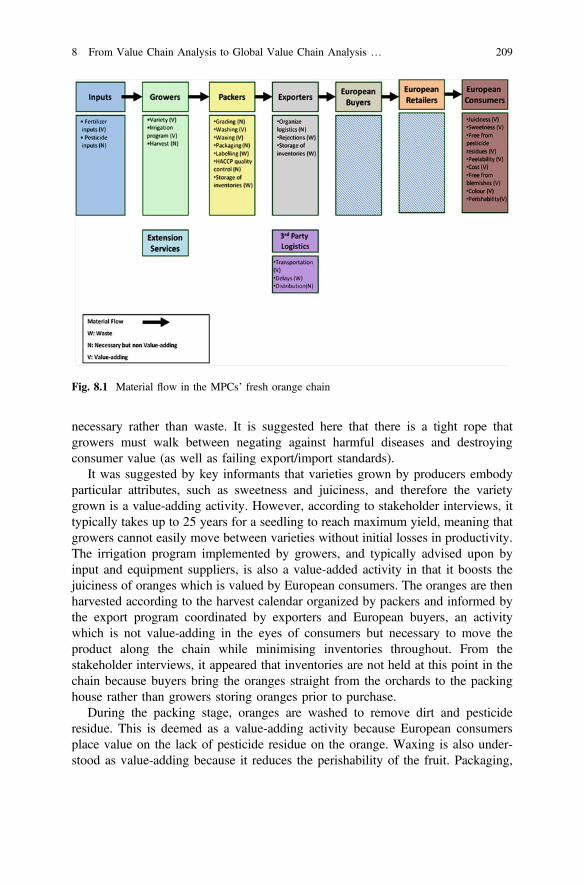
8.5.3 Flow of Materials
Using consumer value as the framework for measuring value in the fresh orange
chain, activities along the chain are classified as: “value adding” (V) which con-
tribute to the attributes considered at least “quite important” to consumers; “nec-
essary but non value- adding” (N) for activities that do not contribute to attributes
important to consumers but are necessary for bringing the product to market; and
“wasteful” (W) for activities that are not important to consumers and are unnec-
essary to bringing the product to market. The classification of activities is presented
in Fig. 8.1.
Input suppliers supply fertilizer and pesticide chemicals to growers. Fertilizers,
particularly major elements such as potassium, were identified as a value adding
activity because they contribute towards the juiciness and sweetness, and negate
against blemishes, all of which are deemed as important by European consumers.
Pesticide use however does not contribute towards these attributes and could even
potentially destroy value because consumers consider ‘free from pesticide residues’
as an important consideration during the purchasing decision. Strict standards are
also imposed by European markets on the level of pesticide use for fruit and
vegetable imports, for instance the Ecophyto plan 2018, which seeks to reduce the
use of pesticides in France by 50 % which gives some indication of how attitudes
are changing. However, pesticide inputs prevent disease and insect infiltration
which can destroy the fruit and, as a result, are classified non-value adding but
208 C. Sausman et al.
necessary rather than waste. It is suggested here that there is a tight rope that
growers must walk between negating against harmful diseases and destroying
consumer value (as well as failing export/import standards).
It was suggested by key informants that varieties grown by producers embody
particular attributes, such as sweetness and juiciness, and therefore the variety
grown is a value-adding activity. However, according to stakeholder interviews, it
typically takes up to 25 years for a seedling to reach maximum yield, meaning that
growers cannot easily move between varieties without initial losses in productivity.
The irrigation program implemented by growers, and typically advised upon by
input and equipment suppliers, is also a value-added activity in that it boosts the
juiciness of oranges which is valued by European consumers. The oranges are then
harvested according to the harvest calendar organized by packers and informed by
the export program coordinated by exporters and European buyers, an activity
which is not value-adding in the eyes of consumers but necessary to move the
product along the chain while minimising inventories throughout. From the
stakeholder interviews, it appeared that inventories are not held at this point in the
chain because buyers bring the oranges straight from the orchards to the packing
house rather than growers storing oranges prior to purchase.
During the packing stage, oranges are washed to remove dirt and pesticide
residue. This is deemed as a value-adding activity because European consumers
place value on the lack of pesticide residue on the orange. Waxing is also under-
stood as value-adding because it reduces the perishability of the fruit. Packaging,
Fig. 8.1 Material flow in the MPCs’ fresh orange chain
8 From Value Chain Analysis to Global Value Chain Analysis … 209
although not considered value-adding by European consumers, is still a necessary
process because it prevents damage to the fruit during transit and is typically a
requirement set by buyers.
The oranges are then labelled, mostly for the purposes of identifying the country
of origin for consumers. However, although where an orange comes from is not
something that consumers regard as particularly important during the purchasing
decision, displaying country of origin is necessary for retailers to follow. Citrus
packaging houses must also conform to a traceability system and implement an
HACCP quality control process (Hazard Analysis and Critical Control Point) that
must be certified by an accredited body or a product quality system control, based
on the target importing market to be certified by an accredited body. Prior to
despatch, oranges are kept as inventories, meaning that coordination with exporters
is key to minimising these costs.
Exporters organize transportation for fresh oranges with logistics firms to move
the products to export markets. Oranges are held by the exporter prior to trans-
portation. The principle obstacle that exporters face is meeting the standards and
regulatory requirements for international markets. If these standards are not met,
then rejections occur either at the EU border (with the exception of Russia) or from
buyers’ own private standards. Where these rejections occur, exporters must incur
the cost which represents a waste in the material flow. In this regard, the need for
exporters to coordinate upstream is fundamental to meeting the required standards
for export markets.
Logistics is typically organized by exporters to move products to the export
market. The quality of transportation affects the perishability and reduces blemishes
which consumers value and therefore transportation is considered a value-adding
activity. Planning shipping times and coordinating with exporters and buyers over
time delivery is essential for avoiding delays at ports which can lead to oranges
going to waste. Logistic firms then distribute goods to the importer and buyer which
is necessary to bring the product to market.
8.5.4 Information Flow and Relationships
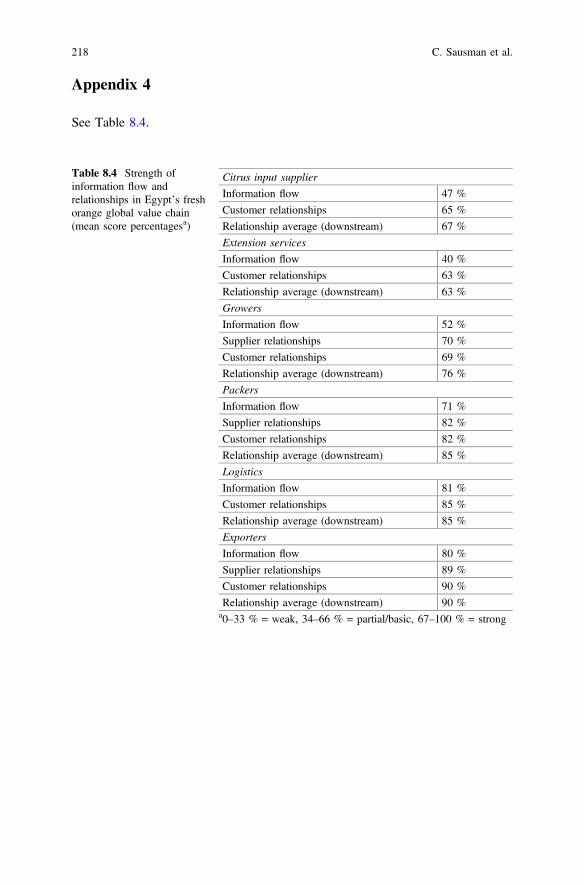
In general, the survey data showed that the information flow and strength of rela-
tionships between actors were in most part strong. Tunisia was demonstrated as
having particularly strong information flow and relationships along the chain.
However there were some relatively weak (but not weak in absolute terms) areas of
the chain. The information flows between input supplier-grower, extension service-
grower and grower-packers were not very strong in the case of Egypt. Turkey, in a
similar fashion, had partial flows between growers-packers and logistics-exporters.
What was most notable from these findings was that there was no particular pattern
of bottlenecks in the information flows and business relationships, with each
country facing a different challenge in its global value chain.
210 C. Sausman et al.
Interviews with Syrian stakeholders indicated that the information flow between
actors in the chain was poor, particularly between exporters (or agents) and
importers. Commitment and the strength of relationships between packers/exporters
and farmers were also signalled as being limited in the interviews. There were
suggestions that institutional structures, such as the Syrian chamber of commerce
and Turkey’s export union, were not particularly effective in bringing actors
together to cooperate. The relationship between the interviewed Turkish exporter
and the EU policy-setting body was signalled as being particularly problematic.
It was suggested in interviews and from key informant data that cultural norms
and behaviour set the boundaries around the degree that actors cooperate and share
information, as one farmer said when rationalizing why he didn’t ask buyers where
his oranges were going: “it’s none of our business”. Building on this concept of
culture as a driver/barrier to value chain relationships, Spanish buyers identified that
a problem in sourcing oranges from MPCs was attributed to a different cultural
understanding of “time” where MPCs’ fresh orange suppliers did not keep to strict
delivery times that are required by Spanish buyers.
8.6 Discussion: Policy Implications
The above findings provide some key implications for maximizing the competi-
tiveness of the fresh orange export industry of MPCs based on the adopted
approach. A broad finding in the consumer research was that the price of an orange
is not as important to European consumers as certain quality attributes. The
implication of this is that agricultural policies that seek to drive down production
costs with little concern about what the impact on consumer value could be doing
harm the competitiveness of the value chain. Modernization plans in MPCs should
be put within the context of maximizing value—driving down production costs and
increasing output should not be the only indicator of competitiveness. Farm pro-
duction capabilities have historically been the focus of agricultural research,
especially considering the dominance of traditional theories of rural development
over the past century (Cruickshank 2009; Marsden et al. 2001), and MPCs are no
exception.
Findings from the GVCA suggest that market information, when made available
to growers, technicians, packers and exporters, could contribute towards the com-
petitiveness of the fresh orange export sector. The creation of information networks
can be an important component of value chain competitiveness (Asem-Bansah et al.
2012); for instance the creation of a national database or training workshops with
relevant organizations can be utilized so that market information is disseminated to
stakeholders. This would allow the kind of findings generated from the consumer
research in the GVCA to be capitalized on and actors along the chain would have a
better understanding of their target market values, thereby negating misconceptions
brought up in stakeholder interviews (such as the idea that European consumers
attach importance to the country of origin during the purchasing decision).
8 From Value Chain Analysis to Global Value Chain Analysis … 211
Consumer value identified key areas for improving main quality attributes
considered by consumers: variety selection; rootstock selection; irrigation tech-
nology; pest and disease control, that are consistent with ensuring juiciness,
sweetness, and reducing perishability. Main actions and programs could:
• assess varieties and rootstock combinations against their ability to create the
attributes that European consumers regard as important,
• breed and test the species, and
• incentivise the substitution of old orchards with new varieties that maximize the
attributes valued by European consumers.
Extension actions should include adequate training programs on irrigation
methods to improve citrus quality. For example, improving irrigation scheduling,
especially during sensitive periods of fruit growth, is an important key for guar-
anteeing juiciness and facilitating peel ability. While modernization programs in
MPCs appear to be mainly concerned with boosting volume (Lindberg et al. 2006),
there is also some overlap with the value-adding activities identified in the present
research. For example, the Sustainable Agriculture Development Program in Egypt
is placed within a context of critically scarce water resources in the region, yet its
development of irrigation systems is also associated with improving product attri-
butes important to European consumers. In addition, the subsidization of inputs
(e.g. fertilizers), a common practise in most MPCs (World Bank 2008), may also be
beneficial from this point of view if it encourages producers to improve important
quality attributes. While the continuation of these programs from the perspective of
value addition would be recommended, there also needs to be reflection over the
extent this conflicts with broader institutional reforms under the EU Common
Agricultural Policy reform.
Relevant to agricultural policy is the substitution of orchards to new varieties
that are in line with the target market. As noted at the beginning of this chapter,
MPCs do not export fresh oranges to a uniform European consumer. Even those
MPCs which share borders and cultures have diverse destination markets—Tunisia
sells 91 % of its exported fresh oranges to the French market whereas Morocco is
very much diversified, with Russia consuming the largest share of 37 %. Taking
these two examples and linking back to the consumer research, the rationale for the
Moroccan export industry (or at least those fresh oranges which are destined for the
Russian market) would be to incentivize substitution towards varieties that maxi-
mize peel ability whereas the Tunisian market should focus on those that are
aligned with the tastes of French consumers. Syria presents a more unique case
where regional neighbours that import the majority of its fresh oranges are likely to
present a diverse set of tastes compared to potential European consumers (although
given the political situation at the time of writing, inroads into the European market
are unlikely for the foreseeable future). Since there are a multitude of citrus varieties
with different characteristics (Hodgson 1967), a debate over which varieties match
the tastes of target consumers while at the same time considering a complexity of
trade-offs (e.g. climatic suitability) is needed to shape where policy incentives
should be placed.
212 C. Sausman et al.
Production represents a fruitful area for policy. However post-harvest operations
are also key, including post-harvest disease control techniques that are important for
improving quality of fruits and preserving shelf-life (negating perishability):
• Quality control technology
• Preservation treatments
• Controlled environment storage technology, and
• Incentives for purchasing quality cold-controlled transportation.
Activities that did not add value but were judged necessary to bring the product
to market include those which ensure import standards for the European market.
Policy makers could assist citrus sector enterprises in improving quality and safety
systems, especially those stages that lead up to and including HACCP quality
control. Given that a barrier to adoption is the fixed costs involved, credit facili-
tation could act as a strong enabler. In addition, pesticide usage was revealed as a
‘tightrope’ where, although it is necessary to negate against disease, it can also
destroy value because European consumers have concern over pesticide residues
according to the consumer research. Facilitating training could be an important
policy tool to ensure stakeholders walk this tightrope successfully. Stages and
activities of the chain where intervention could be effective are:
Level 1. Farm: Use of certified rootstocks and fertilization, training in the type
of chemicals used, management of irrigation water resources, soil management
and plant protection against pests and diseases.
Level 2. Post-harvest Treatment and Packing: Sizing technology, quality control
technology, cleaning technology, preservation treatments, controlled environ-
ment storage technology, raw materials.
Level 3. Transport and Distribution: Vehicles used, used pallets or containers,
temperature and humidity control technologies.
Level 4. Marketing and Export: Transport conditions, insurance programs, etc.
As noted, a lack of known exporters was a significant barrier for buyers in
sourcing oranges from MPCs. This suggests that promotion and networking could
be areas for policy such that relationships are established between European buyers
and exporters. Incentivising the use of trade fairs for exporters could be a start to
this process.
The material flow indicated that many of the wasteful activities were a direct
result of poor coordination between actors which could be tackled through col-
lective organizations, directing the flow of goods in a timely and cost-efficient
manner. The interviews supported these findings where a lack of information flow
and poor relationships were concurrent with the lack of effective horizontal orga-
nization. Fragmented farms also make it difficult to apply quality systems and
disseminate market information (Roy and Thorat 2008).
Based on a New Institutional Economics perspective (North 1990), it is gener-
ally understood that horizontal cooperation in developing countries reduces the
transaction costs between suppliers and buyers. A supportive policy structure that
incentivizes the development and effective management of collective organizations
8 From Value Chain Analysis to Global Value Chain Analysis … 213
was recommended by key informants such that coordination problems which cause
wasteful activities along the value chain can be tackled. External costs are also
incurred to the sector as a whole when one firm fails in this regard. Spanish buyers
suggested that there is a ‘contagion effect’ such that all the exporters from
respective countries were tarred with the same brush when just one exporter failed.
In Morocco, the Autonomous Establishment of Export Control and Coordination
represents a public institution dedicated to regulatory compliance for food exports
and plays a role in coordinating export activity (EACCE 2011). This kind of public
sector support in the Moroccan context could at least provide a model which other
MPCs can follow.
8.7 Conclusion
In this chapter, we have demonstrated how GVCA can make an important con-
tribution when it comes to the issues facing MPCs and the wider agricultural policy-
making in the region. Previous ideas on competitiveness in the agri-food sector of
MPCs have primarily been approached through a neo-classical lens, based on
liberalizing markets and productivity (Lindberg et al. 2006). While we do not
dismiss this as a perspective, particularly given the multitude and sometimes
conflicting objectives for agricultural policy, a strategy of driving down costs may
not be beneficial from a value creation point of view, particularly given the poor
state of its value-added agriculture compared to other developing countries
(Binswanger-Mkhize and McCalla 2010). It appears evident that up until now,
agricultural policy has had little success in tackling the serious economic challenges
facing the region (Baldacci et al. 2008).
Prior to this chapter, using a value-stream method such as that proposed by
Taylor (2005) was confined to the SCM literature and had not been used to inform
policy at the macro-level, arguably because it was restricted to a single-chain case
study methodology. Furthermore, using comparable value chain concepts from the
SCM literature have only more recently been transferred to a developing country
context (Adhikari et al. 2012). To achieve the end of informing policy, the meth-
odology was adapted from a single case study chain method with a small number of
participants and a narrowly defined value stream to a sectoral level of analysis
analogous to the Global Value Chain literature but conceptually closer to the SCM
stream, such that broader generalizations could be made about the fresh orange
industry. Policy recommendations resulting from the GVCA and key informant data
can be summarized as follows:
• It facilitates the dissemination of market information made available to value
chain stakeholders. The creation of information networks such as a national
database or training workshops would allow consumer research to be capitalized
on and negate misconceived ideas of what European consumers regard as
important;
214 C. Sausman et al.
• Given that the main barrier of European buyers in sourcing from MPCs was the
lack of known contacts, policy contributes through investing in export promo-
tional campaigns and facilitating networking opportunities, for example funding
participation in international trade fairs.
• It provides incentives for investment in those activities that add value to the final
consumer, namely: variety selection and substitution where necessary, irrigation
systems and methods, and quality cold-controlled transportation.
• Activities that do not add value but are necessary to bring fresh oranges to
market are fundamental to enabling access to European markets. Most notably,
this includes quality and safety systems along the chain. Stages and activities
where policy support could intervene and thereby provide access to the market
for stakeholders are: certified rootstocks and fertilization, quality control during
post-harvest treatment, and controlled environment storage technology. Not
only are these elements necessary, but they were also brought up by European
buyers as being a barrier to sourcing from MPCs.
• The elimination of wasteful activities was identified as a problem of poor
coordination along the chain. This could be tackled through policy that provides
greater support to collective organizations, therefore enabling better coordina-
tion along the chain.
While the methodology proposed here has enabled policy recommendations that
are value-centric, it also comes with limitations. This was the first time that the
single chain method, where the target market can be identified easily, has been
shifted to an aggregated sector-level chain. With this methodological shift it was
difficult to identify the target market because different individual chains serve
different markets (high income vs. low income, price vs. quality, pensioners vs.
single mother families, university education vs. school leavers etc.).
The heterogeneity of chain structures, not just between case study countries but
within them as well, provides a challenge to aggregating the results into a single map
of the chain. The basic problem that emerges from this is one of comparing ‘apples
and oranges’, where a global map is constructed with vertically integrated and highly
fragmented chains. Within the survey, stakeholders were asked to identify who their
customers are. From this a diversity of structures emerged. For instance, in the
Moroccan sample, the customer base of growers were almost evenly split between
citrus packers, citrus exporters, citrus grower-packers, citrus packer-exporters, fully
integrated citrus grower-packer-exporters and non-citrus specific customers.
In addition to the above methodological limitations, the policy recommendations
proposed here are broad and do not go into specific policy initiatives in significant
detail. What was touched upon however was the way that current initiatives such as
Morocco’s Green Plan and Egypt’s Sustainable Agriculture Development Program
may have an impact on consumer value, although not intentionally, especially with
regard to the development of irrigation infrastructure. Further research that assesses
individual policy initiatives based on their ability to contribute towards creating
consumer value would be beneficial in furthering value chain thinking as a
framework for evaluating policy.
8 From Value Chain Analysis to Global Value Chain Analysis … 215
Appendix 1
See Fig. 8.2.
Appendix 2
See Fig. 8.3.
Fig. 8.2 Differences in importance attached to orange attributes based on consumers’ country ofresidence. Attributes presented passed test of significance (2-tailed) if below 0.05, and test ofhomogeneity of variance
Fig. 8.3 Impact of gender on the importance attached to orange attributes. Attributes presentedpassed test of significance (2-tailed) if below 0.05
216 C. Sausman et al.
Appendix 3
See Fig. 8.4.
Fig. 8.4 Impact of age on the importance attached to orange attributes. Attributes presentedpassed test of significance (2-tailed) if below 0.05
8 From Value Chain Analysis to Global Value Chain Analysis … 217
Appendix 4
See Table 8.4.
Table 8.4 Strength ofinformation flow andrelationships in Egypt’s freshorange global value chain(mean score percentagesa)
Citrus input supplier
Information flow 47 %
Customer relationships 65 %
Relationship average (downstream) 67 %
Extension services
Information flow 40 %
Customer relationships 63 %
Relationship average (downstream) 63 %
Growers
Information flow 52 %
Supplier relationships 70 %
Customer relationships 69 %
Relationship average (downstream) 76 %
Packers
Information flow 71 %
Supplier relationships 82 %
Customer relationships 82 %
Relationship average (downstream) 85 %
Logistics
Information flow 81 %
Customer relationships 85 %
Relationship average (downstream) 85 %
Exporters
Information flow 80 %
Supplier relationships 89 %
Customer relationships 90 %
Relationship average (downstream) 90 %a0–33 % = weak, 34–66 % = partial/basic, 67–100 % = strong
218 C. Sausman et al.

Appendix 5
See Table 8.5.
Table 8.5 Strength ofinformation flow andrelationships in Morocco’sfresh orange global valuechain (mean scorepercentagesa)
Citrus input supplier
Information flow 90 %
Customer relationships 88 %
Relationship average (downstream) 81 %
Extension services
Information flow 88 %
Customer relationships 65 %
Relationship average (downstream) 65 %
Growers
Information flow 80 %
Supplier relationships 74 %
Customer relationships 75 %
Relationship average (downstream) 80 %
Packers
Information flow 94 %
Supplier relationships 85 %
Customer relationships 85 %
Relationship average (downstream) 88 %
Logistics
Information flow 82 %
Customer relationships 85 %
Relationship average (downstream) 85 %
Exporters
Information flow 87 %
Supplier relationships 92 %
Customer relationships 89 %
Relationship average (downstream) 89 %a0–33 % = weak, 34–66 % = partial/basic, 67–100 % = strong
8 From Value Chain Analysis to Global Value Chain Analysis … 219
Appendix 6
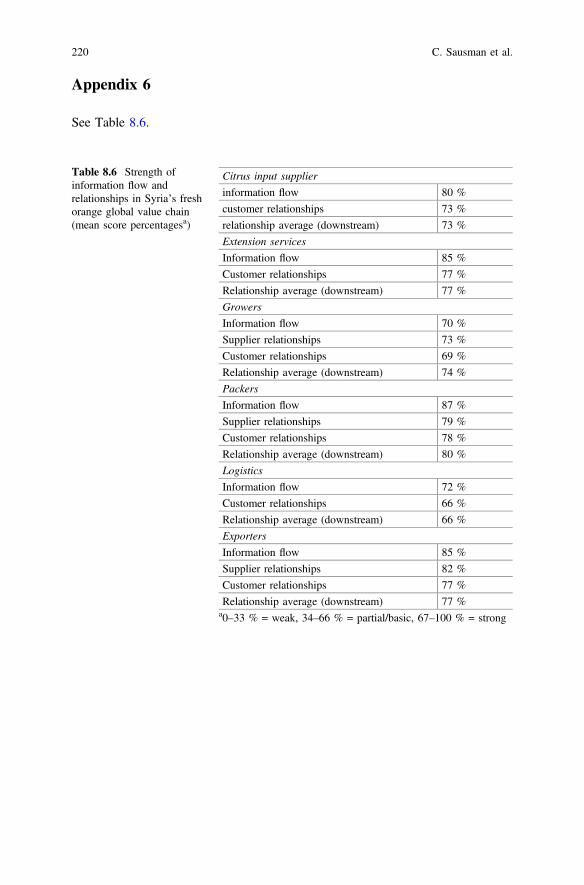
See Table 8.6.
Table 8.6 Strength ofinformation flow andrelationships in Syria’s freshorange global value chain(mean score percentagesa)
Citrus input supplier
information flow 80 %
customer relationships 73 %
relationship average (downstream) 73 %
Extension services
Information flow 85 %
Customer relationships 77 %
Relationship average (downstream) 77 %
Growers
Information flow 70 %
Supplier relationships 73 %
Customer relationships 69 %
Relationship average (downstream) 74 %
Packers
Information flow 87 %
Supplier relationships 79 %
Customer relationships 78 %
Relationship average (downstream) 80 %
Logistics
Information flow 72 %
Customer relationships 66 %
Relationship average (downstream) 66 %
Exporters
Information flow 85 %
Supplier relationships 82 %
Customer relationships 77 %
Relationship average (downstream) 77 %a0–33 % = weak, 34–66 % = partial/basic, 67–100 % = strong
220 C. Sausman et al.
Appendix 7
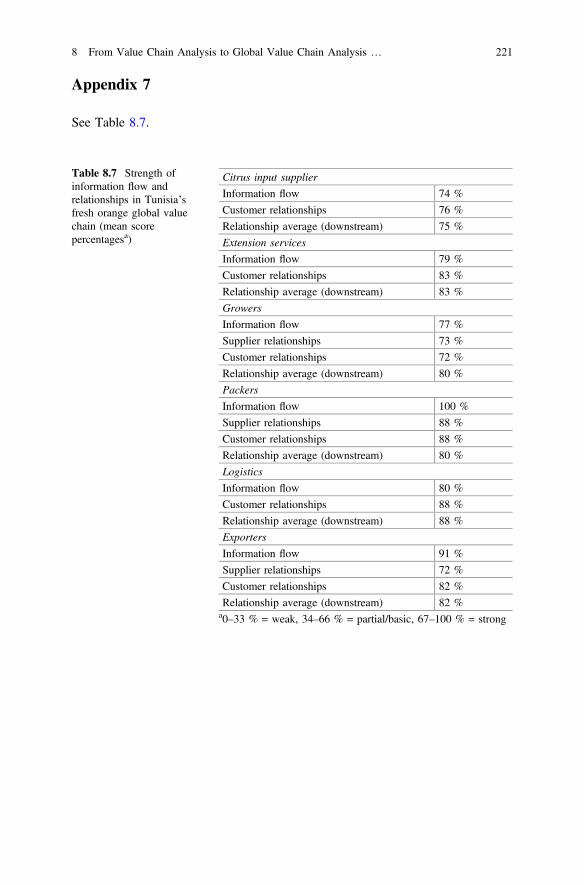
See Table 8.7.
Table 8.7 Strength ofinformation flow andrelationships in Tunisia’sfresh orange global valuechain (mean scorepercentagesa)
Citrus input supplier
Information flow 74 %
Customer relationships 76 %
Relationship average (downstream) 75 %
Extension services
Information flow 79 %
Customer relationships 83 %
Relationship average (downstream) 83 %
Growers
Information flow 77 %
Supplier relationships 73 %
Customer relationships 72 %
Relationship average (downstream) 80 %
Packers
Information flow 100 %
Supplier relationships 88 %
Customer relationships 88 %
Relationship average (downstream) 80 %
Logistics
Information flow 80 %
Customer relationships 88 %
Relationship average (downstream) 88 %
Exporters
Information flow 91 %
Supplier relationships 72 %
Customer relationships 82 %
Relationship average (downstream) 82 %a0–33 % = weak, 34–66 % = partial/basic, 67–100 % = strong
8 From Value Chain Analysis to Global Value Chain Analysis … 221
Appendix 8
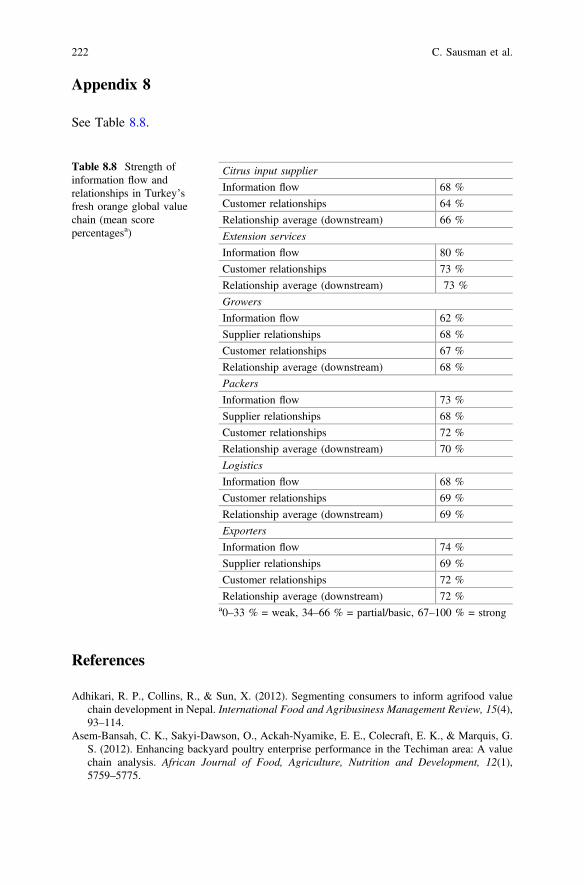
See Table 8.8.
References
Adhikari, R. P., Collins, R., & Sun, X. (2012). Segmenting consumers to inform agrifood valuechain development in Nepal. International Food and Agribusiness Management Review, 15(4),93–114.
Asem-Bansah, C. K., Sakyi-Dawson, O., Ackah-Nyamike, E. E., Colecraft, E. K., & Marquis, G.S. (2012). Enhancing backyard poultry enterprise performance in the Techiman area: A valuechain analysis. African Journal of Food, Agriculture, Nutrition and Development, 12(1),5759–5775.
Table 8.8 Strength ofinformation flow andrelationships in Turkey’sfresh orange global valuechain (mean scorepercentagesa)
Citrus input supplier
Information flow 68 %
Customer relationships 64 %
Relationship average (downstream) 66 %
Extension services
Information flow 80 %
Customer relationships 73 %
Relationship average (downstream) 73 %
Growers
Information flow 62 %
Supplier relationships 68 %
Customer relationships 67 %
Relationship average (downstream) 68 %
Packers
Information flow 73 %
Supplier relationships 68 %
Customer relationships 72 %
Relationship average (downstream) 70 %
Logistics
Information flow 68 %
Customer relationships 69 %
Relationship average (downstream) 69 %
Exporters
Information flow 74 %
Supplier relationships 69 %
Customer relationships 72 %
Relationship average (downstream) 72 %a0–33 % = weak, 34–66 % = partial/basic, 67–100 % = strong
222 C. Sausman et al.
Baldacci, E., Benedict, C., Sanjeev, G., & Qiang, C. (2008). Social spending, human capital, andgrowth in developing countries. World Development, 36(8), 1317–1341.
Binswanger-Mkhize, H., & McCalla, A. F. (2010). The changing context and prospects foragricultural and rural development in Africa. In R. Evenson & P. Pingali (Eds.), Handbook ofagricultural economics (Vol. 4, pp. 3591–3712). Amsterdam: Elsevier/North-Holland.
Bonney, L., Clark, R., Collins, R., & Fearne, A. (2007). From serendipity to sustainablecompetitive advantage: Insights from Houston’s Farm and their journey of co-innovation.Supply Chain Management: An International Journal, 12(6), 395–399.
Bonney, L., Clark, L., Collins, R., & Fearne, A. (2008). Value chain innovation: A diagnostic
assessment of opportunities for market development and process improvement in the Coles-
Simplot frozen vegetable value chain. The University of Queensland, Australia: TasmanianInstitute of Agricultural Research.
Campbell, R. (2008) Briefing paper: Key elements of the value chain approach. US aid/
accelerated microenterprise advancement project. [Online]. http://bit.ly/laDjrG. Accessed 27June 2012.
Carson, S. J., Madhok, A., Varman, R., & John, G. (2003). Information processing moderators ofthe effectiveness of trust-based governance in interfirm R&D collaboration. Organization
Science, 14(1), 45–56.Christopher, M. (2011). Logistics and supply chain management (4th ed.). Dorchester: Pearson
Education Limited.Christopher, M., & Juttner, U. (2000). Supply chain relationships: Making the transition to closer
integration. International Journal of Logistics: Research and Applications, 3(1), 5–23.Collins, R. (2009). Value chain management and postharvest handling: Partners in competitive-
ness. In W. J. Florkowski, R. L. Shewfelt, B. Brueckner, & S. E. Prussia (Eds.), Postharvesthandling: A systems approach. San Diego, CA: Elsevier.
Cousins, P. D., & Menguc, B. (2006). The implications of socialization and integration in supplychain management. Journal of Operations Management, 24(5), 604–620.
Cruickshank, J. A. (2009). A play for rurality—Modernization versus local autonomy. Journal ofRural Studies, 25(1), 98–107.
Davis, J. H., & Goldberg, R. (1957). A concept of agribusiness. Cambridge, MA: HarvardUniversity Press.
Delbufalo, E. (2012). Outcomes of inter-organizational trust in supply chain relationships: Asystematic literature review and a meta-analysis of the empirical evidence. Supply Chain
Management: An International Journal, 17(4), 377–402.Drucker, P. F. (1999). Management challenges for the 21st century. Cambridge, MA: Harper
Business School Press.Dyer, J. H., & Singhe, H. (1998). The relational view: Cooperative strategy and sources of
interorganizational competitive advantage. Academy of Management Review, 23(4), 660–679.Etablissement Autonome de Contrôle et de Coordination des Exportations (EACCE). (2011).
http://web2.eacce.org.ma. Accessed 27 June 2012.FAO. (2013). FAO statistics. [Online]. http://faostat.fao.org. Accessed 20 December 2013.Fearne, A., Garcia Martinez, M., & Dent, B. (2012). Dimensions of sustainable value chains:
Implications for value chain analysis. Supply Chain Management: An International Journal, 17
(6), 575–581.Fearne, A. (2009). Sustainable food and wine value chains. Australia: Government of South
Australia.Felgate, M. K., Fearne, A., & DiFalco, S. (2011). Analysing the impact of supermarket
promotions: A case study using Tesco Clubcard Data in the UK. In Kent business school
working paper series (No. 234).Canterbury: Kent Business School.Francis, M. (2000). Mapping information flows. In P. Hines (Ed.), Value stream management
(pp. 53–68). London: Pearson Education.Gereffi, G. (1999). International trade and industrial upgrading in the apparel commodity chain.
Journal of International Economics, 48(1), 37–70.
8 From Value Chain Analysis to Global Value Chain Analysis … 223
Gereffi, G., Humphrey, J., & Sturgeon, T. J. (2005). The governance of global value chains.Review of International Political Economy, 12(1), 78–104.
Handfeld, R. B., & Bechtel, C. (2002). The role of trust and relationship structure in improvingsupply chain responsiveness. Industrial Marketing Management, 31(4), 367–382.
Hines, P., & Rich, N. (1997). The seven value stream mapping tools. International Journal ofOperations and Production Management, 7(1), 46–64.
Hodgson, R. W. (1967). Horticultural varieties of citrus. In W. Reuther, J. H. Webber, & L.D. Batchelor (Eds.), The citrus industry. Volume I: History, world distribution, botany, and
varieties. California: University of California.Humphrey, J., & Schmitz, H. (2002). Developing country firms in the world economy:
Governance and upgrading in global value chains. In INEF report. Germany: University ofDuisburg.
Jones, D. T., & Simons, D. (2000). Future directions for the supply side of ECR in ECR in theThird Millennium. In D. Corsten and D.T. Jones (Eds), Academic Perspectives on the Future ofConsumer Goods Industry. Brussels: ECR
Kannana, V. R., & Tanb, K. C. (2005). Just in time, total quality management, and supply chainmanagement: Understanding their linkages and impact on business performance. Omega, 33,153–162.
Kaplinsky, R. (2000). Is globalisation all it is cracked up to be? Journal of International PoliticalEconomy, 7(5), 1–21.
Kaplinsky, R., & Morris, M. (2002). A handbook for value chain research. Brighton: Institute ofDevelopment Studies.
Li, S., Ragu-Nathan, B., Ragu-Nathan, T. S., & Rao, S. S. (2006). The impact of supply chainmanagement practices on competitive advantage and organizational performance. Omega, 34(2), 107–124.
Lindberg, E., Nilsson, O. L. F., & Surry, Y. (2006). National agricultural policies synthesis report.Working paper, MEDFROL project.
Lindic, J., & da Silva, C. M. (2011). Value proposition as a catalyst for a customer focusedinnovation. Management Decision, 49(10), 1694–1708.
Marsden, T., Banks, J., Renting, H., & Van Der Ploeg, J. D. (2001). The road towards sustainablerural development: Issues of theory, policy and research practice. Journal of EnvironmentalPolicy and Planning, 3(2), 75–83.
McGuffog, T., & Wadsley, N. (1999). The general principles of value chain management. SupplyChain Management: An International Journal, 4(5), 218–225.
Mili, S., & Martínez, C. (2012). Sourcing agricultural produce from MPCs and Turkey into the
EU: A buyer market research in Spain. Working paper, Spanish National Research Council.Montgomery, S. (2009). Crop production in the mediterranean partner countries continues to
increase. In Agriculture and fisheries. Luxembourg: Eurostat.Nabli, M. K. (2004). Jobs, growth and governance in the middle east and north Africa.
Washington, DC: The World Bank.North, D. C. (1990). Institutions, institutional change and economic performance. Cambridge:
Cambridge University Press.Porter, M. E. (1990). The competitive advantage of nations. New York: Free Press.Rieple, A., & Singh, R. (2010). A value chain analysis of the organic cotton industry: The case
retailers and Indian suppliers. Ecological Economics, 69, 2292–2302.Roy, D., & Thorat, A. (2008). Success in high value horticultural export markets for the small
farmers: The case of Mahagrapes in India. World Development, 36(10), 1874–1890.Schmitz, H. (2005). Value chain analysis for policy-makers and practitioners. Geneva:
International Labor Organization.Simons, D., Francis, M., & Fearne, A. (2003). Identifying the determinants of value in the U.K. red
meat industry: A value chain analysis approach. Journal on Chain and Network, Science, 3(2),109–121.
224 C. Sausman et al.
Slater, S. S., & Narver, J. C. (1992). Superior customer value and business performance: The
strong evidence for a market-driven culture. Working paper No. 92–125, Marketing ScienceInstitute, Cambridge, MA.
Slywotzky, A. J., & Morrison, D. J. (1997). The profit zone. New York: Wiley.Soosay, C., Fearne, A., & Dent, B. (2012). Sustainable value chain analysis—A case study of
Oxford landing from “vine to dine”. Supply Chain Management: An International Journal, 17
(1), 68–77.Taylor, D. H. (2005). Supply chain analysis: An approach to value chain improvement in agri-food
chains. The International Journal of Physical Distribution and Logistics Management, 35(10),744–761.
Trienekens, J. H. (2011). Agricultural value chains in developing countries: A framework foranalysis. International Food and Agribusiness Management Review, 14(2), 51–82.
Walters, D., & Lancaster, G. (2000). Implementing value strategy through the value chain.Management Decision, 38(3), 160–178.
Womack, J., & Jones, D. (1994). From lean production to the lean enterprise. Harvard Business
Review, 72, 93–103.World Bank. (2008). Agriculture and rural development in MENA. Washington, DC: World Bank.World Bank. (2012). Food price hike drives 44 million people into poverty. [Online]. http://tinyurl.
com/4wzbyac. Accessed 27 June 2012.Zaheer, A., McEvily, B., & Perrone, V. (1998). Does trust matter? Exploring the effects of
interorganizational and interpersonal trust on performance. Organization Science, 9(2),141–159.
8 From Value Chain Analysis to Global Value Chain Analysis … 225


