
From forest to cropland and pasture systems: a criticalreview of soil organic carbon stocks changes in Amazonia
KEN J I FU J I SAK I 1 , 2 , ANNE - SOPH IE PERR IN 1 , TH IERRY DES JARD INS 3 , MART IAL
BERNOUX 2 , LU IZ CARLOS BALB INO 4 and MICHEL BROSSARD2
1Centre Technique Interprofessionnel des Ol�eagineux et du Chanvre (CETIOM), Etablissement Public Local d’Enseignement et de
Formation Professionnelle Agricole (EPLEFPA) de la Guyane, Savane Matiti, BP 53, 97 355, Macouria, Guyane franc�aise, France,2IRD (Institut de Recherche pour le D�eveloppement), UMR 210 Eco&Sols, Campus SupAgro, bat. 12, 2 place Viala, 34060
Montpellier Cedex 02, France, 3IRD (Institut de Recherche pour le D�eveloppement), UMR 242 iEES Paris, 32 av. H. Varagnat,
93143 Bondy Cedex, France, 4EMBRAPA Cerrados, Cx Postal 08223, CEP 73310-970, Planaltina, DF, Brazil
Abstract
The impact of deforestation on soil organic carbon (SOC) stocks is important in the context of climate change and
agricultural soil use. Trends of SOC stock changes after agroecosystem establishment vary according to the spatial
scale considered, and factors explaining these trends may differ sometimes according to meta-analyses. We have
reviewed the knowledge about changes in SOC stocks in Amazonia after the establishment of pasture or cropland,
sought relationships between observed changes and soil, climatic variables and management practices, and synthe-
sized the d13C measured in pastures. Our dataset consisted of 21 studies mostly synchronic, across 52 sites (Brazil,
Colombia, French Guiana, Suriname), totalling 70 forest–agroecosystem comparisons. We found that pastures
(n = 52, mean age = 17.6 years) had slightly higher SOC stocks than forest (+6.8 � 3.1 %), whereas croplands (n = 18,
mean age = 8.7 years) had lower SOC stocks than forest (�8.5 � 2.9 %). Annual precipitation and SOC stocks under
forest had no effect on the SOC changes in the agroecosystems. For croplands, we found a lower SOC loss than other
meta-analyses, but the short time period after deforestation here could have reduced this loss. There was no clear
effect of tillage on the SOC response. Management of pastures, whether they were degraded/nominal/improved,
had no significant effect on SOC response. d13C measurements on 16 pasture chronosequences showed that decay of
forest-derived SOC was variable, whereas pasture-derived SOC was less so and was characterized by an accumula-
tion plateau of 20 Mg SOC ha�1 after 20 years. The large uncertainties in SOC response observed could be derived
from the chronosequence approach, sensitive to natural soil variability and to human management practices. This
study emphasizes the need for diachronic and long-term studies, associated with better knowledge of agroecosystem
management.
Keywords: annual crop, carbon storage, chronosequence, deforestation, grassland, humid tropics, rainforest, soil organic matter,
soil tillage, d13C
Received 20 September 2014 and accepted 5 January 2015
Introduction
The greenhouse gases (GHG) emissions associated with
tropical land-use change were 1.1 � 0.7 for the 2000–2007 period and are approximately equal to the total
global land-use change emissions because carbon bal-
ance of land-use changes in temperate and boreal bio-
mes is roughly neutral (Pan et al., 2011). Tropical
deforestation is the largest contributor to these emis-
sions. Biomass burning is the main source of CO2 emis-
sions following deforestation, but deforestation also
perturbs the soil carbon cycle, which is likely to cause a
decrease in SOC stocks due to a decrease in carbon
inputs to the soil (Lal et al., 1997; Smith, 2008), and to
increased mineralization rates after crop establishment
(e.g. Balesdent et al., 1998), However, there is large
uncertainty about the fate of soil organic carbon after
deforestation in tropical regions (Penman et al., 2003;
Grace et al., 2014).
The Amazonian biome is an evergreen rainforest, lar-
gely conserved, which covers about 5.3 million km²(Eva et al., 2005), and represents about 40% of the
world’s remaining tropical rainforest. This biome has
been stable for millennia, although it experienced dry
periods during the Holocene which transformed theCorrespondence: Michel Brossard, tel. +33 499613080, fax +33 4 99
61 21 19, e-mail: [email protected]
2773© 2015 John Wiley & Sons Ltd
Global Change Biology (2015) 21, 2773–2786, doi: 10.1111/gcb.12906
forest into savannah at its periphery (Soubi�es, 1979;
Desjardins et al., 1996; Freitas et al., 2001). The Brazilian
Amazonia represents 75% of the biome and is regarded
as a sink for carbon, which is estimated at +0.30 Gt C
year�1 for the 1980–2004 period (Arag~ao et al., 2014).
However, since the end of 1960’s, large parts of Amazo-
nian forest were cleared and replaced by pasture and
cropland. For Brazilian Amazonia, Nepstad et al. (2009)
estimated that the deforestation rate between 1996 and
2005 was 19 500 km² yr�1, releasing 0.38 Gt C yr�1 to
the atmosphere. However, the deforestation rate
decreased from 2004 and was less than 6 000 km² yr�1
in 2013, thanks to policies aimed at reducing deforesta-
tion (Nepstad et al., 2014).
Besides the critical importance of SOC dynamics in
anthropogenic greenhouse gas emissions, the organic
matter in tropical soils plays a major role in main-
taining soil properties. A drastic decline in soil
organic matter can degrade soil structure, lead to
erosion and reduce agricultural productivity (Stock-
ing, 2003). Deforestation can increase water erosion
rates via the degradation of soil structure (Grimaldi
et al., 2003), exporting SOC from fields and depleting
the soil (Don et al., 2011). Apart from its effect on
soils, deforestation in Amazonia causes major envi-
ronmental disturbances: loss of biodiversity (Dale
et al., 1994), habitat fragmentation (Skole & Tucker,
1993), emissions of C, N and S compounds into the
atmosphere during forest fires (Fabian et al., 2005),
disruption of the natural cycle of mercury (B�eliveau
et al., 2009) and alteration of sediment transport in
rivers (Farella et al., 2001). On a global scale, Amazon
deforestation induces climate change, with a decrease
in rainfall, increased insolation and changes in the
hydrological cycle by reducing tree transpiration
(Malhi et al., 2008).
In this context of global (climate change, land-use
change, food security) and local (soil conservation at
the field and watershed scales) challenges, it is crucial
to understand the SOC storage dynamics associated
with deforestation and agroecosystem establishment.
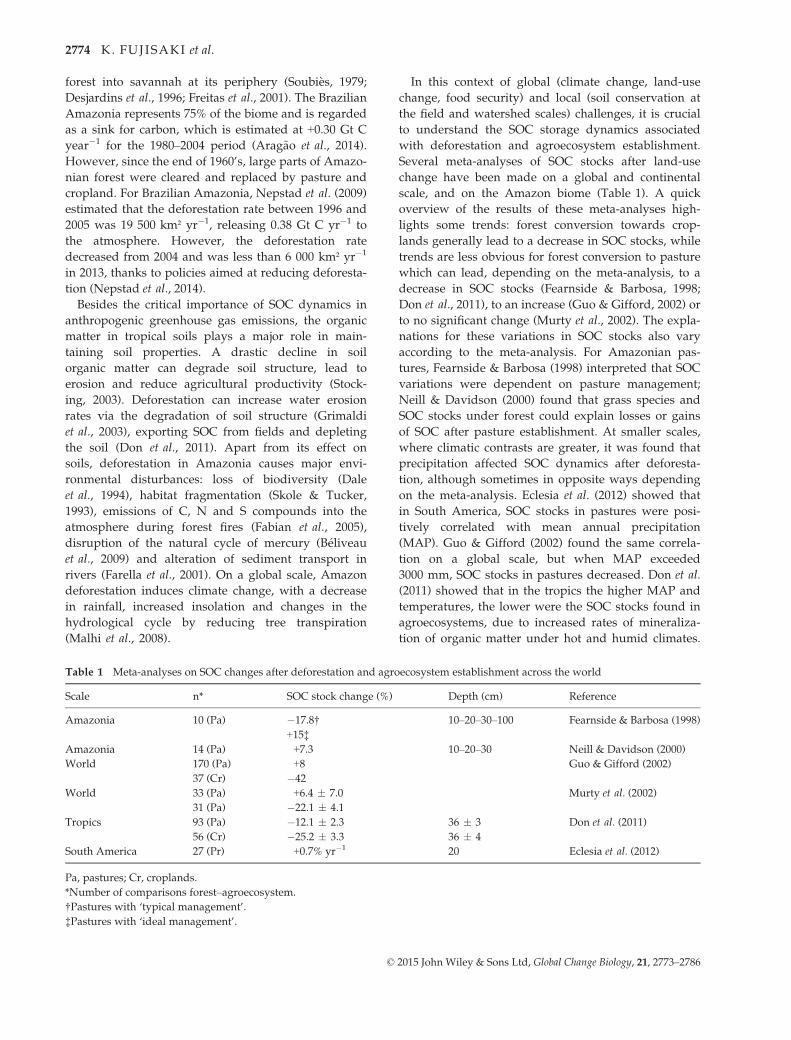
Several meta-analyses of SOC stocks after land-use
change have been made on a global and continental
scale, and on the Amazon biome (Table 1). A quick
overview of the results of these meta-analyses high-
lights some trends: forest conversion towards crop-
lands generally lead to a decrease in SOC stocks, while
trends are less obvious for forest conversion to pasture
which can lead, depending on the meta-analysis, to a
decrease in SOC stocks (Fearnside & Barbosa, 1998;
Don et al., 2011), to an increase (Guo & Gifford, 2002) or
to no significant change (Murty et al., 2002). The expla-
nations for these variations in SOC stocks also vary
according to the meta-analysis. For Amazonian pas-
tures, Fearnside & Barbosa (1998) interpreted that SOC
variations were dependent on pasture management;
Neill & Davidson (2000) found that grass species and
SOC stocks under forest could explain losses or gains
of SOC after pasture establishment. At smaller scales,
where climatic contrasts are greater, it was found that
precipitation affected SOC dynamics after deforesta-
tion, although sometimes in opposite ways depending
on the meta-analysis. Eclesia et al. (2012) showed that
in South America, SOC stocks in pastures were posi-
tively correlated with mean annual precipitation
(MAP). Guo & Gifford (2002) found the same correla-
tion on a global scale, but when MAP exceeded
3000 mm, SOC stocks in pastures decreased. Don et al.
(2011) showed that in the tropics the higher MAP and
temperatures, the lower were the SOC stocks found in
agroecosystems, due to increased rates of mineraliza-
tion of organic matter under hot and humid climates.
Table 1 Meta-analyses on SOC changes after deforestation and agroecosystem establishment across the world
Scale n* SOC stock change (%) Depth (cm) Reference
Amazonia 10 (Pa) �17.8†
+15‡10–20–30–100 Fearnside & Barbosa (1998)
Amazonia 14 (Pa) +7.3 10–20–30 Neill & Davidson (2000)
World 170 (Pa)
37 (Cr)
+8�42
Guo & Gifford (2002)
World 33 (Pa)
31 (Pa)
+6.4 � 7.0
�22.1 � 4.1
Murty et al. (2002)
Tropics 93 (Pa)
56 (Cr)
�12.1 � 2.3
�25.2 � 3.3
36 � 3
36 � 4
Don et al. (2011)
South America 27 (Pr) +0.7% yr�1 20 Eclesia et al. (2012)
Pa, pastures; Cr, croplands.
*Number of comparisons forest–agroecosystem.
†Pastures with ‘typical management’.
‡Pastures with ‘ideal management’.
© 2015 John Wiley & Sons Ltd, Global Change Biology, 21, 2773–2786
2774 K. FUJISAKI et al.

Clay content of the soil does not explain SOC variation
after deforestation (Neill & Davidson, 2000; Don et al.,
2011).
It seemed relevant here to update the state of knowl-
edge on the fate of SOC stocks across the Amazon
biome, for several reasons: (i) from the late 2000s a sig-
nificant number of forest–agroecosystem comparisons
have been published, including forest conversion to
cropland (e.g. Maia et al., 2010). Croplands were absent
from the meta-analyses published by Fearnside & Barb-
osa (1998) and Neill & Davidson (2000) since deforesta-
tion at that time in Amazonia aimed to establish mostly
cattle pasture; (ii) to our knowledge, no recent study
has synthesized the d13C data measured in many Ama-
zonian pastures, which are a useful tool for analysing
the SOC dynamics, able to distinguish carbon derived
from forest or from pasture; (iii) trends in, and reasons
for, SOC variations after deforestation vary depending
on the geographical scale (biome, continent, tropical
areas around the world). This being so, a focus on the
Amazon biome is valuable for two reasons. Firstly, this
biome is characterized by a mean temperature with lit-
tle spatial and annual variation, between 24 and 26 °C,but spatial patterns of precipitation are more variable
(Nobre et al., 2009). This offers the opportunity to test
the effect of annual precipitation on SOC variations
after deforestation, rather than the global effect of cli-
mate characteristics. Secondly, despite of the variability
of soil properties in Amazonia (Quesada et al., 2011),
studies dealing with SOC after deforestation were
made mostly on ferralsols and acrisols, deeply weath-
ered soils all with low-activity clays. In contrast, in the
whole humid tropics, this kind of study was made on a
wider range of soils (see the review of Don et al., 2011),
which could obscure the explanation of observed
trends.
In this way, we analysed all the studies available in
Amazonia where forest was replaced by an agroecosys-
tem to:
1 determine whether any soil/climatic factors and/or
agroecosystem management influenced SOC stocks
variations after deforestation;
2 identify the main sources of uncertainties associated
with SOC variations after deforestation; and
3 discuss the methodological implications for future
research.
Materials and methods
The Amazon biome
The Amazon biome can be defined on ecological, climatic,
topographic or hydrographic criteria. We chose those selected
by Eva et al. (2005) and Cerri et al. (2006) and considered the
studies conducted in the lowland Amazon Basin rainforest
(Amazon and Tocantins basins, Guiana shield and Gurup�ı
region). This area is formally denominated as the ‘Entire Ama-
zon lowland rainforest biome’. We excluded rainforest located
above 800 m and also the southern part of the Brazilian Legal
Amazon, covered by savannah (Cerrado biome). According to
the Koppen–Geiger system (Peel et al., 2007), the climate sub-
types in our regional selection are Af (no dry season), Aw
(with dry season) and Am (monsoon type).
On this scale, typology and soil properties are dependent
on the geological context and the climate (Quesada et al.,
2011). Many geological features structure the pedological con-
text: the Guianan and Brazilian shields in the north and the
south of the region, composed of Precambrian plutonic and/
or metamorphosed acid rocks, the centre basin, with sedimen-
tary tertiary deposits resulting from the erosion of the shields,
and the west sedimentary deposits formed after Andean oro-
genesis. The hydrolysis of primary silicate minerals induces
the formation of soil with a clay fraction dominated by kaoli-
nite and iron and aluminium hydroxides. The deep geochemi-
cal weathering induces soil acidity (pH < 5); there are no
carbonate deposits, and the cation exchange capacity is gener-
ally less than 20 cmol kg�1 (Gardi et al., 2014). The soils
mostly have a clayey (> 60% of clay), sandy clay (< 40% of
clay) or a sandy texture, the silt fraction only being found in
the young sedimentary deposits. The main soil classes are Ac-
risols and Ferralsols (IUSS Working Group, 2007), with a few
Podzols, Plinthosols and Alisols. Acrisols (Ultisols in the
American taxonomy, Argissolos in the Brazilian taxonomy)
are mainly observed on the Guianan and Brazilian shields and
in the Andean piedmont. Ferralsols (Oxisols in the American
Taxonomy, Latossolos in the Brazilian Taxonomy) are on the
shields and in central Amazonia; they are deep, exhibit diffuse
boundaries between horizons, and primary minerals are
totally weathered. Plinthosols associated with Alisols are
observed in the fluviatile deposits. Podzols are found in the
north of the basin, their genesis being associated with the
sandy sediments derived from the Palaeozoic Era (Horbe
et al., 2004) and with lateral drainage (Do Nascimento et al.,
2004), inducing a progressive transformation of the lateritic
mantle (Fritsch et al., 2011). In regions dominated by inten-
sively weathered soils, Ferralsols, Acrisols and Podzols, the
surface waters are acid and black, due to dissolved organic
matter associated with iron forms exported from the soil man-
tle (Bardy et al., 2011; Fritsch et al., 2011). Conversely, in the
upper basin, white waters are dominant, indicating transport
in suspension of fine minerals eroded from the Andean slopes.
In this case, the exported carbon is partly associated with the
clays (P�erez et al., 2011; Bouchez et al., 2014).
Selection of data
We selected studies within the Amazon biome that met fol-
lowing criteria:
1 They should measure SOC stocks after deforestation and
pasture or cropland (annual crops) establishment. We nei-
ther considered the shifting cultivation systems, practiced
© 2015 John Wiley & Sons Ltd, Global Change Biology, 21, 2773–2786
SOIL CARBON AFTER DEFORESTATION 2775

by Indigenous population and characterized by multidecen-
nial cycles of cultivation and secondary forest (Nepstad
et al., 2009), nor agroforestry systems (oil palm, pepper,
etc.);
2 If SOC stock data were not available, they could be calcu-
lated from SOC content and bulk density (e.g. Janssen &
Wienk, 1990). SOC stock could then be expressed for the
forest and the agroecosystem on an equivalent mass basis
(Ellert et al., 2007), to take account of the change in soil bulk
density after deforestation (Grimaldi et al., 1993; Alegre &
Cassel, 1996; Don et al., 2011). If this correction was not per-
formed in the original paper, we recalculated SOC stocks in
the agroecosystem from the raw data, or considered the cor-
rected SOC stocks calculated by Fearnside & Barbosa (1998)
for some chronosequences;
3 Sampling depth should be at least 20 cm;
4 Surface topography should be relatively flat, to avoid the
effect of lateral redistribution of soil;
5 Soil sampling should be performed at least 3 years after
deforestation. If several ages were sampled for a specific
forest–agroecosystem comparison, we chose the oldest sam-
pling date and discarded the other sampling dates to avoid
an over-representation of studies where soil were fre-
quently sampled over time. Some studies were carried out
on the same experimental site, for instance the pastures of
Fazenda Nova Vida, in Rondonia (Brazil) (de Moraes et al.,
1996; Neill et al., 1997; Cerri et al., 2003, 2004; Lisboa et al.,
2009). For this experiment, we selected the data from Neill
et al. (1997) because other more recent studies were dealing
with a sampling depth of 20 cm, whereas Neill et al. (1997)
sampled soils down to 30 cm depth.
Additional data were compiled: the soil type, clay content
when mentioned, mean annual precipitation (MAP) when
mentioned and indications on management practices. For sites
where MAP was lacking, we used the WMO data (World
Meteorological Organization; http://www.agteca.com/Pro-
jects/Climate/) and chose the data from the nearest station
from the site.
The database
We listed 21 studies made since 1976 meeting our criteria,
located over 52 sites in the Amazon biome, of which 49 were
located in the Brazilian Amazon (Table 2). This dataset
included 70 forest–agroecosystem comparisons, of which 52
are forest–pasture comparisons and 18 are forest–annual cropcomparisons. There were 4 comparisons with other types of
agroecosystems such as fallows or mixed crop/pasture sys-
tems, which were not analysed here because they were too
poorly represented. Until the mid-2000s, pastures were the
most studied system; in the late 2000s, a noteworthy number
of forest–cropland comparisons have been published, particu-
larly from the work of Maia et al. (2010) in south-western
Amazonia. Pastures were exclusively grazed by cattle except
the one studied by Perrin et al. (2014) that was mowed.
Annual crops were mainly corn, soybean, cassava and rice. In
the majority of compiled studies, deforestation used burning
after manual or mechanized cutting of the vegetation. In
Davidson et al. (2008) and Perrin et al. (2014), the sites were
deforested without using fire.
Among the 20 studies compiled in this paper, 18 studies
were chronosequences (synchronic approach), that is carbon
stocks were measured in an agroecosystem whose age was
known, and compared to a reference state (here the forest),
assuming that the initial conditions (nature and properties of
soils) were similar for the forest and the paired agroecosystem.
Three studies used a diachronic approach, where stocks were
measured on different dates in a single site, before and after
deforestation: Janssen & Wienk (1990) in Surinam, Davidson
et al. (2008) in Par�a (Brazil) and Perrin et al. (2014) in French
Guiana.
Soils of compiled studies were mainly Ferralsols (n = 33
sites) and/or Acrisols (n = 14). Few comparisons concerned
soils less present in Amazonia: Maia et al. (2009) studied two
sites in Mato Grosso where soils had high-activity clays and
Melo (2003) studied Lixisols/Luvisols in Acre.
Management practices
For pastures and croplands, we analysed management factors
recorded in our dataset.
For pastures, many classifications of management types
have been proposed. We used the classification of Maia et al.
(2009): the pasture was considered as (i) degraded in the case
of drastic decrease in grass productivity due to overgrazing,
invasion by weeds, and/or soil erosion; (ii) nominal for pas-
tures with moderate grazing pressure (<1.5 cattle ha�1) induc-
ing a reasonable grass productivity, but not fertilized or
limed; and (iii) improved if grazing pressure was moderate,
and improved by fertilization, liming or planting of produc-
tive grasses. Pastures characterized as ‘well managed’ in Cerri
et al. (2007) were considered by Maia et al. (2009) as ‘nominal’
as they were not fertilized. It was sometimes difficult to estab-
lish the class of pasture management from the information
provided in the papers. Moreover, in the chronosequence
approach, the uncertainty of knowledge about agroecosystem
management is high. For pastures, we did not analyse the
effect of grass species on SOC dynamics as Neill & Davidson
(2000) did, because this information was not always available.
In addition, in some chronosequences, grasses differed
depending on the age of sampled plots (Koutika et al., 1997)
or several species were present in the same plot (Cerri et al.,
2007).
For croplands, the only management practice that was
mostly but not always mentioned was soil tillage.
d13C data in Amazonian pastures
Experiments on forest conversion to pasture allow the use of
isotope labelling by natural d13C because of the transition from
C3-type vegetation (all tree species) to C4-type vegetation
(pasture grasses) (Cerri et al., 1985; Balesdent et al., 1988).
Thus, it is possible to distinguish over time the soil carbon
proportions derived from forest and from pasture. This
requires the determination of the isotopic ratios of d13C in sev-
eral types of sample: the soil under forest, the soil under
© 2015 John Wiley & Sons Ltd, Global Change Biology, 21, 2773–2786
2776 K. FUJISAKI et al.

pasture, and vegetation or litter of the two systems (Bernoux
et al., 1998). These isotopic methods were used in 16 chronose-
quences in Amazonia with a total of 39 sampling points in
pastures, in 0–20 or 0–30 cm layers. These data were compiled
and analysed to establish trends in the mineralization of for-
est-derived carbon and its substitution by pasture-derived car-
bon. The effect of pasture management on the dynamics of
forest and pasture carbon pools could not be analysed because
among the 16 chronosequences, 14 included nominal pastures,
and degraded pastures were not represented. The proportions
of carbon derived from pasture and forest were not calculated
for each study because all the raw data were not always avail-
able. Thus, the quantities of SOC derived from forest and pas-
ture were extracted from papers as SOC proportions or
absolute SOC stock. For the forest-derived SOC (named C3-
SOC), the percentage of C3-SOC for each date was expressed
in two ways: in relation to the SOC stock which was measured
at time t (C3tx) and in relation to initial SOC stock of forest
(C3t0). In contrast, for pasture-derived SOC (named C4-SOC),
its accumulation over time was expressed as absolute SOC
stock (Mg C ha�1).
Statistical analysis
The change in SOC stock after deforestation was expressed in
Mg C ha�1 (SOCagroecosystem – SOCforest) and in % ([SOCagroeco-
system – SOCforest ]/SOCforest). We modelled the SOC change (%)
separately for pastures (n = 52) and croplands (n = 18) with
multiple linear regressions models, taking as independent
variables the age of the agroecosystem, the MAP and the ini-
tial SOC stock under forest. The number of dry months and
the clay content of soils were not included in the analysis
because these parameters were too rarely recorded in the com-
piled studies. At the biome scale, annual temperature varies
little (Nobre et al., 2009) so it was not included in the analysis.
We analysed isotopic data in pastures (C3t0-SOC and C4-SOC
variations, n = 16 chronosequences) with the same manner,
but soil clay content could be added to tested parameters as it
Table 2 Amazonian data analysed
Localization
Land
use
Sampling
depth
(cm) n sites
n comp.
†Max.
age (yr)‡n smp.
Fo. §n smp.
Agro.§ SOC ¶Error
** Reference
Par�a* Pa 20 2 2 11 Falesi (1976)
Suriname Cr 20 1 3 12 10 5 Rep. Janssen & Wienk (1990)
Amazonas* Pa 20 1 1 8 3 2 Rep. Cerri et al. (1991)
Par�a* Pa 40 1 1 10 1 1 Desjardins et al. (1994)
Par�a* Pa 100 1 2 23 8 8 Comp. Trumbore et al. (1995)
Par�a* Pa 100 1 1 17 4 4 Comp. Koutika et al. (1997)
Rondonia* Pa 30 7 7 81 4–5 4–5 Rep. X Neill et al. (1997)
Par�a* Cr Fa 40 1 2 10 10 5 Rep. X Fujisaka et al. (1998)
Par�a* Pa 20 1 1 15 3 3 Rep. X Bernoux et al. (1999)
Acre* Pa 100 1 1 20 6 6 Rep. X Melo (2003)
Par�a and
Amazonas*Pa 20 2 2 15 10 10 Comp. Desjardins et al. (2004)
Par�a* Pa 20 4 4 31 4 1–4 Rep. Cerri et al. (2007)
Par�a* Cr Fa 30 1 3 3 2 2 Rep. X Davidson et al. (2008)
Acre* Pa 95 1 1 12 3 3 Rep. Salimon et al. (2009)
Mato Grosso
& Rondonia*Pa 30 13 18 29 5 5 Rep. Maia et al. (2009)
Mato Grosso
& Rondonia*Cr Pa 30 8 8 26 5 5 Rep. Maia et al. (2010)
Mato Grosso
& Rondonia*Cr Pa Mix 30 2 6 15 5 5 Rep. Carvalho et al. (2010)
Colombia Pa 100 1 5 53 16 16 Rep X Mosquera et al. (2012)
Par�a* Pa 20 1 1 15 4 4 Comp. Souza Braz et al. (2013)
Par�a* Pa 30 1 1 55 5 5 Rep. X Fraz~ao et al. (2013)
French Guiana Cr Pa 30 1 3 3 17 24 Rep. X Perrin et al. (2014)
For land use, Pa, pastures; Cr, croplands; Fa, fallows; Mix, mixed pastures/croplands.
*Brazilian state.
†Number of comparisons forest–agroecosystem.
‡Age of the oldest agroecosystem.
§Number of soil samples collected in forest and agroecosystem.
¶SOC stock assessment (Rep. = use of replication, Comp. = analysis of composite samples).
**Mention of error on SOC stock (X = yes).
© 2015 John Wiley & Sons Ltd, Global Change Biology, 21, 2773–2786
SOIL CARBON AFTER DEFORESTATION 2777

was mentioned in all studies dealing with isotopic data. Non-
linear regression was applied to the evolution of C3tx-SOC,
C3t0-SOC and C4-SOC in pastures over time, including all the
sampling points (n = 39). We compared the effect of pasture
management (degraded/nominal/improved) on SOC stock
changes after deforestation with nonparametric test of Krus-
kal–Wallis, as data were non-normal. Statistical analyses were
performed with SigmaPlot version 11.0� for multiple linear
and nonlinear regressions, and with R version 2.15.2 for Krus-
kal–Wallis test.
Results
General trends of SOC stock changes after deforestation
On average, SOC stocks decreased by 8.5 � 2.9 % for
annual crops and increased by 6.8 � 3.1 % for pastures
after deforestation, these values being significantly dif-
ferent from 0 at P < 0.05 (Table 3). This represents an
absolute loss of 4.5 Mg C ha�1 for croplands (age of
deforestation ranging from 3 to 19 years) and a gain of
2.2 Mg C ha�1 for pastures (age of deforestation rang-
ing from 3 to 81 years) in the 0–20/30 cm layer com-
pared to forest. Pastures had more variable responses
than croplands. The mean age of the compiled chrono-
sequences was higher for pastures (17.6 years com-
pared to 8.7 years for croplands).
Effect of soil and climatic factors
Analysis of soil and climatic variables (precipitation,
forest SOC stock), which was performed for pastures
and croplands, shows that these parameters did not
influence the dynamics of SOC after deforestation. Mul-
tiple linear regressions using soil and climatic variables
failed for croplands. For pastures, the time since defor-
estation was a significant factor in the regression
(P = 0.002), but not the other parameters, and the
adjusted R² for the resulting model was only 0.17
(Table 4). The correlation matrices led to the same con-
clusions (data not shown). Losses or gains of SOC in
pastures were not related to mean annual precipitation
(MAP), despite a wide range of precipitation across our
dataset (between 1500 and 3750 mm) (Fig. 1a).
Effect of agroecosystem management
For pastures, the classification of management classes
as degraded/nominal/improved led to the following
results: on average, SOC stock did not change in
degraded pastures (�0.5 � 7.3%, n = 15) and increased
by 9.8 � 4.3% (n = 23) and 11.9 � 4.0% (n = 12) in
nominal and improved pastures (Fig. 2). But we did
not observe any significant difference in the mean SOC
changes between management classes with Kruskal–Wallis test (P = 0.252), and the three management clas-
ses included situations where stocks increased and
decreased (Fig. 2). Across our dataset, the degraded
pastures response to SOC change had the widest dis-
persion.
For croplands, it was difficult to explain SOC varia-
tions due to soil tillage after deforestation. In 14 of 18
comparisons, SOC stocks decreased after deforestation,
but this trend was found for both agricultural practices
(with and without tillage) (Fig. 3). However, after
deforestation, SOC stocks never increased in systems
where the soil was tilled, at least with the croplands of
our dataset.
d13C data in pastures
After deforestation, C3-SOC dynamics expressed in
relation to the total SOC stock at time t was charac-
Table 3 Soil organic carbon stock under forest and agroeco-
systems, and SOC stock changes after deforestation in Amazo-
nia. Means are followed by standard error. For absolute SOC
stocks, n = 18 for croplands and n = 45 for pastures. For SOC
stock changes, n = 18 for croplands and n = 52 for pastures
Forest–Croplands Forest–Pastures
Mean SOC stock, layer 0–20/30 cm (Mg ha�1)
Forest 47.5 � 3.4 40.5 � 2.3
Agroecosystem 43.0 � 3.0 42.7 � 2.4
SOC stock change, all layers (%)
Mean �8.5 � 2.9 +6.8 � 3.1
P value t-test 0.006 0.016
Minimum �32.5 �48.7
1st quartile �17.9 �10.6
3rd quartile �5.1 21.2
Maximum +15.5 +54.8Age (years) 8.7 � 1.2 17.6 � 2.8
Table 4 Multiple linear regressions of SOC stock changes
(%) in pastures (n = 52) and croplands (n = 18) after deforesta-
tion (sampling depth from 20 cm to 100 cm). Parameters are
time since conversion (age), SOC stock found in forest (SOCFo)
and mean annual precipitation (MAP). Values are followed by
standard errors
SOC change Parameter Values P value
Pasture (%) Intercept �20.3 � 12.4 0.11
Age (years) 0.80 � 0.23 0.002
SOCFo (Mg ha�1) 0.12 � 0.18 0.49
MAP (mm) 0.003 � 0.007 0.66
R² adjusted 0.17
Croplands (%) Intercept �5.4 � 25.4 0.83
MAP (mm) 0.005 � 0.01 0.63
Age (years) �0.39 � 0.55 0.49
SOCFo (t ha�1) �0.22 � 0.22 0.34
R² adjusted 0
© 2015 John Wiley & Sons Ltd, Global Change Biology, 21, 2773–2786
2778 K. FUJISAKI et al.

terized, as expected, by a decrease over time
(Fig. 4). This decrease could be fitted to a first-order
exponential decay model, y = Yo exp (-kt) with
k = 0.0267 (R² = 0.29; n = 39), that is a half-life of
26 years. However, if the dynamics of the C3-SOC
is expressed relative to the initial SOC stock in for-
est (the latter is here assumed to be 100% derived
from C3 plants), points do not show a clear trend,
and it was impossible to fit a decay function
(Fig. 5a). In some fields, the C3-SOC stock was even
higher than the initial stock measured under forest.
On the other hand, the accumulation of C4-SOC,
expressed in Mg ha�1, was better organized
(Fig. 5b). An accumulation model with a maximum
was fitted and resulted in a plateau at 19.9 Mg C
ha�1, which is reached after twenty years (R² =0.40).
The analysis of the effect of soil and climatic variables
on the dynamics of C3-SOC and C4-SOC was inconclu-
sive (Table 5). The percentage of C3t0 carbon cannot be
explained by any of the factors tested. On the other
hand, the C4-SOC accumulation is positively correlated
with the age of the chronosequence, and the accumula-
tion of C4-SOC in pasture was positively correlated
(P = 0.004) with the SOC stock in the preceding forest
(Table 5).
(a) (b)
Fig. 1 Effect of MAP (mean annual precipitation) (panel a) and SOC stock under forest (panel b) on the SOC stock change after defores-
tation and pasture establishment (n = 43, all layers considered). For sites where one forest soil is compared to several pastures (e.g.
Mosquera et al., 2012), we considered the mean of the SOC stock change.
Fig. 2 Pasture management effect on the SOC stock after defor-
estation (n = 15 for degraded, 23 for nominal and 12 for
improved pastures). Box plots display the median, interquartile
range, 10–90 percentile (whiskers) and outliers (circles). Pas-
tures studied by Fujisaka et al. (1998) and Fraz~ao et al. (2013)
were not considered here because no information about pasture
management was provided in their study.
Fig. 3 Soil tillage effect on SOC stock changes after deforesta-
tion and cropland establishment.
© 2015 John Wiley & Sons Ltd, Global Change Biology, 21, 2773–2786
SOIL CARBON AFTER DEFORESTATION 2779

Discussion
SOC stock changes: general trends
The average decrease of SOC stocks in Amazonian
croplands was surprisingly lower than in results of
meta-analyses conducted in the world across all cli-
mates (Guo & Gifford, 2002; Murty et al., 2002) or in the
tropics (Don et al., 2011) (Table 1). The age of the con-
sidered systems could explain these differences: for
example, Don et al. (2011) found a SOC loss of 32% in
humid tropics, but the average age of croplands was
28 years. Besides, the default emission factor estab-
lished by IPCC for a land-use change from forest to
cropland in humid tropics is a SOC loss of 42% in the
0–30 cm layer after more than 20 years (Penman et al.,
2003). Although the SOC decrease rates were higher in
the early years after deforestation (Davidson & Acker-
man, 1993), it is likely that the carbon cycle was not in a
steady state situation eight years after deforestation
(the average age in our dataset), which would explain
the relatively small decrease in the observed SOC.
For pastures, the Amazonian trend here (+6.8 � 3.1%
of SOC stock) was close to that observed for the world
as a whole by Guo & Gifford (2002) (+8%). However,
our results are far from those of Don et al. (2011), who
observed a decrease in SOC stocks in the tropics of
12.1%, and those of Murty et al. (2002), who found no
significant difference in SOC stocks after deforestation
and pasture establishment.
These opposing trends between croplands and pas-
tures can be explained by the lower carbon restitutions
in cropland systems compared to natural forests (Lal
et al., 1997) and by loss of protection of forest carbon
during cultivation (Mann, 1986; Feller & Beare, 1997).
On the other hand, the storage of SOC in pastures is
favoured by the large root activity of grasses, which
provides enough carbon to offset the carbon minerali-
zation of native forest carbon (Fisher et al., 1994).
Soil and climatic factors
Despite strong gradients of MAP, clay content and SOC
stocks under forest, none of these factors could explain
the trajectory of SOC stocks after deforestation in
Amazonia. This contrasts in many ways with the exist-
ing literature. In the Amazon, Neill & Davidson (2000)
showed that the SOC stock variation in pastures was
negatively correlated to the SOC stock found in forest.
These findings are also shared by Holmes et al. (2006).
But Neill & Davidson (2000) included sites deforested
less than 2 years earlier (Cerri et al., 1991; Luiz~ao et al.,
1992) and expressed their results of SOC changes in %
yr�1, thus the SOC change rates could be high in these
Fig. 4 Decay of soil carbon derived from forest (C3tx-SOC) in Amazonian pastures (layer 0–20/30 cm).
© 2015 John Wiley & Sons Ltd, Global Change Biology, 21, 2773–2786
2780 K. FUJISAKI et al.

destabilized young systems. With our larger database
and expressing SOC changes in %, we did not observe
this kind of correlation (Fig. 1b). This absence of corre-
lation between the SOC stock in forest and the change
in SOC stock in following pasture is in agreement with
several studies that showed no effect of clay in SOC
dynamics after deforestation (Davidson & Ackerman,
1993; Don et al., 2011). Indeed, it can be assumed that
sites with high clay contents under forest had high SOC
stocks (Fig. 6), but this parameter did not affect the
SOC dynamics in established pastures, at least on this
timescale.
As mentioned earlier, the literature on the effect of
mean annual precipitation (MAP) on SOC stock change
is contradictory. In a meta-analysis including precipita-
tion between 1400 and 2300 mm, Eclesia et al. (2012)
assumed that primary productivity in pastures
increased with precipitation, explaining the correlation
they found between SOC variation in pastures and
MAP. Guo & Gifford (2002) showed that beyond MAP
of 3000 mm, SOC stocks decreased in pastures, pre-
sumably due to the greater water erosion (Alegre &
Cassel, 1996) that would export SOC out of plots. Other
meta-analyses conducted on continental or global scales
showed that these soil and climatic factors could influ-
ence the dynamics of SOC. However, the analyses can
be contradictory if the spatial scale is changed, and pro-
cesses that explain the role of soil and climatic factors
are not clearly explained, especially in the humid tro-
pics. Therefore, the analysis of agroecosystem manage-
ment appears relevant to evaluate the fate of SOC after
deforestation in Amazonia.
Agroecosystem management
For pastures, our results contrast with the findings of
Fearnside & Barbosa (1998), who suggested that pas-
tures with ‘typical’ management lost SOC (17.8%),
whereas pastures with an ‘ideal’ management gained
SOC (15.0%). But their ‘typical’ pastures did not always
correspond to the degraded pastures defined by Maia
(a)
(b)
Fig. 5 Decay of soil carbon derived from forest (C3t0-SOC)
(panel a) and accumulation of soil carbon derived from pasture
(C4-SOC) (panel b) in Amazonian pastures (layer 0–20/30 cm).
Table 5 Multiple linear regressions of C3t0-SOC and C4-
SOC trend in pastures after deforestation in the layer 0–20/
30 cm (n = 16). Parameters are soil clay content (clay), time
since conversion (age), SOC stock found in forest (SOCFo) and
mean annual precipitation (MAP)
SOC change Parameter Values P value
C3t0-SOC (%) Intercept 94.0 � 45.6 0.064
Clay (%) 0.23 � 0.22 0.33
MAP (mm) �0.01 � 0.02 0.70
Age (years) �0.12 � 0.24 0.63
SOCFo (t ha�1) �0.36 � 0.39 0.38
R² adjusted 0
C4-SOC (Mg ha�1) Intercept 10.0 � 20.6 0.638
Clay (%) �0.20 � 0.10 0.083
MAP (mm) �0.01 � 0.01 0.452
Age (years) 0.27 � 0.11 0.031
SOCFo (t ha�1) 0.65 � 0.18 0.004
R² adjusted 0.47
Fig. 6 Relationship between SOC stock under forest and soil
clay content in our Amazonian dataset (layer 0–20/30 cm).
© 2015 John Wiley & Sons Ltd, Global Change Biology, 21, 2773–2786
SOIL CARBON AFTER DEFORESTATION 2781

et al. (2009) (e.g. the pasture studied by Desjardins et al.
(1994) was slightly fertilized but considered by Fearn-
side & Barbosa as ‘typical’). The wide dispersion of
SOC change in degraded pastures (Fig. 2) can be
explained by the diversity of situations where the pro-
ductivity of forage grass decreased. On the one hand, if
the pasture was overgrazed and/or suffered severe
water erosion, it is likely that the SOC stock would
decrease due to reduced SOC input and/or because of
SOC loss by erosion. On the other hand, pastures
invaded by weeds or affected by woody encroachment
can store SOC through above-ground and below-
ground plant biomass inputs, which are not exported
by livestock. Finally, the assessment of pasture degra-
dation is based here on agronomic criteria, which do
not always allow a suitable assessment of the carbon
cycle of the soil. Curiously, the maximum SOC gains
were lower in improved pastures than in nominal or
degraded pastures. It is possible that fertilization of
pastures increases SOC mineralization and thus leads
to a fall in SOC stock. However, on four of the sets of
improved pastures, SOC stock was measured down to
100 cm depth (Mosquera et al., 2012) which may under-
estimate the gains of SOC compared to sampling down
to 20 or 30 cm depth.
Forest-derived and pasture-derived SOC dynamics
At this stage, the isotopic data do not suggest new
explanations for the SOC dynamics after deforestation:
we observed a high heterogeneity of the carbon derived
from forest at the biome scale. The interpretation must
lie in the soil or climate, as the management of all the
pastures was similar. Nevertheless, the accumulation of
carbon derived from grasses appeared relatively consis-
tent with time, that is an accumulation with a maxi-
mum of 20 Mg SOC ha�1 (Fig. 5b). The positive
relationship between C4-SOC accumulation and pas-
ture age is not surprising given the young age of the
sampled pastures, whose soil carbon cycle did not
reach an equilibrium level. The correlation between C4-
SOC accumulation and SOC stock in forest is more sur-
prising, but could be explained by the fact that high
SOC stocks observed under forests are related to soil
and climatic variables which contribute to maintain a
high primary productivity. This assumption cannot be
verified with our dataset. However, the clay content of
soil and MAP did not influence the accumulation of
C4-SOC, and we have seen that the total SOC stock
changes in pastures were not dependent on the SOC
stocks under the reference forest.
The decrease in the carbon derived from forest,
expressed in relation to the initial carbon stock, was
very variable, which may be due to the disturbance of
the o13C signal by the input of carbon C3 derived from
decomposing stumps, saplings and weeds (Camargo
et al., 1999; Powers & Veldkamp, 2005). The great varia-
tion in the C3-SOC trend in the pastures could be also
related to the C4 inputs to pastures, derived from litter-
fall but also from root activity (Camargo et al., 1999).
Thus, rhizodeposition could promote a priming effect
of native soil carbon (Paterson, 2003), but with a wide
magnitude according to the sites (Cheng et al., 2014),
explaining high variability of the C3-SOC trend.
Sources of error and uncertainties
Data heterogeneity is a major problem in the meta-
analyses, especially as the studies reviewed here were
made over a long period of time (several decades). Our
selection was wide to maintain representativeness of
trends at the biome scale. We analysed SOC stock varia-
tions assessed at 20 or 30 cm depth in the same way:
this difference of sampling depth could account for
some of the variability in the SOC response. At this
point, it is necessary to stress that the IPCC recom-
mends comparing the stocks to 30 cm depth (Penman
et al., 2003), we discuss this point later. We deliberately
did not select studies according to the sampling strat-
egy or degree of replication of the experiment, because
this would have obliged us to exclude many of the
studies. Not all the studies presented uncertainty on
SOC stock values, although it is essential to evaluate
differences in land use.
A major source of uncertainty in our review is the
fact that forests and agroecosystems were mainly com-
pared using the chronosequence approach; only three
studies were diachronic. In chronosequence studies,
soil properties under forest and under pastures could
be slightly different, thus increasing the uncertainty
associated with SOC dynamics after deforestation. For
example, Fraz~ao et al. (2013) reported a difference of
8% in the clay contents between the soil under forest
and pasture; the authors corrected the stocks under
pastures using the method established by de Moraes
et al. (1996), assuming that SOC stocks were correlated
with the clay content (Feller et al., 1991). We believe
that this correction can be made if the relationship
between SOC stock under natural vegetation and soil
clay content is established on a consistent soil unit at
local scale. If not, this correction could be risky because
de Moraes et al. (1996) based their assumption on a
relationship between SOC and clay content found at
the global scale (Feller et al., 1991). In our dataset, we
observed a correlation between SOC stocks and clay
content (Fig. 6), but it is based on two extreme clusters
with no intermediate values and therefore might not
apply to studies of a different scale.
© 2015 John Wiley & Sons Ltd, Global Change Biology, 21, 2773–2786
2782 K. FUJISAKI et al.

For Cerrado savannahs, Costa Junior et al. (2013)
showed that the chronosequence approach overesti-
mated the carbon storage after land-use change and
appeared less accurate than the diachronic approach.
For these authors, the variability of soil properties
(including clay content) and the management history
after deforestation explained the differences found
between the two approaches. The efficiency of vegeta-
tion burning, the stumps remaining in the soil, cultiva-
tion practices before pasture establishment and the
frequency of fires in pastures are factors that contribute
to the variability of SOC response on a local scale, but
also at the biome scale. Finally, human practices induce
heterogeneities in the SOC response after land-use
change, which are added to the natural heterogeneity
of soil properties occurring at local (Do Nascimento
et al., 2004) and global scale (Quesada et al., 2011).
For isotopic data, some considerations have to be
added to the uncertainties presented previously; in par-
ticular, the uncertainty associated with the calculation
of the proportions of carbon derived from forest and
pasture. These proportions are calculated from Eqns (1)
and (2) adapted from Bernoux et al. (1998):
Cp ¼ Ct� ðdt� drefÞ=ðdP� dFÞ ð1Þ
Cf ¼ Ct� Cp ð2Þwhere Cp is the quantity of carbon derived from pas-
ture, Cf the quantity of carbon derived from forest, Ct
the quantity of total soil carbon, dt the d13C value of the
soil under pasture, dref the d13C value of the soil under
forest at the same depth, dP the d13C value of the pas-
ture vegetation or litter, and dF the d13C value of the
forest vegetation or litter. In the compiled studies, we
observed that for Eqn (1) although dF did not vary sig-
nificantly (only from �28 to �29 &), the dP values
were widely dispersed. The different grasses used in
pastures have different d13C values, but these can also
vary according to the type of sample analysed. These
variations give a difference of up to 4 & in the d13Cpvalues (Table 6). The uncertainty in this value implies a
substantial variation in the Cp quantification: for exam-
ple, a difference of 3 & associated with dP when
dt = �20 & and Ct = 40 Mg ha�1 implies 4.6 Mg ha�1
of difference in the Cp estimation, equivalent to more
than 10% of the mean total stock observed under pas-
ture. Given this variability, the accurate determination
of dP is essential. However, in many studies, this dPvalue was not measured and referred to previous stud-
ies (e.g. Neill et al., 1997), and considered litter dP value
rather than roots dP value, although carbon inputs in
pasture systems are mainly derived from roots. In addi-
tion, the dP variability should increase if different
grasses are used for a given chronosequence (Koutika
et al., 1997).
Methodological implications
Some methodological implications can be discussed to
reduce the uncertainties associated with the SOC
changes after deforestation in Amazonia, which are no
doubt applicable to other regions. Indeed, Don et al.
(2011) showed that in the humid tropics, studies on
SOC dynamics are scarcer in South-East Asia and in
Africa than in Amazonia. There is a need for more dia-
chronic studies, which eliminate much of the variability
and uncertainty associated with soil properties and
management. These studies are expensive, and time is
required to obtain valuable results, but this is one of the
best ways to reduce uncertainty (Costa Junior et al.,
2013; Dimassi et al., 2014), and there is no option
whether we want to produce more relevant results that
can be used for instance in the modelling of the agroe-
cosytem responses to anthropogenic changes.
We found that the time since deforestation in the for-
est–cropland comparisons was short (mean 8 years), so
that the SOC may not have reached an equilibrium
state (Penman et al., 2003; Smith, 2014). Results from
older croplands are therefore needed to evaluate the
SOC loss over the longer term. Maia et al. (2010) found
in south-eastern Amazonia that no-till systems had sim-
ilar SOC stocks than forest (+0.1 � 17%), but we believe
that extrapolation of these results to the future should
be performed with caution because many no-till sys-
tems were very young in their study. In this agricul-
tural frontier of southern Amazonia, where
agroecosystems are young, we hope that SOC monitor-
ing will continue to provide long-term data.
For pastures, there is a need for studies covering at
least 20 years using the isotopic approach, so that a fig-
ure for SOC storage in pastures could be proposed for
use in long-term modelling. We did not include in our
review mixed agroecosystems, for instance integrated
crop-livestock systems as studied by Carvalho et al.
(2010) in Rondonia and north of Mato Grosso. These
Table 6 d13C values of grasses in some Amazonian pastures
Grass species Sample d13C (&) Reference
Pennisetum
purpureum
Leaves
Roots
�11,20
�13,00
Desjardins
et al. (1994)
Urochloa brizantha
Panicum maximum
Litter
Litter
�14,30
�15,49
de Moraes
et al. (1996)
de Moraes
et al. (1996)
Urochloa humidicola Leaves
Roots
�12,20
�12,40
Desjardins
et al. (2004)
© 2015 John Wiley & Sons Ltd, Global Change Biology, 21, 2773–2786
SOIL CARBON AFTER DEFORESTATION 2783
authors showed that soils in this kind of system could
store more SOC than cropland systems or degraded
pastures. In other Brazilian biomes, a recent review
found same trends (Pinto & Assad, 2013); further
research on these systems is needed in Amazonia.
Future research will also be needed to assess SOC
dynamics after land-use change on former deforested
areas, for instance croplands established after pastures.
Few studies in Amazonia (10 comparisons) deter-
mined SOC stocks after deforestation in deep soil lay-
ers. But in this biome, the soils are deep and the SOC
dynamics after land-use change, in a biogeochemical
sense, take place within the entire soil volume (Rumpel
& K€ogel-Knabner, 2010; Shi et al., 2013). Sampling the
soil to 100 cm depth rather than 30 cm as suggested by
IPCC (Penman et al., 2003) is desirable, particularly if
we want to analyse the SOC change from an environ-
mental perspective (Trumbore, 2009). The balance
between loss of the native carbon by mineralization in
deep soil horizons and the decomposition of forest
roots on the one hand, and on the other hand, the
inputs by root flux carbon presumed to be important
under pastures and has barely been evaluated in
Amazonia. Amazonian soil systems export carbon even
under forest by leaching and runoff; in the future, we
will also need to measure the effect of deforestation on
the leaching of dissolved carbon in small watersheds
and check whether such exports are higher than those
measured for natural forests by hydrogeochemists (Bar-
dy et al., 2011).
Finally, there is a lack of data about the management
of the agroecosystems in Amazonia for SOC study pur-
poses. These data are fundamental for predictive stud-
ies by modelling with mechanistic models such as
RothC or Century. This is particularly important for the
short-term management of studied sites: deforestation
method, fire efficiency, woody residues, soil loss by
erosion and number of cultivation cycles before pasture
establishment, which determine the short-term SOC
dynamics. In the medium term, particularly for crop-
lands, knowledge of the intensity of the rotations and
data for organic restitutions (crop residues, organic fer-
tilization) should improve the explanation of the SOC
variations observed. The comparison between tilled
and no-tilled systems needs to be assessed in regard to
carbon inputs, which explained most of the variation in
SOC stocks between till and no-till systems (Virto et al.,
2012). The effect of no-till on SOC storage has been
overestimated (Powlson et al., 2014), partly because
sampling depth was too superficial in many studies
comparing tilled and no-tilled systems (Baker et al.,
2007; Dimassi et al., 2014). For pastures, research has to
stress the management factors that explain the SOC
stock variations observed; the current pasture classifica-
tion does not seem adequate to distinguish the SOC
dynamics.
SOC policies
Given the large GHG emissions associated with defor-
estation in Amazonia, the soil conservation associated
with good management of agroecosystems in defor-
ested areas (Grimaldi et al., 2014) is the only achievable
target in the short and medium term, to maintain sus-
tainable food production. A goal of high soil carbon
stocks is not compatible with high productivity of crop-
lands; in the case of pastures, it involves management
intensification with technology, and the current Ama-
zonian organization systems often do not offer these
options. On the one hand, some farms are too large,
whereas on the other, smallholders have no access to
credit or technology transfer (Guedes et al., 2014); how-
ever, there are examples where smallholders imple-
ment locally sustainable and intensive cropping
systems (Arnauld de Sartre et al., 2005). Thus, the car-
bon issue is related to an adaptation of policies to small
regions and socio-economic targets (Brossard & L�opez-
Hern�andez, 2005). In Brazil, the adoption of Low Car-
bon Agriculture Plan (ABC Plan) since 2010 shows that
henceforth, public policies aim to promote credits for
farmers adopting farming systems enhancing carbon
storage in soil and biomass, rather than unsustainable
agricultural systems (Brando et al., 2013; Pinto & Assad,
2013).
Concluding remarks
In Amazonia, agroecosystems establishment after
deforestation lead to a slight increase of SOC stocks in
pastures and to a slight decrease in croplands. How-
ever, uncertainties are high and these systems probably
not reached an equilibrium state given the short time-
scale considered, especially for croplands. We could
not relate strong heterogeneity of SOC response after
deforestation to pedoclimatic factors or management
factors, at best we can assume that improved pastures
could gain SOC compared to forest. Nevertheless, SOC
derived from pasture grasses measured with isotopic
analyses exhibited a relatively coherent accumulation,
with an average of 20 Mg C ha�1 in twenty years in the
layer 0–20/30 cm. Our meta-analysis highlights the
need for diachronic and long-term studies, and we
underline that a large part of uncertainties is linked to
the lack of knowledge in the management of agroeco-
systems. Future research on this topic should also con-
sider mixed agroecosystems, as current data available
do not cover the large pattern of cropping systems
existing in Amazonia.
© 2015 John Wiley & Sons Ltd, Global Change Biology, 21, 2773–2786
2784 K. FUJISAKI et al.

Acknowledgements
This study was partly funded by the Fond Europ�een de D�evel-oppement R�egional, the CETIOM (Centre Technique Interpro-fessionnel des Ol�eagineux et du Chanvre) and the GuianaRegion. K. Fujisaki was funded by an ANRT Scholarship Project(CIFRE N°2011-36). English revision by Alan Scaife.
References
Alegre JC, Cassel DK (1996) Dynamics of soil physical properties under alternative
systems to slash-and-burn. Agriculture, Ecosystems & Environment, 58, 39–48.
Arag~ao LE, Poulter B, Barlow JB et al. (2014) Environmental change and the carbon
balance of Amazonian forests. Biological Reviews, 89, 913–931.
Arnauld de Sartre X, Albaladejo C, Martins P, Veiga I, Grimaldi M (2005) Identifica-
tion et �evaluation de la diversit�e des modes d’exploitation des milieux en Amazo-
nie orientale. Cahiers Agricultures, 14, 85–89.
Baker JM, Ochsner TE, Venterea RT, Griffis TJ (2007) Tillage and soil carbon seques-
tration-What do we really know? Agriculture, Ecosystems & Environment, 118, 1–5.
Balesdent J, Wagner GH, Mariotti A (1988) Soil organic matter turnover in long-term
field experiments as revealed by carbon-13 natural abundance. Soil Science Society
of America Journal, 52, 118.
Balesdent J, Besnard E, Arrouays D, Chenu C (1998) The dynamics of carbon in parti-
cle-size fractions of soil in a forest-cultivation sequence. Plant and Soil, 201, 49–57.
Bardy M, Derenne S, Allard T, Benedetti MF, Fritsch E (2011) Podzolisation and
exportation of organic matter in black waters of the Rio Negro (upper Amazon
basin, Brazil). Biogeochemistry, 106, 71–88.
B�eliveau A, Lucotte M, Davidson R, do Canto Lopes LO, Paquet S (2009) Early Hg
mobility in cultivated tropical soils one year after slash-and-burn of the primary
forest, in the Brazilian Amazon. Science of the Total Environment, 407, 4480–4489.
Bernoux M, Cerri CC, Neill C, de Moraes JF (1998) The use of stable carbon isotopes
for estimating soil organic matter turnover rates. Geoderma, 82, 43–58.
Bernoux M, Feigl BJ, Cerri CC, Geraldes APDA, Fernandes SAP (1999) Soil carbon
and nitrogen in a forest – pasture chronosequence from Paragominas. Scientia Ag-
ricola, 56, 777–783.
Bouchez J, Galy V, Hilton RG et al. (2014) Source, transport and fluxes of Amazon
River particulate organic carbon: insights from river sediment depth-profiles. Geo-
chimica et Cosmochimica Acta, 133, 280–298.
Brando PM, Coe MT, DeFries R, Azevedo AA (2013) Ecology, economy and manage-
ment of an agroindustrial frontier landscape in the southeast Amazon. Philosophi-
cal Transactions of the Royal Society B: Biological Sciences, 368, 20120152.
Brossard M, L�opez-Hern�andez D (2005) Des indicateurs d’�evolution du milieu et des
sols pour rendre durable l’usage des savanes d’Am�erique du Sud. Natures Sciences
Soci�et�es, 13, 266–278.
Camargo PB, Trumbore SE, Martinelli LA, Davidson EA, Nepstad DC, Victoria RL
(1999) Soil carbon dynamics in regrowing forest of eastern Amazonia. Global
Change Biology, 5, 693–702.
Carvalho JLN, Raucci GS, Cerri CEP, Bernoux M, Feigl BJ, Wruck FJ, Cerri CC (2010)
Impact of pasture, agriculture and crop-livestock systems on soil C stocks in Bra-
zil. Soil and Tillage Research, 110, 175–186.
Cerri CC, Feller C, Balesdent J, Victoria R, Plenecassagne A (1985) Application du
tracage isotopique naturel en 13C, a l’etude de la dynamique de la matiere organi-
que dans les sols. Comptes Rendus de l’Academie des Sciences de Paris, 300, 423–427.
Cerri CC, Volkoff B, Andreux F (1991) Nature and behaviour of organic matter in
soils under natural forest, and after deforestation, burning and cultivation, near
Manaus. Forest Ecology and Management, 38, 247–257.
Cerri CEP, Coleman K, Jenkinson DS, Bernoux M, Victoria R, Cerri CC (2003) Model-
ing soil carbon from forest and pasture ecosystems of Amazon, Brazil. Soil Science
Society of America Journal, 67, 1879–1887.
Cerri CEP, Paustian K, Bernoux M, Victoria RL, Melillo JM, Cerri CC (2004) Modeling
changes in soil organic matter in Amazon forest to pasture conversion with the
Century model. Global Change Biology, 10, 815–832.
Cerri CEP, Cerri CC, Bernoux M, Volkoff B, Rondon MA (2006) Potential of soil car-
bon sequestration in the Amazonian tropical rainforests. In: Carbon Sequestration in
Soils of Latin America (eds Lal R, Cerri CC, Bernoux M, Etchevers J, Cerri CEP), pp.
245–266. The Haword Press, Binghampton, NY.
Cerri CEP, Easter M, Paustian K et al. (2007) Simulating SOC changes in 11 land use
change chronosequences from the Brazilian Amazon with RothC and Century
models. Agriculture, Ecosystems & Environment, 122, 46–57.
Cheng W, Parton WJ, Gonzalez-Meler MA et al. (2014) Synthesis and modeling per-
spectives of rhizosphere priming. New Phytologist, 201, 31–44.
Costa Junior C, Corbeels M, Bernoux M et al. (2013) Assessing soil carbon storage
rates under no-tillage: comparing the synchronic and diachronic approaches. Soil
and Tillage Research, 134, 207–212.
Dale VH, Pearson SM, Offerman HL, O’Neill RV (1994) Relating patterns of land-use
change to faunal biodiversity in the Central Amazon. Conservation Biology, 8, 1027–
1036.
Davidson EA, Ackerman IL (1993) Changes in soil carbon inventories following culti-
vation of previously untilled soils. Biogeochemistry, 20, 161–193.
Davidson EA, De Abreu S�a TD, Reis Carvalho CJ, De Oliveira Figueiredo R, Kato
MSA, Kato OR, Ishida FY (2008) An integrated greenhouse gas assessment of an
alternative to slash-and-burn agriculture in eastern Amazonia. Global Change Biol-
ogy, 14, 998–1007.
Desjardins T, Andreux F, Volkoff B, Cerri CC (1994) Organic carbon and 13C contents
in soils and soil size-fractions, and their changes due to deforestation and pasture
installation in eastern Amazonia. Geoderma, 61, 103–118.
Desjardins T, Mariotti A, Girardin C, Chauvel A (1996) Changes of the forest-savanna
boundary in Brazilian Amazonia during the Holocene revealed by stable isotope
ratios of soil organic carbon. Oecologia, 108, 749–756.
Desjardins T, Barros E, Sarrazin M, Girardin C, Mariotti A (2004) Effects of forest con-
version to pasture on soil carbon content and dynamics in Brazilian Amazonia.
Agriculture, Ecosystems & Environment, 103, 365–373.
Dimassi B, Mary B, Wylleman R, Labreuche J, Couture D, Piraux F, Cohan J-P (2014)
Long-term effect of contrasted tillage and crop management on soil carbon
dynamics during 41 years. Agriculture, Ecosystems & Environment, 188, 134–146.
Do Nascimento NR, Bueno GT, Fritsch E et al. (2004) Podzolization as a deferralitiza-
tion process: a study of an Acrisol-Podzol sequence derived from Palaeozoic sand-
stones in the northern upper Amazon Basin. European Journal of Soil Science, 55,
523–538.
Don A, Schumacher J, Freibauer A (2011) Impact of tropical land-use change on soil
organic carbon stocks – a meta-analysis. Global Change Biology, 17, 1658–1670.
Eclesia RP, Jobbagy EG, Jackson RB, Biganzoli F, Pi~neiro G (2012) Shifts in soil
organic carbon for plantation and pasture establishment in native forests and
grasslands of South America. Global Change Biology, 18, 3237–3251.
Ellert BH, Janzen HH, VandenBygaart AJ, Bremer E (2007) Measuring change in soil
organic carbon storage. In: Soil Sampling and Methods of Analysis, 2nd edn (eds Car-
ter MR, Gregorich EG), pp. 25–38. CRC Press, Boca Raton, FL.
Eva HD, Huber O, Achard F et al. (2005) A Proposal for Defining the Geographical Bound-
aries of Amazonia. JRC Ispra, Office for Official Publications of the European Com-
munities, Luxembourg.
Fabian P, Kohlpaintner M, Rollenbeck R (2005) Biomass Burning in the Amazon-Fer-
tilizer for the Mountaineous Rain Forest in Ecuador. Environmental Science and Pol-
lution Research, 12, 290–296.
Falesi IC (1976) Ecossistema de Pastagem Cultivada na Amazonia Brasileira. EMBRAPA,
Centro de Pesquisa Agropecu�aria do Tr�opico �Umido. Bel�em, Brazil.
Farella N, Lucotte M, Louchouarn P, Roulet M (2001) Deforestation modifying terres-
trial organic transport in the Rio Tapaj�os, Brazilian Amazon. Organic Geochemistry,
32, 1443–1458.
Fearnside PM, Barbosa RI (1998) Soil carbon changes from conversion of forest to pas-
ture in Brazilian Amazonia. Forest Ecology and Management, 108, 147–166.
Feller C, Beare MH (1997) Physical control of soil organic matter dynamics in the tro-
pics. Geoderma, 79, 69–116.
Feller C, Fritsch E, Poss R, Valentin C (1991) Effet de la texture sur le stockage et la
dynamique des mati�eres organiques dans quelques sols ferrugineux et ferralli-
tiques (Afrique de l’Ouest, en particulier). Cahiers ORSTOM. S�erie P�edologie, 26, 25–
36.
Fisher MJ, Rao IM, Ayarza MA, Lascano CE, Sanz JI, Thomas RJ, Vera RR (1994) Car-
bon storage by introduced deep-rooted grasses in the South American savannas.
Nature, 371, 236–238.
Fraz~ao LA, Paustian K, Pellegrino Cerri CE, Cerri CC (2013) Soil carbon stocks and
changes after oil palm introduction in the Brazilian Amazon. Global Change Biology
Bioenergy, 5, 384–390.
Freitas HA, Pessenda LCR, Aravena R, Gouveia SEM, de Souza Ribeiro A, Boulet R
(2001) Late quaternary vegetation dynamics in the Southern Amazon Basin
inferred from carbon isotopes in soil organic matter. Quaternary Research, 55, 39–
46.
Fritsch E, Balan E, Nascimento NR et al. (2011) Deciphering the weathering processes
using environmental mineralogy and geochemistry: towards an integrated model
of laterite and podzol genesis in the Upper Amazon Basin. Comptes Rendus Geosci-
ence, 343, 188–198.
© 2015 John Wiley & Sons Ltd, Global Change Biology, 21, 2773–2786
SOIL CARBON AFTER DEFORESTATION 2785

Fujisaka S, Castilla C, Escobar G, Rodrigues V, Veneklaas E, Thomas R, Fisher M
(1998) The effects of forest conversion on annual crops and pastures: estimates of
carbon emissions and plant species loss in a Brazilian Amazon colony. Agriculture,
Ecosystems & Environment, 69, 17–26.
Gardi C, Angelini M, Barcel�o S et al. (2014) Atlas de suelos de Am�erica Latina y el
Caribe, Comisi�on Europea, Oficina de Publicaciones de la Uni�on Europea edn. L-
2995 Luxembourg.
Grace J, Mitchard E, Gloor E (2014) Perturbations in the carbon budget of the tropics.
Global Change Biology, 20, 3238–3255.
Grimaldi M, Sarrazin M, Chauvel A et al. (1993) Effets de la d�eforestation et des cul-
tures sur la structure des sols argileux d’Amazonie br�esilienne. Agricultures: Cah-
iers d’Etudes et de Recherches Francophones, 2, 36–47.
Grimaldi M, Schroth G, Teixeira WG, Huwe B (2003) Soil structure. In: Trees, Crops,
and Soil Fertility : Concepts and Research Methods (eds Schroth G, Sinclair FL), pp.
191–203. CABI, Wallingford.
Grimaldi M, Oszwald J, Dol�edec S et al. (2014) Ecosystem services of regulation and
support in Amazonian pioneer fronts: searching for landscape drivers. Landscape
Ecology, 29, 311–328.
Guedes GR, VanWey LK, Hull JR, Antigo M, Barbieri AF (2014) Poverty dynamics,
ecological endowments, and land use among smallholders in the Brazilian Ama-
zon. Social Science Research, 43, 74–91.
Guo LB, Gifford RM (2002) Soil carbon stocks and land use change: a meta analysis.
Global Change Biology, 8, 345–360.
Holmes KW, Chadwick OA, Kyriakidis PC, deFilho S, Eliomar P, Soares JV, Roberts
DA (2006) Large-area spatially explicit estimates of tropical soil carbon stocks and
response to land-cover change. Global Biogeochemical Cycles, 20, doi:10.1029/
2005GB002507.
Horbe AMC, Horbe MA, Suguio K (2004) Tropical Spodosols in northeastern Amazo-
nas State, Brazil. Geoderma, 119, 55–68.
IUSS Working Group (2007) World Reference Base for Soil Resources 2006, First Update
2007. World Soil Resources Reports No. 103. FAO, Rome.
Janssen BH, Wienk JF (1990) Mechanized annual cropping on low fertility acid soils in the
humid tropics: a case study of the Zanderij soils in Suriname, vol. 90. Wageningen Agri-
cultural University Papers, Wageningen.
Koutika L-S, Bartoli F, Andreux F, Cerri CC, Burtin G, Chon�e T, Philippy R
(1997) Organic matter dynamics and aggregation in soils under rain forest
and pastures of increasing age in the eastern Amazon Basin. Geoderma, 76, 87–
112.
Lal R, Kimble JM, Follett RF, Stewart BA (1997) Soil Processes and the Carbon Cycle.
CRC Press, Boca Raton, Boston.
Lisboa CC, Conant RT, Haddix ML, Cerri CEP, Cerri CC (2009) Soil carbon turnover
measurement by physical fractionation at a forest-to-pasture chronosequence in
the Brazilian Amazon. Ecosystems, 12, 1212–1221.
Luiz~ao RCC, Bonde TA, Rosswall T (1992) Seasonal variation of soil microbial bio-
mass—The effects of clearfelling a tropical rainforest and establishment of pasture
in the central Amazon. Soil Biology and Biochemistry, 24, 805–813.
Maia SMF, Ogle SM, Cerri CEP, Cerri CC (2009) Effect of grassland management on
soil carbon sequestration in Rondonia and Mato Grosso states, Brazil. Geoderma,
149, 84–91.
Maia SMF, Ogle SM, Cerri CC, Cerri CEP (2010) Changes in soil organic carbon stor-
age under different agricultural management systems in the Southwest Amazon
Region of Brazil. Soil and Tillage Research, 106, 177–184.
Malhi Y, Roberts JT, Betts RA, Killeen TJ, Li W, Nobre CA (2008) Climate change,
deforestation, and the fate of the Amazon. Science, 319, 169–172.
Mann LK (1986) Changes in soil carbon storage after cultivation. Soil Science, 142,
279–288.
Melo AWF (2003) Avaliac�~ao do Estoque e Composic�~ao Isot�opica do Carbono do Solo no Acre.Dissertac�~ao (mestrado), Escola Superior de Agricultura Luiz de Queiroz, Piraci-
caba.
de Moraes JFL, Volkoff B, Cerri CC, Bernoux M (1996) Soil properties under Amazon
forest and changes due to pasture installation in Rondonia, Brazil. Geoderma, 70,
63–81.
Mosquera O, Buurman P, Ramirez BL, Amezquita MC (2012) Carbon stocks and
dynamics under improved tropical pasture and silvopastoral systems in Colom-
bian Amazonia. Geoderma, 189–190, 81–86.
Murty D, Kirschbaum MUF, Mcmurtrie RE, Mcgilvray H (2002) Does conversion of
forest to agricultural land change soil carbon and nitrogen? a review of the litera-
ture. Global Change Biology, 8, 105–123.
Neill C, Davidson EA (2000) Soil carbon accumulation or loss following deforestation
for pasture in the Brazilian Amazon. In: Global Climate Change and Tropical Ecosys-
tems (eds Kimble J, Stewart B), pp. 197–211. CRC Press, Boca Raton, FL.
Neill C, Melillo JM, Steudler PA, Cerri CC, de Moraes JFL, Piccolo MC, Brito M (1997)
Soil carbon and nitrogen stocks following forest clearing for pasture in the south-
western Brazilian Amazon. Ecological Applications, 7, 1216–1225.
Nepstad D, Soares-Filho BS, Merry F et al. (2009) The end of deforestation in the Bra-
zilian Amazon. Science, 326, 1350–1351.
Nepstad D, McGrath D, Stickler C et al. (2014) Slowing Amazon deforestation
through public policy and interventions in beef and soy supply chains. Science,
344, 1118–1123.
Nobre CA, Obregon GO, Marengo JA, Fu R, Poveda G (2009) Characteristics of
Amazonian climate: main features. In: Amazonia and Global Change (eds Keller M,
Bustamante M, Gash J, Dias PS), pp. 149–162. American Geophysical Union,
Washington, DC.
Pan Y, Birdsey RA, Fang J et al. (2011) A large and persistent carbon sink in the
World’s Forests. Science, 333, 988–993.
Paterson E (2003) Importance of rhizodeposition in the coupling of plant and micro-
bial productivity. European Journal of Soil Science, 54, 741–750.
Peel MC, Finlayson BL, McMahon TA (2007) Updated world map of the K€oppen-Gei-
ger climate classification. Hydrology and Earth System Sciences, 11, 1633–1644.
Penman J, Gytarsky M, Hiraishi T et al. (2003) Good Practice Guidance for Land use,
Land-use Change and Forestry. Institute for Global Environmental Strategies, Kanag-
awa, Japan.
P�erez MAP, Moreira-Turcq P, Gallard H, Allard T, Benedetti MF (2011) Dissolved
organic matter dynamic in the Amazon basin: sorption by mineral surfaces. Chemi-
cal Geology, 286, 158–168.
Perrin A-S, Fujisaki K, Petitjean C et al. (2014) Conversion of forest to agriculture in
Amazonia with the chop-and-mulch method: does it improve the soil carbon
stock? Agriculture, Ecosystems & Environment, 184, 101–114.
Pinto HS, Assad ED (2013) Mitigando Mudanc�as Clim�aticas no Setor Agr�ıcola. Estoques
de carbono nos solos do Brasil, Embaixada Britanica, Embrapa, UNICAMP.
Powers JS, Veldkamp E (2005) Regional variation in soil carbon and d13C in forests
and pastures of northeastern Costa Rica. Biogeochemistry, 72, 315–336.
Powlson DS, Stirling CM, Jat ML, Gerard BG, Palm CA, Sanchez PA, Cassman KG
(2014) Limited potential of no-till agriculture for climate change mitigation. Nature
Climate Change, 4, 678–683.
Quesada CA, Lloyd J, Anderson LO, Fyllas NM, Schwarz M, Czimczik CI (2011) Soils
of Amazonia with particular reference to the RAINFOR sites. Biogeosciences, 8,
1415–1440.
Rumpel C, K€ogel-Knabner I (2010) Deep soil organic matter—a key but poorly under-
stood component of terrestrial C cycle. Plant and Soil, 338, 143–158.
Salimon C, Wadt PG, Alves S (2009) Decrease in carbon stocks in an oxisol due to
land use and cover change in southwestern Amazon. Ambiente e Agua, 4, 57–65.
Shi S, Zhang W, Zhang P, Yu Y, Ding F (2013) A synthesis of change in deep soil
organic carbon stores with afforestation of agricultural soils. Forest Ecology and
Management, 296, 53–63.
Skole D, Tucker C (1993) Tropical deforestation and habitat fragmentation in the
Amazon. Satellite data from 1978 to 1988. Science, 260, 1905–1910.
Smith P (2008) Land use change and soil organic carbon dynamics. Nutrient Cycling in
Agroecosystems, 81, 169–178.
Smith P (2014) Do grasslands act as a perpetual sink for carbon? Global Change Biology,
20, 2708–2711.
Soubi�es F (1979) Existence d’une phase s�eche en Amazonie br�esilienne dat�ee par la
pr�esence de charbons dans les sols (6000-3000 ans B.P.). Cahiers ORSTOM. S�erie
G�eologie, 11, 133–148.
Souza Braz AM, Fernandes AR, Alleoni LRF (2013) Soil attributes after the conversion
from forest to pasture in Amazon. Land Degradation & Development, 24, 33–38.
Stocking MA (2003) Tropical soils and food security: the next 50 years. Science, 302,
1356–1359.
Trumbore S (2009) Radiocarbon and soil carbon dynamics. Annual Review of Earth and
Planetary Sciences, 37, 47–66.
Trumbore SE, Davidson EA, Barbosa de Camargo P, Nepstad DC, Martinelli LA
(1995) Belowground cycling of carbon in forests and pastures of eastern Amazo-
nia. Global Biogeochemical Cycles, 9, 515–528.
Virto I, Barr�e P, Burlot A, Chenu C (2012) Carbon input differences as the main factor
explaining the variability in soil organic C storage in no-tilled compared to inver-
sion tilled agrosystems. Biogeochemistry, 108, 17–26.
© 2015 John Wiley & Sons Ltd, Global Change Biology, 21, 2773–2786
2786 K. FUJISAKI et al.


