smartCEM Smart connected electro mobility
D4.4. smartCEM Assessment Tools
Version number 1.0 Main author M. Larburu (TECNALIA) Dissemination level PU Lead contractor Due date 01.06.2013 Delivery date 27.11.2013
CIP – Information and Communications Technologies Policy Support Programme (ICT PSP) Information Society and Media Directorate-General Grant agreement no.: 297328 Pilot type B
D4.4. smartCEM Assessment Tools
09/12/2013 II Version 1.0
Revision and history sheet
Version history
Version Date Main author Summary of changes
0.0 01/07/2013 M. Larburu (TCNL) Document creation: ToC
0.1 18/09/2013 N. Fricke (DLR) First draft of Chapter 3
0.2 04/10/2013 M. Larburu (TCNL) First draft of Executive Summary, Chapter 1, and Chapter 2. Chapter 4 elimination (to be moved to WP6)
0.3 09/10/2013 R. Delgado and A. Arrue (IDIADA)
Updated on Chapter 2
0.4 10/10/2013 S. Edwards (UNEW) Updated on Chapter 2
0.5 23/10/2013 N. Fricke (DLR) Updated on Chapter 3 and annexes
0.6 26/10/2013 L. Guidotti, D. Pinotti (UNIMORE)
Update on Chapter 3 and Conclusion
0.7 04/11/2013 I. Faye (BOSCH), M. Larburu (TCNL)
Re-inclusion of Chapter 4 and update on it.
0.8 07/11/2013 M. Larburu (TCNL), L. Guidotti (UNIMORE), S. Edwards (UNEW), N. Fricke (DLR) and S. Paz (IDIADA)
Document’s improvement
0.9 12/12/2013 M. Larburu (TCNL) Ready for peer-review
1.0 25/12/2013 M. Larburu (TCNL) Ready for submission
Name Date
Prepared Maider Larburu 12/11/2013
Reviewed Guido Di Pasquale 22/11/2013
Authorised Fernando Zubillaga 27/11/2013
Circulation
Recipient Date of submission
European Commission 27/11/2013
Pilot consortium 27/11/2013
Authors (full list – in alphabetical order)
BOSCH Ian Faye;
CREAFUTUR Marti Jofre;
D4.4. smartCEM Assessment Tools
09/12/2013 III Version 1.0
DLR Nicola Fricke;
IDIADA Rosa Delgado, Alvaro Arrue, Susana Paz;
RACC Josep Laborda;
TECNALIA Maider Larburu, Txomin Rodríguez;
UNEW Simon Edwards;
UNIMORE Leandro Guidotti, Daniele Pinotti.
Project Coordinator
Fernando Zubillaga
MLC ITS Euskadi
Clúster de Movilidad y Logística
Centro de Negocios CTVi, Oficina 1, 3-A
Lermandabide, 8. Polígono Industrial Júndiz
01015 Vitoria-Gasteiz
Tel.: +34 945 10 80 88
Email: [email protected]
D4.4. smartCEM Assessment Tools
09/12/2013 IV Version 1.0
Legal Disclaimer
The information in this document is provided ‘as is’, and no guarantee or warranty is given that the information is fit for any particular purpose. The above referenced consortium members shall have no liability for damages of any kind including without limitation direct, special, indirect, or consequential damages that may result from the use of these materials subject to any liability which is mandatory due to applicable law.
© 2012 by smartCEM Consortium
D4.4. smartCEM Assessment Tools
09/12/2013 5 Version 1.0
Table of Contents
TABLE OF CONTENTS ......................................................................... 5
LIST OF FIGURES ............................................................................... 7
LIST OF TABLES ................................................................................ 9
ABBREVIATIONS .............................................................................. 10
EXECUTIVE SUMMARY ....................................................................... 11
1. INTRODUCTION .......................................................................... 12
1.1. PURPOSE OF THE DELIVERABLE .......................................................... 12
1.2. STRUCTURE OF THE DOCUMENT ......................................................... 12
1.3. RELATED SMARTCEM DOCUMENTS ...................................................... 13
2. TOOL FOR THE EVALUATION OF THE IMPACT OF CARBON EMISSIONS ........ 14
2.1. TOOL SELECTION PROCESS AND CRITERIA ................................................ 14
2.2. APPROACHES .......................................................................... 15
2.2.1. Half-Hourly Calculation of Electricity Carbon Content ................. 16
2.2.2. Well-to-Tank ................................................................... 18
2.2.3. COPERT 4 ....................................................................... 20
2.2.4. CO2 emissions estimation tool of Cityelec ................................ 23
2.3. SELECTION MATRIX ..................................................................... 27
2.4. SMARTCEM CO2 EMISSIONS EVALUATION TOOL (SCEET) ................................ 28
2.4.1. Tool brief description ........................................................ 28
2.4.2. Functionalities ................................................................. 29
2.4.3. How to use? .................................................................... 30
3. QUESTIONNAIRES FOR THE ASSESSMENT OF USER-UPTAKE..................... 43
3.1. QUESTIONNAIRE CONCEPT AND DEVELOPMENT PROCESS .................................. 43
3.1.1. General user acceptance ..................................................... 44
3.1.2. User-acceptance of smartCEM services .................................... 44
3.1.3. General range-anxiety / trust .............................................. 47
3.1.4. Range-anxiety / trust related to smartCEM services .................... 48
3.1.5. General willingness-to-pay .................................................. 49
3.1.6. Willingness-to-pay for smartCEM services ................................ 50
3.1.7. Additional items ............................................................... 51
3.1.8. Other items specifically for EV-sharing service .......................... 52
4. MODELLING INFLUENCING FACTORS FOR THE USAGE OF EVS .................. 53
4.1. THE BASICS OF MODELLING ............................................................. 53
4.1.1. How such modelling can be used in smartCEM ........................... 56
D4.4. smartCEM Assessment Tools
09/12/2013 6 Version 1.0
4.2. THE MODEL ............................................................................ 57
4.2.1. First steps setting up the model ............................................ 57
4.3. HOW TO ANALYSE THE MODEL .......................................................... 59
4.3.1. Initial results .................................................................. 61
5. CONCLUSIONS ........................................................................... 63
6. REFERENCES ............................................................................. 65
7. ANNEXES .................................................................................. 67
7.1. USER-QUESTIONNAIRE: GENERAL USER-UPTAKE LONG VERSION FOR ELECTRIC VEHICLES ... 68
7.2. USER-QUESTIONNAIRE GENERAL USER-UPTAKE LONG VERSION FOR ELECTRIC SCOOTERS ... 79
7.3. USER-QUESTIONNAIRE SERVICE USER-UPTAKE LONG VERSION FOR ELECTRIC VEHICLES ..... 90
7.4. USER-QUESTIONNAIRE SERVICE USER-UPTAKE LONG VERSION FOR ELECTRIC SCOOTERS .... 97
7.5. USER-QUESTIONNAIRE GENERAL AND SERVICE USER-UPTAKE FOR HYBRID BUS ........... 103
7.6. USER-QUESTIONNAIRE GENERAL USER-UPTAKE SHORT VERSION FOR ELECTRIC VEHICLES . 106
7.7. USER-QUESTIONNAIRE GENERAL USER-UPTAKE SHORT VERSION FOR ELECTRIC SCOOTERS 107
D4.4. smartCEM Assessment Tools
09/12/2013 7 Version 1.0
List of Figures
Figure 1.- summer and winter carbon emissions profiles (from Robinson et al, 2013) ...... 17
Figure 2.- GHG emissions of different fuels. Source: JEC WTW ................................ 19
Figure 3.- COPERT 4 System Architecture .......................................................... 21
Figure 4.- Cityelec tool: ‘Combustion vehicles’ screen .......................................... 24
Figure 5.- Cityelec tool: ‘Electric vehicles’ screen ............................................... 25
Figure 6.- Cityelec tool: ‘Energy Mix’ screen ..................................................... 25
Figure 7.- Cityelec tool: ‘Results’ screen .......................................................... 26
Figure 8.- sCEET main screen ........................................................................ 29
Figure 9.- sCEET main screen ........................................................................ 31
Figure 10.- ‘Analysis of raw data for electric vehicles’ screen of sCEET ..................... 31
Figure 11.- ‘Analysis of raw data’: MENU .......................................................... 32
Figure 12.- ‘Analysis of raw data’: IMPORT RAW DATA .......................................... 32
Figure 13.- ‘Analysis of raw data: Electric vehicles’: Energy Mix fixed per country ........ 33
Figure 14.- ‘Analysis of raw data: Electric vehicles’: Energy Mix to be defined by the end user ...................................................................................................... 33
Figure 15.- ‘Analysis of raw data: Electric vehicles’: Display of selected (or defined) energy mix .............................................................................................. 33
Figure 16.- ‘Analysis of raw data: Internal Combustion Engine’: Display of selected energy mixes .................................................................................................... 34
Figure 17.- sCEET: Analysis of raw data: ICE – Type of fuel: pre-defined values ............ 35
Figure 18.- sCEET: Analysis of raw data: ICE – Type of fuel: User defined values ........... 35
Figure 19.- sCEET: Analysis of raw data: ICE – Warning screen ................................. 36
Figure 20.- sCEET: ‘Combustion vehicles’ screen ................................................. 36
Figure 21.- sCEET: ‘Electric Vehicles’ screen ..................................................... 37
Figure 22.- sCEET: ‘Energy Mix for pre-defined or user-designed vehicles’ screen ......... 38
Figure 23.- sCEET ‘Results of pre-defined or user-designed vehicles’ screen ................ 38
Figure 24.- sCEET: menu buttons .................................................................... 39
Figure 25.- ‘Combustion vehicle’ screen’s details (Default available vehicles on the left, Vehicle default characteristics example on the right) ........................................... 39
Figure 26.- User defined vehicle inputs ............................................................ 40
Figure 27.- ‘Electric vehicles’ screen’s details (Default available EVs on the left, Custom EV on the right) ............................................................................................ 40
Figure 28.- ‘Energy mix’ screen: Selection of pre-defined Energy mixes ..................... 41
Figure 29.- ‘Energy mix’ screen: display of each energy mix ................................... 41
Figure 30.- .- ‘Energy mix’ screen: User Defined energy Mix ................................... 41
Figure 31.- .- ‘Energy mix’ screen: display of selected energy mixes ......................... 42
Figure 32.- ‘Electric vehicles’ screen’s details (Default available EVs on the left, Custom EV
D4.4. smartCEM Assessment Tools
09/12/2013 8 Version 1.0
on the right) ............................................................................................ 42
Figure 33.- smartCEM user-uptake concept ........................................................ 43
Figure 34.- Technology-Acceptance model (TAM – modified based on Davis, 1993) ......... 45
Figure 35.- Semantic differential of the Van der Laan scale (from Van Der Laan, Heino, & De Waard, 1997) ....................................................................................... 47
Figure 36.- Basic network model with effect relationships of the influence variables ...... 54
Figure 37.- Example of ranking list of variables influencing the willingness to purchase an EV ........................................................................................................ 55
Figure 38.- Influencing portfolio showing active and passive roles in the system ............ 56
Figure 39.- Current interaction model with 45 variables (elements) & four target variables (blue) .................................................................................................... 59
Figure 40.- 10 most important variables influencing the Willingness to use own electric vehicle .................................................................................................. 60
Figure 41.- 10 most important variables influencing the Willingness to use public (car share) electric vehicle ................................................................................ 60
D4.4. smartCEM Assessment Tools
09/12/2013 9 Version 1.0
List of Tables
Table 1. Related smartCEM documents............................................................. 13
Table 2.- smartCEM selection criteria specifications ............................................. 15
Table 3.- smartCEM selection matrix ............................................................... 27
Table 4. General user acceptance items (electric vehicles) .................................... 44
Table 5. User-acceptance items (smartCEM services) / usefulness ............................ 45
Table 6. User-acceptance items (smartCEM services) / ease-of-use ........................... 46
Table 7. General range-anxiety items (electric vehicles) ....................................... 48
Table 8. Range-anxiety items (smartCEM services) ............................................... 48
Table 9. General willingness-to-pay items (electric vehicles) .................................. 49
Table 10. Willingness-to-pay items (smartCEM services) ........................................ 50
Table 11. Additional items concerning charging, the services and vehicle usage ............ 51
Table 12. Relevant items specifically for EV-sharing service ................................... 52
Table 13. 10 most important variables influencing the Willingness to use own electric vehicle including related smartCEM service and potential measurement ..................... 61
Table 14. 10 most important variables influencing the Willingness to use public (car share) electric vehicle including related smartCEM service and potential measurement ........... 62
D4.4. smartCEM Assessment Tools
09/12/2013 10 Version 1.0
Abbreviations
Abbreviation Definition
CDB Central Data Base
CNG Compressed Natural Gas
CO2 Carbon Dioxide
EEA European Environment Agency
EV Electric vehicle
GHG Greenhouse gas
GUI Graphical User Interface
ICE Internal Combustion Engine
LPG Light Petroleum Gas
NHV Net Heating Value
NMVOC Non-Methane Volatile Organic Compounds
OCGT Open Cycle Gas Turbine
MJfuel MegaJoule fuel
QT Questionnaire
sCEET smartCEM CO2 emissions evaluation tool
SoC State of Charge
TTW Tank-to-Wheel
TCO Total Cost of Ownership
VOC Volatile Organic Compounds
WTB Well-to-Battery
WTT Well-to-Tank
WTW Well-to-Wheel
D4.4. smartCEM Assessment Tools
09/12/2013 11 Version 1.0
Executive Summary
D4.4 smartCEM assessment tools is the result of Task 4.4 Tool development. Within this
task, three subtasks have been carried out: subtask 4.4.1 Tools for the evaluation of the
impact on carbon emissions, subtask 4.4.2 Questionnaires for the assessment of the impact
on user acceptance/user experience, and subtask 4.4.3 Modelling influencing factors for
the usage of EVs.
The aim of this deliverable is to present these assessment tools which have been
developed in order to evaluate the performance indicators defined in Task 4.2 and 4.3 to
validate the efficiency and success of the smartCEM services.
The present document is divided into three main parts. The first is related to the tool for
the evaluation of the impact of carbon emissions. This tool determines the amount of
emitted CO2 emissions based on the vehicles’ charging information and energy mixes, in
the case of EVs, and based on fuel consumption and the well-to-tank information in the
case of hybrid buses. Chapter 2 describes the selection process and criteria to determine
how and which existing software (provided by the partners of the smartCEM project) have
been adapted and integrated to generate the smartCEM estimator of CO2 emissions for the
EV fleets, located in the four smartCEM pilot sites.
The second is the development of several questionnaires to determine the user-uptake of
electro-mobility services. The questionnaires assess the usability of the ICT-services
including user acceptance, range-anxiety, willingness to pay and other items related to the
end users’ experience. Chapter 3 describes the questionnaire development, together with
the response scales and the services evaluated with each question.
Finally, and to support final conclusions on smartCEM services and to know the effect of
some indicators in others, a model has been developed. This model is presented in Chapter
4.
The results of this task 4.4., i.e. the present deliverable and the developed tools, directly
feed into task 4.5 Data analysis. In particular, work carried out within subtask 4.4.1 affects
future results obtained in subtask 4.5.1 Fleet carbon footprint data analysis; results from
4.4.2 will influence subtask 4.5.2 Data analysis concerning the impact on user
acceptance/user experience; and results of subtask 4.4.3 will be used by subtask 4.5.3
Data analysis concerning influencing factors for the usage of EVs.
D4.4. smartCEM Assessment Tools
09/12/2013 12 Version 1.0
1. INTRODUCTION
The smartCEM project is focused on the deployment of electro-mobility ICT services that
facilitate and enhance the user experience of electric vehicles (EVs). Through the
integration of these ICT systems, smartCEM intends to increase awareness of electro-
mobility and to encourage the use of EVs as part of everyday life.
Consequently, the smartCEM pilots aim to demonstrate the potential for EVs in urban and
interurban contexts and to encourage the uptake of EVs through advanced and
heterogeneous mobility services (refer to smartCEM deliverable D2.1). In this perspective,
pilots and trials are aimed at testing and understanding consumer patterns and behaviour,
thus influencing this behaviour in order to manage a more effective service.
As a consequence, smartCEM must evaluate the influence of the services in certain
categories, such as environment or user uptake, evaluating the CO2 emissions or
acceptance of EVs, respectively. For this purpose different evaluation tools have been
developed.
1.1. Purpose of the deliverable
The main purpose of the present report is to describe the developed tools and
questionnaires to evaluate the influence of the smartCEM services. Those services will be
evaluated under different categories taking into account several performance indicators
(refer to D4.1 and D4.2). With this purpose the evaluation tools developed and explained
within this report are:
smartCEM CO2 emissions evaluation tool: this tool has been mainly developed to
calculate the released CO2, during baseline’s and functional operation’s phases, by
the recharging, consumed fuel during a trip and refuelling.
User uptake questionnaires: these questionnaires have been developed to assess
how users accept and use EVs and the smartCEM services. The questionnaires cover
three main concepts: acceptance, range-anxiety and willingness-to-pay.
The model: finally, the developed model to support smartCEM is explained. This
model allows smartCEM partners to look directly at which performance indicators
have the strongest influence on user uptake and then to decide which means would
be most suitable for tracking and evaluating these performance indicators and
especially useful in setting priorities for data collection and evaluation.
1.2. Structure of the document
The main body of the present document is divided into three chapters:
Chapter 2: Tool for the evaluation of the impact of carbon emissions, related to
objective measures, presents the followed procedure to establish the requirements
of smartCEM CO2 emissions evaluation tool. As well, this chapter presents the
selection process and criteria to determine how and which existing software
(provided by the partners of smartCEM project), have been adapted and integrated
D4.4. smartCEM Assessment Tools
09/12/2013 13 Version 1.0
to generate the smartCEM estimator of CO2 emissions for the EV fleets, located in
the four smartCEM pilot sites.
Chapter 3: Questionnaires for the assessment of user-uptake, related to subjective
measures, presents the development process and the questionnaires to be used in
order to evaluate the users’ uptake.
Chapter 4: Modelling influencing factors for the usage of EVs presents the
developed model to support smartCEM, e. g. support ‘developing’ the services (how
do the services influence EV-uptake) or prioritizing the performance indicators as
well as the evaluation criteria.
Finally, some relevant conclusions from the evaluation tools and the best practices to be
used are included at the end of the document. Annexes include further information on
document discussions and contents.
1.3. Related smartCEM documents
This section contains internal documents produced within the smartCEM project. All
documents are available for download on the smartCEM project collaboration portal on
ProjectPlace: http://www.projectplace.com/. All partners in the consortium have access
to the portal, whose account management is owned by ERTICO.
Table 1. Related smartCEM documents
FINALISED smartCEM DELIVERABLES
Reference Name Version
D4.1 Evaluation framework v2.0
D4.2 Evaluation criteria and performance indicators v2.0
D4.3 smartCEM experimental design v2.0
D6.2 Agreed set of indicators v1.0
FUTURE smartCEM DELIVERABLES
Reference Name Version
D4.5 Results of the evaluation N/A
D3.2 Common Data Exchange Protocol for smartCEM N/A
D4.4. smartCEM Assessment Tools
09/12/2013 14 Version 1.0
2. Tool for the evaluation of the impact of carbon emissions
In this chapter, the smartCEM CO2 emissions evaluation tool is presented. The aim of this
tool is to evaluate the impact of carbon emissions derived from the battery charge - in the
case of EVs- and the fuel consumption - in the case of the hybrid bus.
The developed tool is based on the current tools or methodologies developed and/or used
by Newcastle University (UNEW), IDIADA, and Tecnalia Research and Development
(Tecnalia). Within this chapter, a brief description of the available tools from UNEW and
Tecnalia is included.
Furthermore, IDIADA uses a tool to estimate the CO2 emissions derived from fuel
consumption of internal combustion engine (ICE) vehicles. This tool will be also used to
develop an additional study, in order to compare the carbon emissions produced by EV
scooters versus equivalent ICE scooters, i.e. with the estimation of the CO2 emitted by
conventional motorcycles, doing the same trips as logged in Barcelona.
The following section presents the selection process and the obtained criteria in order to
select the required features of each tool to be integrated and adapted for the smartCEM
evaluation analysis. The description, functionalities and usage of the developed smartCEM
CO2 emissions evaluation tool are thus also explained within this chapter.
2.1. Tool selection process and criteria
As stated above, the smartCEM project needs a tool or procedure to take the energy (and
fuel, in the case of the hybrid bus of the Gipuzkoa pilot site) consumption measured
through smartCEM tests and to estimate ‘Well-to-Battery/Tank’ (WTB/T) CO2 emissions
through energy mix on a country-by-country basis. For the hybrid bus within the Gipuzkoa
pilot site, the carbon emissions’ estimation from driving cycles in fossil fuel vehicles is also
required.
As a consequence, expected features of the smartCEM CO2 emissions estimation should be
as follows:
CO2 produced during the use of the vehicle, based on the fuel consumption
obtained from the smartCEM baseline and operational phase’s data sets (this is only
required for the hybrid bus).
The relationship between the fuel consumption and the CO2 production must
be estimated according to the literature.
CO2 produced by WTB, i.e. the CO2 release to produce the required energy for the
batteries’ recharging. The main features related to this requirement are as follows:
Energy mix: Latest data from European countries of energy production by
generation technology.
Data of CO2/kW-h emissions, by generation technology, when generating
electric energy. Customization option of the energy mix is needed.
D4.4. smartCEM Assessment Tools
09/12/2013 15 Version 1.0
Energy consumption obtained from smartCEM tests.
Graphic and numerical results.
Selection criteria
Table 2 shows the requirements and each criterion defined, in order to analyse the
currently available tools, to determine which parts of the mentioned applications will be
used to generate the module of CO2 emissions estimation for the smartCEM project.
Table 2.- smartCEM selection criteria specifications
REQUIREMENT CRITERION
Energy Mix
Scope: to be established for EU27, 4CIP countries or only for smartCEM countries
Level of detail:
Average energy mix by country and year
Energy mix by time of the day for each country to estimate more accurately the produced CO2
CO2 emissions derived from hybrid bus
CO2 generated by fuel consumed during the driving cycles
CO2 generated WTT (fuel production cycle)
Flexibility for integration with measures format
CO2 calculation should be done by trip, by week, by month, total, according to representation needs
Flexible enough for calculation through, e.g. excel sheet
Sources of information
Bibliography/literature
References of use given
Results Able to be exported for graphic representation
Able to be exported for other applications, such as Excel.
2.2. Approaches
Within this section, the methodologies or tools provided by University of Newcastle, IDIADA
and Tecnalia are presented. These are:
A methodology for calculating the carbon content of electricity over a 24 hour
period,
The estimation of the released CO2 coming from the generation and distribution of
fuel, i.e. the WTT procedure,
The COPERT 4 software tool to calculate road transport emissions (combustion
vehicles) and,
D4.4. smartCEM Assessment Tools
09/12/2013 16 Version 1.0
The Cityelec tool, to estimate the CO2 emissions derived from the usage of EVs
and/or combustion vehicles.
Then, and taking into account this information, the selection matrix will be provided, in
order to know which parts could be reused for the smartCEM CO2 emissions evaluation tool
development.
2.2.1. Half-Hourly Calculation of Electricity Carbon Content
UNEW has developed a methodology for calculating the carbon content of electricity over a
24 hour period. It requires:
Power generation data
A power transmission loss factor
Carbon emissions factors for the carbon content of each electricity generation
power source
In the UK the power sources for electricity generation are coal, natural gas, nuclear,
imports, oil and open cycle gas turbine (OCGT), pumped storage, hydro and wind.
Data supplied in 2012 provide half-hourly electricity generation figures for each power
source. The power transmission loss factor is quoted as 1.10.
The carbon emissions factors in gCO2/KWh are:
Nuclear 0
Coal 910
Gas 390
Other 540
Renewables 0
Not all sources of power generation have their emissions quoted. Wind and hydro were
classified as renewable. Oil and OCGT, imports and pumped storage were classified as
‘other’.
In the UK the data required for the methodology is available from the Department of
Energy and Climate Change (for further information refer to
https://www.gov.uk/government/organisations/department-of-energy-climate-change).
Tool description
For each of the eight power sources total emissions can be calculated by multiplying the
emissions factor by the total energy generation in a half-hourly time interval. The sum of
the eight emissions totals for each power source gives the total emissions in that half-
hourly time interval. This is then divided by the total output to give the average emissions
D4.4. smartCEM Assessment Tools
09/12/2013 17 Version 1.0
in this half hourly interval. This process is then repeated for each half hourly interval
throughout the day to give a typical carbon content of electricity profile across a 24 hour
period.
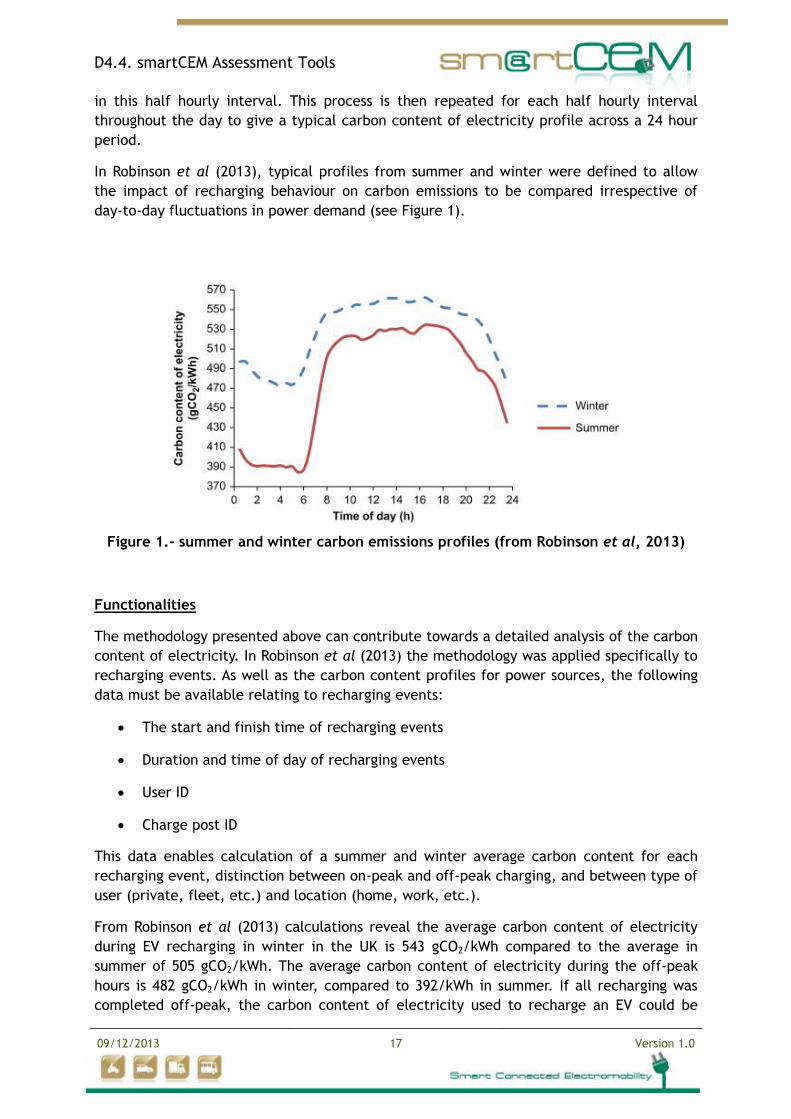
In Robinson et al (2013), typical profiles from summer and winter were defined to allow
the impact of recharging behaviour on carbon emissions to be compared irrespective of
day-to-day fluctuations in power demand (see Figure 1).
Figure 1.- summer and winter carbon emissions profiles (from Robinson et al, 2013)
Functionalities
The methodology presented above can contribute towards a detailed analysis of the carbon
content of electricity. In Robinson et al (2013) the methodology was applied specifically to
recharging events. As well as the carbon content profiles for power sources, the following
data must be available relating to recharging events:
The start and finish time of recharging events
Duration and time of day of recharging events
User ID
Charge post ID
This data enables calculation of a summer and winter average carbon content for each
recharging event, distinction between on-peak and off-peak charging, and between type of
user (private, fleet, etc.) and location (home, work, etc.).
From Robinson et al (2013) calculations reveal the average carbon content of electricity
during EV recharging in winter in the UK is 543 gCO2/kWh compared to the average in
summer of 505 gCO2/kWh. The average carbon content of electricity during the off-peak
hours is 482 gCO2/kWh in winter, compared to 392/kWh in summer. If all recharging was
completed off-peak, the carbon content of electricity used to recharge an EV could be
D4.4. smartCEM Assessment Tools
09/12/2013 18 Version 1.0
reduced by approximately 11% in winter and 22% in summer (depending on precise start
and finish times of the recharging events).
The carbon content of recharging an EV was generally higher in winter and lower in
summer across all events monitored. This is because the higher demand for power in
winter creates additional demand for power which is met predominantly through
generation from coal.
2.2.2. Well-to-Tank
In order to obtain the Well-to-Tank (WTT) CO2 equivalent emissions of the different fuels,
it should be considered that fuels are made through different production pathways (from
energy feedstock recovery, i.e. wells, to the fuel before being used by the vehicle, i.e.
tank). This combination of steps necessary to turn a resource into a fuel and bring that fuel
to a vehicle is defined as a WTT pathway. This production consists of different steps:
Production and conditioning at source includes all operations required to extract,
capture or cultivate the primary energy source. In most cases, the extracted or
harvested energy carrier requires some form of treatment or conditioning before it
can be conveniently, economically and safely transported.
Transformation at source is used for those cases where a major industrial process is
carried out at or near the production site of the primary energy (e.g. gas-to-liquids
plant).
Transportation to EU is relevant to energy carriers which are produced outside the
EU and need to be transported over long distances.
Transformation in EU includes the processing and transformation that takes place
near the market place in order to produce a final fuel according to an agreed
specification (e.g. oil refineries or hydrogen reformers).
Conditioning and distribution relates to the final stages required to distribute the
finished fuels from the point of import or production to the individual refuelling
points (e.g. road transport) and available to the vehicle tank (e.g. compression in
the case of natural gas).
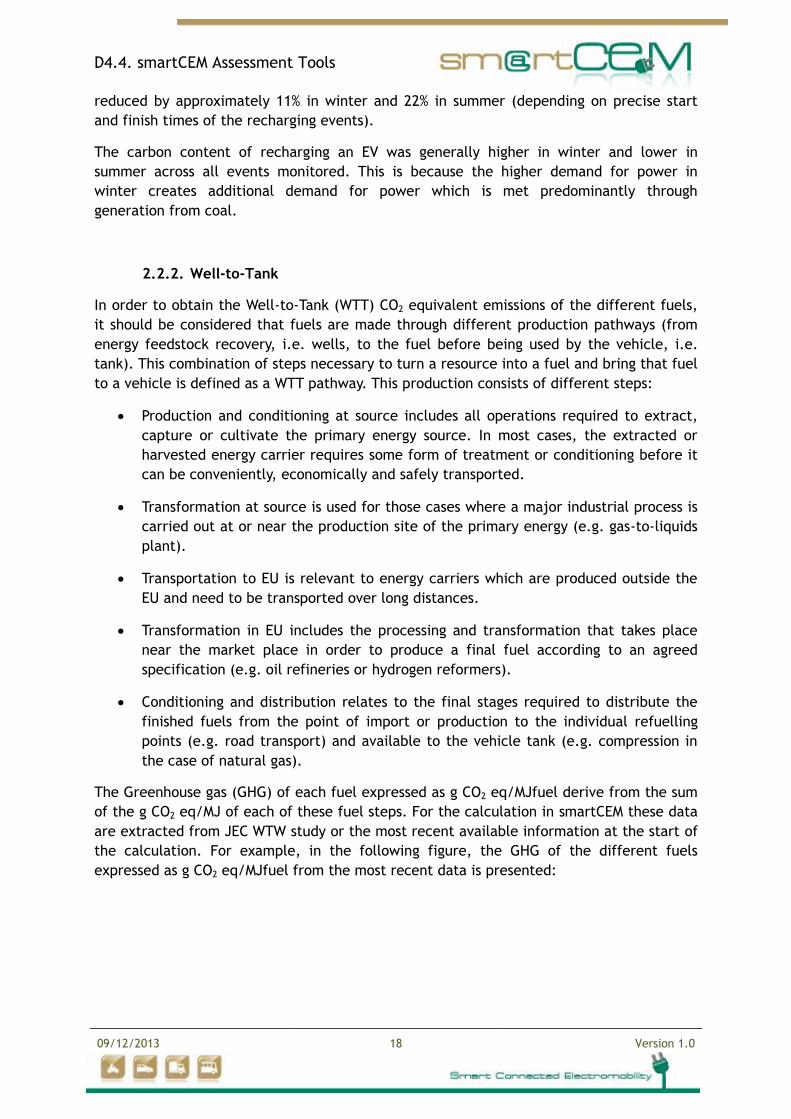
The Greenhouse gas (GHG) of each fuel expressed as g CO2 eq/MJfuel derive from the sum
of the g CO2 eq/MJ of each of these fuel steps. For the calculation in smartCEM these data
are extracted from JEC WTW study or the most recent available information at the start of
the calculation. For example, in the following figure, the GHG of the different fuels
expressed as g CO2 eq/MJfuel from the most recent data is presented:
D4.4. smartCEM Assessment Tools
09/12/2013 19 Version 1.0
Figure 2.- GHG emissions of different fuels. Source: JEC WTW
In this JEC WTW study, the main calculations have been performed by a software program
developed by LBST (L-B-System Technic) which combines a database for all input data and
their references with an algorithm for the rigorous calculation of the total energy and GHG
associated with a given pathway, including feedback loops. The main considerations of
each fuel to estimate the g CO2 eq /MJfuel are the following:
Diesel fuel: Crude oil from typical EU supply, transport by sea, refining in EU
(marginal production), typical EU distribution and retail.
Gasoline: Crude oil from typical EU supply, transport by sea, refining in EU
(marginal production), typical EU distribution and retail.
CNG: Compressed natural gas, transport to EU by pipeline or Middle East,
distribution through gas high pressure trunk lines and low pressure grid,
compression to CNG at retail point.
With these obtained values in CO2 eq/MJfuel and the fuel consumption we can estimate
the WTT emissions in different vehicles and fuels.
The formula to obtain this estimation is:
If the density and the net heating value (NHV) are available, the CO2 emissions are
obtained as follows:
CO2 emissions (g CO2) = Fuel consumed (l)* (Density (kg/m3)/1000) * NHV (MJ/kg) *
X g CO2/MJ,
Where X is: X= 13.04505556 g CO2/MJ for petrol and X= 14.62463889 g CO2/MJ for
diesel.
If the density and the net heating value (NHV) are not available, these values
should be estimated.
D4.4. smartCEM Assessment Tools
09/12/2013 20 Version 1.0
For petrol: Estimated density is 747.5 kg/m3 and NHV is 42 MJ/kg, and the
resultant formula is:
CO2 emissions (g CO2) = Fuel consumed (l)*409.5 (g CO2/l)
For diesel: Estimated density is 832.5 kg/m3 and NHV is 43 MJ/kg, and the
resultant formula is:
CO2 emissions (g CO2) = Fuel consumed (l)*523.5 (g CO2/l)
As an example, if we have a bus with a fuel consumption of 15 l of petrol, and the density
and net heating value (NHV) of this petrol are not available, we are going to consider a
WTT emission of this petrol of 6142.5 g CO2.
2.2.3. COPERT 4
COPERT 4 is the fourth update of the initial version COPERT 85 (1989). It is an informatics
program coming from the WG CORINAIR (CORe INventory of AIR emissions) and a
collaborative effort and draws from several large-scale European activities:
The MEET project (Methodologies to Estimate Emissions from Transport), a European
Commission sponsored project (1996‐1998)
The COST 319 action on the Estimation of Emissions from Transport (1993‐1998)
The PARTICULATES project (Characterization of Exhaust Particulate Emissions from
Road Vehicles), a European Commission project (2000‐2003)
The ARTEMIS project (Assessment and Reliability of Transport Emission Models and
Inventory Systems), a European Commission project (2000‐2007)
A joint JRC/CONCAWE/ACEA project on fuel evaporation from gasoline vehicles
(2005‐2007)
The development of COPERT is coordinated by the European Environment Agency (EEA), in
the framework of the activities of the European Topic Centre for Air Pollution and Climate
Change Mitigation. The European Commission's Joint Research Centre manages the
scientific development of the model. COPERT has been developed for official road
transport emission inventory preparation in EEA member countries. However, it is
applicable to all relevant research, scientific and academic applications. The use of a
software tool to calculate road transport emissions allows for a transparent and
standardized, hence consistent and comparable, data collecting and emissions reporting
procedure, in accordance with the requirements of international conventions and protocols
and EU legislation.
D4.4. smartCEM Assessment Tools
09/12/2013 21 Version 1.0
Tool description
COPERT 4 is a software tool that works on Microsoft Windows platform used world-wide to
calculate air pollutant and greenhouse gas emissions from road transport. The emissions
calculated include regulated (i.e. CO, NOx, VOC, PM) and unregulated pollutants (i.e. N2O,
NH3, SO2, NMVOC speciation) and fuel consumption. CO2 emissions are based on fuel
consumption. The exhaust emissions are dependent on the activity (e.g. number of
vehicles, distance travelled), hot emissions (e.g. technology/emission standard, mean
travelling speed) and cold emissions (e.g. technology/ emission standard, mean travelling
speed, ambient temperature and mean trip distance).
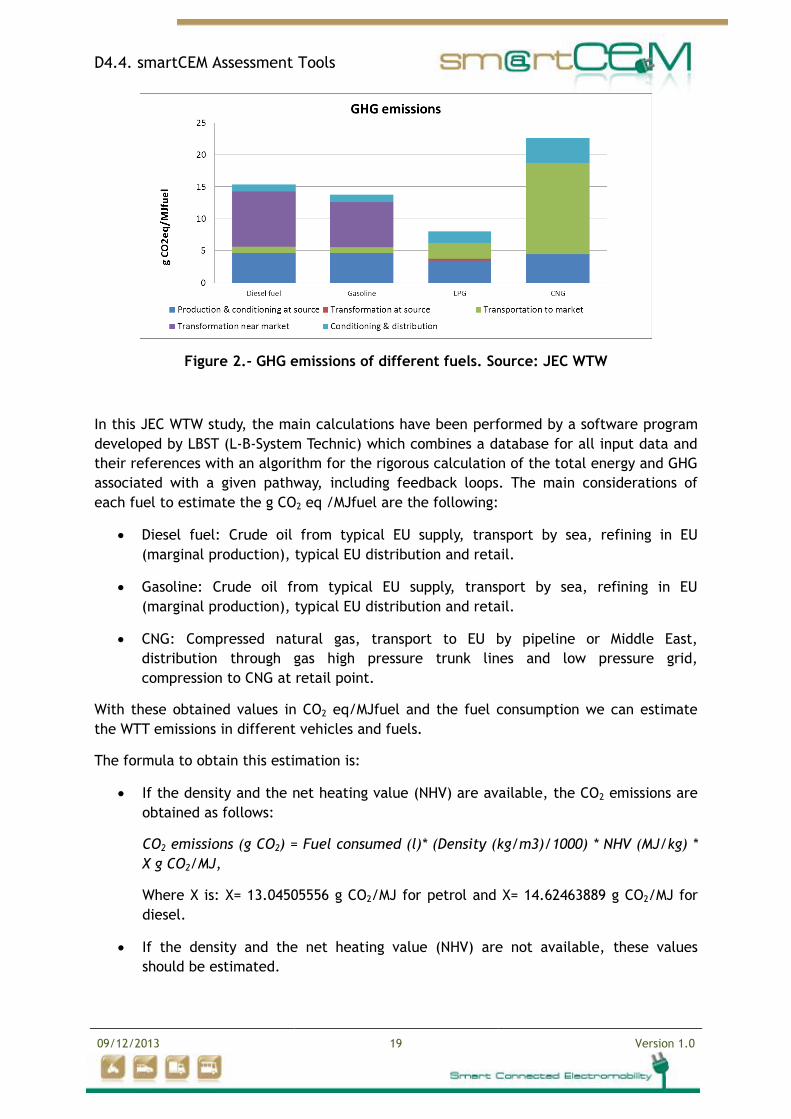
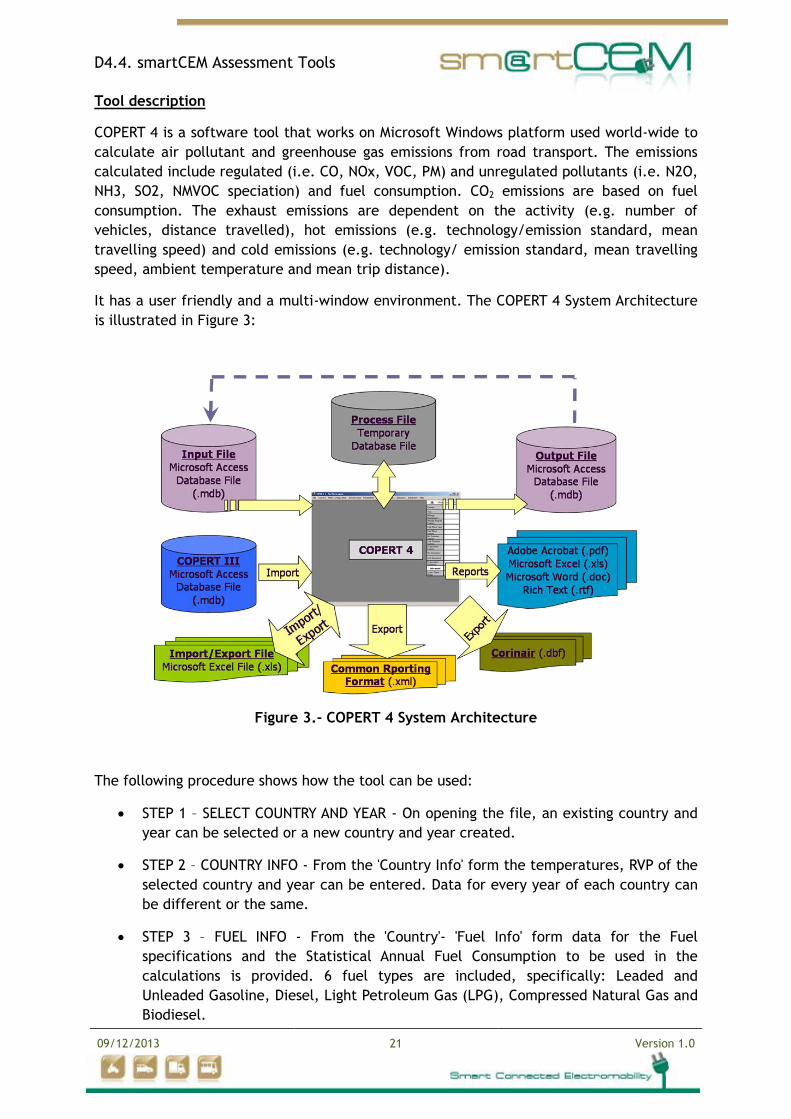
It has a user friendly and a multi-window environment. The COPERT 4 System Architecture
is illustrated in Figure 3:
Figure 3.- COPERT 4 System Architecture
The following procedure shows how the tool can be used:
STEP 1 – SELECT COUNTRY AND YEAR - On opening the file, an existing country and
year can be selected or a new country and year created.
STEP 2 – COUNTRY INFO - From the 'Country Info' form the temperatures, RVP of the
selected country and year can be entered. Data for every year of each country can
be different or the same.
STEP 3 – FUEL INFO - From the 'Country'- 'Fuel Info' form data for the Fuel
specifications and the Statistical Annual Fuel Consumption to be used in the
calculations is provided. 6 fuel types are included, specifically: Leaded and
Unleaded Gasoline, Diesel, Light Petroleum Gas (LPG), Compressed Natural Gas and
Biodiesel.
D4.4. smartCEM Assessment Tools
09/12/2013 22 Version 1.0
STEP 4 – FLEET CONFIGURATION - The next step is to configure the fleet. A list of
the available vehicle categories is provided and the desired vehicles are selected.
Each year of every country has a different fleet configuration. However a
configuration of one year to others of the same country can be applied.
STEP 5 –Data can be directly input or imported from Microsoft Excel.
STEP 6 – EMISSIONS - The next step is to calculate emissions. The 'Emissions' - 'Total
Emissions' form is opened and each button of the 'Recalculate' box pressed for every
Emission category required (Hot, Cold, or Evaporation). All the emissions and
emission factors can be calculated.
STEP 7 –Data can be exported to Microsoft Excel.
STEP 8 –Reports and Charts can be created.
Functionalities
Thanks to the COPERT 4 emissions estimation tool, the carbon emissions of different types
of vehicles can be calculated. In particular, the functionalities of the mentioned tool are as
follows:
Select between different fuels: Leaded and Unleaded Gasoline, Diesel, Light
Petroleum Gas (LPG), Compressed Natural Gas and Biodiesel.
Select between different vehicle categories:
Passenger Cars
Gasoline (<1.4 l, 1.4-2.0 l, >2.0 l)
Diesel (<2.0 l, >2.0 l)
LPG
Light Duty Vehicles (Trucks & Vans)
Gasoline
Diesel
Heavy Duty Vehicles
Gasoline
Diesel (11 weight categories)
Power Two Wheelers
Mopeds (< 50 cc)
Motorcycles (2-stroke, <250 cc, 250-750 cc, >750 cc)
D4.4. smartCEM Assessment Tools
09/12/2013 23 Version 1.0
Select between different vehicle technologies:
Passenger Cars (PRE ECE, ECE 15/…, PC Euro 1, 2, 3, 4, 5 and 6)
Light Duty vehicles (Conventional, LD Euro 1, 2, 3, 4, 5 and 6)
HDV, buses ( HD Euro I, II, III, IV, V and VI)
Mopeds and Motorcycles ( Conventional, Euro 1 and 2 (and 3 only for
motorcycles))
Estimate the CO2 emissions based on fuel consumption
2.2.4. CO2 emissions estimation tool of Cityelec
As a starting point, in order to develop a CO2 estimation tool to evaluate the improvements
obtained from using smartCEM applications, it is proposed to adapt and increase the
functionalities of the Cityelec CO2 emissions estimation tool. This tool has been developed
by Tecnalia, within the Spanish national project called Cityelec.
The Cityelec project, supported by the Spanish Ministry of Science and Innovation, focused
on the research of key elements both in vehicle and infrastructure for new concepts
(sometimes radical) of electrified mobility in the urban environment. The main objective
was to define the Cityelec system, which allows personal mobility with minimal carbon
footprint by means of the following:
Fleet of light EVs (Scooters, city cars and small buses)
Infrastructure elements: Urban transformer station with energy storage capability,
local urban energy generators (photovoltaic, windmill, etc.)
New concepts for management of electrical power from renewable sources on the
grid, focused on maximum storage of renewable energy for mobility.
Tool description
The Cityelec CO2 emissions evaluation tool is a module of software, which allows
estimating the CO2 emissions produced by different vehicle fleets, i.e. market electric
vehicles, such as Smart Electric, Reva, iMIEV, etc., and an EV customized by the user, or
hybrid and combustion vehicles under different range segments, for instance MINI One D,
Toyota Prius Eco, BMW X5, etc. Together with the selected type of vehicle, this tool also
simulates emissions based on the vehicle characteristics (power, weight, Cx, etc.), an
estimated driving cycle and the estimated daily energy mix of a maximum of three specific
countries of 27 European countries, during each simulation. After calculating the fleet
carbon footprint this estimation can be displayed to users (driver, fleet manager, operator,
mobility public authority, etc.).
D4.4. smartCEM Assessment Tools
09/12/2013 24 Version 1.0
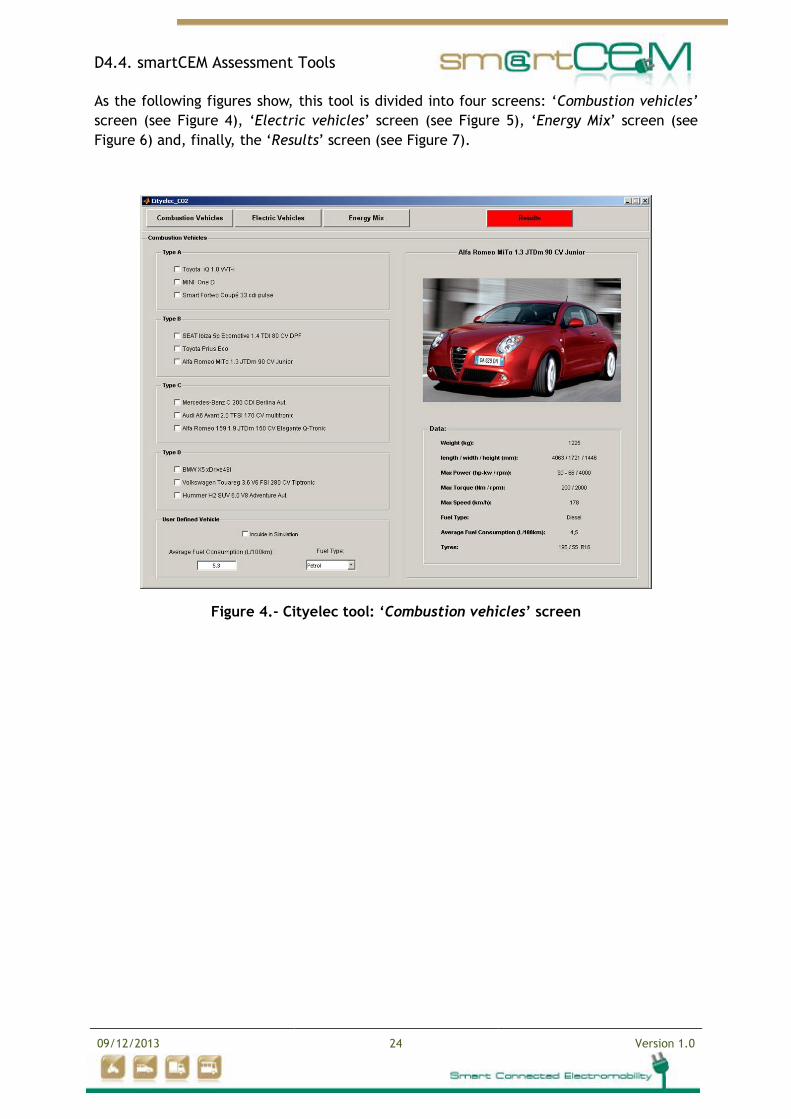
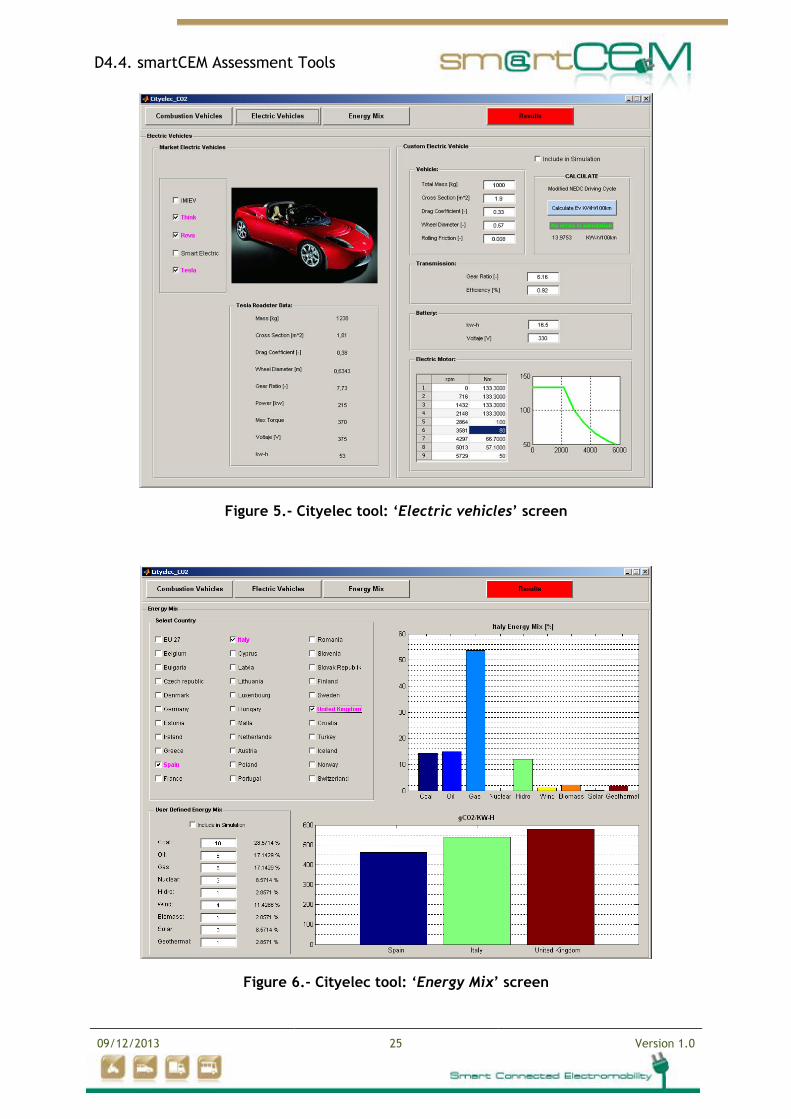
As the following figures show, this tool is divided into four screens: ‘Combustion vehicles’
screen (see Figure 4), ‘Electric vehicles’ screen (see Figure 5), ‘Energy Mix’ screen (see
Figure 6) and, finally, the ‘Results’ screen (see Figure 7).
Figure 4.- Cityelec tool: ‘Combustion vehicles’ screen
D4.4. smartCEM Assessment Tools
09/12/2013 25 Version 1.0
Figure 5.- Cityelec tool: ‘Electric vehicles’ screen
Figure 6.- Cityelec tool: ‘Energy Mix’ screen
D4.4. smartCEM Assessment Tools
09/12/2013 26 Version 1.0
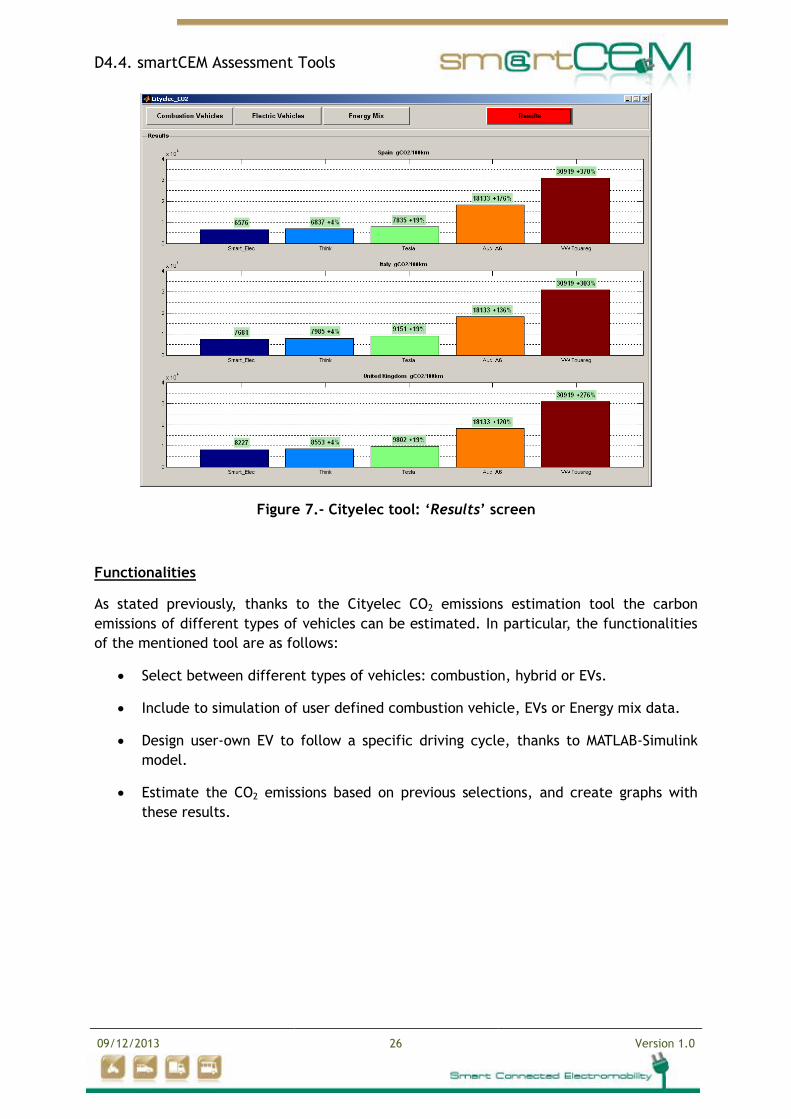
Figure 7.- Cityelec tool: ‘Results’ screen
Functionalities
As stated previously, thanks to the Cityelec CO2 emissions estimation tool the carbon
emissions of different types of vehicles can be estimated. In particular, the functionalities
of the mentioned tool are as follows:
Select between different types of vehicles: combustion, hybrid or EVs.
Include to simulation of user defined combustion vehicle, EVs or Energy mix data.
Design user-own EV to follow a specific driving cycle, thanks to MATLAB-Simulink
model.
Estimate the CO2 emissions based on previous selections, and create graphs with
these results.
D4.4. smartCEM Assessment Tools
09/12/2013 27 Version 1.0
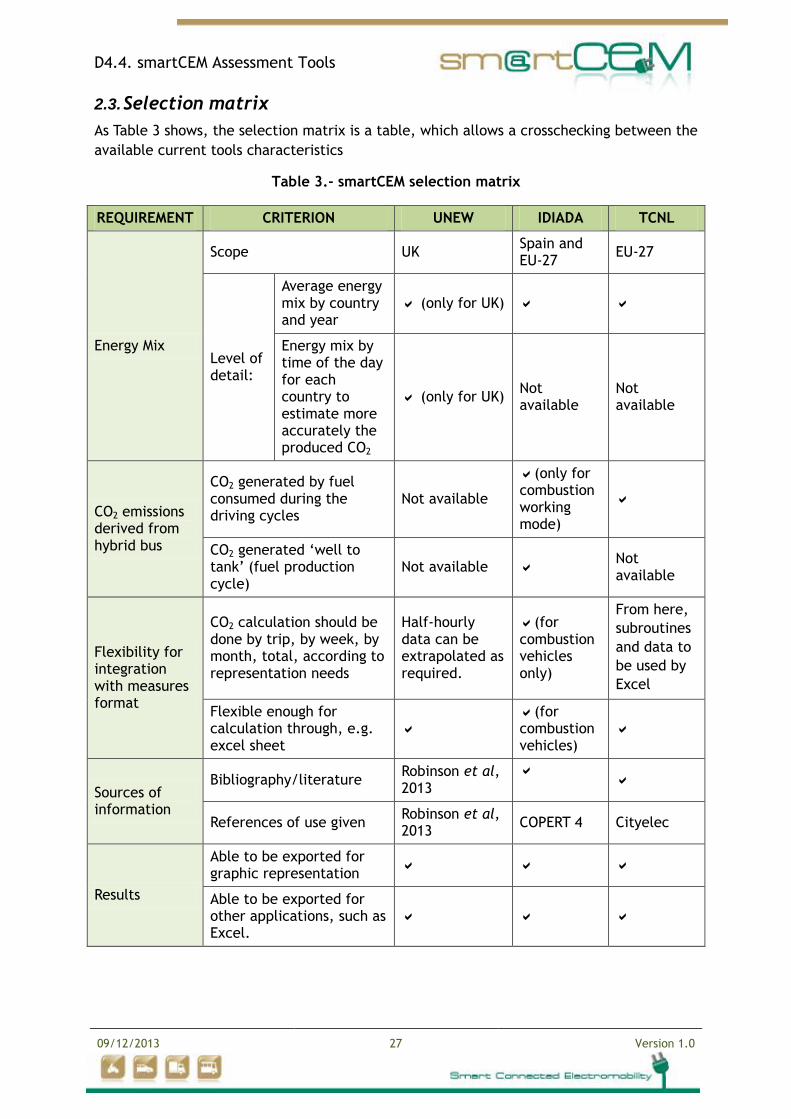
2.3. Selection matrix
As Table 3 shows, the selection matrix is a table, which allows a crosschecking between the
available current tools characteristics
Table 3.- smartCEM selection matrix
REQUIREMENT CRITERION UNEW IDIADA TCNL
Energy Mix
Scope UK Spain and EU-27
EU-27
Level of detail:
Average energy mix by country and year
(only for UK)
Energy mix by time of the day for each country to estimate more accurately the produced CO2
(only for UK) Not available
Not available
CO2 emissions derived from hybrid bus
CO2 generated by fuel consumed during the driving cycles
Not available
(only for combustion working mode)
CO2 generated ‘well to tank’ (fuel production cycle)
Not available Not available
Flexibility for integration with measures format
CO2 calculation should be done by trip, by week, by month, total, according to representation needs
Half-hourly data can be extrapolated as required.
(for combustion vehicles only)
From here,
subroutines
and data to
be used by
Excel
Flexible enough for calculation through, e.g. excel sheet
(for combustion vehicles)
Sources of information
Bibliography/literature Robinson et al, 2013
References of use given Robinson et al, 2013
COPERT 4 Cityelec
Results
Able to be exported for graphic representation
Able to be exported for other applications, such as Excel.
D4.4. smartCEM Assessment Tools
09/12/2013 28 Version 1.0
Based on the provided information by this matrix, the usage that has been done of the
available tools or methodologies to develop the smartCEM CO2 emissions evaluation tool
has been as follows:
Cityelec tool has been used as a software architecture reference. As well, it has
been used to estimate the CO2 emissions generated by the pre-defined or user-
defined vehicles.
In order to estimate the CO2 emissions derived from the WTT process, the explained
formulas have been used.
Finally, to evaluate the CO2 emissions generated by TTW process, the COPERT 4 has
been used as starting point.
2.4. SmartCEM CO2 emissions evaluation tool (sCEET)
In the following section the developed tool for smartCEM project, based on available tools,
is presented. The aim of this tool is to estimate the released CO2 during baseline and
functional operation, i.e. without and with smartCEM applications running, in order to
evaluate the improvements obtained through the smartCEM project in terms of CO2
emissions reduction.
For this purpose, partners involved in subtask 4.4.1 will provide the developed tool to the
Pilot Site leaders, in order that they distribute the tools to the data analysers. With this
tool, they will be able to estimate the CO2 emissions generated during baseline and
functional operation phases. Then, data analysers may compare the obtained results and
apply the appropriate statistical method to evaluate the hypotheses and establish success
criteria (refer to smartCEM deliverables D4.1, D4.2 and D4.3 for further information).
2.4.1. Tool brief description
The smartCEM CO2 emissions evaluation tool (henceforward sCEET) is a module of
software, which allows estimation of the CO2 emissions produced by the production of the
energy required for EVs recharging or by the hybrid bus, based on the acquired data in
each pilot site i.e. Newcastle, Barcelona, Gipuzkoa – Donosti, and Reggio Emilia. Through
the use of smartCEM data sets or others with a similar format, sCEET allows the user to
estimate the CO2 emissions for the CIP project countries i.e. Ireland, United Kingdom,
Netherlands, Germany, France, Italy, Slovenia, Spain and/or Portugal. Finally, using raw
data from smartCEM or the CIPs, it is possible to obtain the CO2 emissions estimation using
the Energy Mix from other European countries as an approximation for any selected
country.
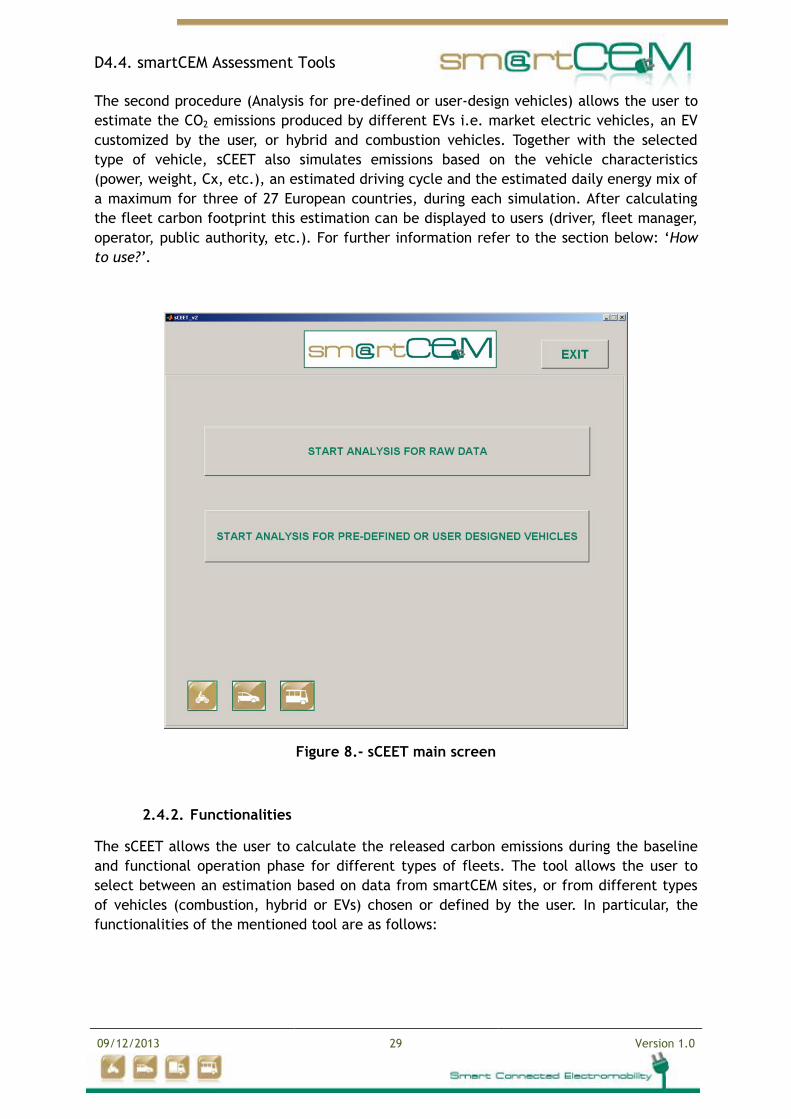
The GUI of sCEET is divided into several screens. Figure 8 shows the main screen of the
application. Through this screen, the end user can select between two analysis procedures.
The first procedure (Analysis from raw data) allows the user to estimate the CO2 emissions
based on the acquired data in each pilot site.
D4.4. smartCEM Assessment Tools
09/12/2013 29 Version 1.0
The second procedure (Analysis for pre-defined or user-design vehicles) allows the user to
estimate the CO2 emissions produced by different EVs i.e. market electric vehicles, an EV
customized by the user, or hybrid and combustion vehicles. Together with the selected
type of vehicle, sCEET also simulates emissions based on the vehicle characteristics
(power, weight, Cx, etc.), an estimated driving cycle and the estimated daily energy mix of
a maximum for three of 27 European countries, during each simulation. After calculating
the fleet carbon footprint this estimation can be displayed to users (driver, fleet manager,
operator, public authority, etc.). For further information refer to the section below: ‘How
to use?’.
Figure 8.- sCEET main screen
2.4.2. Functionalities
The sCEET allows the user to calculate the released carbon emissions during the baseline
and functional operation phase for different types of fleets. The tool allows the user to
select between an estimation based on data from smartCEM sites, or from different types
of vehicles (combustion, hybrid or EVs) chosen or defined by the user. In particular, the
functionalities of the mentioned tool are as follows:
D4.4. smartCEM Assessment Tools
09/12/2013 30 Version 1.0
DATA COMING FROM smartCEM PS:
Scope: the tool allows the user to select between different countries to estimate
the CO2 emissions based on the logged data in an Excel file1. These countries are
those included in the European Union, including the smartCEM and CIP projects
countries, as well as the other member states.
Energy mix - Level of detail: the energy mix available is for EU-28 countries and on
a monthly basis (maximum one year).
CO2 emissions for hybrid bus: the smartCEM validation tool can estimate the CO2
emissions derived from the fuel consumed, i.e. from the Tank-to-Wheel (TTW)and
from the WTT process.
Measures formats and results: the tool estimates the emissions and provides an .xlsx
file with the results, i.e. four new columns included in the original file: CO2
emissions derived from EVs, CO2 emissions derived from WTT process, from TTW
process and, finally, the total amount. The resolution of those results depends on
the format of the input data.
DATA COMING FROM SPECIFIC VEHICLES (pre-defined or designed by user):
Select between different types of vehicles: combustion, hybrid or EVs.
Include to simulation of user defined combustion vehicle, EVs or Energy mix data.
Design user-own EV to follow a specific driving cycle, thanks to MATLAB-Simulink
model.
Estimate the CO2 emissions based on previous selections.
2.4.3. How to use?
Following the philosophy of the previous tools, the sCEET is divided into two main parts.
The first one allows the user to estimate the CO2 emissions, analysing the datasets
obtained from the pilot sites. The second one is used to analyse these emissions, starting
from the information obtained from pre-defined vehicles or user-designed vehicles. As
Figure 8 and Figure 9 show, the main screen of the sCEET is composed by two main push-
buttons, as well as the EXIT button, used to close the application. These main buttons
allow the user to select between the type of analysis he or she wants to perform.
1 If required, the sCEET tool can be updated in order to be able to manage other types of files, such as .csv.
D4.4. smartCEM Assessment Tools
09/12/2013 31 Version 1.0
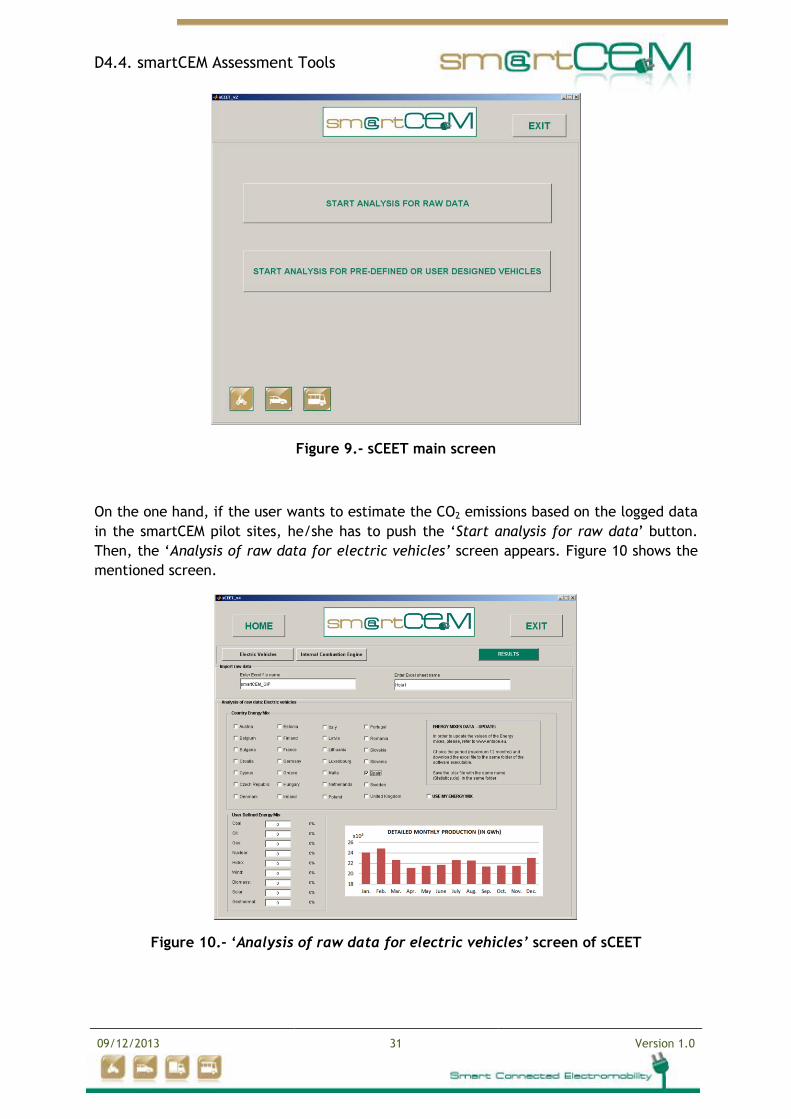
Figure 9.- sCEET main screen
On the one hand, if the user wants to estimate the CO2 emissions based on the logged data
in the smartCEM pilot sites, he/she has to push the ‘Start analysis for raw data’ button.
Then, the ‘Analysis of raw data for electric vehicles’ screen appears. Figure 10 shows the
mentioned screen.
Figure 10.- ‘Analysis of raw data for electric vehicles’ screen of sCEET
D4.4. smartCEM Assessment Tools
09/12/2013 32 Version 1.0
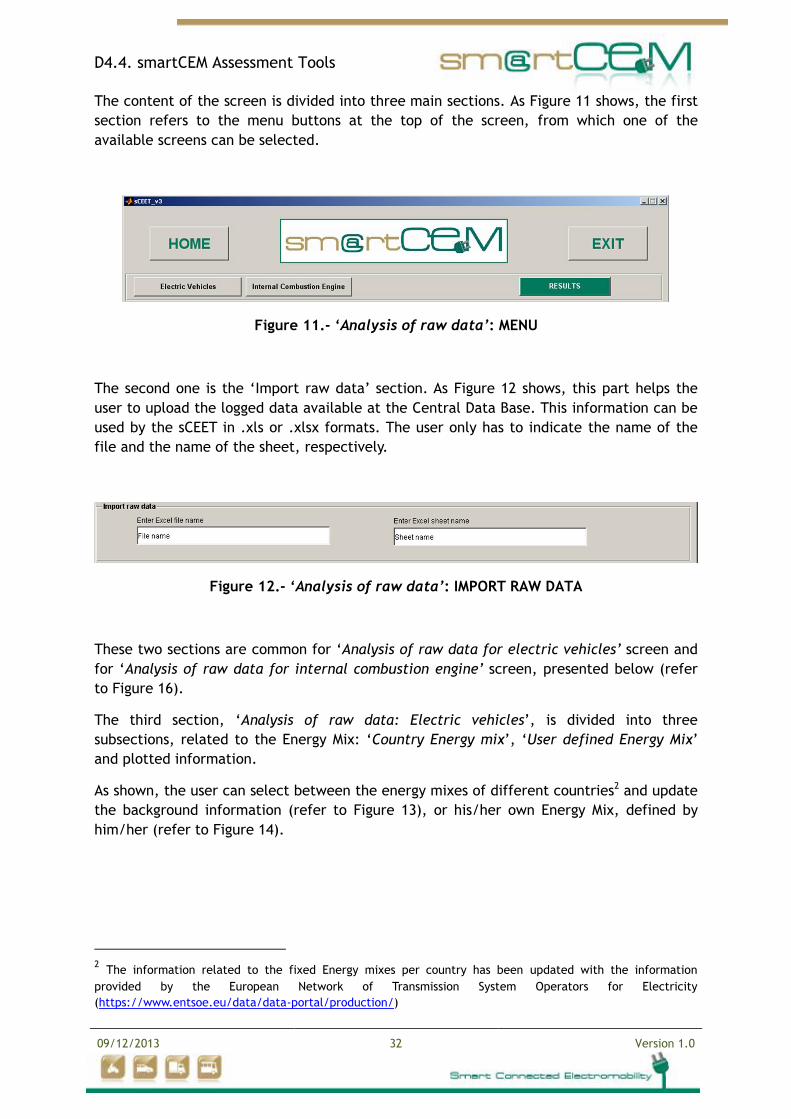
The content of the screen is divided into three main sections. As Figure 11 shows, the first
section refers to the menu buttons at the top of the screen, from which one of the
available screens can be selected.
Figure 11.- ‘Analysis of raw data’: MENU
The second one is the ‘Import raw data’ section. As Figure 12 shows, this part helps the
user to upload the logged data available at the Central Data Base. This information can be
used by the sCEET in .xls or .xlsx formats. The user only has to indicate the name of the
file and the name of the sheet, respectively.
Figure 12.- ‘Analysis of raw data’: IMPORT RAW DATA
These two sections are common for ‘Analysis of raw data for electric vehicles’ screen and
for ‘Analysis of raw data for internal combustion engine’ screen, presented below (refer
to Figure 16).
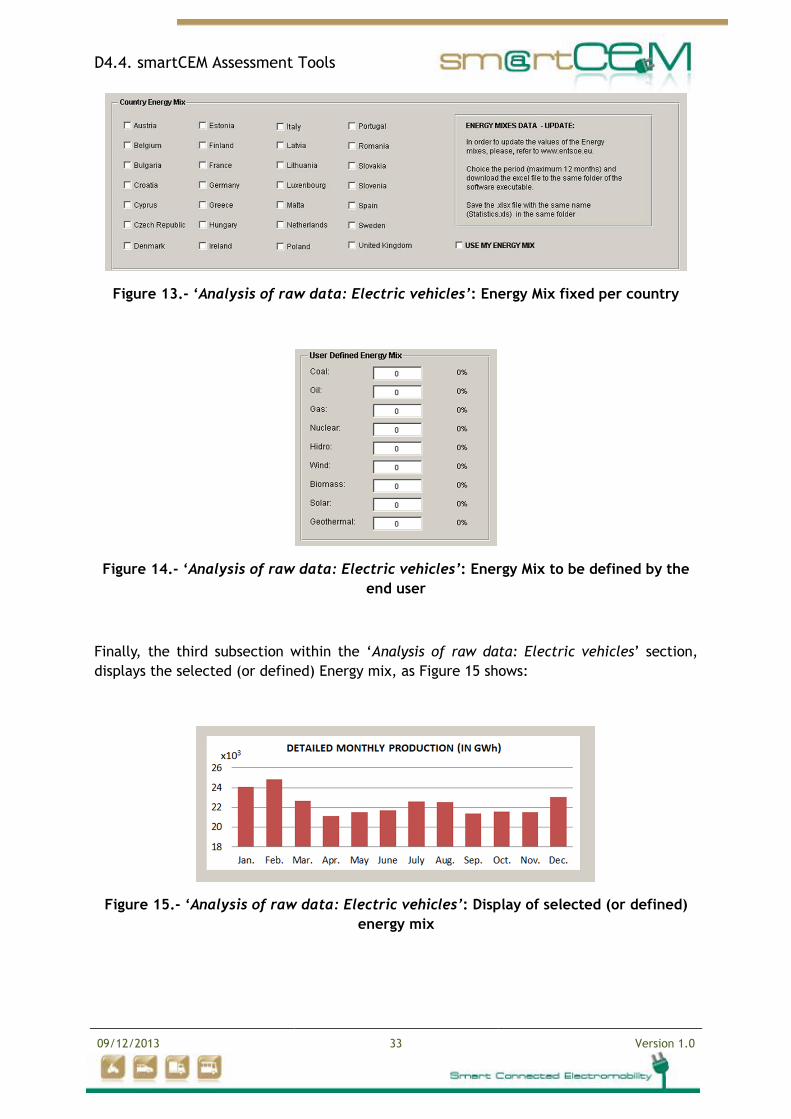
The third section, ‘Analysis of raw data: Electric vehicles’, is divided into three
subsections, related to the Energy Mix: ‘Country Energy mix’, ‘User defined Energy Mix’
and plotted information.
As shown, the user can select between the energy mixes of different countries2 and update
the background information (refer to Figure 13), or his/her own Energy Mix, defined by
him/her (refer to Figure 14).
2 The information related to the fixed Energy mixes per country has been updated with the information
provided by the European Network of Transmission System Operators for Electricity
(https://www.entsoe.eu/data/data-portal/production/)
D4.4. smartCEM Assessment Tools
09/12/2013 33 Version 1.0
Figure 13.- ‘Analysis of raw data: Electric vehicles’: Energy Mix fixed per country
Figure 14.- ‘Analysis of raw data: Electric vehicles’: Energy Mix to be defined by the
end user
Finally, the third subsection within the ‘Analysis of raw data: Electric vehicles’ section,
displays the selected (or defined) Energy mix, as Figure 15 shows:
Figure 15.- ‘Analysis of raw data: Electric vehicles’: Display of selected (or defined)
energy mix
D4.4. smartCEM Assessment Tools
09/12/2013 34 Version 1.0
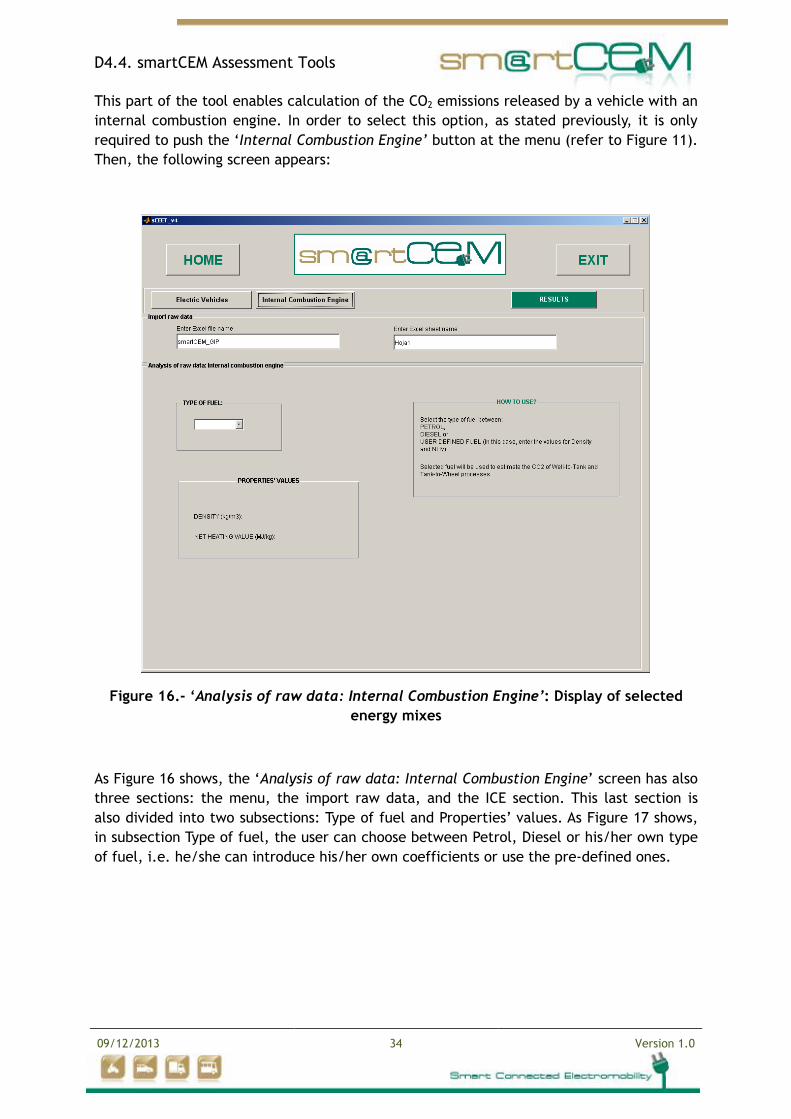
This part of the tool enables calculation of the CO2 emissions released by a vehicle with an
internal combustion engine. In order to select this option, as stated previously, it is only
required to push the ‘Internal Combustion Engine’ button at the menu (refer to Figure 11).
Then, the following screen appears:
Figure 16.- ‘Analysis of raw data: Internal Combustion Engine’: Display of selected
energy mixes
As Figure 16 shows, the ‘Analysis of raw data: Internal Combustion Engine’ screen has also
three sections: the menu, the import raw data, and the ICE section. This last section is
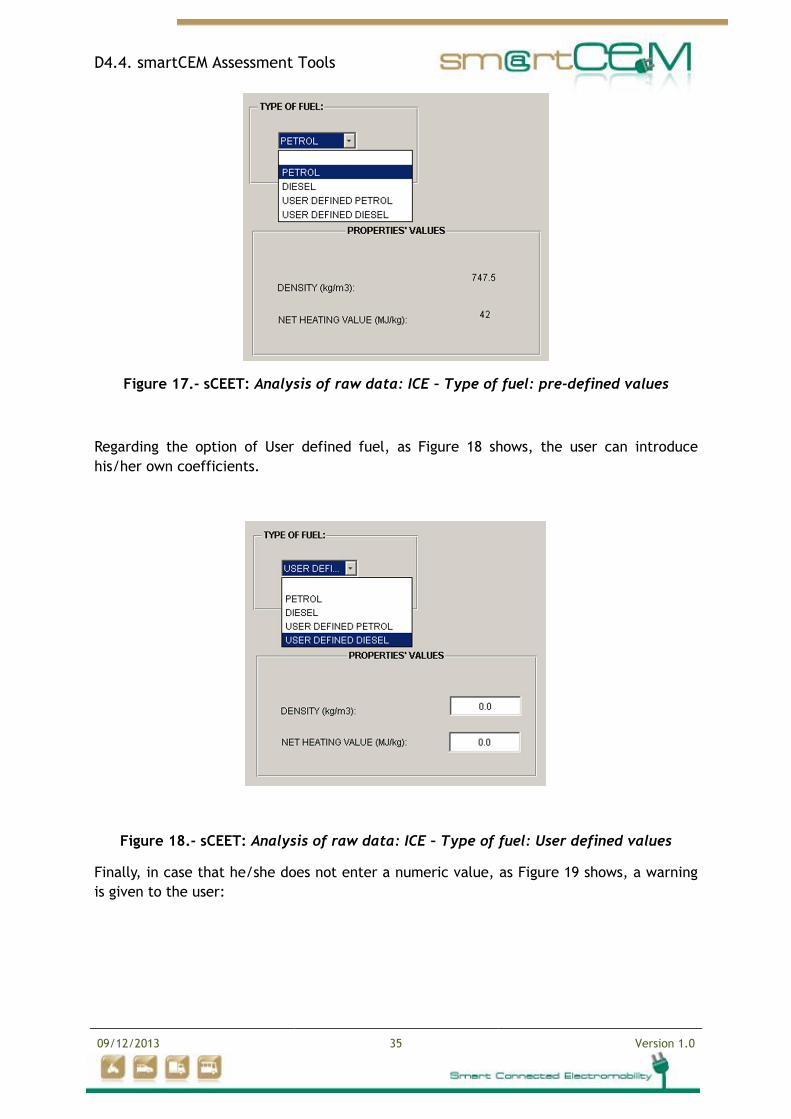
also divided into two subsections: Type of fuel and Properties’ values. As Figure 17 shows,
in subsection Type of fuel, the user can choose between Petrol, Diesel or his/her own type
of fuel, i.e. he/she can introduce his/her own coefficients or use the pre-defined ones.
D4.4. smartCEM Assessment Tools
09/12/2013 35 Version 1.0
Figure 17.- sCEET: Analysis of raw data: ICE – Type of fuel: pre-defined values
Regarding the option of User defined fuel, as Figure 18 shows, the user can introduce
his/her own coefficients.
Figure 18.- sCEET: Analysis of raw data: ICE – Type of fuel: User defined values
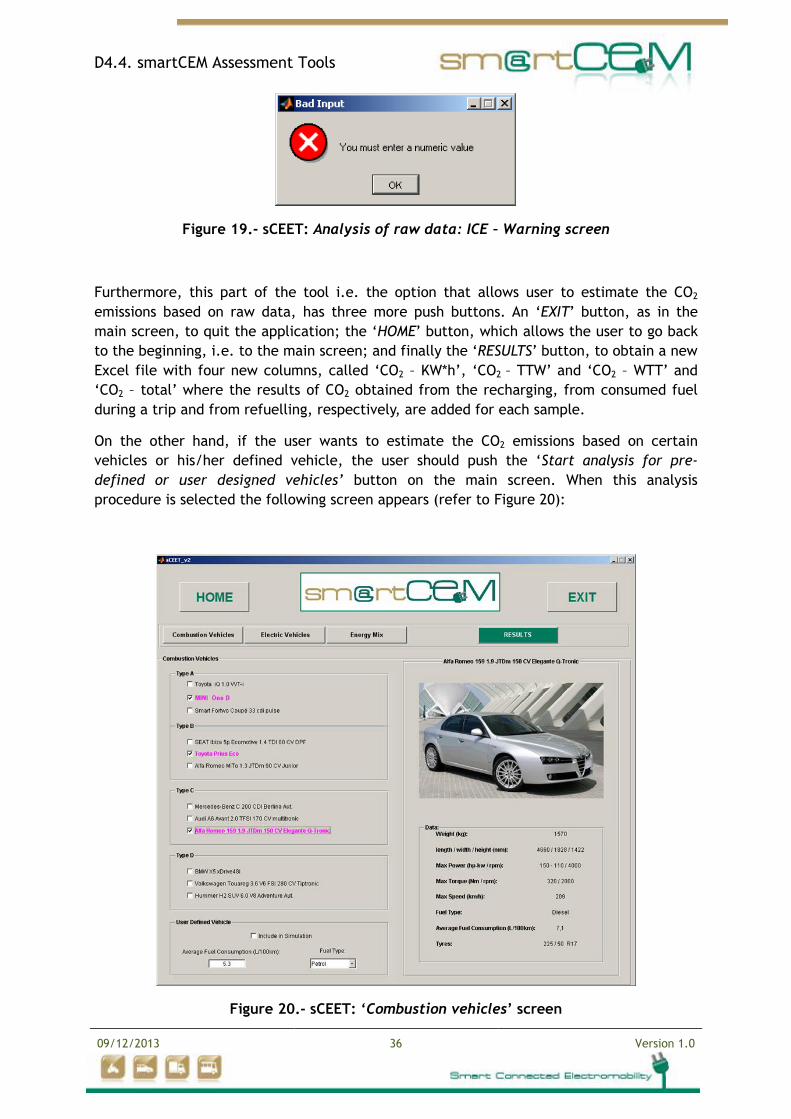
Finally, in case that he/she does not enter a numeric value, as Figure 19 shows, a warning
is given to the user:
D4.4. smartCEM Assessment Tools
09/12/2013 36 Version 1.0
Figure 19.- sCEET: Analysis of raw data: ICE – Warning screen
Furthermore, this part of the tool i.e. the option that allows user to estimate the CO2
emissions based on raw data, has three more push buttons. An ‘EXIT’ button, as in the
main screen, to quit the application; the ‘HOME’ button, which allows the user to go back
to the beginning, i.e. to the main screen; and finally the ‘RESULTS’ button, to obtain a new
Excel file with four new columns, called ‘CO2 – KW*h’, ‘CO2 – TTW’ and ‘CO2 – WTT’ and
‘CO2 – total’ where the results of CO2 obtained from the recharging, from consumed fuel
during a trip and from refuelling, respectively, are added for each sample.
On the other hand, if the user wants to estimate the CO2 emissions based on certain
vehicles or his/her defined vehicle, the user should push the ‘Start analysis for pre-
defined or user designed vehicles’ button on the main screen. When this analysis
procedure is selected the following screen appears (refer to Figure 20):
Figure 20.- sCEET: ‘Combustion vehicles’ screen
D4.4. smartCEM Assessment Tools
09/12/2013 37 Version 1.0
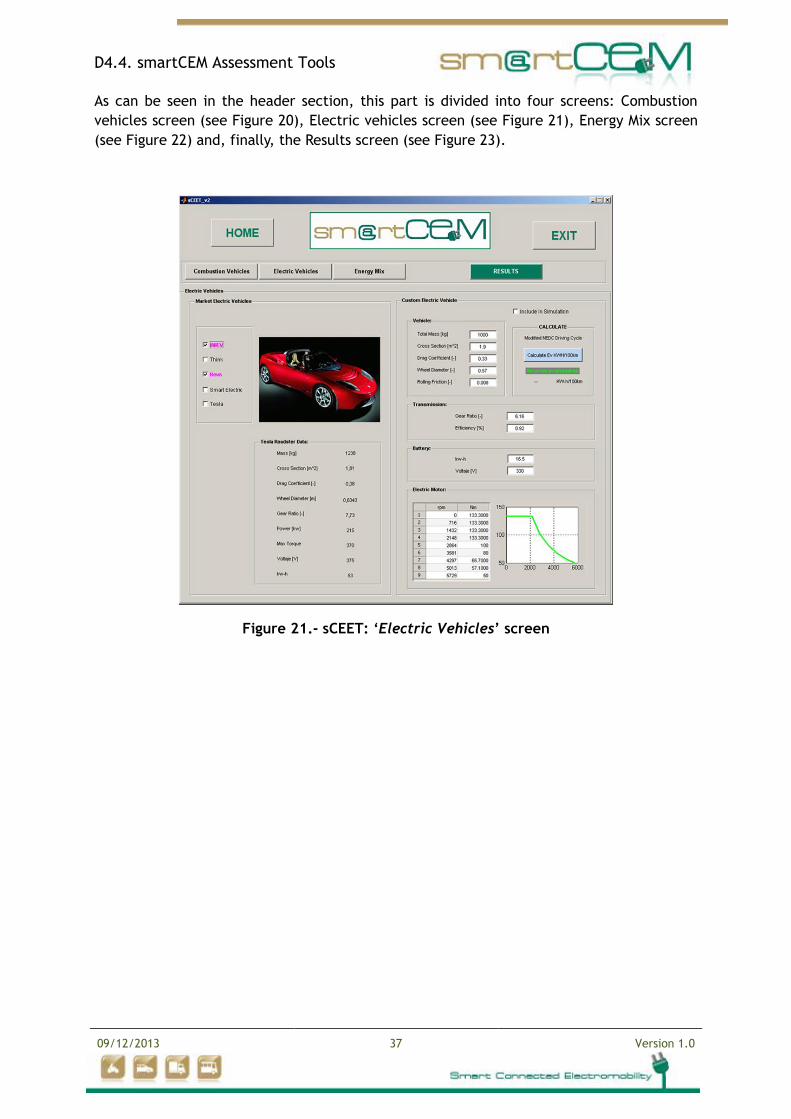
As can be seen in the header section, this part is divided into four screens: Combustion
vehicles screen (see Figure 20), Electric vehicles screen (see Figure 21), Energy Mix screen
(see Figure 22) and, finally, the Results screen (see Figure 23).
Figure 21.- sCEET: ‘Electric Vehicles’ screen
D4.4. smartCEM Assessment Tools
09/12/2013 38 Version 1.0
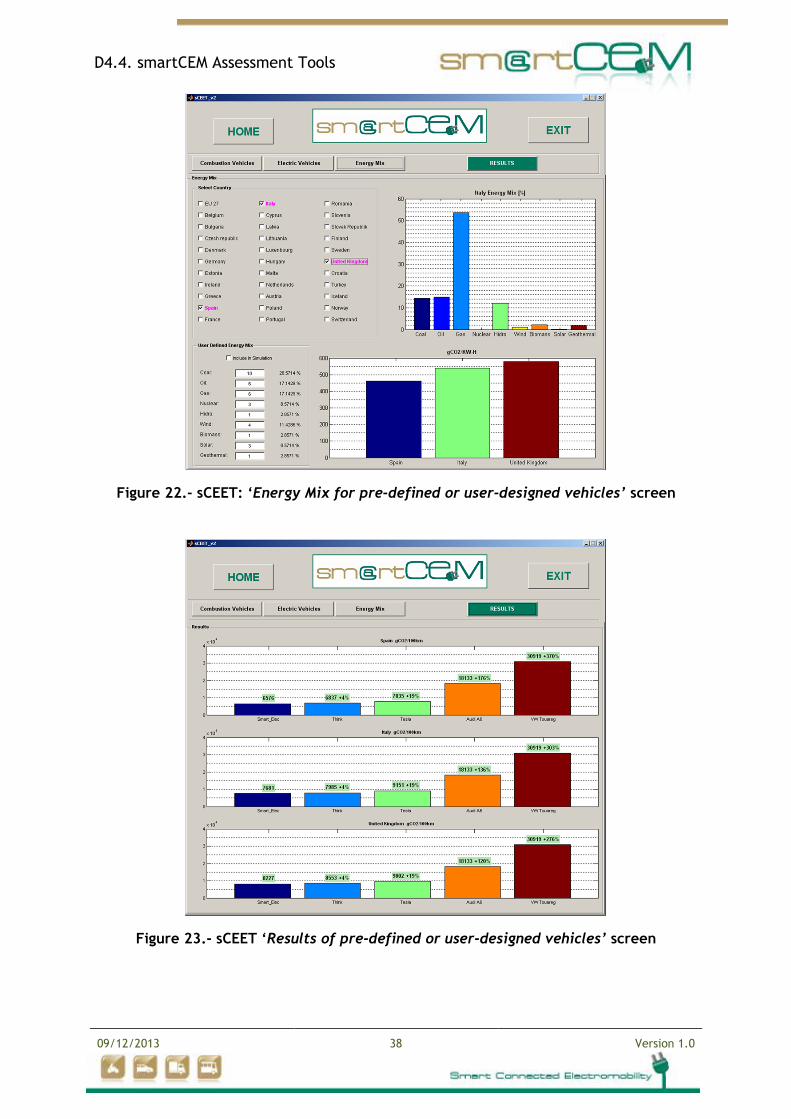
Figure 22.- sCEET: ‘Energy Mix for pre-defined or user-designed vehicles’ screen
Figure 23.- sCEET ‘Results of pre-defined or user-designed vehicles’ screen
D4.4. smartCEM Assessment Tools
09/12/2013 39 Version 1.0
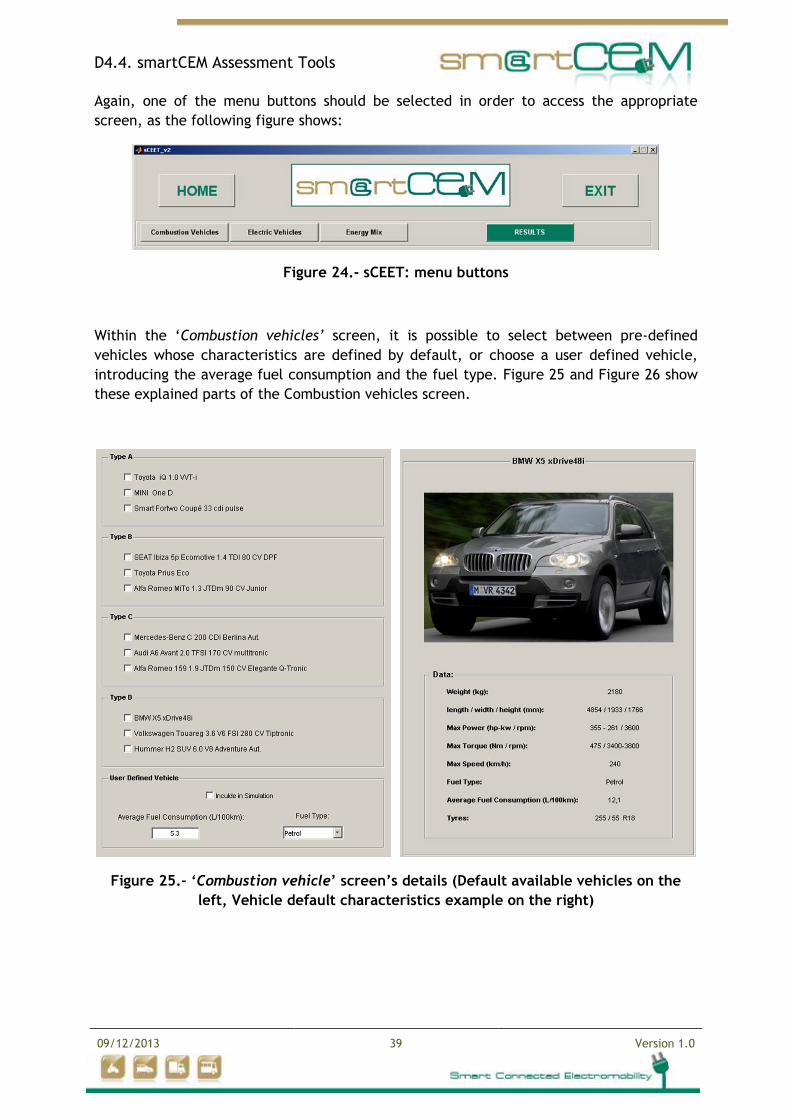
Again, one of the menu buttons should be selected in order to access the appropriate
screen, as the following figure shows:
Figure 24.- sCEET: menu buttons
Within the ‘Combustion vehicles’ screen, it is possible to select between pre-defined
vehicles whose characteristics are defined by default, or choose a user defined vehicle,
introducing the average fuel consumption and the fuel type. Figure 25 and Figure 26 show
these explained parts of the Combustion vehicles screen.
Figure 25.- ‘Combustion vehicle’ screen’s details (Default available vehicles on the
left, Vehicle default characteristics example on the right)
D4.4. smartCEM Assessment Tools
09/12/2013 40 Version 1.0
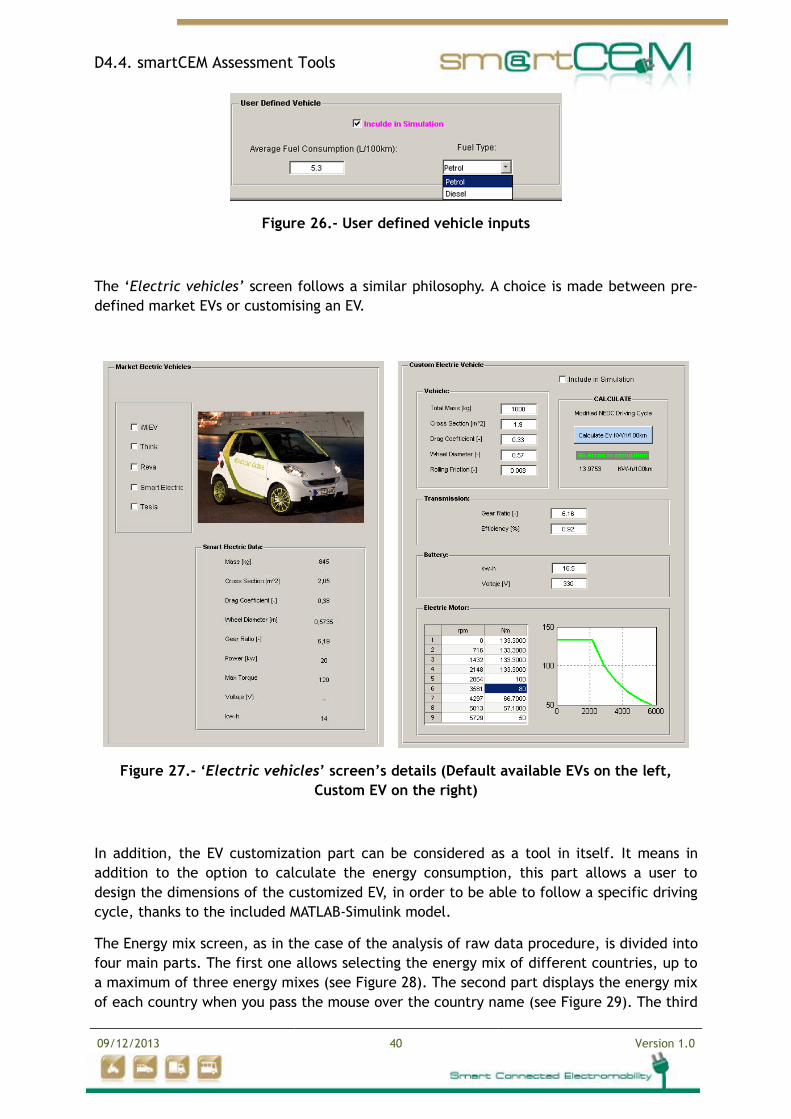
Figure 26.- User defined vehicle inputs
The ‘Electric vehicles’ screen follows a similar philosophy. A choice is made between pre-
defined market EVs or customising an EV.
Figure 27.- ‘Electric vehicles’ screen’s details (Default available EVs on the left,
Custom EV on the right)
In addition, the EV customization part can be considered as a tool in itself. It means in
addition to the option to calculate the energy consumption, this part allows a user to
design the dimensions of the customized EV, in order to be able to follow a specific driving
cycle, thanks to the included MATLAB-Simulink model.
The Energy mix screen, as in the case of the analysis of raw data procedure, is divided into
four main parts. The first one allows selecting the energy mix of different countries, up to
a maximum of three energy mixes (see Figure 28). The second part displays the energy mix
of each country when you pass the mouse over the country name (see Figure 29). The third
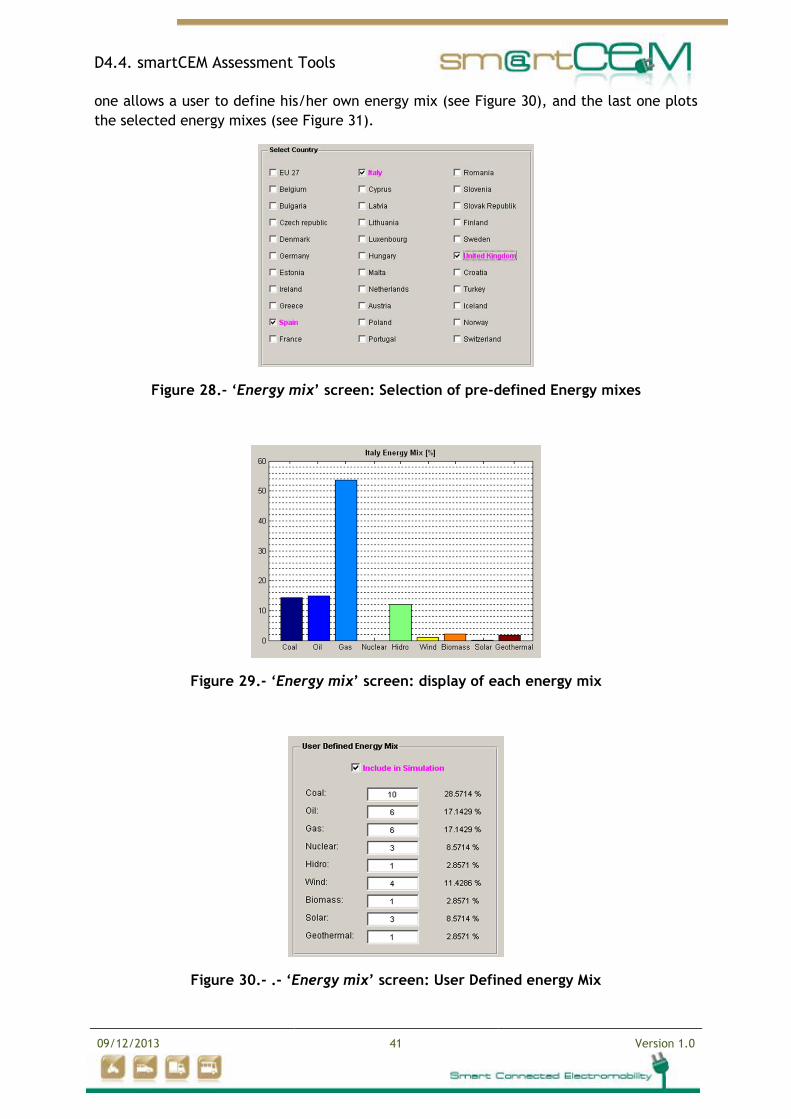
D4.4. smartCEM Assessment Tools
09/12/2013 41 Version 1.0
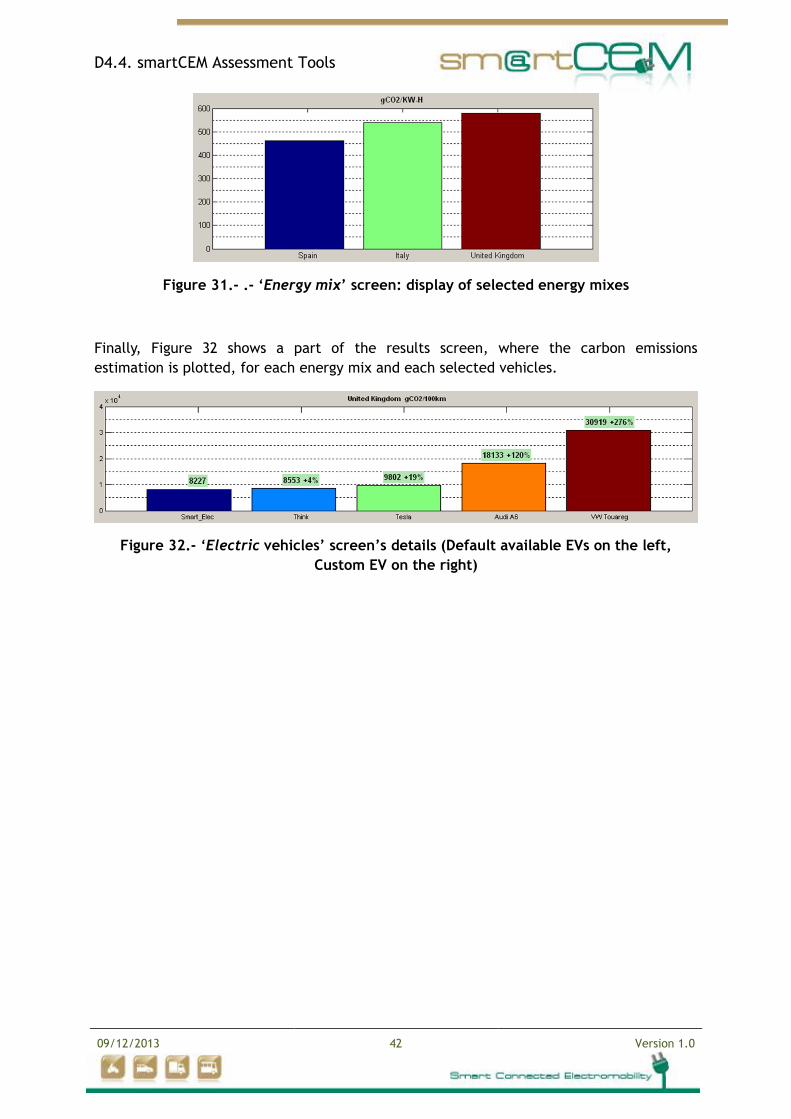
one allows a user to define his/her own energy mix (see Figure 30), and the last one plots
the selected energy mixes (see Figure 31).
Figure 28.- ‘Energy mix’ screen: Selection of pre-defined Energy mixes
Figure 29.- ‘Energy mix’ screen: display of each energy mix
Figure 30.- .- ‘Energy mix’ screen: User Defined energy Mix
D4.4. smartCEM Assessment Tools
09/12/2013 42 Version 1.0
Figure 31.- .- ‘Energy mix’ screen: display of selected energy mixes
Finally, Figure 32 shows a part of the results screen, where the carbon emissions
estimation is plotted, for each energy mix and each selected vehicles.
Figure 32.- ‘Electric vehicles’ screen’s details (Default available EVs on the left,
Custom EV on the right)
D4.4. smartCEM Assessment Tools
09/12/2013 43 Version 1.0
3. Questionnaires for the assessment of user-uptake
In the description of work of smartCEM it is stated that one aim is ‘to prove that user
acceptance of electrical vehicles can be increased by at least 15% due to the adoption of
smartCEM services. Based on this, it is necessary to develop assessment tools in terms of
questionnaires for acquiring relevant data for this goal. Therefore, in task 4.2.2 user-
uptake questionnaires are developed to assess how users accept and use EVs and the
smartCEM services.
The results of these questionnaires should be included into the CDB (refer to D2.4). With
this purpose, the responses obtained thanks to the questionnaire will be provided as
numbers (from 1 to 5), taking into account the type of questionnaire (van der Laan, Likert
scale); except open questions, i.e. those questions where the participants can answer what
they want. The elaboration of these stored results will be reported in the smartCEM
deliverable D3.2., and the data contained into the CDB will be used as an input to Task 4.5
Data analysis and reported in the deliverable D4.5
3.1. Questionnaire concept and development process
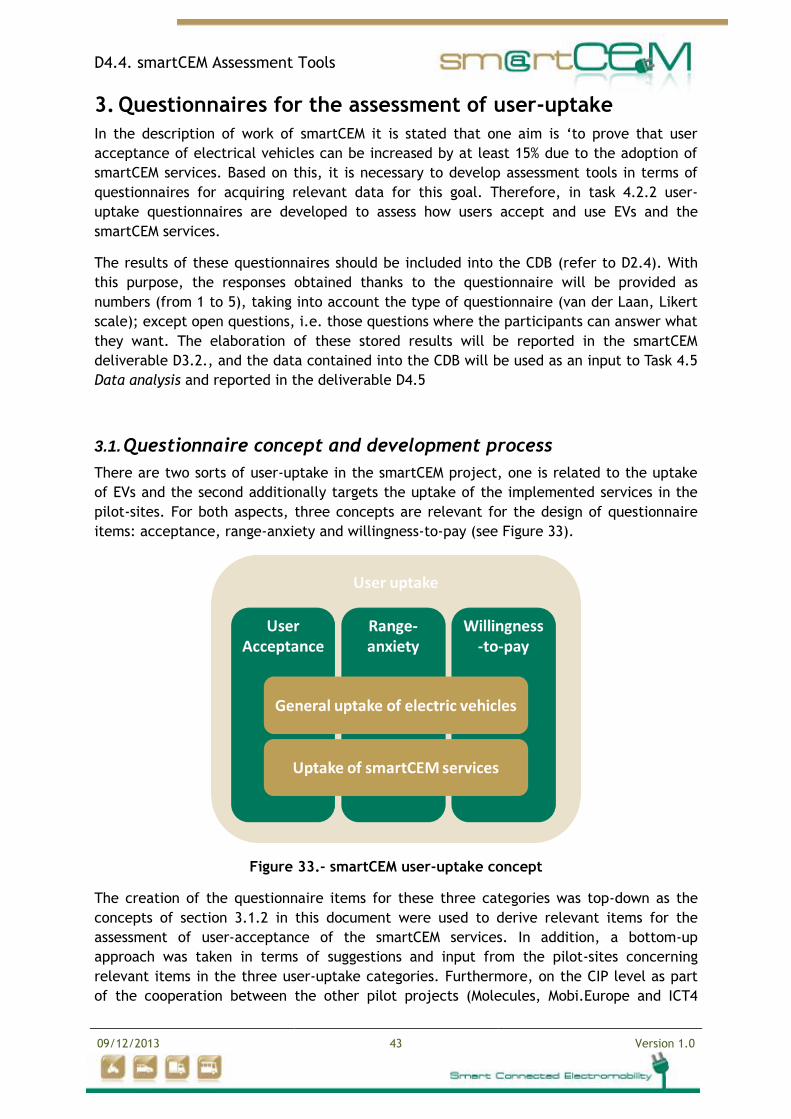
There are two sorts of user-uptake in the smartCEM project, one is related to the uptake
of EVs and the second additionally targets the uptake of the implemented services in the
pilot-sites. For both aspects, three concepts are relevant for the design of questionnaire
items: acceptance, range-anxiety and willingness-to-pay (see Figure 33).
Figure 33.- smartCEM user-uptake concept
The creation of the questionnaire items for these three categories was top-down as the
concepts of section 3.1.2 in this document were used to derive relevant items for the
assessment of user-acceptance of the smartCEM services. In addition, a bottom-up
approach was taken in terms of suggestions and input from the pilot-sites concerning
relevant items in the three user-uptake categories. Furthermore, on the CIP level as part
of the cooperation between the other pilot projects (Molecules, Mobi.Europe and ICT4
D4.4. smartCEM Assessment Tools
09/12/2013 44 Version 1.0
EVEU – see also D6.2), the evaluation expert group is still working on harmonising the user-
questionnaires. Therefore, this work serves as an input to the project-wide assessment of
user acceptance with the aim to create a harmonised user-questionnaire concerning
demographics, attitudes and technology use, travel and mobility, willingness-to-pay,
range-anxiety and user-acceptance. First proposals coming from the four projects have
been merged and integrated and are being discussed in the expert group at the moment.
The outcome of this work influences the items for this project as well and might lead to
adaptations of tables presented in this document at a later stage in the project.
In the following sections the currently existing items for the three categories are
presented, whilst additional questions for the users, and the concepts for the items of user
acceptance, are explained.
Additionally, since there are several different vehicle types in smartCEM (electric vehicles,
electric scooters, hybrid bus) slightly different questionnaire versions for each are
presented in the annex: a long version of general user-uptake for EVs (1) and for electric
scooters (2), a long version service user-uptake for EVs (3) and scooters (4), one combined
version for the hybrid bus (5) and a short version for the direct assessment of general user-
uptake right after completion of the trials for EVs (6) and electric scooters (7). The long
versions of the questionnaires have additional item sections on demographics, mobility,
driving experience, alternative transport modes, attitudes and technology usage. These
sections were developed from partners in the CIP evaluation group, namely from Rene
Kelpin (DLR) and Ana Paul (CTAG).
3.1.1. General user acceptance
The general user acceptance of EVs is assessed with two short questions concerning the
direct impressions of the electric vehicle (see Table 4). With these simple questions a
comparison of the baseline condition (before the smartCEM services were implemented)
and the operational phase (after implementation of smartCEM services) is possible.
Table 4. General user acceptance items (electric vehicles)
Construct Item Response scale
Acceptance
What is your immediate impression after completing your journey in an electric vehicle/scooter?
bad impression to excellent impression
Based on your present impression, would you consider driving electric vehicles/scooters more often in the future?
certainly-not to for-sure
3.1.2. User-acceptance of smartCEM services
The acceptance of the smartCEM services is crucial as it influences the overall acceptance
of electric vehicles. Therefore, items which help to determine aspects for further
improvement of the single services and to assess service-specific aspects were created.
D4.4. smartCEM Assessment Tools
09/12/2013 45 Version 1.0
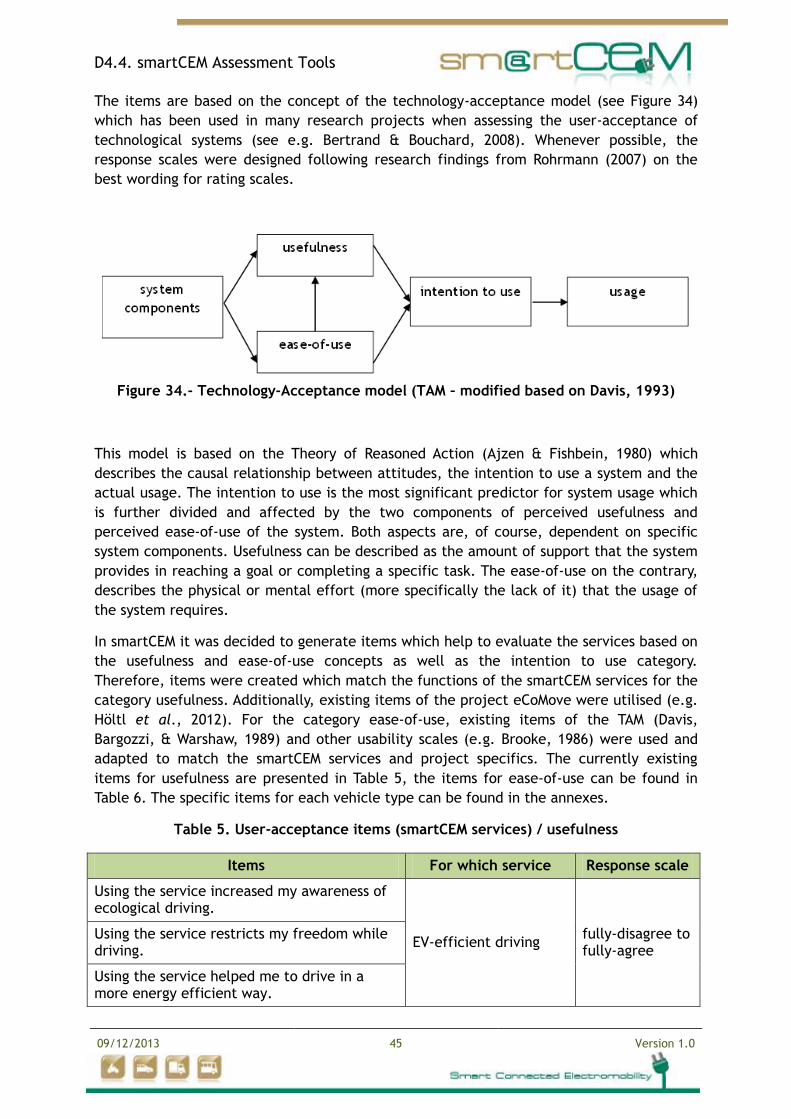
The items are based on the concept of the technology-acceptance model (see Figure 34)
which has been used in many research projects when assessing the user-acceptance of
technological systems (see e.g. Bertrand & Bouchard, 2008). Whenever possible, the
response scales were designed following research findings from Rohrmann (2007) on the
best wording for rating scales.
Figure 34.- Technology-Acceptance model (TAM – modified based on Davis, 1993)
This model is based on the Theory of Reasoned Action (Ajzen & Fishbein, 1980) which
describes the causal relationship between attitudes, the intention to use a system and the
actual usage. The intention to use is the most significant predictor for system usage which
is further divided and affected by the two components of perceived usefulness and
perceived ease-of-use of the system. Both aspects are, of course, dependent on specific
system components. Usefulness can be described as the amount of support that the system
provides in reaching a goal or completing a specific task. The ease-of-use on the contrary,
describes the physical or mental effort (more specifically the lack of it) that the usage of
the system requires.
In smartCEM it was decided to generate items which help to evaluate the services based on
the usefulness and ease-of-use concepts as well as the intention to use category.
Therefore, items were created which match the functions of the smartCEM services for the
category usefulness. Additionally, existing items of the project eCoMove were utilised (e.g.
Höltl et al., 2012). For the category ease-of-use, existing items of the TAM (Davis,
Bargozzi, & Warshaw, 1989) and other usability scales (e.g. Brooke, 1986) were used and
adapted to match the smartCEM services and project specifics. The currently existing
items for usefulness are presented in Table 5, the items for ease-of-use can be found in
Table 6. The specific items for each vehicle type can be found in the annexes.
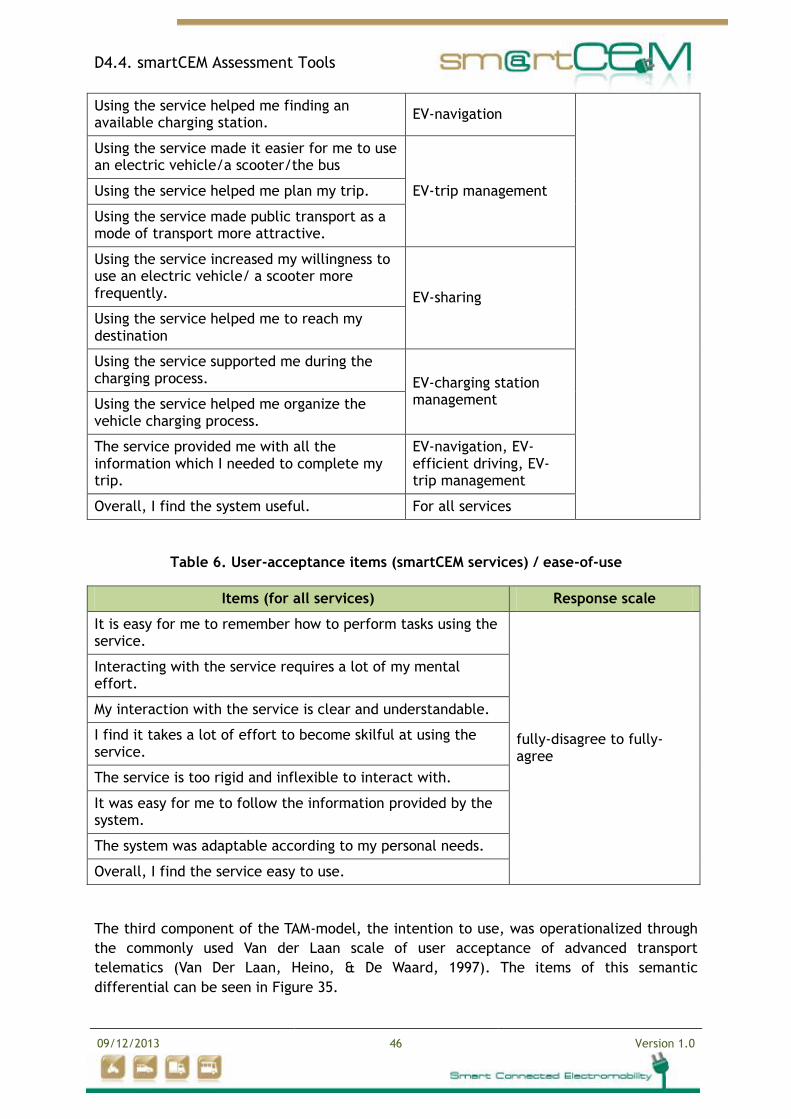
Table 5. User-acceptance items (smartCEM services) / usefulness
Items For which service Response scale
Using the service increased my awareness of ecological driving.
EV-efficient driving fully-disagree to fully-agree
Using the service restricts my freedom while driving.
Using the service helped me to drive in a more energy efficient way.
D4.4. smartCEM Assessment Tools
09/12/2013 46 Version 1.0
Using the service helped me finding an available charging station.
EV-navigation
Using the service made it easier for me to use an electric vehicle/a scooter/the bus
EV-trip management Using the service helped me plan my trip.
Using the service made public transport as a mode of transport more attractive.
Using the service increased my willingness to use an electric vehicle/ a scooter more frequently. EV-sharing
Using the service helped me to reach my destination
Using the service supported me during the charging process. EV-charging station
management Using the service helped me organize the vehicle charging process.
The service provided me with all the information which I needed to complete my trip.
EV-navigation, EV-efficient driving, EV-trip management
Overall, I find the system useful. For all services
Table 6. User-acceptance items (smartCEM services) / ease-of-use
Items (for all services) Response scale
It is easy for me to remember how to perform tasks using the service.
fully-disagree to fully-agree
Interacting with the service requires a lot of my mental effort.
My interaction with the service is clear and understandable.
I find it takes a lot of effort to become skilful at using the service.
The service is too rigid and inflexible to interact with.
It was easy for me to follow the information provided by the system.
The system was adaptable according to my personal needs.
Overall, I find the service easy to use.
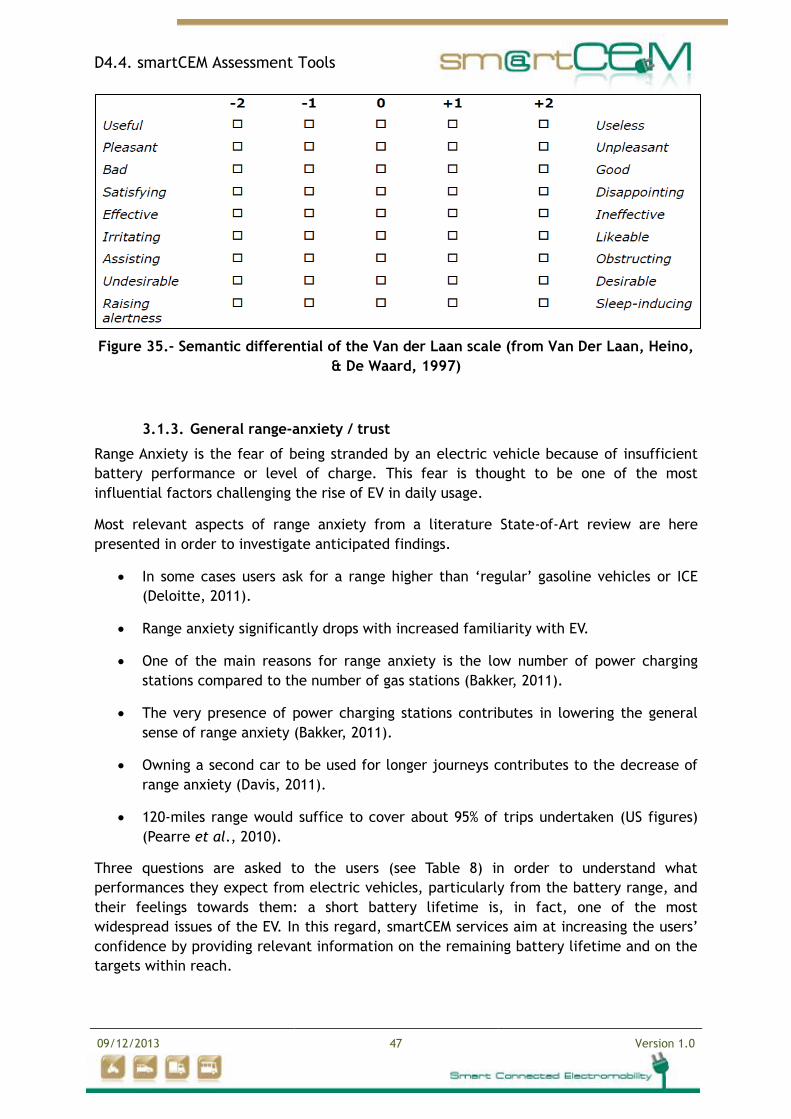
The third component of the TAM-model, the intention to use, was operationalized through
the commonly used Van der Laan scale of user acceptance of advanced transport
telematics (Van Der Laan, Heino, & De Waard, 1997). The items of this semantic
differential can be seen in Figure 35.
D4.4. smartCEM Assessment Tools
09/12/2013 47 Version 1.0
Figure 35.- Semantic differential of the Van der Laan scale (from Van Der Laan, Heino,
& De Waard, 1997)
3.1.3. General range-anxiety / trust
Range Anxiety is the fear of being stranded by an electric vehicle because of insufficient
battery performance or level of charge. This fear is thought to be one of the most
influential factors challenging the rise of EV in daily usage.
Most relevant aspects of range anxiety from a literature State-of-Art review are here
presented in order to investigate anticipated findings.
In some cases users ask for a range higher than ‘regular’ gasoline vehicles or ICE
(Deloitte, 2011).
Range anxiety significantly drops with increased familiarity with EV.
One of the main reasons for range anxiety is the low number of power charging
stations compared to the number of gas stations (Bakker, 2011).
The very presence of power charging stations contributes in lowering the general
sense of range anxiety (Bakker, 2011).
Owning a second car to be used for longer journeys contributes to the decrease of
range anxiety (Davis, 2011).
120-miles range would suffice to cover about 95% of trips undertaken (US figures)
(Pearre et al., 2010).
Three questions are asked to the users (see Table 8) in order to understand what
performances they expect from electric vehicles, particularly from the battery range, and
their feelings towards them: a short battery lifetime is, in fact, one of the most
widespread issues of the EV. In this regard, smartCEM services aim at increasing the users’
confidence by providing relevant information on the remaining battery lifetime and on the
targets within reach.
D4.4. smartCEM Assessment Tools
09/12/2013 48 Version 1.0
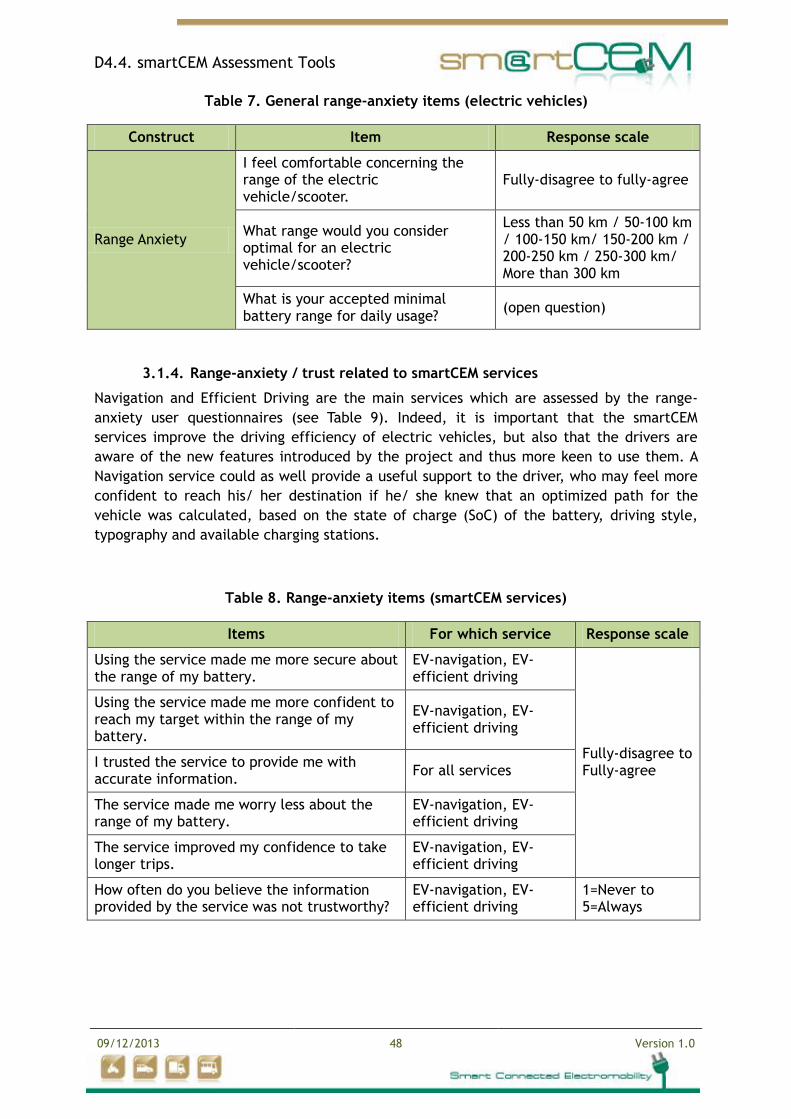
Table 7. General range-anxiety items (electric vehicles)
Construct Item Response scale
Range Anxiety
I feel comfortable concerning the range of the electric vehicle/scooter.
Fully-disagree to fully-agree
What range would you consider optimal for an electric vehicle/scooter?
Less than 50 km / 50-100 km / 100-150 km/ 150-200 km / 200-250 km / 250-300 km/ More than 300 km
What is your accepted minimal battery range for daily usage?
(open question)
3.1.4. Range-anxiety / trust related to smartCEM services
Navigation and Efficient Driving are the main services which are assessed by the range-
anxiety user questionnaires (see Table 9). Indeed, it is important that the smartCEM
services improve the driving efficiency of electric vehicles, but also that the drivers are
aware of the new features introduced by the project and thus more keen to use them. A
Navigation service could as well provide a useful support to the driver, who may feel more
confident to reach his/ her destination if he/ she knew that an optimized path for the
vehicle was calculated, based on the state of charge (SoC) of the battery, driving style,
typography and available charging stations.
Table 8. Range-anxiety items (smartCEM services)
Items For which service Response scale
Using the service made me more secure about the range of my battery.
EV-navigation, EV-efficient driving
Fully-disagree to Fully-agree
Using the service made me more confident to reach my target within the range of my battery.
EV-navigation, EV-efficient driving
I trusted the service to provide me with accurate information.
For all services
The service made me worry less about the range of my battery.
EV-navigation, EV-efficient driving
The service improved my confidence to take longer trips.
EV-navigation, EV-efficient driving
How often do you believe the information provided by the service was not trustworthy?
EV-navigation, EV-efficient driving
1=Never to 5=Always
D4.4. smartCEM Assessment Tools
09/12/2013 49 Version 1.0
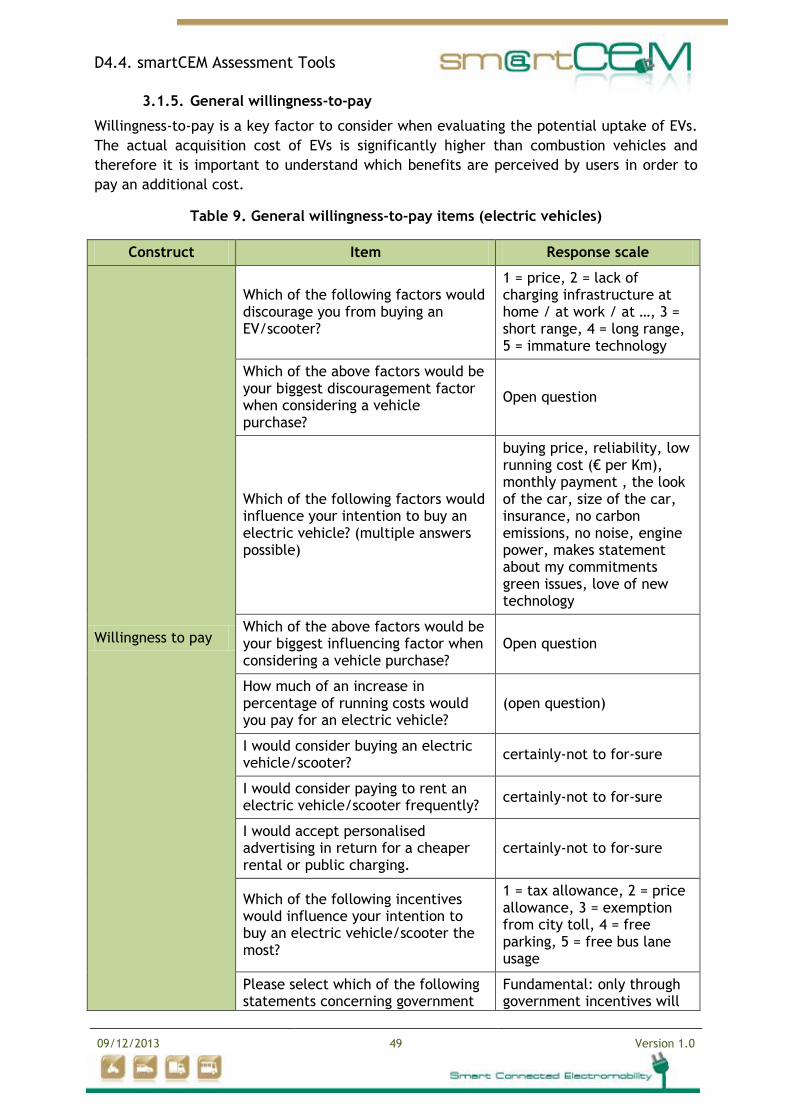
3.1.5. General willingness-to-pay
Willingness-to-pay is a key factor to consider when evaluating the potential uptake of EVs.
The actual acquisition cost of EVs is significantly higher than combustion vehicles and
therefore it is important to understand which benefits are perceived by users in order to
pay an additional cost.
Table 9. General willingness-to-pay items (electric vehicles)
Construct Item Response scale
Willingness to pay
Which of the following factors would discourage you from buying an EV/scooter?
1 = price, 2 = lack of charging infrastructure at home / at work / at …, 3 = short range, 4 = long range, 5 = immature technology
Which of the above factors would be your biggest discouragement factor when considering a vehicle purchase?
Open question
Which of the following factors would influence your intention to buy an electric vehicle? (multiple answers possible)
buying price, reliability, low running cost (€ per Km), monthly payment , the look of the car, size of the car, insurance, no carbon emissions, no noise, engine power, makes statement about my commitments green issues, love of new technology
Which of the above factors would be your biggest influencing factor when considering a vehicle purchase?
Open question
How much of an increase in percentage of running costs would you pay for an electric vehicle?
(open question)
I would consider buying an electric vehicle/scooter?
certainly-not to for-sure
I would consider paying to rent an electric vehicle/scooter frequently?
certainly-not to for-sure
I would accept personalised advertising in return for a cheaper rental or public charging.
certainly-not to for-sure
Which of the following incentives would influence your intention to buy an electric vehicle/scooter the most?
1 = tax allowance, 2 = price allowance, 3 = exemption from city toll, 4 = free parking, 5 = free bus lane usage
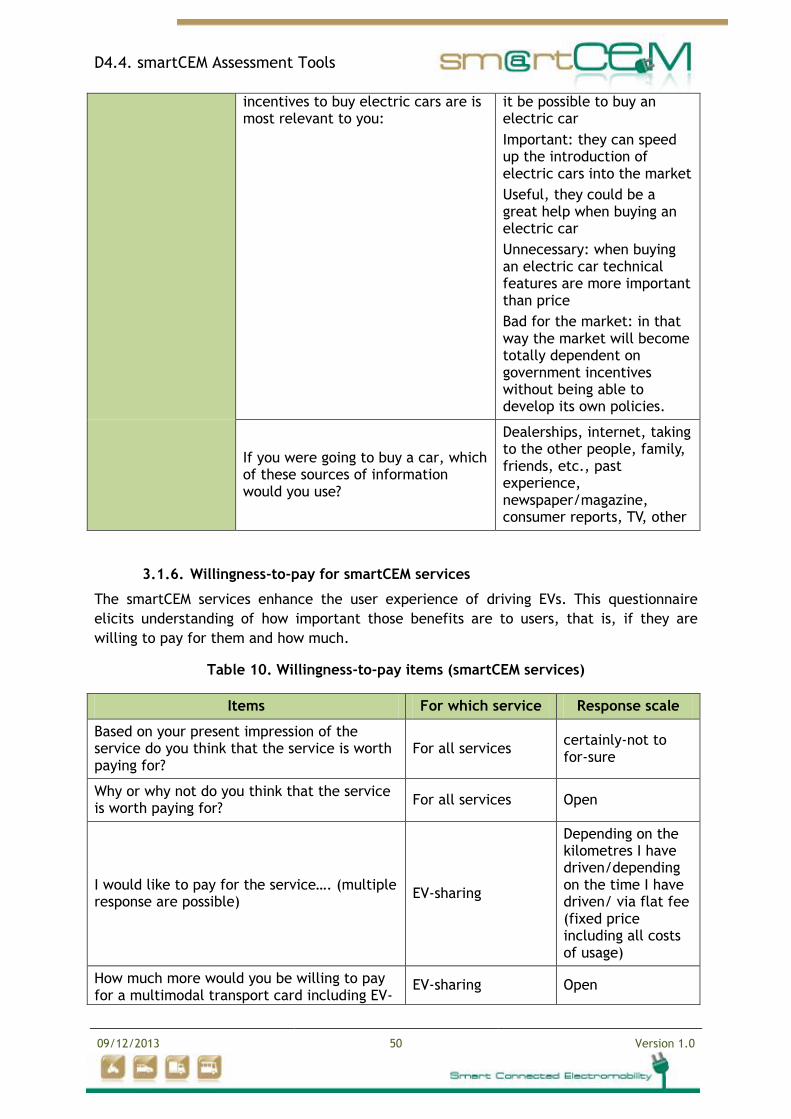
Please select which of the following statements concerning government
Fundamental: only through government incentives will
D4.4. smartCEM Assessment Tools
09/12/2013 50 Version 1.0
incentives to buy electric cars are is most relevant to you:
it be possible to buy an electric car
Important: they can speed up the introduction of electric cars into the market
Useful, they could be a great help when buying an electric car
Unnecessary: when buying an electric car technical features are more important than price
Bad for the market: in that way the market will become totally dependent on government incentives without being able to develop its own policies.
If you were going to buy a car, which of these sources of information would you use?
Dealerships, internet, taking to the other people, family, friends, etc., past experience, newspaper/magazine, consumer reports, TV, other
3.1.6. Willingness-to-pay for smartCEM services
The smartCEM services enhance the user experience of driving EVs. This questionnaire
elicits understanding of how important those benefits are to users, that is, if they are
willing to pay for them and how much.
Table 10. Willingness-to-pay items (smartCEM services)
Items For which service Response scale
Based on your present impression of the service do you think that the service is worth paying for?
For all services certainly-not to for-sure
Why or why not do you think that the service is worth paying for?
For all services Open
I would like to pay for the service…. (multiple response are possible)
EV-sharing
Depending on the kilometres I have driven/depending on the time I have driven/ via flat fee (fixed price including all costs of usage)
How much more would you be willing to pay for a multimodal transport card including EV-
EV-sharing Open
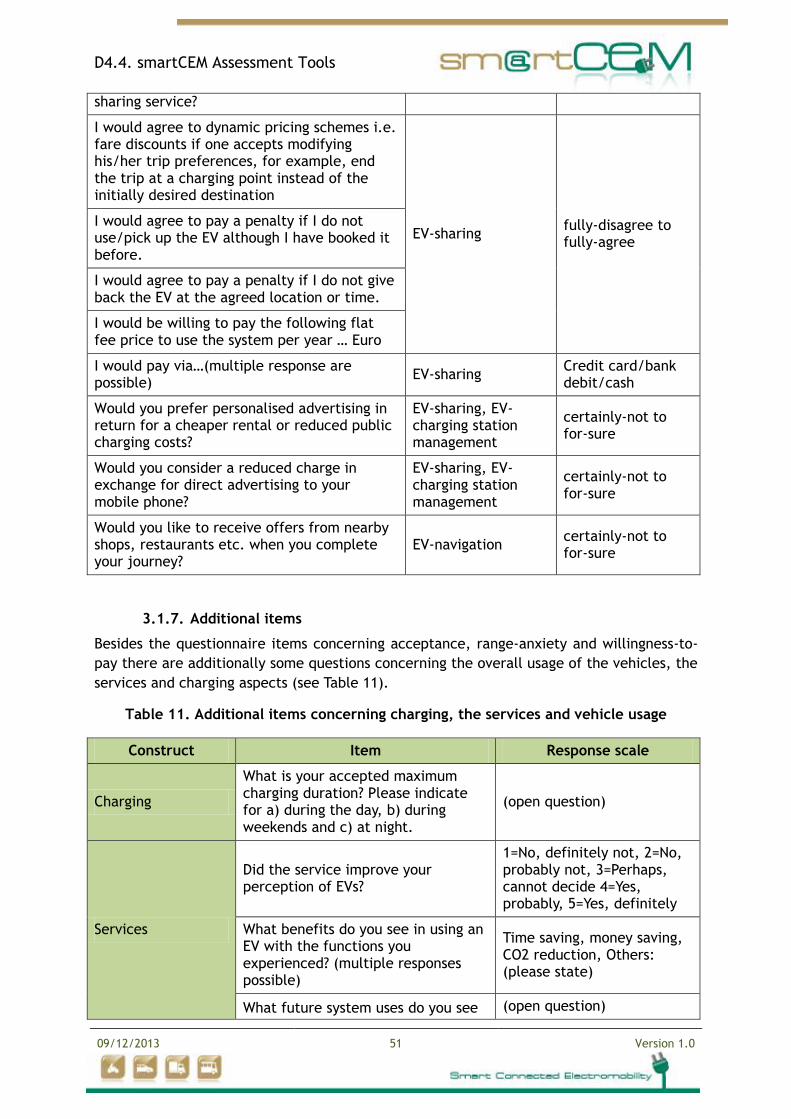
D4.4. smartCEM Assessment Tools
09/12/2013 51 Version 1.0
sharing service?
I would agree to dynamic pricing schemes i.e. fare discounts if one accepts modifying his/her trip preferences, for example, end the trip at a charging point instead of the initially desired destination
EV-sharing fully-disagree to fully-agree
I would agree to pay a penalty if I do not use/pick up the EV although I have booked it before.
I would agree to pay a penalty if I do not give back the EV at the agreed location or time.
I would be willing to pay the following flat fee price to use the system per year … Euro
I would pay via…(multiple response are possible)
EV-sharing Credit card/bank debit/cash
Would you prefer personalised advertising in return for a cheaper rental or reduced public charging costs?
EV-sharing, EV-charging station management
certainly-not to for-sure
Would you consider a reduced charge in exchange for direct advertising to your mobile phone?
EV-sharing, EV-charging station management
certainly-not to for-sure
Would you like to receive offers from nearby shops, restaurants etc. when you complete your journey?
EV-navigation certainly-not to for-sure
3.1.7. Additional items
Besides the questionnaire items concerning acceptance, range-anxiety and willingness-to-
pay there are additionally some questions concerning the overall usage of the vehicles, the
services and charging aspects (see Table 11).
Table 11. Additional items concerning charging, the services and vehicle usage
Construct Item Response scale
Charging
What is your accepted maximum charging duration? Please indicate for a) during the day, b) during weekends and c) at night.
(open question)
Services
Did the service improve your perception of EVs?
1=No, definitely not, 2=No, probably not, 3=Perhaps, cannot decide 4=Yes, probably, 5=Yes, definitely
What benefits do you see in using an EV with the functions you experienced? (multiple responses possible)
Time saving, money saving, CO2 reduction, Others: (please state)
What future system uses do you see (open question)
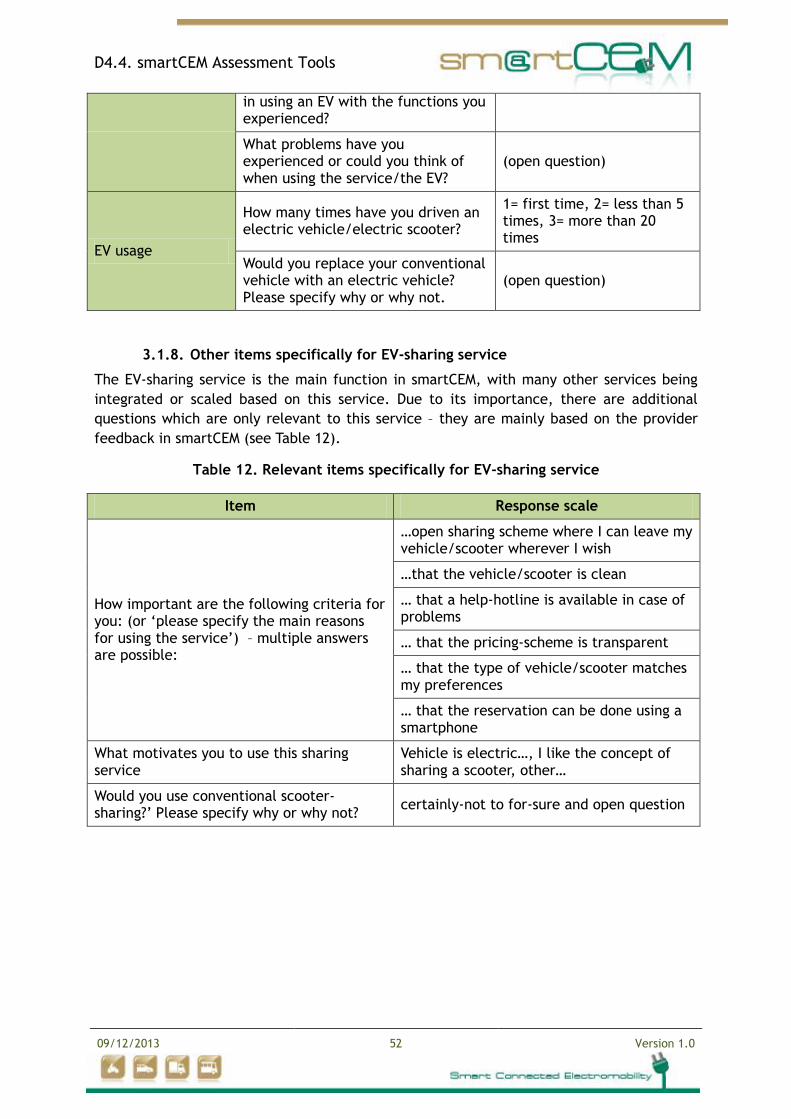
D4.4. smartCEM Assessment Tools
09/12/2013 52 Version 1.0
in using an EV with the functions you experienced?
What problems have you experienced or could you think of when using the service/the EV?
(open question)
EV usage
How many times have you driven an electric vehicle/electric scooter?
1= first time, 2= less than 5 times, 3= more than 20 times
Would you replace your conventional vehicle with an electric vehicle? Please specify why or why not.
(open question)
3.1.8. Other items specifically for EV-sharing service
The EV-sharing service is the main function in smartCEM, with many other services being
integrated or scaled based on this service. Due to its importance, there are additional
questions which are only relevant to this service – they are mainly based on the provider
feedback in smartCEM (see Table 12).
Table 12. Relevant items specifically for EV-sharing service
Item Response scale
How important are the following criteria for you: (or ‘please specify the main reasons for using the service’) – multiple answers are possible:
…open sharing scheme where I can leave my vehicle/scooter wherever I wish
…that the vehicle/scooter is clean
… that a help-hotline is available in case of problems
… that the pricing-scheme is transparent
… that the type of vehicle/scooter matches my preferences
… that the reservation can be done using a smartphone
What motivates you to use this sharing service
Vehicle is electric…, I like the concept of sharing a scooter, other…
Would you use conventional scooter-sharing?’ Please specify why or why not?
certainly-not to for-sure and open question
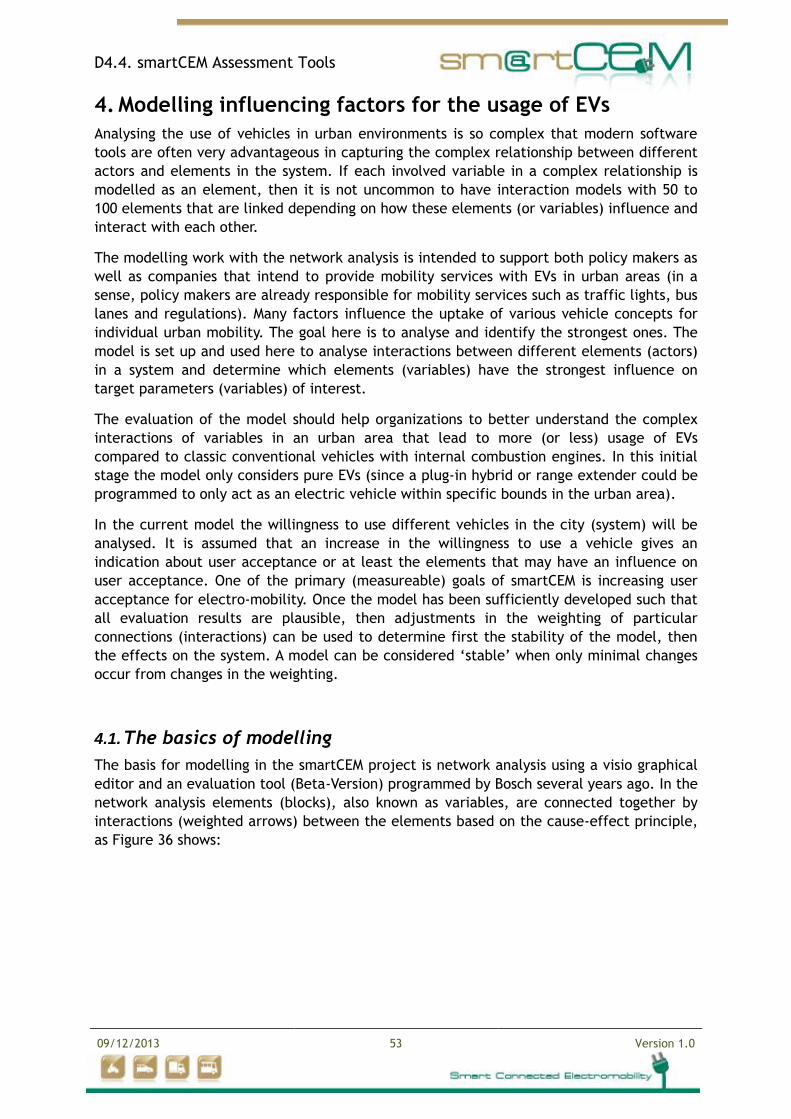
D4.4. smartCEM Assessment Tools
09/12/2013 53 Version 1.0
4. Modelling influencing factors for the usage of EVs
Analysing the use of vehicles in urban environments is so complex that modern software
tools are often very advantageous in capturing the complex relationship between different
actors and elements in the system. If each involved variable in a complex relationship is
modelled as an element, then it is not uncommon to have interaction models with 50 to
100 elements that are linked depending on how these elements (or variables) influence and
interact with each other.
The modelling work with the network analysis is intended to support both policy makers as
well as companies that intend to provide mobility services with EVs in urban areas (in a
sense, policy makers are already responsible for mobility services such as traffic lights, bus
lanes and regulations). Many factors influence the uptake of various vehicle concepts for
individual urban mobility. The goal here is to analyse and identify the strongest ones. The
model is set up and used here to analyse interactions between different elements (actors)
in a system and determine which elements (variables) have the strongest influence on
target parameters (variables) of interest.
The evaluation of the model should help organizations to better understand the complex
interactions of variables in an urban area that lead to more (or less) usage of EVs
compared to classic conventional vehicles with internal combustion engines. In this initial
stage the model only considers pure EVs (since a plug-in hybrid or range extender could be
programmed to only act as an electric vehicle within specific bounds in the urban area).
In the current model the willingness to use different vehicles in the city (system) will be
analysed. It is assumed that an increase in the willingness to use a vehicle gives an
indication about user acceptance or at least the elements that may have an influence on
user acceptance. One of the primary (measureable) goals of smartCEM is increasing user
acceptance for electro-mobility. Once the model has been sufficiently developed such that
all evaluation results are plausible, then adjustments in the weighting of particular
connections (interactions) can be used to determine first the stability of the model, then
the effects on the system. A model can be considered ‘stable’ when only minimal changes
occur from changes in the weighting.
4.1. The basics of modelling
The basis for modelling in the smartCEM project is network analysis using a visio graphical
editor and an evaluation tool (Beta-Version) programmed by Bosch several years ago. In the
network analysis elements (blocks), also known as variables, are connected together by
interactions (weighted arrows) between the elements based on the cause-effect principle,
as Figure 36 shows:
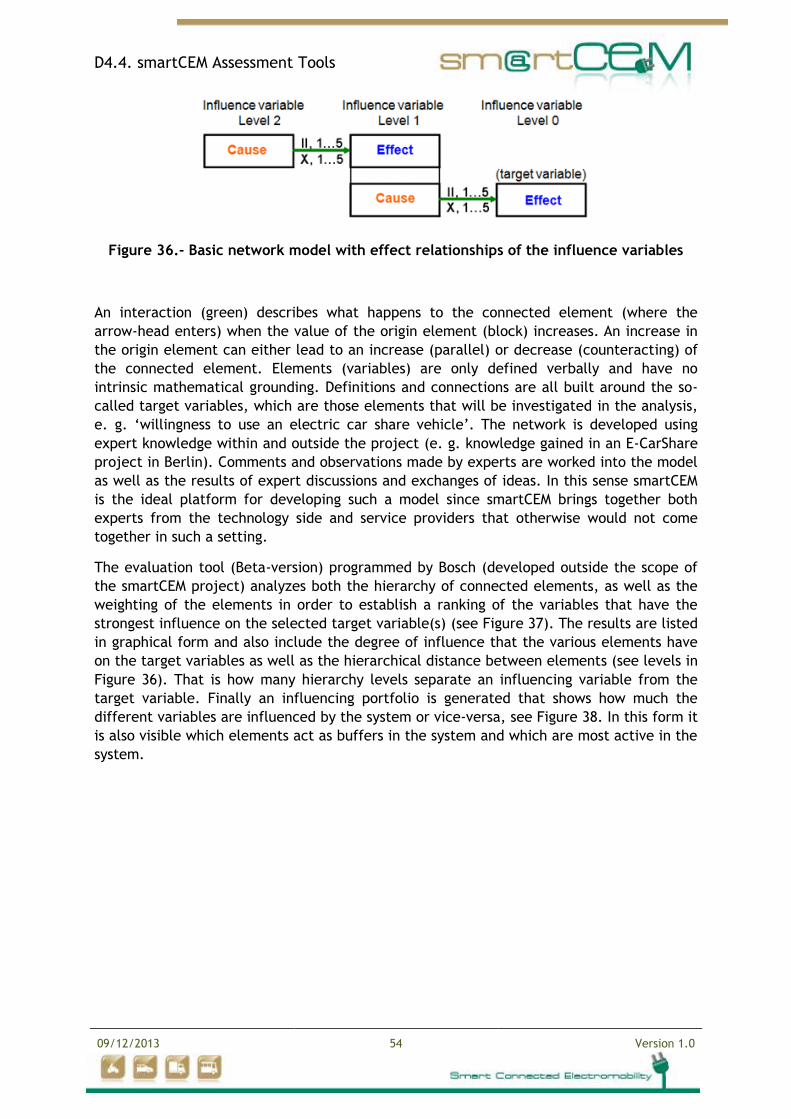
D4.4. smartCEM Assessment Tools
09/12/2013 54 Version 1.0
Figure 36.- Basic network model with effect relationships of the influence variables
An interaction (green) describes what happens to the connected element (where the
arrow-head enters) when the value of the origin element (block) increases. An increase in
the origin element can either lead to an increase (parallel) or decrease (counteracting) of
the connected element. Elements (variables) are only defined verbally and have no
intrinsic mathematical grounding. Definitions and connections are all built around the so-
called target variables, which are those elements that will be investigated in the analysis,
e. g. ‘willingness to use an electric car share vehicle’. The network is developed using
expert knowledge within and outside the project (e. g. knowledge gained in an E-CarShare
project in Berlin). Comments and observations made by experts are worked into the model
as well as the results of expert discussions and exchanges of ideas. In this sense smartCEM
is the ideal platform for developing such a model since smartCEM brings together both
experts from the technology side and service providers that otherwise would not come
together in such a setting.
The evaluation tool (Beta-version) programmed by Bosch (developed outside the scope of
the smartCEM project) analyzes both the hierarchy of connected elements, as well as the
weighting of the elements in order to establish a ranking of the variables that have the
strongest influence on the selected target variable(s) (see Figure 37). The results are listed
in graphical form and also include the degree of influence that the various elements have
on the target variables as well as the hierarchical distance between elements (see levels in
Figure 36). That is how many hierarchy levels separate an influencing variable from the
target variable. Finally an influencing portfolio is generated that shows how much the
different variables are influenced by the system or vice-versa, see Figure 38. In this form it
is also visible which elements act as buffers in the system and which are most active in the
system.
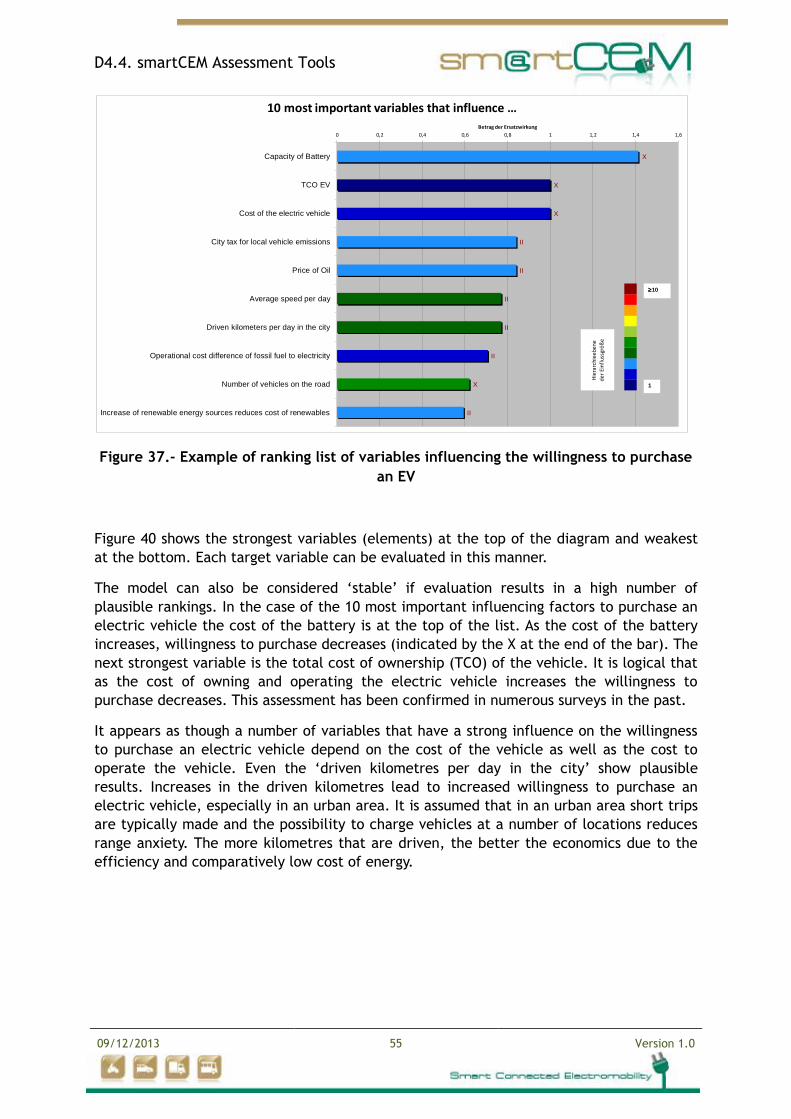
D4.4. smartCEM Assessment Tools
09/12/2013 55 Version 1.0
X
X
X
II
II
II
II
II
X
II
0 0,2 0,4 0,6 0,8 1 1,2 1,4 1,6
Capacity of Battery
TCO EV
Cost of the electric vehicle
City tax for local vehicle emissions
Price of Oil
Average speed per day
Driven kilometers per day in the city
Operational cost difference of fossil fuel to electricity
Number of vehicles on the road
Increase of renewable energy sources reduces cost of renewables
Betrag der Ersatzwirkung
10 most important variables that influence …
Hie
rarc
hiee
ben
e
der
Einf
luss
grö
ße
1
10
Figure 37.- Example of ranking list of variables influencing the willingness to purchase
an EV
Figure 40 shows the strongest variables (elements) at the top of the diagram and weakest
at the bottom. Each target variable can be evaluated in this manner.
The model can also be considered ‘stable’ if evaluation results in a high number of
plausible rankings. In the case of the 10 most important influencing factors to purchase an
electric vehicle the cost of the battery is at the top of the list. As the cost of the battery
increases, willingness to purchase decreases (indicated by the X at the end of the bar). The
next strongest variable is the total cost of ownership (TCO) of the vehicle. It is logical that
as the cost of owning and operating the electric vehicle increases the willingness to
purchase decreases. This assessment has been confirmed in numerous surveys in the past.
It appears as though a number of variables that have a strong influence on the willingness
to purchase an electric vehicle depend on the cost of the vehicle as well as the cost to
operate the vehicle. Even the ‘driven kilometres per day in the city’ show plausible
results. Increases in the driven kilometres lead to increased willingness to purchase an
electric vehicle, especially in an urban area. It is assumed that in an urban area short trips
are typically made and the possibility to charge vehicles at a number of locations reduces
range anxiety. The more kilometres that are driven, the better the economics due to the
efficiency and comparatively low cost of energy.
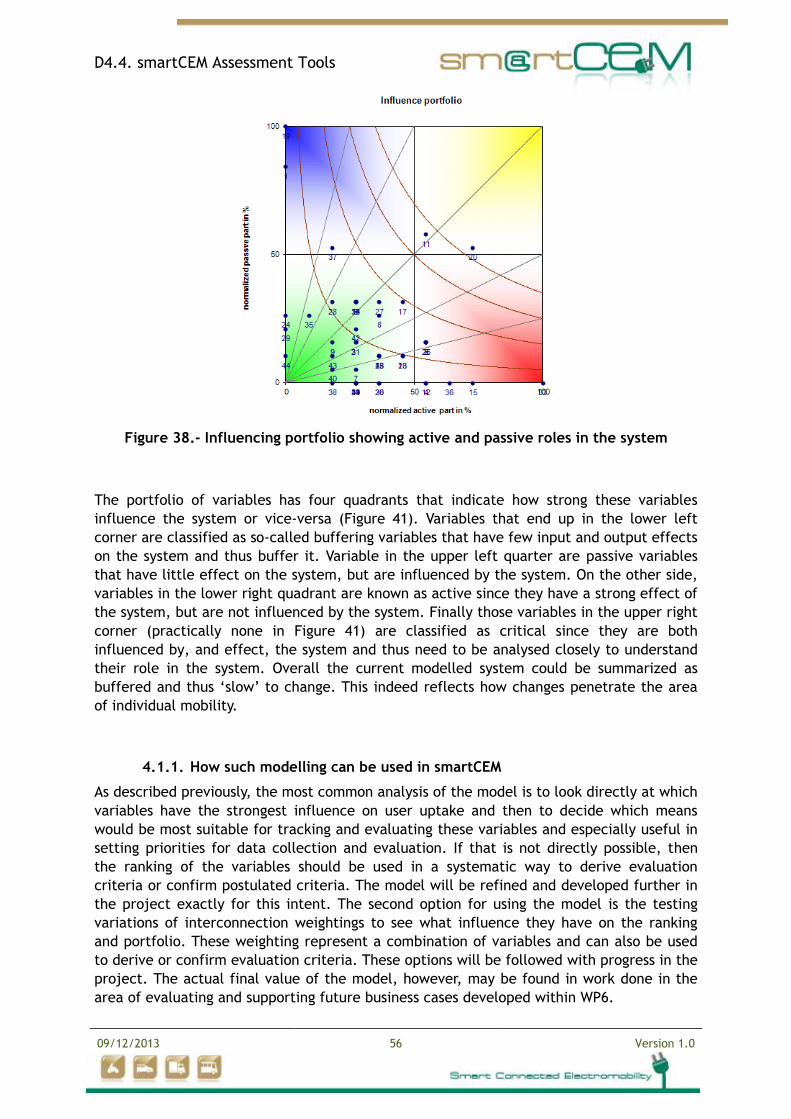
D4.4. smartCEM Assessment Tools
09/12/2013 56 Version 1.0
Figure 38.- Influencing portfolio showing active and passive roles in the system
The portfolio of variables has four quadrants that indicate how strong these variables
influence the system or vice-versa (Figure 41). Variables that end up in the lower left
corner are classified as so-called buffering variables that have few input and output effects
on the system and thus buffer it. Variable in the upper left quarter are passive variables
that have little effect on the system, but are influenced by the system. On the other side,
variables in the lower right quadrant are known as active since they have a strong effect of
the system, but are not influenced by the system. Finally those variables in the upper right
corner (practically none in Figure 41) are classified as critical since they are both
influenced by, and effect, the system and thus need to be analysed closely to understand
their role in the system. Overall the current modelled system could be summarized as
buffered and thus ‘slow’ to change. This indeed reflects how changes penetrate the area
of individual mobility.
4.1.1. How such modelling can be used in smartCEM
As described previously, the most common analysis of the model is to look directly at which
variables have the strongest influence on user uptake and then to decide which means
would be most suitable for tracking and evaluating these variables and especially useful in
setting priorities for data collection and evaluation. If that is not directly possible, then
the ranking of the variables should be used in a systematic way to derive evaluation
criteria or confirm postulated criteria. The model will be refined and developed further in
the project exactly for this intent. The second option for using the model is the testing
variations of interconnection weightings to see what influence they have on the ranking
and portfolio. These weighting represent a combination of variables and can also be used
to derive or confirm evaluation criteria. These options will be followed with progress in the
project. The actual final value of the model, however, may be found in work done in the
area of evaluating and supporting future business cases developed within WP6.
D4.4. smartCEM Assessment Tools
09/12/2013 57 Version 1.0
It goes without saying that the model is only as good as the assumptions that go into
setting the model up and the ability to define interactions between the blocks that are
unique and independent of each other. This is seldom the case, but always the goal in
improving the model. The model lives from good discussion and feedback, as well as
careful thoughts about the relations between the different elements.
4.2. The model
4.2.1. First steps setting up the model
One of the first steps in setting up the model is to agree on the input and boundary
conditions as well as the key assumptions.
Inputs and boundary conditions
The policy maker (or service provider) will certainly be looking at the model and results at
this current point in time. However, the policy maker needs to assess the impact of
changes in the urban area that will be favourable (or less favourable) for EV uptake in the
area. Some possible changes that will be considered as inputs to the model:
Increases/decreases in Settlement Density (urbanization is a continuing trend and
challenge for city planners)
Increase/decreases in the price of oil
Increase/decrease in the number of vehicles on the road
Future developments in battery capacity
Driven kilometres per day
Others?
Key assumptions
Analysis looks primarily at vehicle usage within the urban area or surrounding
satellites of the urban area (urban region)
The model may also include (indirect) benefits for EVs in the urban areas, such as
reduced cost for parking or access to attractive parking spots
Deciding on the choice of vehicle for longer trips such as a vacation is not included
Deciding to use (or not use) public transport in the mobility chain is not (yet)
included
When considering mechanisms to restrict travel in urban areas, we have London in
the back of minds as the best example of implementing a congestion zone tax for
travel into the centre of London during peak hours
D4.4. smartCEM Assessment Tools
09/12/2013 58 Version 1.0
It is suggested to consider the percentage of use (mixture of number of trips and
kilometres) as the target variables (and not ‘willingness’ …)
The next step is then to agree on target variables.
Target variables
Initial target variables for the analysis chosen for the model should reflect user acceptance
(links to the relevant smartCEM sites are also included):
Willing to use own private conventional vehicle
Willing to use integrated public conventional vehicle – car-share with current
vehicles,
Willing to use own private electric vehicle Newcastle
Willing to use integrated public electric vehicle – car share with EVs Donosti -
San Sebastian and Barcelona.
Willingness to purchase an electric vehicle.
Variables that consider the cost factors have been included. Variables that reflect trip
time, travel speed and the parking situation availability have also been included as well as
the aspects of settlement density and vehicles on the road. The topic of environmental
issues facing urban areas has been started but can be further developed and linked with
factors that influence the willingness of a municipality to set up charging stations in the
urban setting. Elements that should reflect car sharing have also been included. The most
important variables included are potential emission taxes and restricted areas in the city.
The model currently includes 45 variables and could grow within the project up to 100
variables, depending on the ability to capture expert knowledge in the right level of detail
and fidelity for the model. For an overview of the Model see Figure 39.
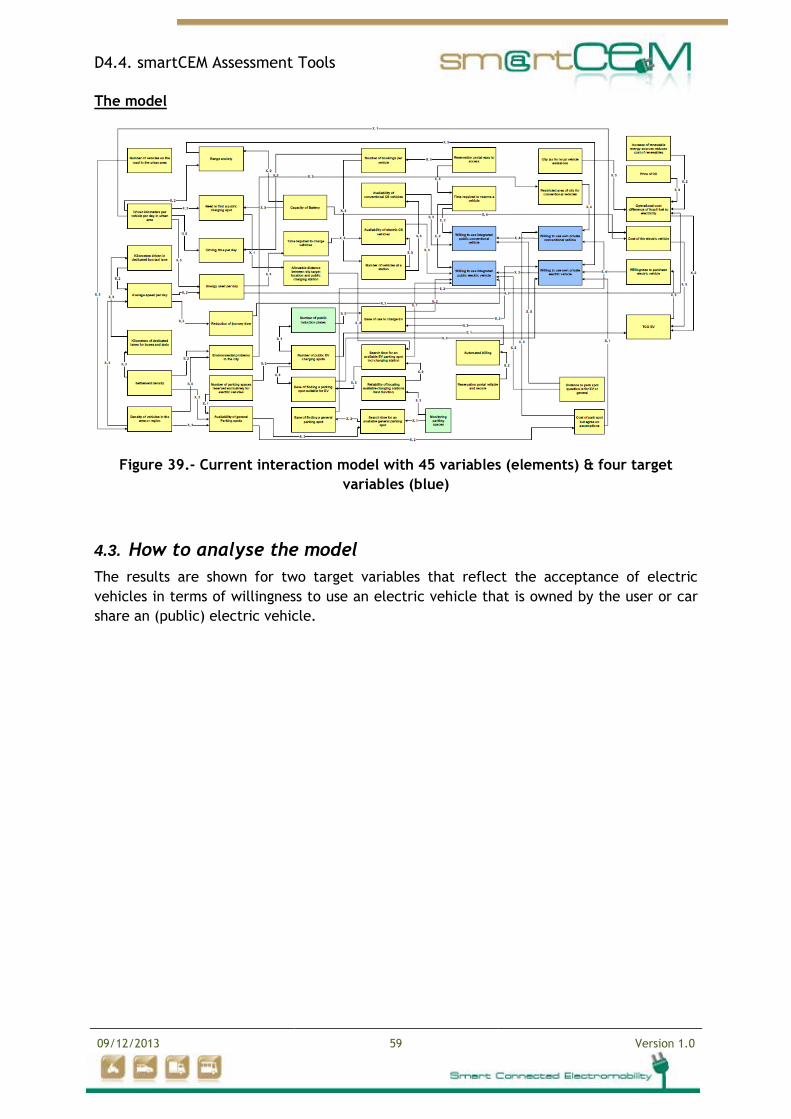
D4.4. smartCEM Assessment Tools
09/12/2013 59 Version 1.0
The model
Figure 39.- Current interaction model with 45 variables (elements) & four target
variables (blue)
4.3. How to analyse the model
The results are shown for two target variables that reflect the acceptance of electric
vehicles in terms of willingness to use an electric vehicle that is owned by the user or car
share an (public) electric vehicle.
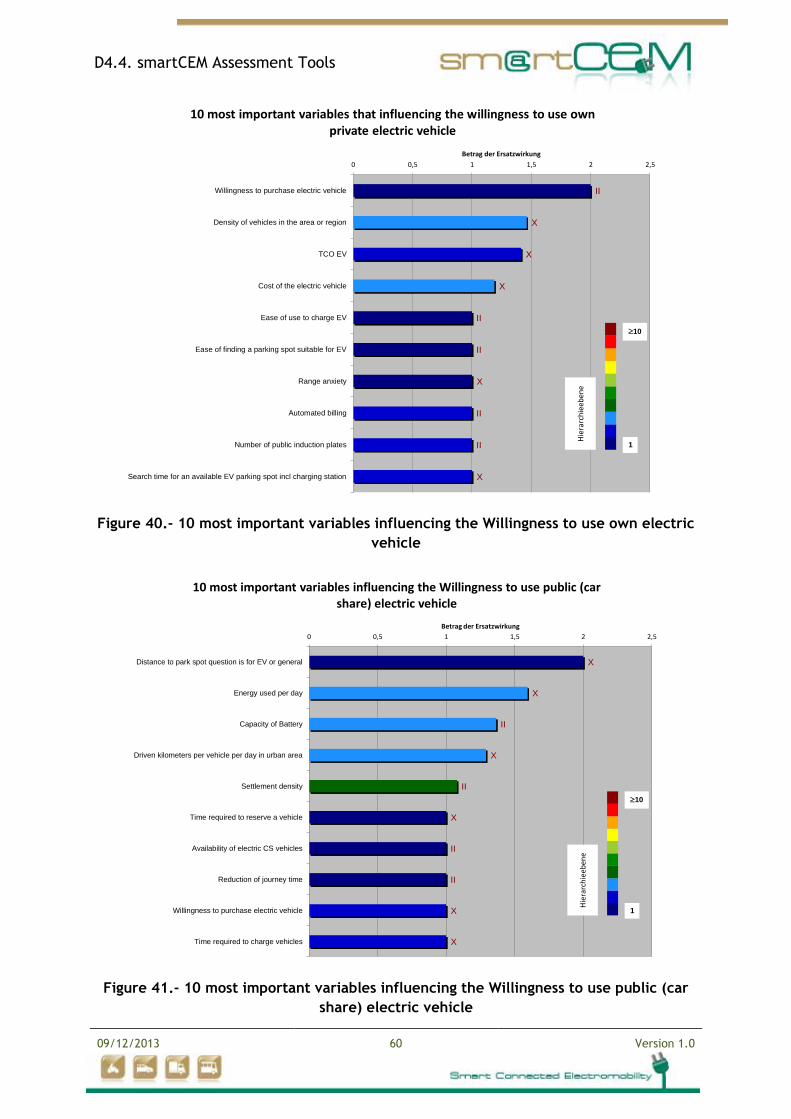
D4.4. smartCEM Assessment Tools
09/12/2013 60 Version 1.0
II
X
X
X
II
II
X
II
II
X
0 0,5 1 1,5 2 2,5
Willingness to purchase electric vehicle
Density of vehicles in the area or region
TCO EV
Cost of the electric vehicle
Ease of use to charge EV
Ease of finding a parking spot suitable for EV
Range anxiety
Automated billing
Number of public induction plates
Search time for an available EV parking spot incl charging station
Betrag der Ersatzwirkung
10 most important variables that influencing the willingness to use own private electric vehicle
Hie
rarc
hie
eben
e
1
10
Figure 40.- 10 most important variables influencing the Willingness to use own electric
vehicle
X
X
II
X
II
X
II
II
X
X
0 0,5 1 1,5 2 2,5
Distance to park spot question is for EV or general
Energy used per day
Capacity of Battery
Driven kilometers per vehicle per day in urban area
Settlement density
Time required to reserve a vehicle
Availability of electric CS vehicles
Reduction of journey time
Willingness to purchase electric vehicle
Time required to charge vehicles
Betrag der Ersatzwirkung
10 most important variables influencing the Willingness to use public (car share) electric vehicle
Hie
rarc
hie
eben
e
1
10
Figure 41.- 10 most important variables influencing the Willingness to use public (car
share) electric vehicle
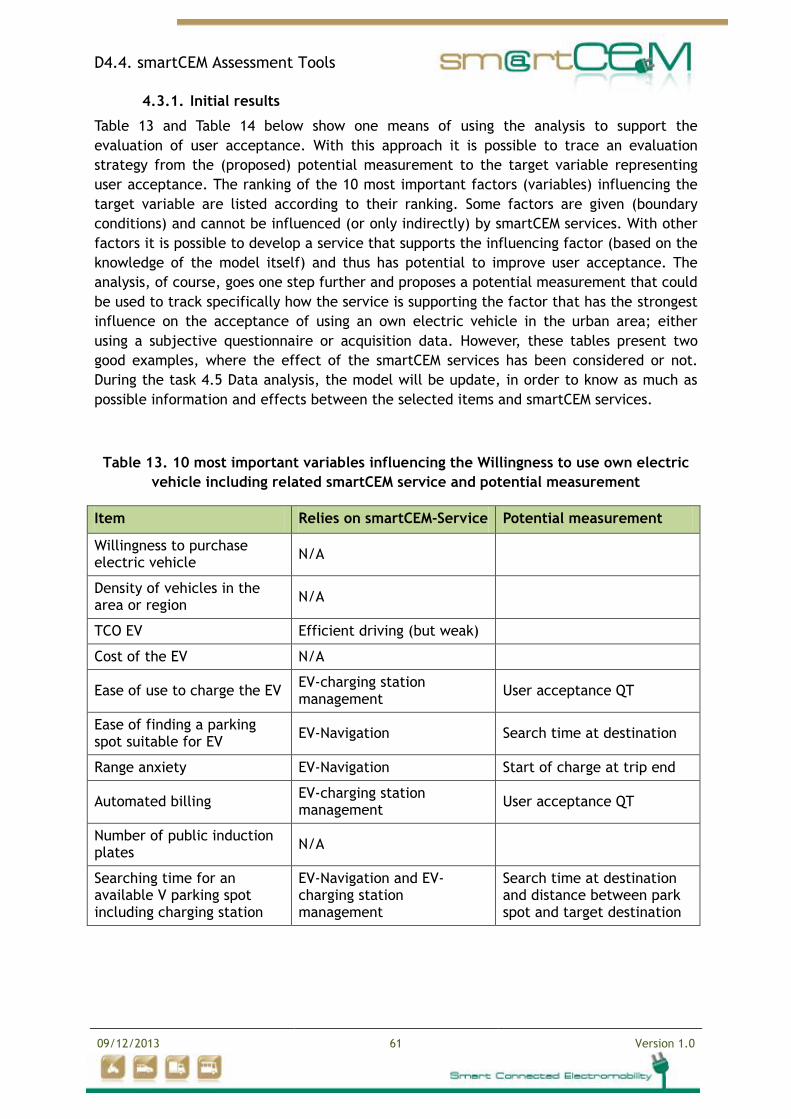
D4.4. smartCEM Assessment Tools
09/12/2013 61 Version 1.0
4.3.1. Initial results
Table 13 and Table 14 below show one means of using the analysis to support the
evaluation of user acceptance. With this approach it is possible to trace an evaluation
strategy from the (proposed) potential measurement to the target variable representing
user acceptance. The ranking of the 10 most important factors (variables) influencing the
target variable are listed according to their ranking. Some factors are given (boundary
conditions) and cannot be influenced (or only indirectly) by smartCEM services. With other
factors it is possible to develop a service that supports the influencing factor (based on the
knowledge of the model itself) and thus has potential to improve user acceptance. The
analysis, of course, goes one step further and proposes a potential measurement that could
be used to track specifically how the service is supporting the factor that has the strongest
influence on the acceptance of using an own electric vehicle in the urban area; either
using a subjective questionnaire or acquisition data. However, these tables present two
good examples, where the effect of the smartCEM services has been considered or not.
During the task 4.5 Data analysis, the model will be update, in order to know as much as
possible information and effects between the selected items and smartCEM services.
Table 13. 10 most important variables influencing the Willingness to use own electric
vehicle including related smartCEM service and potential measurement
Item Relies on smartCEM-Service Potential measurement
Willingness to purchase electric vehicle
N/A
Density of vehicles in the area or region
N/A
TCO EV Efficient driving (but weak)
Cost of the EV N/A
Ease of use to charge the EV EV-charging station management
User acceptance QT
Ease of finding a parking spot suitable for EV
EV-Navigation Search time at destination
Range anxiety EV-Navigation Start of charge at trip end
Automated billing EV-charging station management
User acceptance QT
Number of public induction plates
N/A
Searching time for an available V parking spot including charging station
EV-Navigation and EV-charging station management
Search time at destination and distance between park spot and target destination
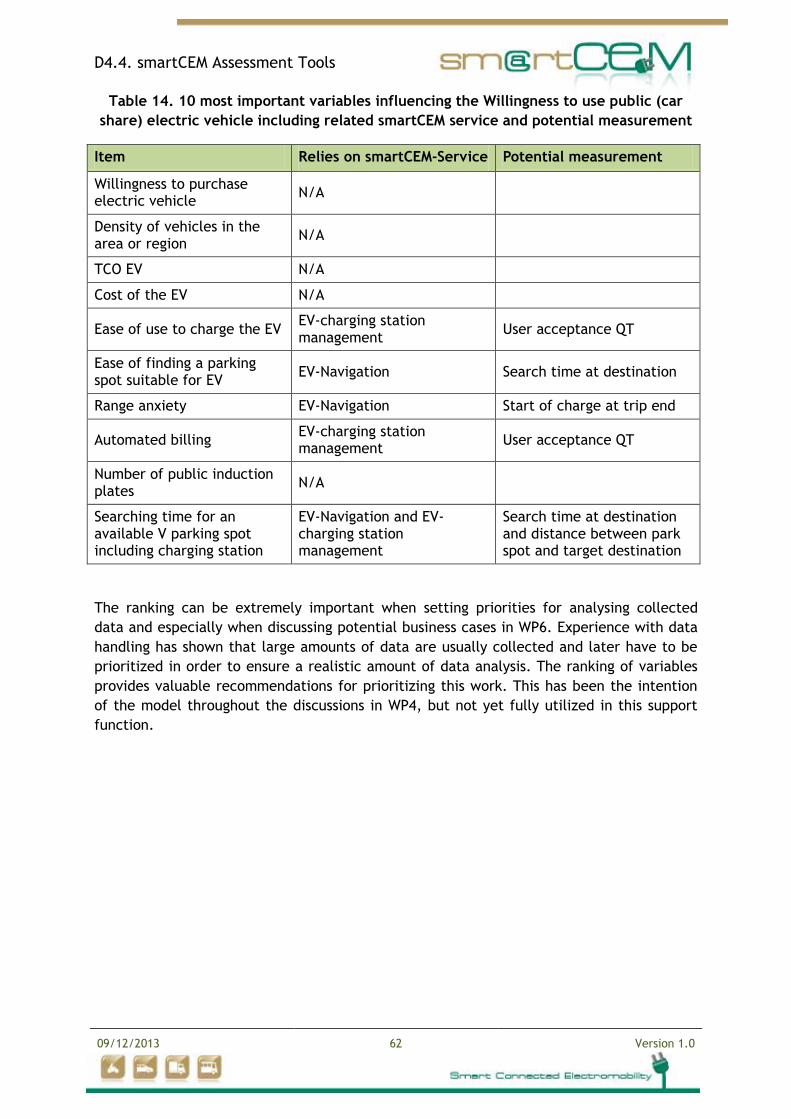
D4.4. smartCEM Assessment Tools
09/12/2013 62 Version 1.0
Table 14. 10 most important variables influencing the Willingness to use public (car
share) electric vehicle including related smartCEM service and potential measurement
Item Relies on smartCEM-Service Potential measurement
Willingness to purchase electric vehicle
N/A
Density of vehicles in the area or region
N/A
TCO EV N/A
Cost of the EV N/A
Ease of use to charge the EV EV-charging station management
User acceptance QT
Ease of finding a parking spot suitable for EV
EV-Navigation Search time at destination
Range anxiety EV-Navigation Start of charge at trip end
Automated billing EV-charging station management
User acceptance QT
Number of public induction plates
N/A
Searching time for an available V parking spot including charging station
EV-Navigation and EV-charging station management
Search time at destination and distance between park spot and target destination
The ranking can be extremely important when setting priorities for analysing collected
data and especially when discussing potential business cases in WP6. Experience with data
handling has shown that large amounts of data are usually collected and later have to be
prioritized in order to ensure a realistic amount of data analysis. The ranking of variables
provides valuable recommendations for prioritizing this work. This has been the intention
of the model throughout the discussions in WP4, but not yet fully utilized in this support
function.
D4.4. smartCEM Assessment Tools
09/12/2013 63 Version 1.0
5. CONCLUSIONS
This deliverable describes the assessment tools developed in smartCEM Task 4.4. These
tools should be used by Task 4.5 to collect and analyse the acquired data in each pilot site.
The smartCEM CO2 emissions evaluation tool described in Chapter 2, requires quality input
data in order to obtain useful results, and it is required that the files created by WP3 are
Excel files (or csv), in order to be compatible with the developed tool.
The questionnaires presented in Chapter 3, are designed to investigate if and how the user
acceptance of EVs is affected by the adoption of smartCEM services. For both the uptake of
EVs and the uptake of the implemented services in the pilot sites, three concepts were
identified as the most relevant: acceptance, range-anxiety and willingness-to-pay. After
having collected all the feedbacks, a comparison between the baseline condition and the
operational phase will be carried out in order to assess the improvement of EV user-uptake
fostered by smartCEM services.
Previous research studies, such as EC-co-funded FP7 projects euroFOT
(http://www.eurofot-ip.eu) and TeleFOT (http://www.telefot.eu) assessed impact of
technology concerning users-related aspects. A huge campaign of questionnaires was
carried out and a huge set of subjective data was collected. Relevant information about
users' acceptance of systems, usability, workload and trust were gathered and they allowed
researchers to test hypotheses about the impact of systems on safety, environment,
efficiency and mobility. Several lessons learnt were collected about usage of
questionnaires as tools for collecting subjective data. The most relevant are about length
of questionnaires which should be limited, and the usage of open-ended questions. Others
concern the redundancy of complexion methods, reminders and incentives to be provided
to users in order to improve response rates.
These lessons learnt and best practice should be taken into account in smartCEM in order
to save resources and improve quality of collected data. As a consequence, in smartCEM,
the use of the questionnaires is proposed as follows: use the long versions for focus group
sessions or interviews whereas the short versions can be used directly after vehicle usage.
As mentioned above, results from and interaction with the model can be used to help focus
and prioritize questions in the questionnaires. On the other hand replies from the
questionnaires and focus groups have been confirmed by the model as means of assessing
increased acceptance of EVs due to the services.
The general questionnaires include items on demographics, travel & mobility, attitudes and
general questions concerning EVs (user-acceptance, range-anxiety and willingness-to-pay).
The service questionnaires focus on the evaluation of the smartCEM services only. For each
type of vehicle (electric vehicle, electric scooter, and hybrid bus) use the relevant
questionnaire. All questionnaire types can be found in the annexes.
Finally, related to the model, it can be stated that this model is very useful since the
ranking can be extremely important when setting priorities for analysing collected data
and especially when discussing potential business cases in WP6. Experience with data
handling has shown that large amounts of data are usually collected and later have to be
prioritized in order to ensure a realistic amount of data analysis. The ranking of variables
provides valuable recommendations for prioritizing this work. As well, it can be highlighted
D4.4. smartCEM Assessment Tools
09/12/2013 64 Version 1.0
as first conclusions, also related with the surveys’ results, that on the acceptance side, the
results of nearly every survey show that costs (and total cost of ownership) are always at
the top.
D4.4. smartCEM Assessment Tools
09/12/2013 65 Version 1.0
6. REFERENCES
ARTEMIS project (Assessment and Reliability of Transport Emission Models and
Inventory Systems), a European Commission project (2000-2007).
(http://www.trl.co.uk/artemis/)
Ajzen, I., & Fishbein, M. (1980). Understanding Attitudes and Predicting Social
Behaviour. Prentice-Hall, Englewood Cliffs, NJ.
Bakker J. J., (2011). Contesting range anxiety: The role of electric vehicle charging
infrastructure in the transportation transition, TU/e, Eindhoven.
Bertrand, M., & Bouchard, S. (2008). Applying the technology acceptance model to
VR with people who are favourable to its use. Journal of Cyber Therapy and
Rehabilitation, 1(2).
Brooke, J. (1986). SUS - A quick and dirty usability scale. Earley.
COPERT 4 software (http://www.emisia.com/copert/General.html)
COST 319 action on the Estimation of Emissions from Transport (1993-1998).
(http://www.cost.eu)
Davis, F. D. (1993). User acceptance of information technology: system
characteristics, user perceptions and behavioral impacts. International Journal of
Man-Machine Studies, 38, 475–487.
Davis, F. D., Bargozzi, R. P., & Warshaw, P. R. (1989). User acceptance of computer
technology: a comparison of two theoretical models. Management Science, 35, 982–
1003.
Everett A., Burgess M., Walsh C., (2011). Initial Findings from the Ultra Low Carbon
Vehicle Demonstrator Programme, Technology Strategic Board, Swindon.
Ferreira J. C., Monteiro V., Afonso J. L., (2012).Electric vehicle route recommender
system, International conference on smart grids and Green IT systems, Porto.
Höltl, A., Trommer, S., Schießl, C., Fricke, N., Staubach, M., Hoek, R.,
Bernatallada, G. (2012). Requirements and motivators for private and commercial
drivers. D6.1. Retrieved from http://ecomove-
project.eu/assets/Documents/Deliverables/New/To-be-updated/120622-DEL-SP6-
D6.1-updated.pdf
JEC WTW study Version 4 ‘Well-to-Wheels analysis of future automotive fuels and
powertrains in the European context WELL-TO-TANK (WTT)’ Report, Version 4, July
2013. (http://iet.jrc.ec.europa.eu/)
LBST (L-B-System Technic). (http://www.lbst.de)
MEET project (Methodologies to Estimate Emissions from Transport), a European
Commission sponsored project (1996-1998) (http://ec.europa.eu/index_en.htm)
D4.4. smartCEM Assessment Tools
09/12/2013 66 Version 1.0
Nilsson M., (2011).Electric vehicles: An interview study investigating the
phenomenon of range anxiety, Elvire project, Gothenburg.
PARTICULATES project (Characterization of Exhaust Particulate Emissions from Road
Vehicles), a European Commission project (2000-2003).
(http://ec.europa.eu/transport/road_safety/pdf/projects/particulates.pdf)
Pearre N. S. et al., (2011). Electric vehicles: How much range is required for a day’s
driving?, Transportation Research Part C 19, pp. 1171-1184, Elsevier.
Ramírez A. L., Jiménez A. L., (2012). Simulation of an extended range electric
vehicle usage in a real environment, Hogskolan.
Rohrmann, B. (2007). Verbal qualifiers for rating scales: Sociolinguistic
considerations and psychometric data. Project Report. University of
Melbourne/Australia.
Robinson A.P., Blythe P.T., Bell, M.C., Huebner, Y., Hill, G.A. (2013). Analysis of
electric vehicle driver recharging demand profiles and subsequent impacts on the
carbon content of electric vehicle trips by in Energy Policy 61, 2013, PP337-348
Van Der Laan, J. D., Heino, A., & De Waard, D. (1997). A simple procedure for the
assessment of acceptance of advanced transport telematics. Transportation
Research Part C: …, 5(1), 1–10. Retrieved from
http://www.sciencedirect.com/science/article/pii/S0968090X96000253.
D4.4. smartCEM Assessment Tools
09/12/2013 67 Version 1.0
7. ANNEXES
User-questionnaire general user-uptake long version for electric vehicles
User-questionnaire general user-uptake long version for electric scooters
User-questionnaire service user-uptake long version for electric vehicles
User-questionnaire service user-uptake long version for electric scooters
User-questionnaire general and service user-uptake for hybrid bus
User-questionnaire general user-uptake short version for electric vehicles
User-questionnaire general user-uptake short version for electric scooters

D4.4. smartCEM Assessment Tools
09/12/2013 68 Version 1.0
7.1. User-questionnaire: general user-uptake long version for electric vehicles
What is your age? _________ no answer
What is your gender? female male no answer
What is your current employment status? full-time part-time retired full-time homemaker
unemployed seeking employment unemployed not seeking employment full-time student volunteer work (unpaid) no answer
How can your job status be classified? employee self-employed student
unemployed retired not employed no answer
What is your latest school leaving qualification? no school completed elementary school high school
college/university post graduate studies no answer
Do you hold a valid car driving license? yes no no answer
Do you hold a monthly public transport ticket? yes no no answer
What is your monthly net income?
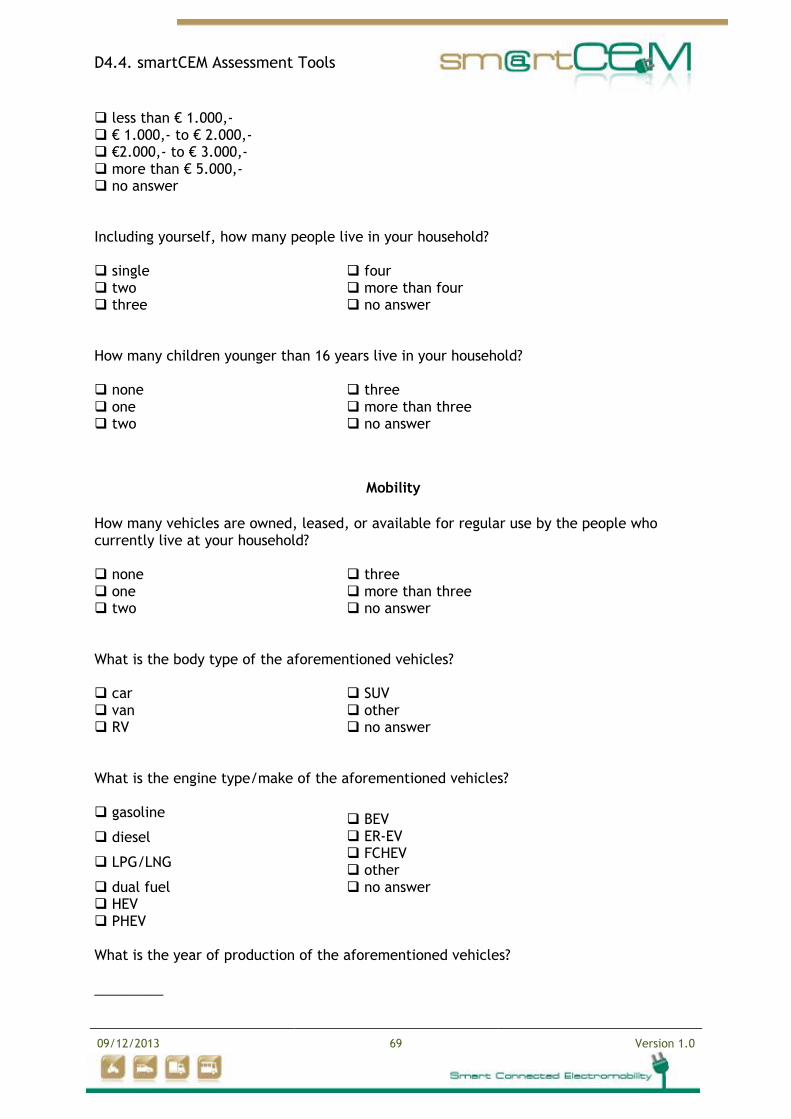
D4.4. smartCEM Assessment Tools
09/12/2013 69 Version 1.0
less than € 1.000,- € 1.000,- to € 2.000,- €2.000,- to € 3.000,- more than € 5.000,- no answer
Including yourself, how many people live in your household? single two three
four more than four no answer
How many children younger than 16 years live in your household? none one two
three more than three no answer
Mobility
How many vehicles are owned, leased, or available for regular use by the people who currently live at your household? none one two
three more than three no answer
What is the body type of the aforementioned vehicles? car van RV
SUV other no answer
What is the engine type/make of the aforementioned vehicles? gasoline
diesel
LPG/LNG
dual fuel HEV PHEV
BEV ER-EV FCHEV other no answer
What is the year of production of the aforementioned vehicles? _________
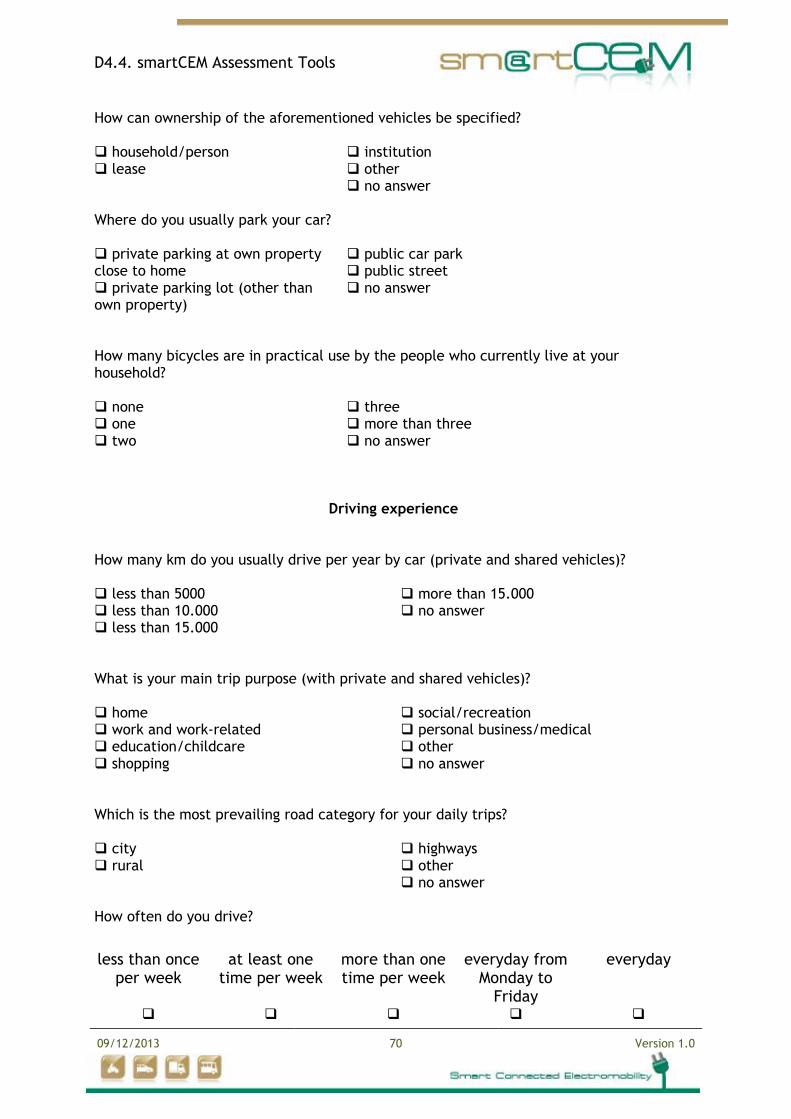
D4.4. smartCEM Assessment Tools
09/12/2013 70 Version 1.0
Driving experience
How many km do you usually drive per year by car (private and shared vehicles)? less than 5000 less than 10.000 less than 15.000
more than 15.000 no answer
What is your main trip purpose (with private and shared vehicles)? home work and work-related education/childcare shopping
social/recreation personal business/medical other no answer
Which is the most prevailing road category for your daily trips? city rural
highways other no answer
How often do you drive?
less than once per week
at least one time per week
more than one time per week
everyday from Monday to
Friday
everyday
How can ownership of the aforementioned vehicles be specified? household/person lease
institution other no answer
Where do you usually park your car? private parking at own property close to home private parking lot (other than own property)
public car park public street no answer
How many bicycles are in practical use by the people who currently live at your household? none one two
three more than three no answer
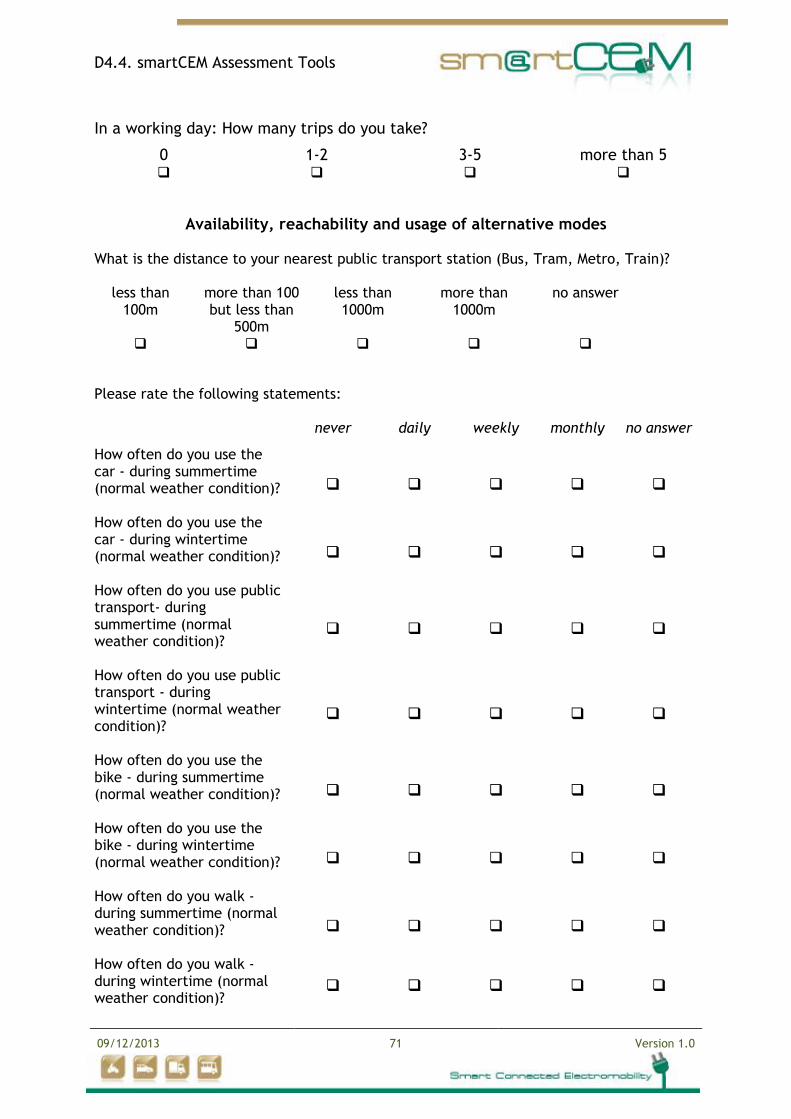
D4.4. smartCEM Assessment Tools
09/12/2013 71 Version 1.0
In a working day: How many trips do you take?
0 1-2 3-5 more than 5
Availability, reachability and usage of alternative modes What is the distance to your nearest public transport station (Bus, Tram, Metro, Train)?
less than 100m
more than 100 but less than
500m
less than 1000m
more than 1000m
no answer
Please rate the following statements:
never daily weekly monthly no answer
How often do you use the car - during summertime (normal weather condition)?
How often do you use the car - during wintertime (normal weather condition)?
How often do you use public transport- during summertime (normal weather condition)?
How often do you use public transport - during wintertime (normal weather condition)?
How often do you use the bike - during summertime (normal weather condition)?
How often do you use the bike - during wintertime (normal weather condition)?
How often do you walk - during summertime (normal weather condition)?
How often do you walk - during wintertime (normal weather condition)?
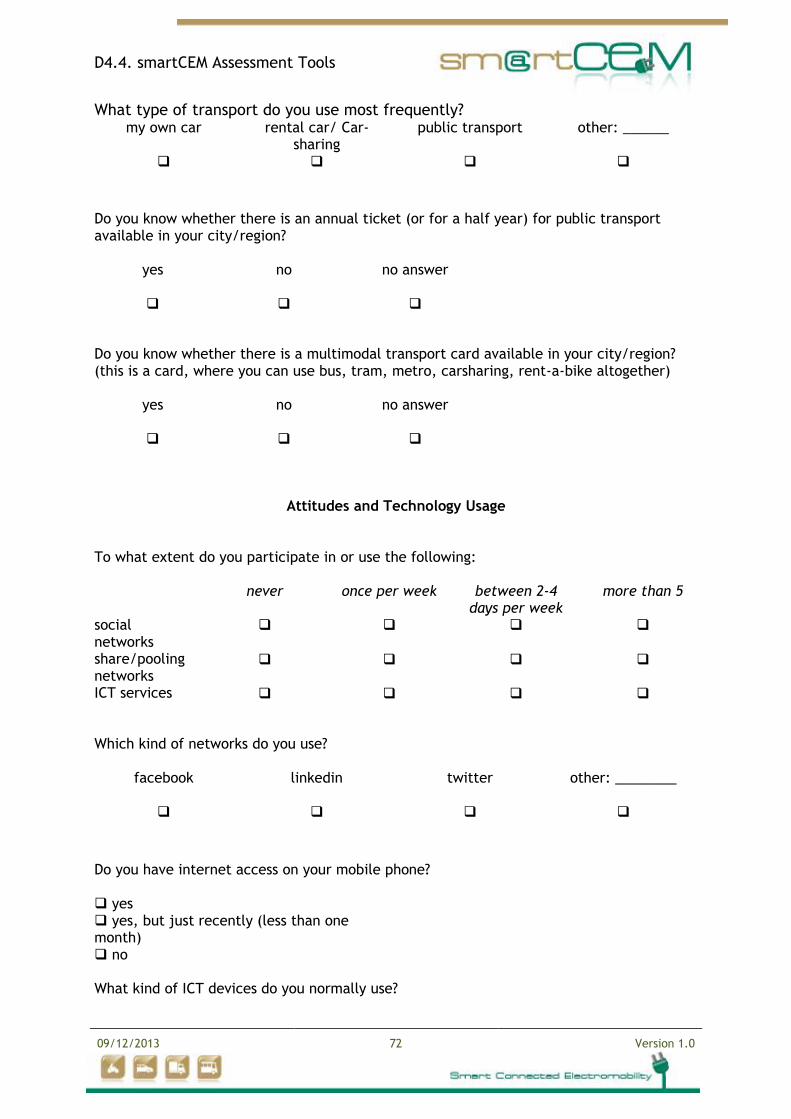
D4.4. smartCEM Assessment Tools
09/12/2013 72 Version 1.0
What type of transport do you use most frequently? my own car rental car/ Car-
sharing public transport
other: ______
Do you know whether there is an annual ticket (or for a half year) for public transport available in your city/region?
yes
no no answer
Do you know whether there is a multimodal transport card available in your city/region? (this is a card, where you can use bus, tram, metro, carsharing, rent-a-bike altogether)
yes
no no answer
Attitudes and Technology Usage To what extent do you participate in or use the following:
never once per week between 2-4 days per week
more than 5
social networks
share/pooling networks
ICT services
Which kind of networks do you use?
linkedin twitter other: ________
Do you have internet access on your mobile phone? yes yes, but just recently (less than one month) no
What kind of ICT devices do you normally use?
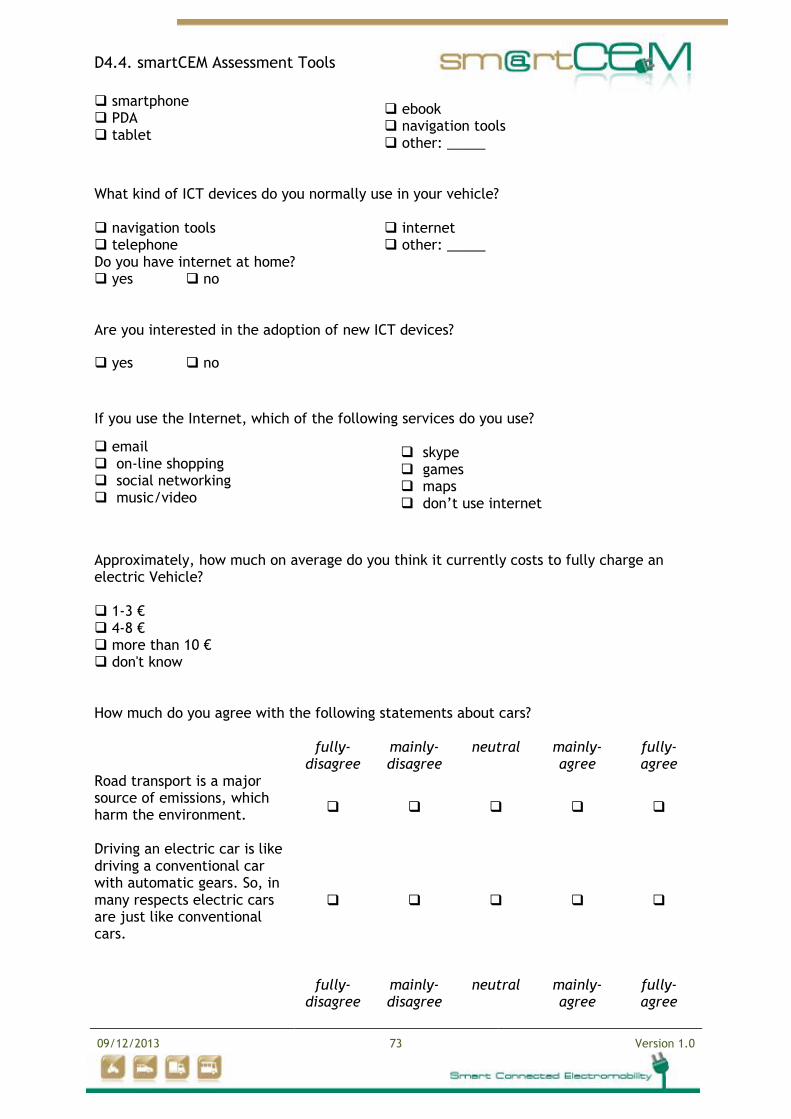
D4.4. smartCEM Assessment Tools
09/12/2013 73 Version 1.0
How much do you agree with the following statements about cars? fully-
disagree mainly-disagree
neutral mainly-agree
fully-agree
Road transport is a major source of emissions, which harm the environment.
Driving an electric car is like driving a conventional car with automatic gears. So, in many respects electric cars are just like conventional cars.
fully-
disagree
mainly-disagree
neutral
mainly-agree
fully-agree
smartphone PDA tablet
ebook navigation tools other: _____
What kind of ICT devices do you normally use in your vehicle? navigation tools telephone
internet other: _____
Do you have internet at home? yes no
Are you interested in the adoption of new ICT devices?
yes no
If you use the Internet, which of the following services do you use?
email on-line shopping social networking music/video
skype games maps don’t use internet
Approximately, how much on average do you think it currently costs to fully charge an electric Vehicle? 1-3 € 4-8 € more than 10 € don't know
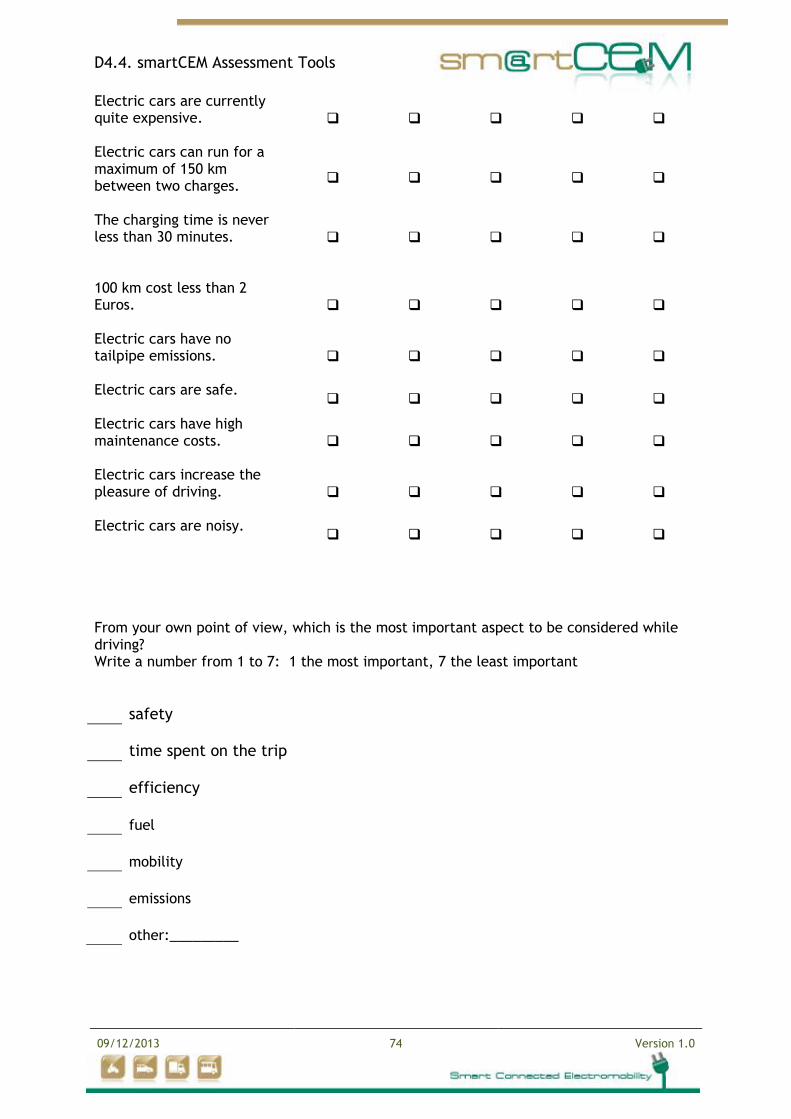
D4.4. smartCEM Assessment Tools
09/12/2013 74 Version 1.0
Electric cars are currently quite expensive.
Electric cars can run for a maximum of 150 km between two charges.
The charging time is never less than 30 minutes.
100 km cost less than 2 Euros.
Electric cars have no tailpipe emissions.
Electric cars are safe.
Electric cars have high maintenance costs.
Electric cars increase the pleasure of driving.
Electric cars are noisy.
From your own point of view, which is the most important aspect to be considered while driving? Write a number from 1 to 7: 1 the most important, 7 the least important
safety
time spent on the trip
efficiency
fuel
mobility
emissions
other:_________
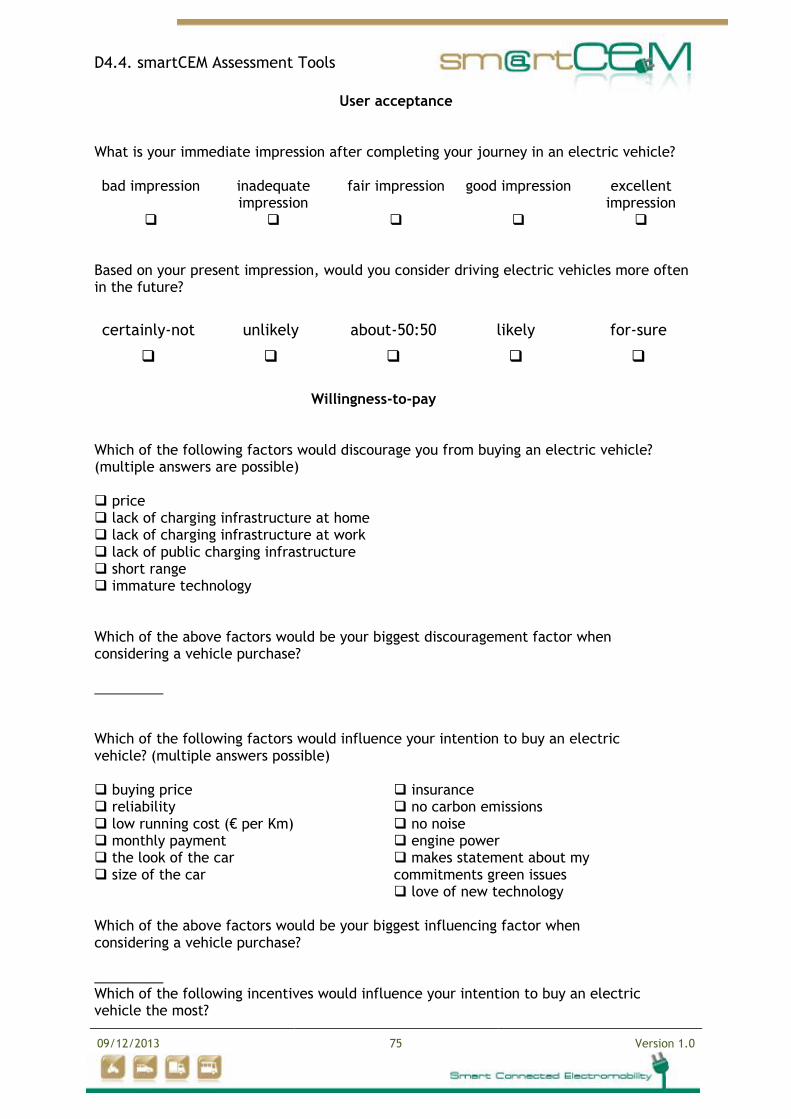
D4.4. smartCEM Assessment Tools
09/12/2013 75 Version 1.0
User acceptance What is your immediate impression after completing your journey in an electric vehicle? bad impression inadequate
impression fair impression good impression excellent
impression
Based on your present impression, would you consider driving electric vehicles more often in the future?
certainly-not unlikely about-50:50 likely for-sure
Willingness-to-pay
Which of the following factors would discourage you from buying an electric vehicle? (multiple answers are possible) price lack of charging infrastructure at home lack of charging infrastructure at work lack of public charging infrastructure short range immature technology
Which of the above factors would be your biggest discouragement factor when considering a vehicle purchase? _________
Which of the following factors would influence your intention to buy an electric vehicle? (multiple answers possible) buying price reliability low running cost (€ per Km) monthly payment the look of the car size of the car
insurance no carbon emissions no noise engine power makes statement about my commitments green issues love of new technology
Which of the above factors would be your biggest influencing factor when considering a vehicle purchase? _________
Which of the following incentives would influence your intention to buy an electric vehicle the most?
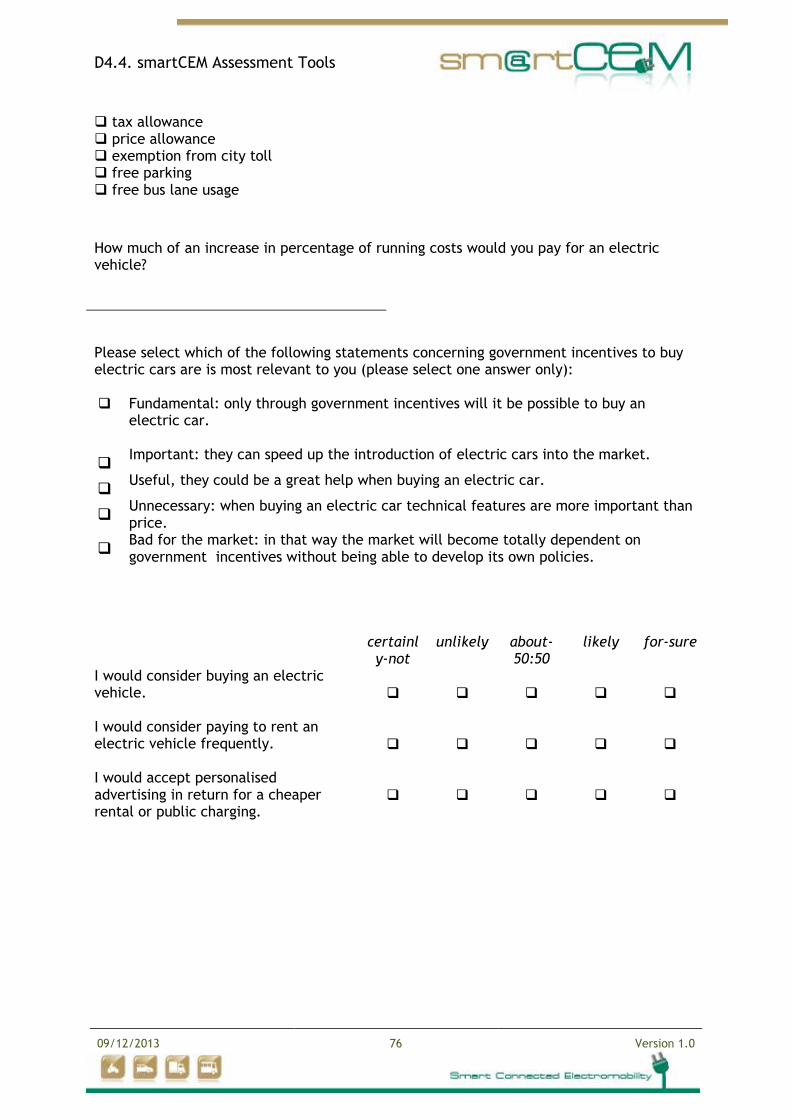
D4.4. smartCEM Assessment Tools
09/12/2013 76 Version 1.0
How much of an increase in percentage of running costs would you pay for an electric vehicle?
Please select which of the following statements concerning government incentives to buy electric cars are is most relevant to you (please select one answer only): Fundamental: only through government incentives will it be possible to buy an
electric car.
Important: they can speed up the introduction of electric cars into the market.
Useful, they could be a great help when buying an electric car.
Unnecessary: when buying an electric car technical features are more important than price.
Bad for the market: in that way the market will become totally dependent on government incentives without being able to develop its own policies.
certainl
y-not unlikely about-
50:50 likely for-sure
I would consider buying an electric vehicle.
I would consider paying to rent an electric vehicle frequently.
I would accept personalised advertising in return for a cheaper rental or public charging.
tax allowance price allowance exemption from city toll free parking free bus lane usage
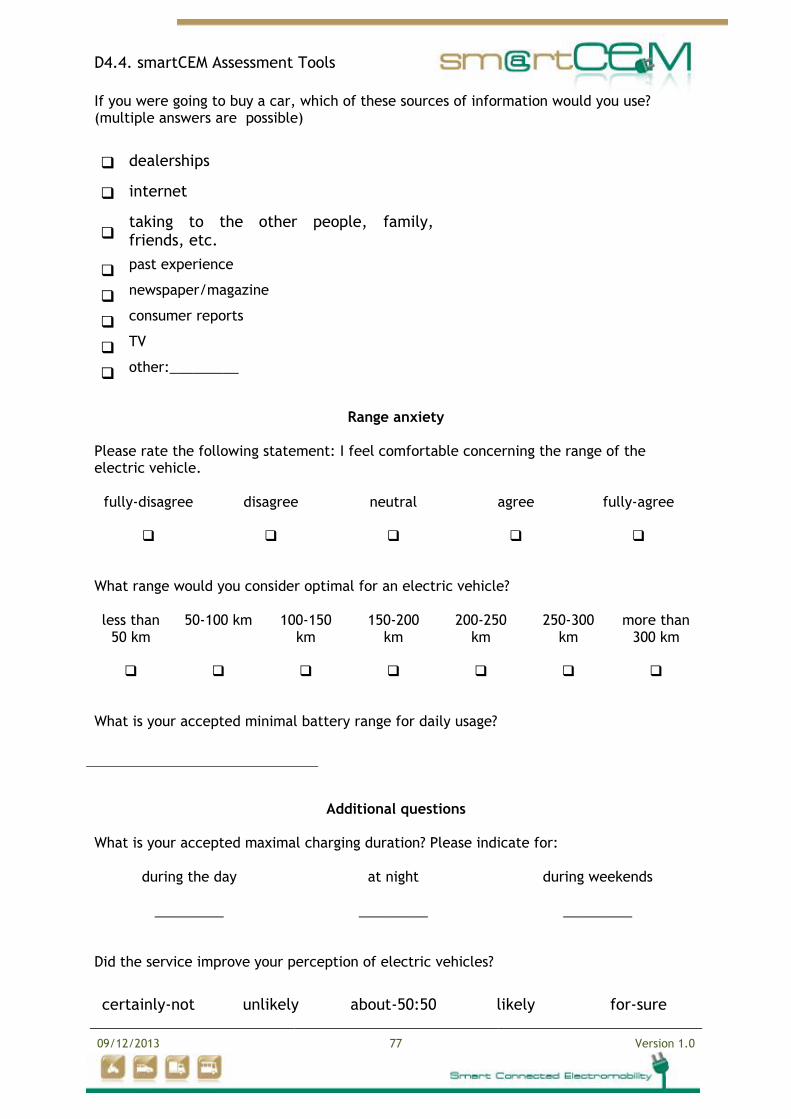
D4.4. smartCEM Assessment Tools
09/12/2013 77 Version 1.0
If you were going to buy a car, which of these sources of information would you use? (multiple answers are possible)
dealerships
internet
taking to the other people, family, friends, etc.
past experience
newspaper/magazine
consumer reports
TV
other:_________
Range anxiety
Please rate the following statement: I feel comfortable concerning the range of the electric vehicle.
fully-disagree disagree neutral agree fully-agree
What range would you consider optimal for an electric vehicle? less than
50 km 50-100 km 100-150
km
150-200 km
200-250 km
250-300 km
more than 300 km
What is your accepted minimal battery range for daily usage?
Additional questions What is your accepted maximal charging duration? Please indicate for:
during the day
at night
during weekends
_________
_________ _________
Did the service improve your perception of electric vehicles?
certainly-not unlikely about-50:50 likely for-sure
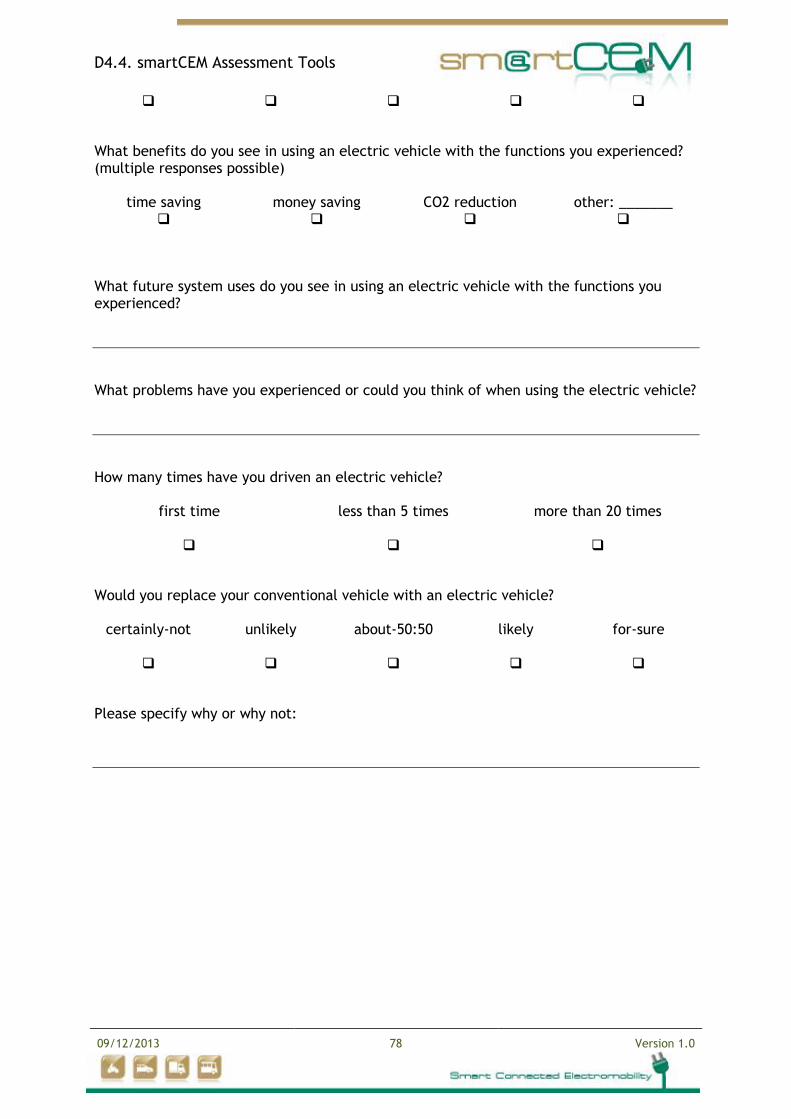
D4.4. smartCEM Assessment Tools
09/12/2013 78 Version 1.0
What benefits do you see in using an electric vehicle with the functions you experienced? (multiple responses possible)
time saving money saving CO2 reduction other: _______
What future system uses do you see in using an electric vehicle with the functions you experienced?
What problems have you experienced or could you think of when using the electric vehicle?
How many times have you driven an electric vehicle?
first time less than 5 times more than 20 times
Would you replace your conventional vehicle with an electric vehicle?
certainly-not unlikely about-50:50 likely for-sure
Please specify why or why not:
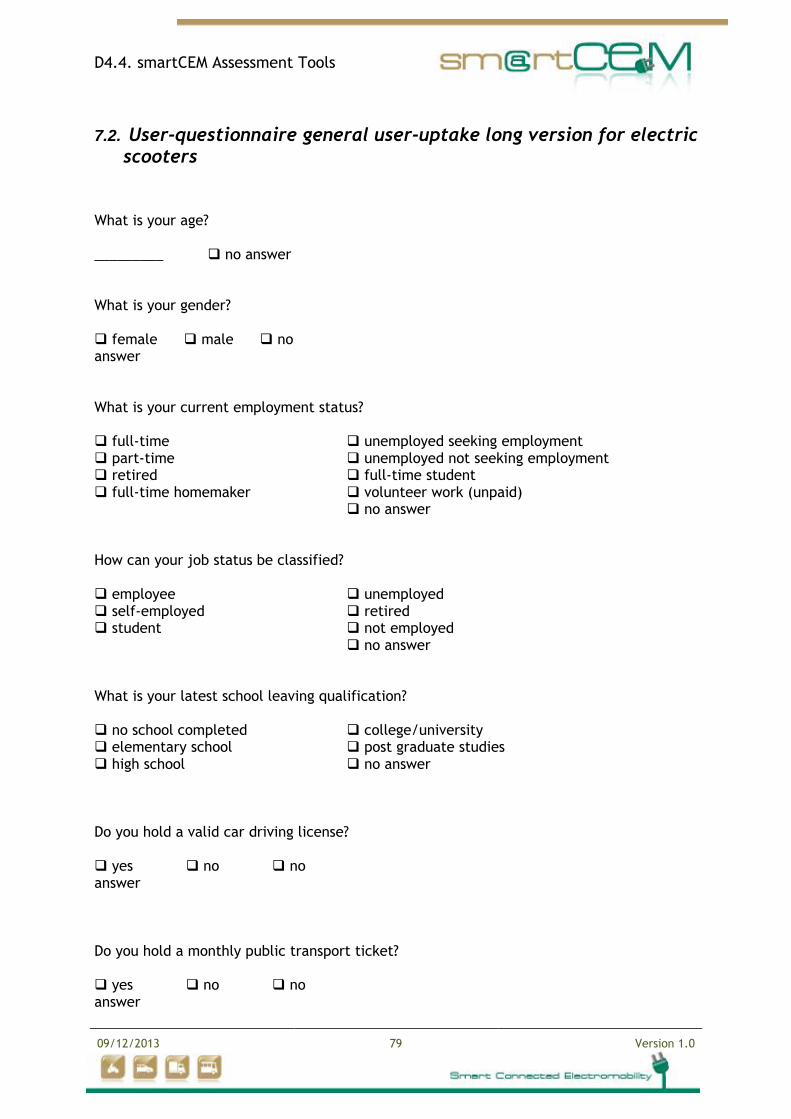
D4.4. smartCEM Assessment Tools
09/12/2013 79 Version 1.0
7.2. User-questionnaire general user-uptake long version for electric scooters
What is your age? _________ no answer
What is your gender? female male no answer
What is your current employment status? full-time part-time retired full-time homemaker
unemployed seeking employment unemployed not seeking employment full-time student volunteer work (unpaid) no answer
How can your job status be classified? employee self-employed student
unemployed retired not employed no answer
What is your latest school leaving qualification? no school completed elementary school high school
college/university post graduate studies no answer
Do you hold a valid car driving license? yes no no answer
Do you hold a monthly public transport ticket? yes no no answer
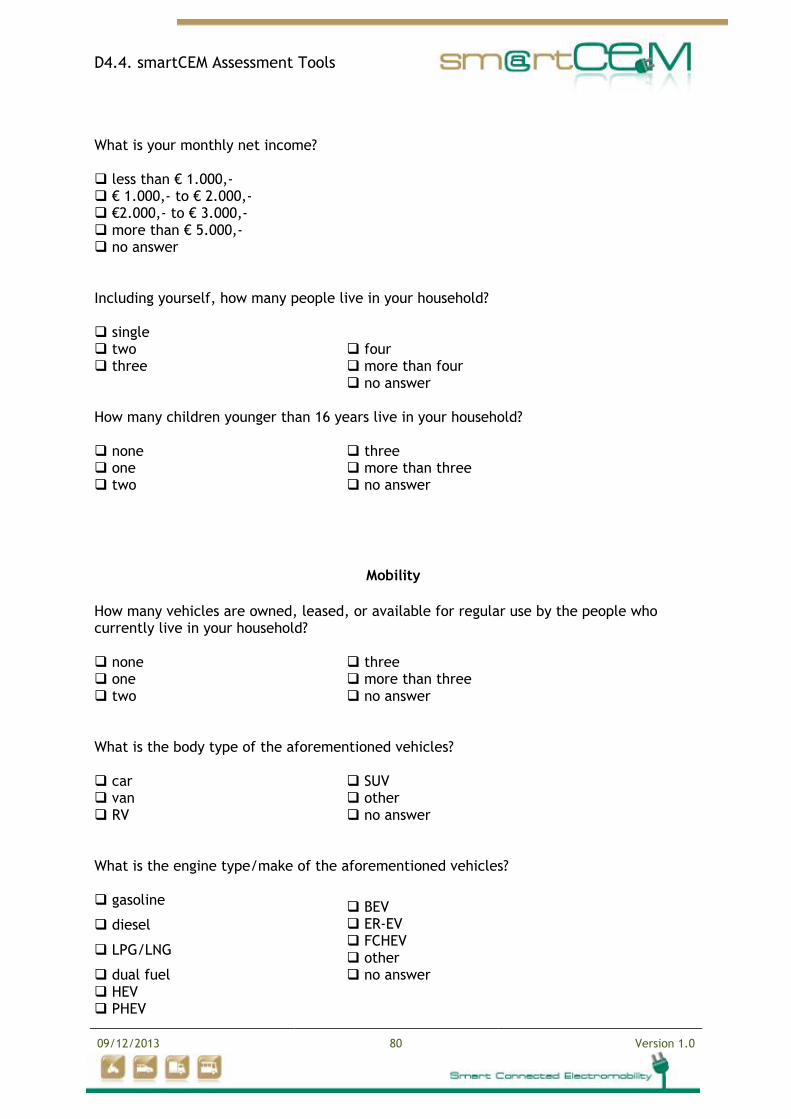
D4.4. smartCEM Assessment Tools
09/12/2013 80 Version 1.0
What is your monthly net income? less than € 1.000,- € 1.000,- to € 2.000,- €2.000,- to € 3.000,- more than € 5.000,- no answer
Including yourself, how many people live in your household? single two three
four more than four no answer
How many children younger than 16 years live in your household? none one two
three more than three no answer
Mobility
How many vehicles are owned, leased, or available for regular use by the people who currently live in your household? none one two
three more than three no answer
What is the body type of the aforementioned vehicles? car van RV
SUV other no answer
What is the engine type/make of the aforementioned vehicles? gasoline
diesel
LPG/LNG
dual fuel HEV PHEV
BEV ER-EV FCHEV other no answer
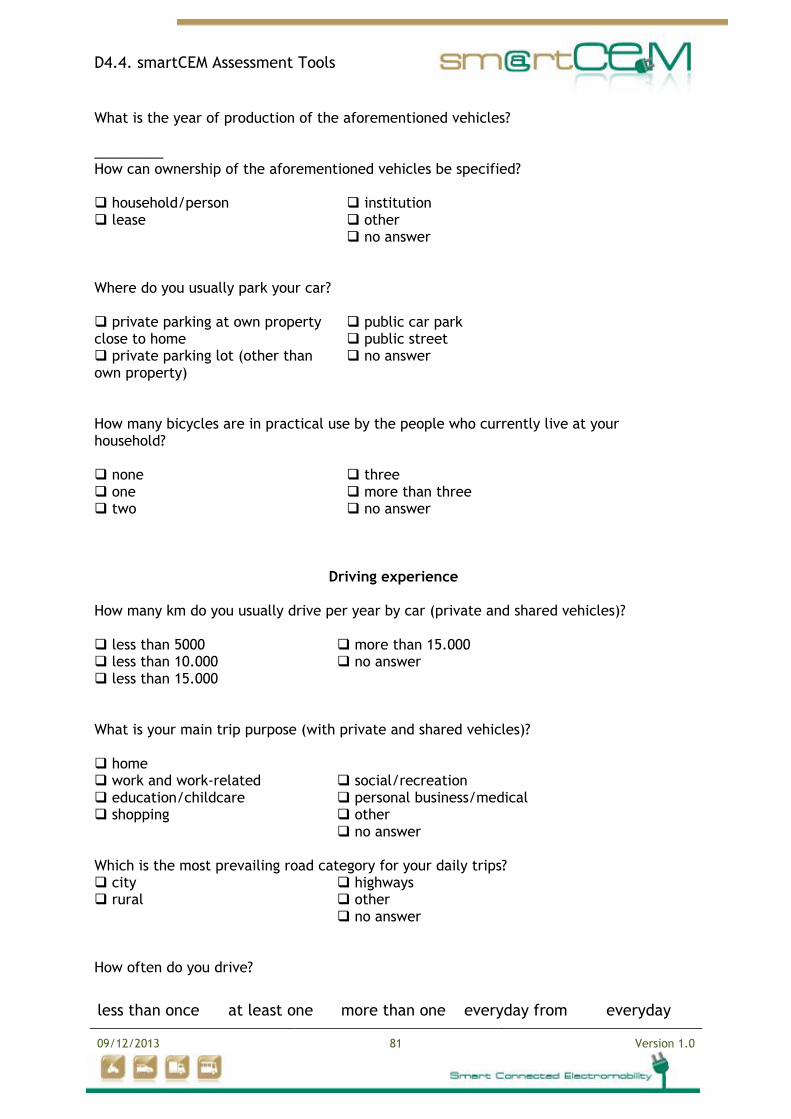
D4.4. smartCEM Assessment Tools
09/12/2013 81 Version 1.0
Driving experience How many km do you usually drive per year by car (private and shared vehicles)? less than 5000 less than 10.000 less than 15.000
more than 15.000 no answer
What is your main trip purpose (with private and shared vehicles)? home work and work-related education/childcare shopping
social/recreation personal business/medical other no answer
Which is the most prevailing road category for your daily trips? city rural
highways other no answer
How often do you drive?
less than once at least one more than one everyday from everyday
What is the year of production of the aforementioned vehicles? _________ How can ownership of the aforementioned vehicles be specified? household/person lease
institution other no answer
Where do you usually park your car? private parking at own property close to home private parking lot (other than own property)
public car park public street no answer
How many bicycles are in practical use by the people who currently live at your household? none one two
three more than three no answer
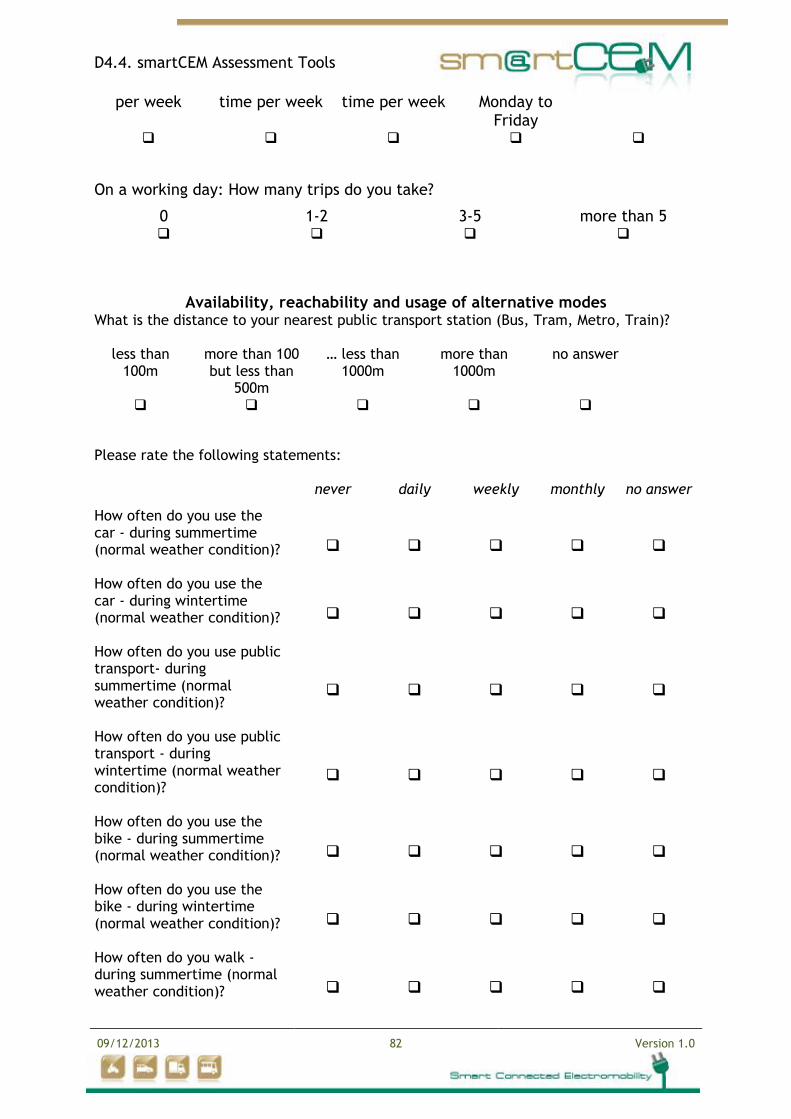
D4.4. smartCEM Assessment Tools
09/12/2013 82 Version 1.0
per week time per week time per week Monday to Friday
On a working day: How many trips do you take?
0 1-2 3-5 more than 5
Availability, reachability and usage of alternative modes What is the distance to your nearest public transport station (Bus, Tram, Metro, Train)?
less than 100m
more than 100 but less than
500m
… less than 1000m
more than 1000m
no answer
Please rate the following statements:
never daily weekly monthly no answer
How often do you use the car - during summertime (normal weather condition)?
How often do you use the car - during wintertime (normal weather condition)?
How often do you use public transport- during summertime (normal weather condition)?
How often do you use public transport - during wintertime (normal weather condition)?
How often do you use the bike - during summertime (normal weather condition)?
How often do you use the bike - during wintertime (normal weather condition)?
How often do you walk - during summertime (normal weather condition)?
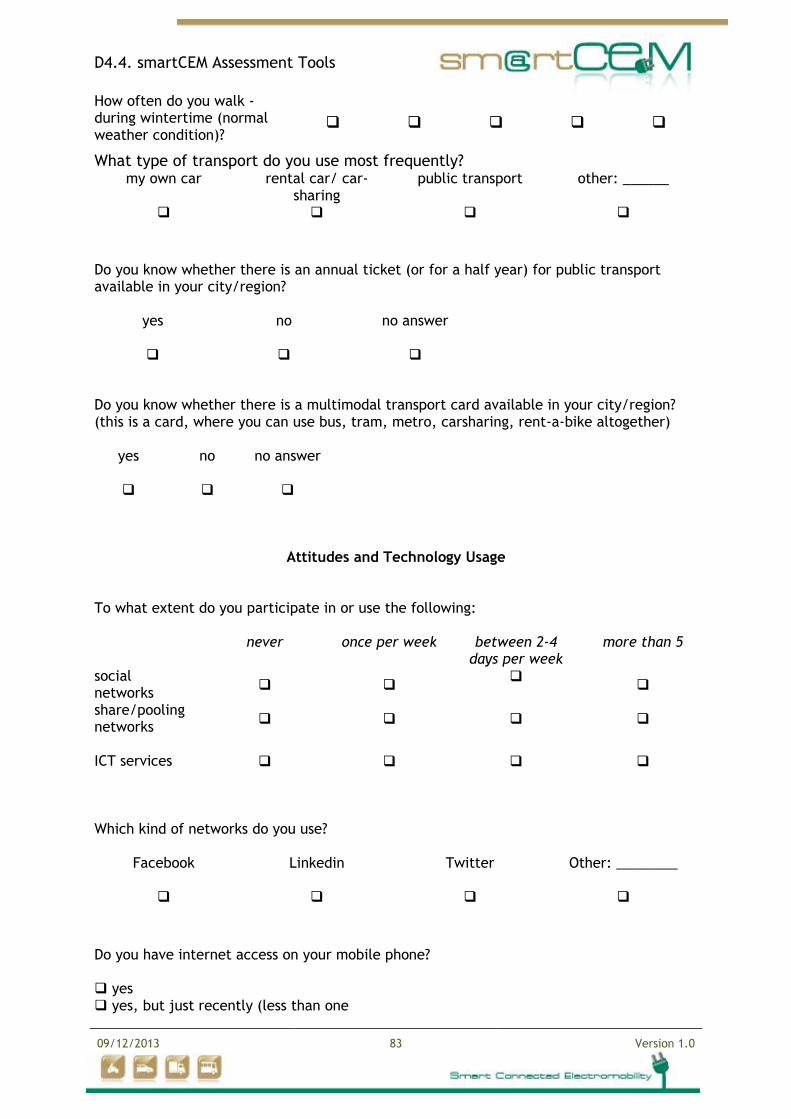
D4.4. smartCEM Assessment Tools
09/12/2013 83 Version 1.0
How often do you walk - during wintertime (normal weather condition)?
What type of transport do you use most frequently? my own car rental car/ car-
sharing public transport
other: ______
Do you know whether there is an annual ticket (or for a half year) for public transport available in your city/region?
yes
no no answer
Do you know whether there is a multimodal transport card available in your city/region? (this is a card, where you can use bus, tram, metro, carsharing, rent-a-bike altogether)
yes
no no answer
Attitudes and Technology Usage
To what extent do you participate in or use the following:
never once per week between 2-4 days per week
more than 5
social networks
share/pooling networks
ICT services
Which kind of networks do you use?
Linkedin Twitter Other: ________
Do you have internet access on your mobile phone? yes yes, but just recently (less than one
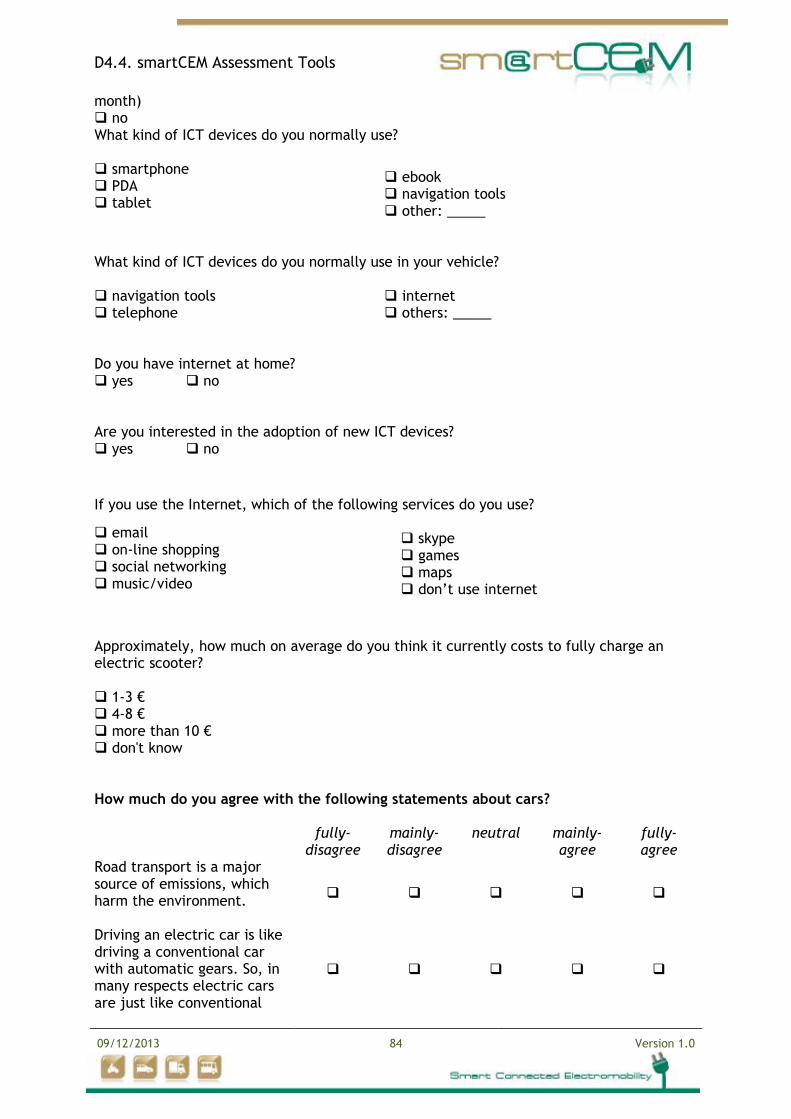
D4.4. smartCEM Assessment Tools
09/12/2013 84 Version 1.0
How much do you agree with the following statements about cars? fully-
disagree mainly-disagree
neutral mainly-agree
fully-agree
Road transport is a major source of emissions, which harm the environment.
Driving an electric car is like driving a conventional car with automatic gears. So, in many respects electric cars are just like conventional
month) no What kind of ICT devices do you normally use? smartphone PDA tablet
ebook navigation tools other: _____
What kind of ICT devices do you normally use in your vehicle? navigation tools telephone
internet others: _____
Do you have internet at home? yes no
Are you interested in the adoption of new ICT devices? yes no
If you use the Internet, which of the following services do you use?
email on-line shopping social networking music/video
skype games maps don’t use internet
Approximately, how much on average do you think it currently costs to fully charge an electric scooter? 1-3 € 4-8 € more than 10 € don't know
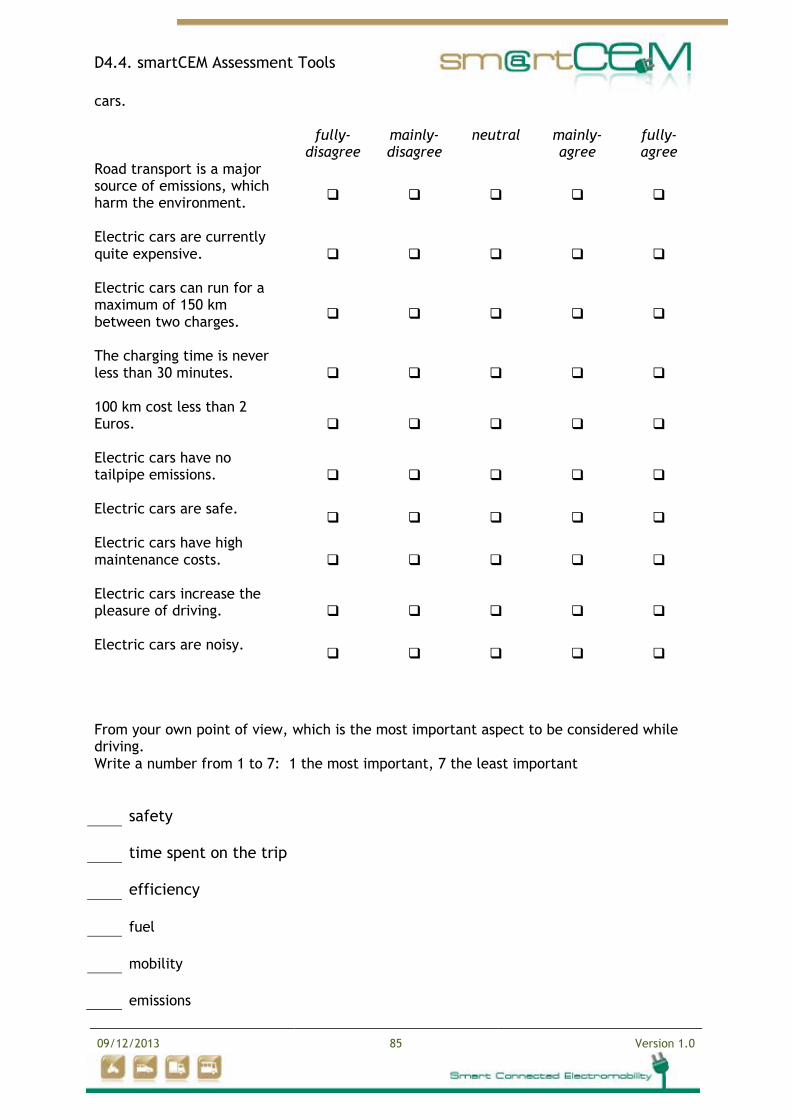
D4.4. smartCEM Assessment Tools
09/12/2013 85 Version 1.0
cars.
fully-
disagree mainly-disagree
neutral mainly-agree
fully-agree
Road transport is a major source of emissions, which harm the environment.
Electric cars are currently quite expensive.
Electric cars can run for a maximum of 150 km between two charges.
The charging time is never less than 30 minutes.
100 km cost less than 2 Euros.
Electric cars have no tailpipe emissions.
Electric cars are safe.
Electric cars have high maintenance costs.
Electric cars increase the pleasure of driving.
Electric cars are noisy.
From your own point of view, which is the most important aspect to be considered while driving. Write a number from 1 to 7: 1 the most important, 7 the least important
safety
time spent on the trip
efficiency
fuel
mobility
emissions
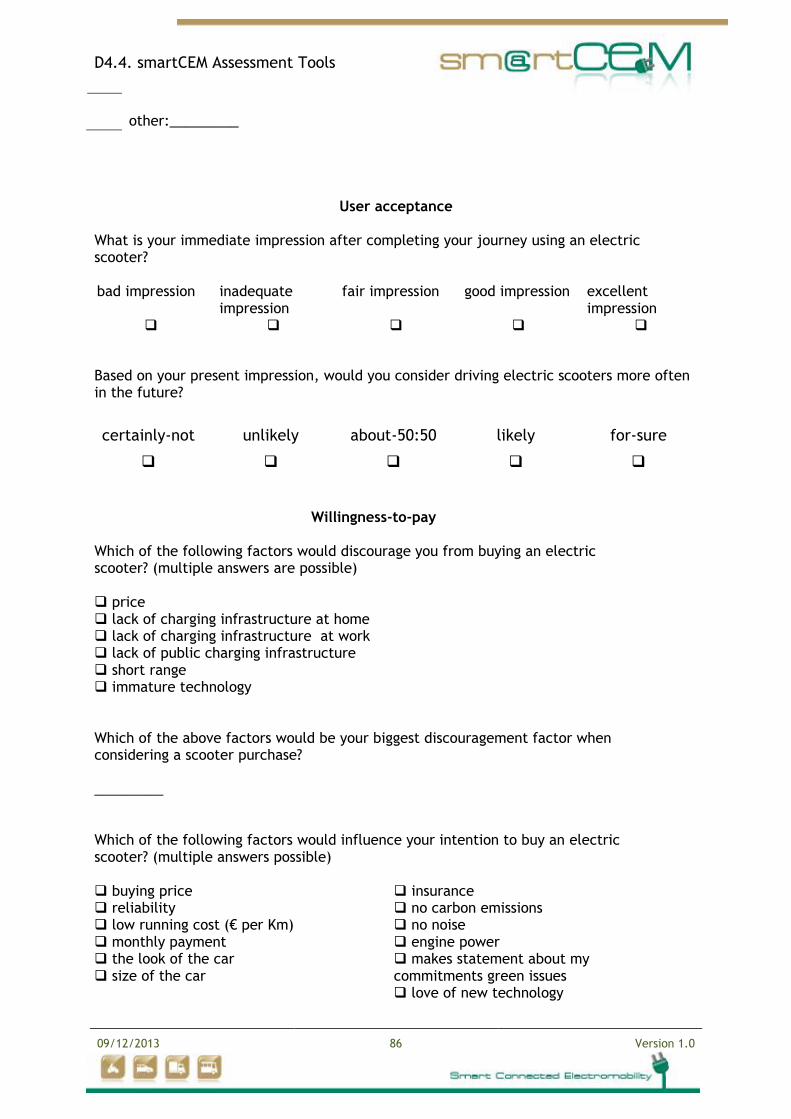
D4.4. smartCEM Assessment Tools
09/12/2013 86 Version 1.0
other:_________
User acceptance What is your immediate impression after completing your journey using an electric scooter? bad impression inadequate
impression fair impression good impression excellent
impression
Based on your present impression, would you consider driving electric scooters more often in the future?
certainly-not unlikely about-50:50 likely for-sure
Willingness-to-pay
Which of the following factors would discourage you from buying an electric scooter? (multiple answers are possible) price lack of charging infrastructure at home lack of charging infrastructure at work lack of public charging infrastructure short range immature technology
Which of the above factors would be your biggest discouragement factor when considering a scooter purchase? _________
Which of the following factors would influence your intention to buy an electric scooter? (multiple answers possible) buying price reliability low running cost (€ per Km) monthly payment the look of the car size of the car
insurance no carbon emissions no noise engine power makes statement about my commitments green issues love of new technology
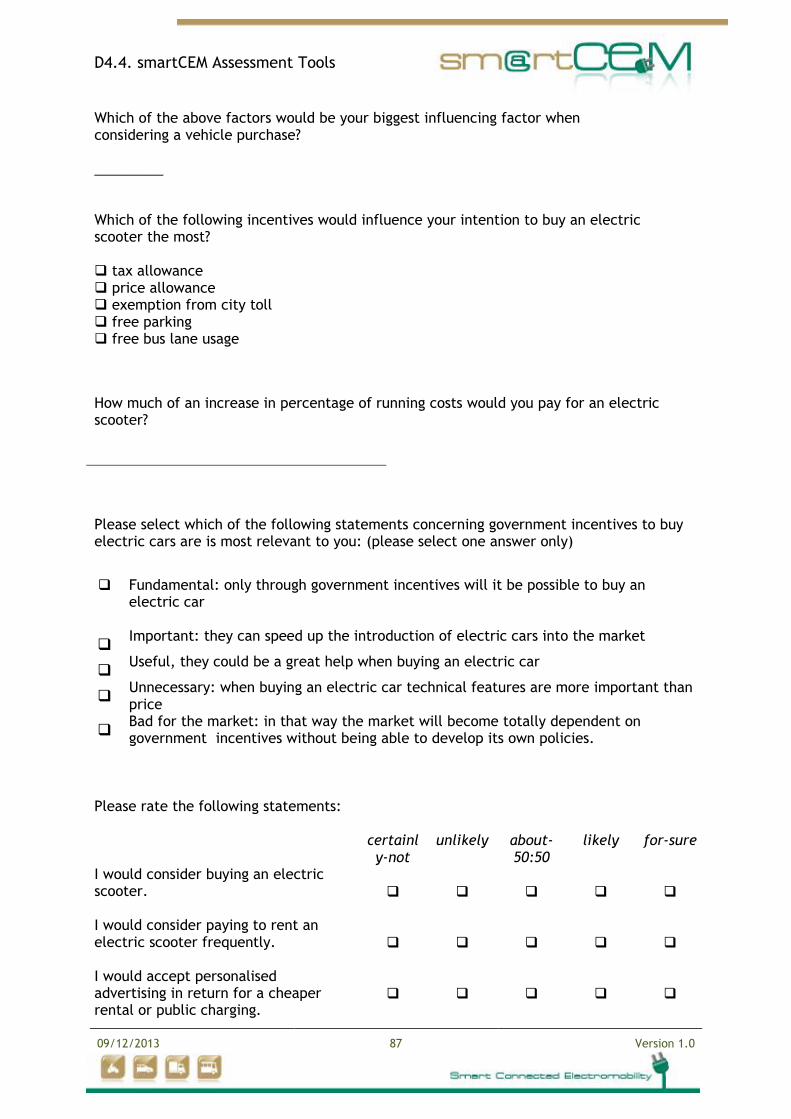
D4.4. smartCEM Assessment Tools
09/12/2013 87 Version 1.0
How much of an increase in percentage of running costs would you pay for an electric scooter?
Please select which of the following statements concerning government incentives to buy electric cars are is most relevant to you: (please select one answer only)
Fundamental: only through government incentives will it be possible to buy an
electric car
Important: they can speed up the introduction of electric cars into the market
Useful, they could be a great help when buying an electric car
Unnecessary: when buying an electric car technical features are more important than price
Bad for the market: in that way the market will become totally dependent on government incentives without being able to develop its own policies.
Please rate the following statements: certainl
y-not unlikely about-
50:50 likely for-sure
I would consider buying an electric scooter.
I would consider paying to rent an electric scooter frequently.
I would accept personalised advertising in return for a cheaper rental or public charging.
Which of the above factors would be your biggest influencing factor when considering a vehicle purchase? _________
Which of the following incentives would influence your intention to buy an electric scooter the most? tax allowance price allowance exemption from city toll free parking free bus lane usage
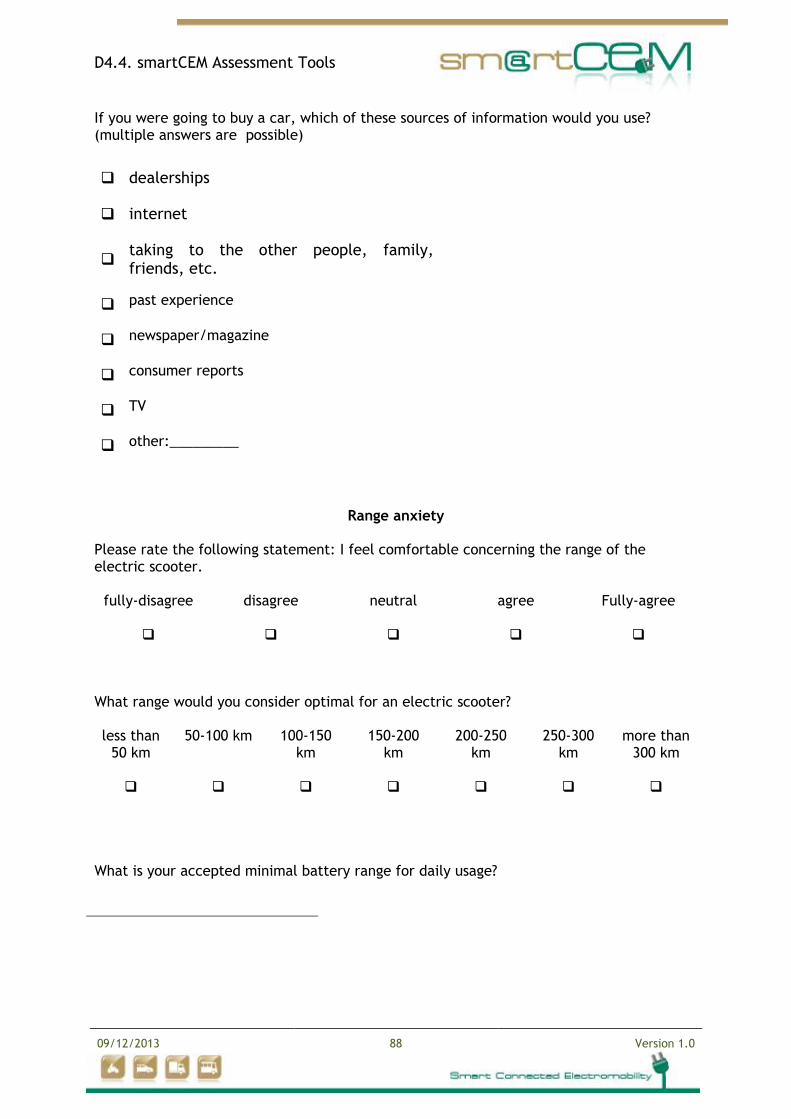
D4.4. smartCEM Assessment Tools
09/12/2013 88 Version 1.0
If you were going to buy a car, which of these sources of information would you use? (multiple answers are possible)
dealerships
internet
taking to the other people, family, friends, etc.
past experience
newspaper/magazine
consumer reports
TV
other:_________
Range anxiety
Please rate the following statement: I feel comfortable concerning the range of the electric scooter.
fully-disagree disagree neutral agree Fully-agree
What range would you consider optimal for an electric scooter? less than
50 km 50-100 km 100-150
km
150-200 km
200-250 km
250-300 km
more than 300 km
What is your accepted minimal battery range for daily usage?
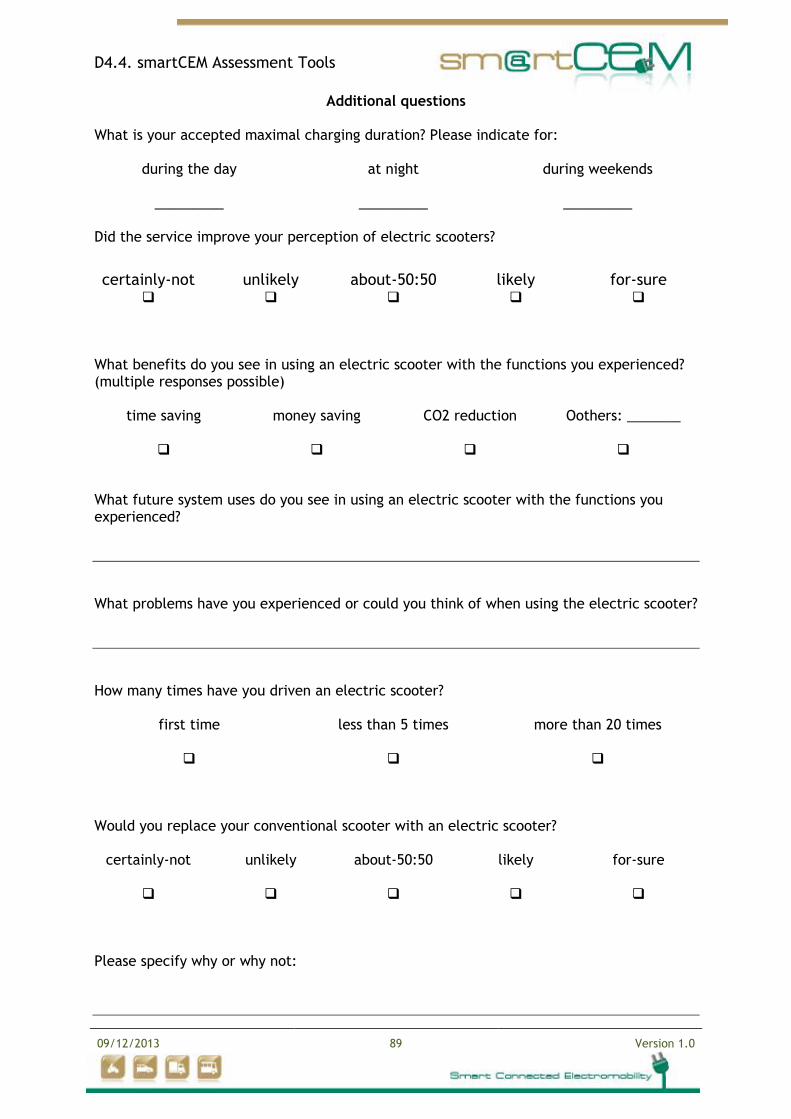
D4.4. smartCEM Assessment Tools
09/12/2013 89 Version 1.0
Additional questions What is your accepted maximal charging duration? Please indicate for:
during the day at night
during weekends
_________ _________ _________ Did the service improve your perception of electric scooters?
certainly-not unlikely about-50:50 likely for-sure
What benefits do you see in using an electric scooter with the functions you experienced? (multiple responses possible)
time saving money saving CO2 reduction
Oothers: _______
What future system uses do you see in using an electric scooter with the functions you experienced?
What problems have you experienced or could you think of when using the electric scooter?
How many times have you driven an electric scooter?
first time less than 5 times more than 20 times
Would you replace your conventional scooter with an electric scooter?
certainly-not unlikely about-50:50 likely for-sure
Please specify why or why not:
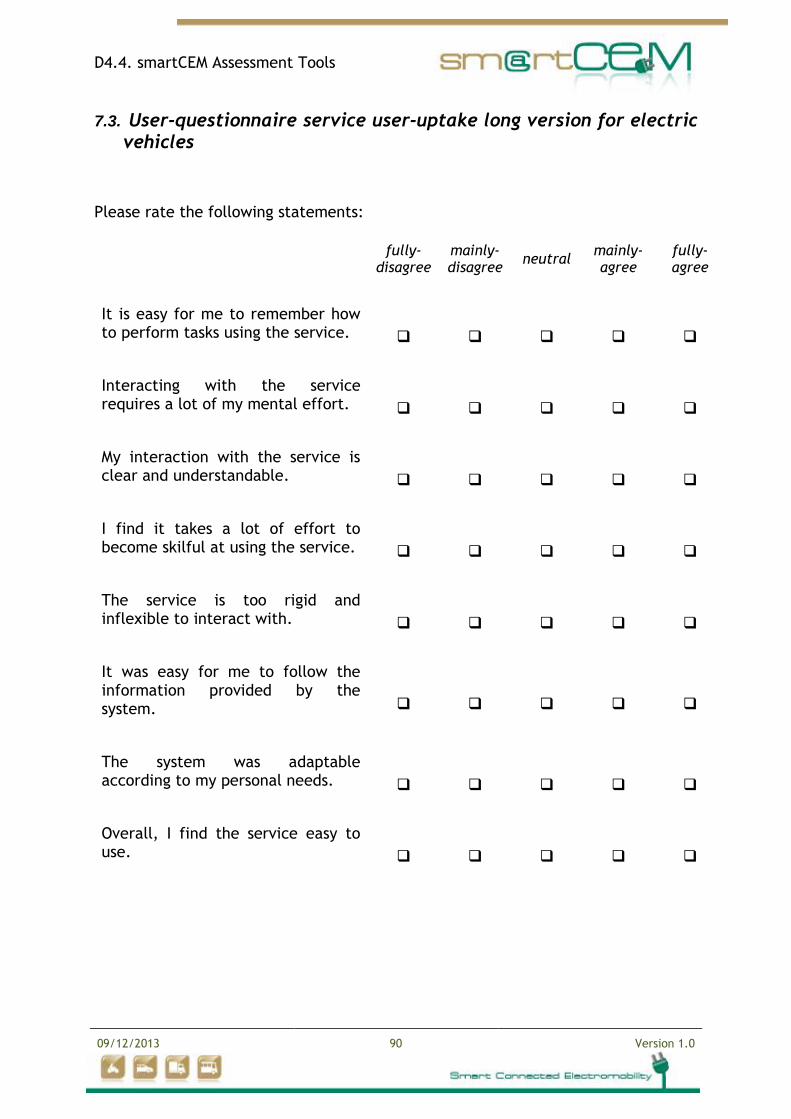
D4.4. smartCEM Assessment Tools
09/12/2013 90 Version 1.0
7.3. User-questionnaire service user-uptake long version for electric vehicles
Please rate the following statements:
fully-
disagree mainly- disagree
neutral mainly-agree
fully- agree
It is easy for me to remember how to perform tasks using the service.
Interacting with the service requires a lot of my mental effort.
My interaction with the service is clear and understandable.
I find it takes a lot of effort to become skilful at using the service.
The service is too rigid and inflexible to interact with.
It was easy for me to follow the information provided by the system.
The system was adaptable according to my personal needs.
Overall, I find the service easy to use.
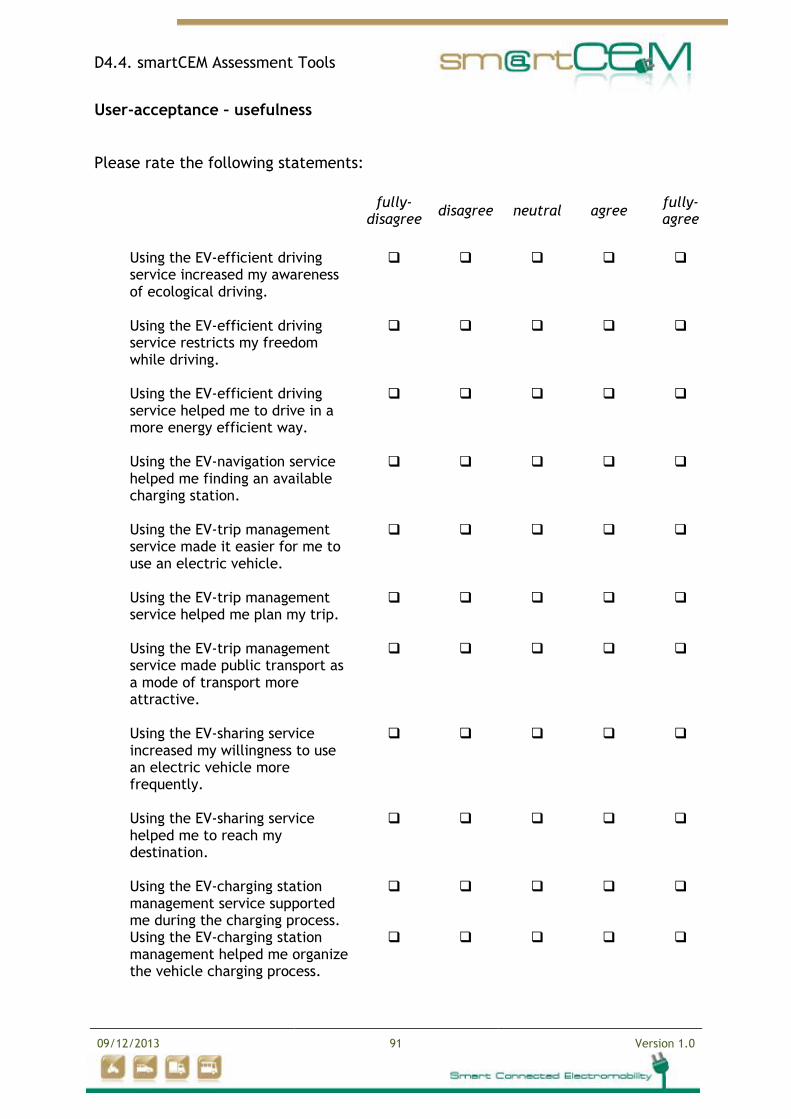
D4.4. smartCEM Assessment Tools
09/12/2013 91 Version 1.0
User-acceptance – usefulness
Please rate the following statements:
fully- disagree
disagree neutral agree fully-agree
Using the EV-efficient driving service increased my awareness of ecological driving.
Using the EV-efficient driving service restricts my freedom while driving.
Using the EV-efficient driving service helped me to drive in a more energy efficient way.
Using the EV-navigation service helped me finding an available charging station.
Using the EV-trip management service made it easier for me to use an electric vehicle.
Using the EV-trip management service helped me plan my trip.
Using the EV-trip management service made public transport as a mode of transport more attractive.
Using the EV-sharing service increased my willingness to use an electric vehicle more frequently.
Using the EV-sharing service helped me to reach my destination.
Using the EV-charging station management service supported me during the charging process.
Using the EV-charging station management helped me organize the vehicle charging process.
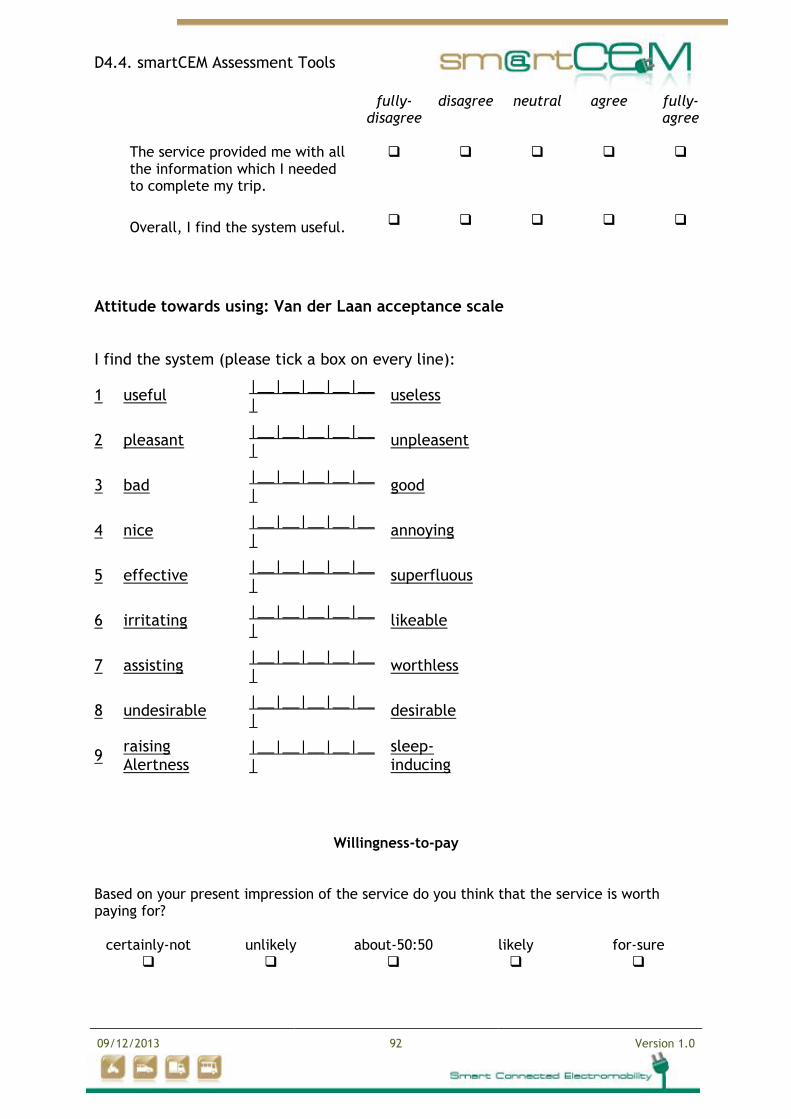
D4.4. smartCEM Assessment Tools
09/12/2013 92 Version 1.0
fully-
disagree disagree neutral agree fully-
agree The service provided me with all the information which I needed to complete my trip.
Overall, I find the system useful.
Attitude towards using: Van der Laan acceptance scale
I find the system (please tick a box on every line):
1 useful |__|__|__|__|__|
useless
2 pleasant |__|__|__|__|__|
unpleasent
3 bad |__|__|__|__|__|
good
4 nice |__|__|__|__|__|
annoying
5 effective |__|__|__|__|__|
superfluous
6 irritating |__|__|__|__|__|
likeable
7 assisting |__|__|__|__|__|
worthless
8 undesirable |__|__|__|__|__|
desirable
9 raising Alertness
|__|__|__|__|__|
sleep-inducing
Willingness-to-pay Based on your present impression of the service do you think that the service is worth paying for?
certainly-not unlikely about-50:50 likely for-sure
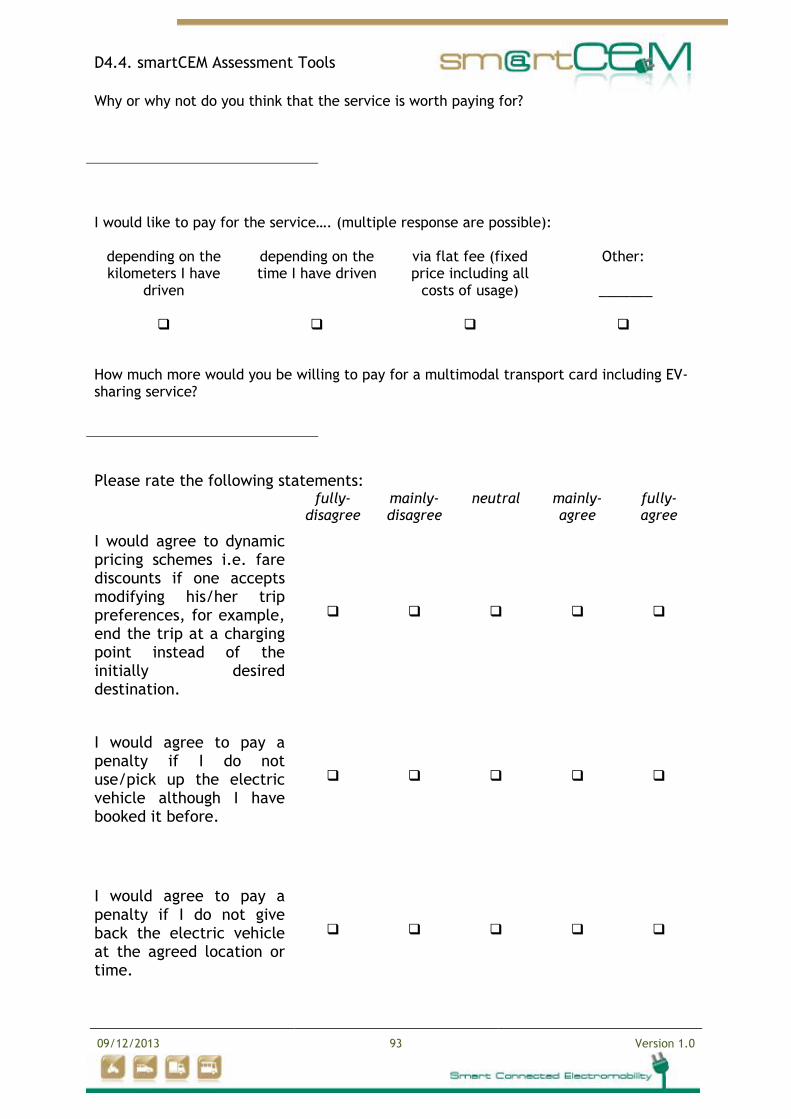
D4.4. smartCEM Assessment Tools
09/12/2013 93 Version 1.0
Why or why not do you think that the service is worth paying for?
I would like to pay for the service…. (multiple response are possible):
depending on the kilometers I have
driven
depending on the time I have driven
via flat fee (fixed price including all
costs of usage)
Other:
_______
How much more would you be willing to pay for a multimodal transport card including EV-sharing service?
Please rate the following statements: fully-
disagree mainly-disagree
neutral mainly-agree
fully-agree
I would agree to dynamic pricing schemes i.e. fare discounts if one accepts modifying his/her trip preferences, for example, end the trip at a charging point instead of the initially desired destination.
I would agree to pay a penalty if I do not use/pick up the electric vehicle although I have booked it before.
I would agree to pay a penalty if I do not give back the electric vehicle at the agreed location or time.
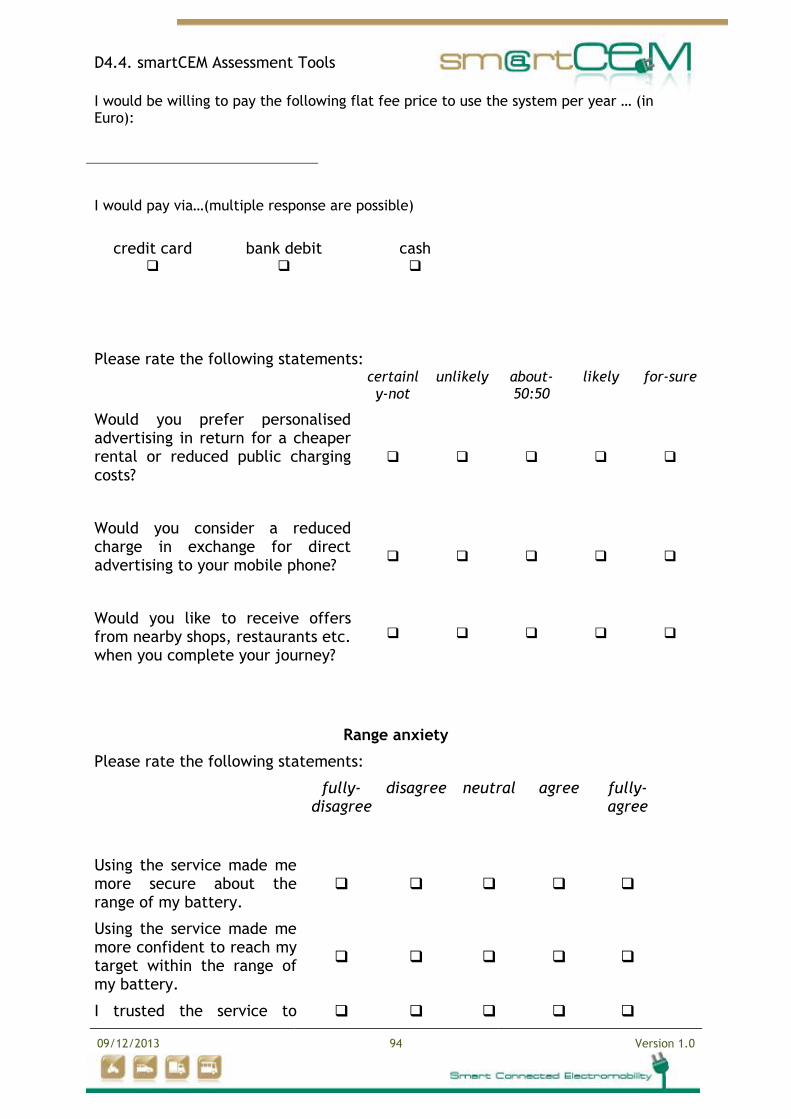
D4.4. smartCEM Assessment Tools
09/12/2013 94 Version 1.0
I would be willing to pay the following flat fee price to use the system per year … (in Euro):
I would pay via…(multiple response are possible)
credit card bank debit cash
Please rate the following statements: certainl
y-not unlikely about-
50:50 likely for-sure
Would you prefer personalised advertising in return for a cheaper rental or reduced public charging costs?
Would you consider a reduced charge in exchange for direct advertising to your mobile phone?
Would you like to receive offers from nearby shops, restaurants etc. when you complete your journey?
Range anxiety
Please rate the following statements:
fully- disagree
disagree neutral agree fully- agree
Using the service made me more secure about the range of my battery.
Using the service made me more confident to reach my target within the range of my battery.
I trusted the service to
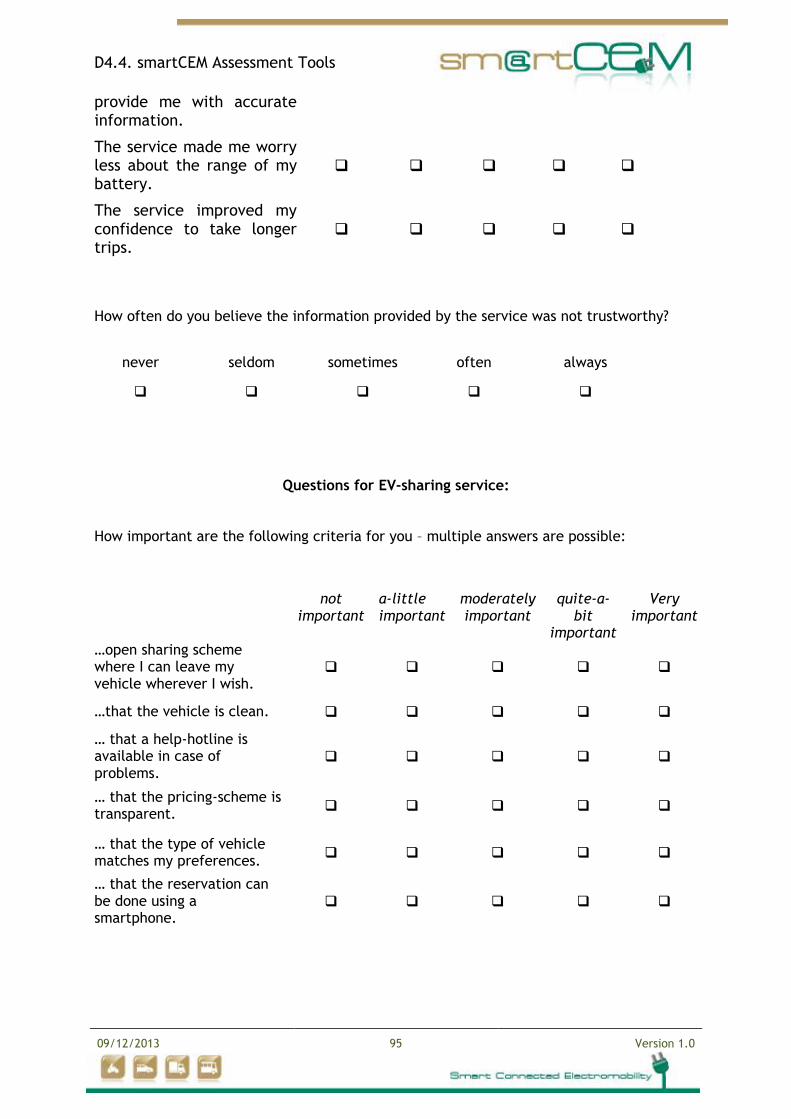
D4.4. smartCEM Assessment Tools
09/12/2013 95 Version 1.0
provide me with accurate information.
The service made me worry less about the range of my battery.
The service improved my confidence to take longer trips.
How often do you believe the information provided by the service was not trustworthy?
never seldom sometimes often always
Questions for EV-sharing service:
How important are the following criteria for you – multiple answers are possible:
not
important
a-little important
moderately important
quite-a-
bit important
Very
important
…open sharing scheme where I can leave my vehicle wherever I wish.
…that the vehicle is clean.
… that a help-hotline is available in case of problems.
… that the pricing-scheme is transparent.
… that the type of vehicle matches my preferences.
… that the reservation can be done using a smartphone.
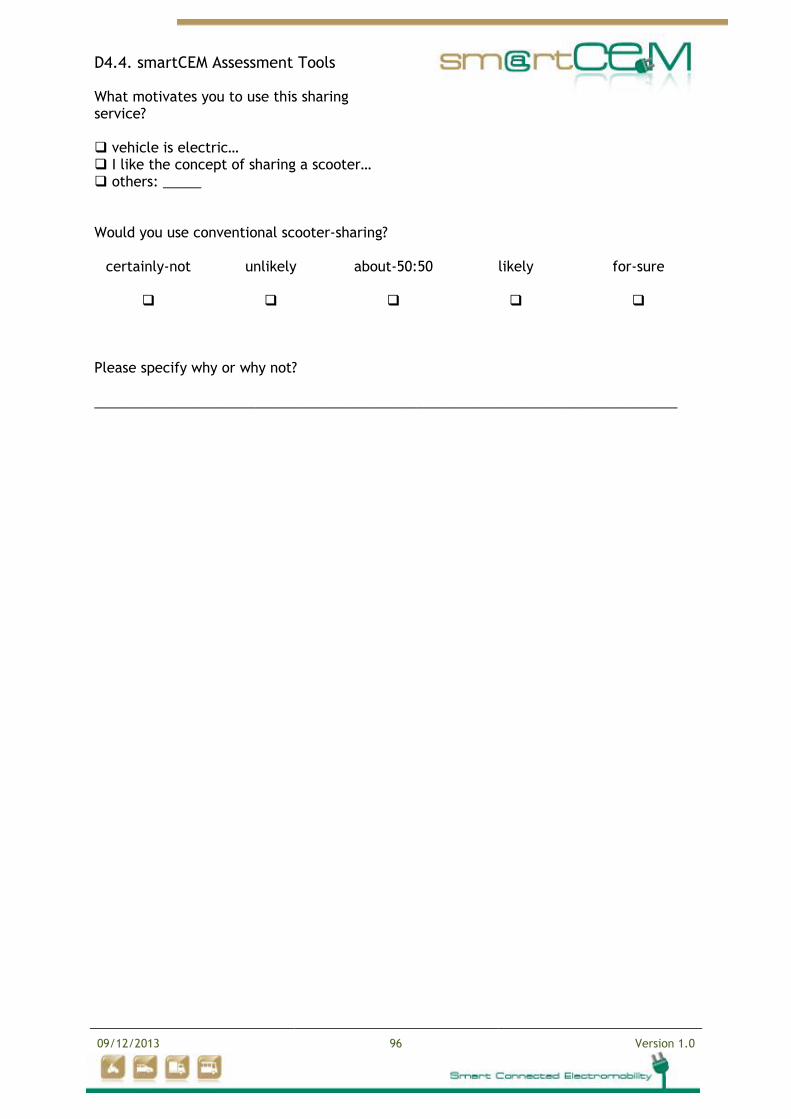
D4.4. smartCEM Assessment Tools
09/12/2013 96 Version 1.0
Would you use conventional scooter-sharing?
certainly-not unlikely about-50:50 likely for-sure
Please specify why or why not? ____________________________________________________________________________
What motivates you to use this sharing service? vehicle is electric… I like the concept of sharing a scooter… others: _____
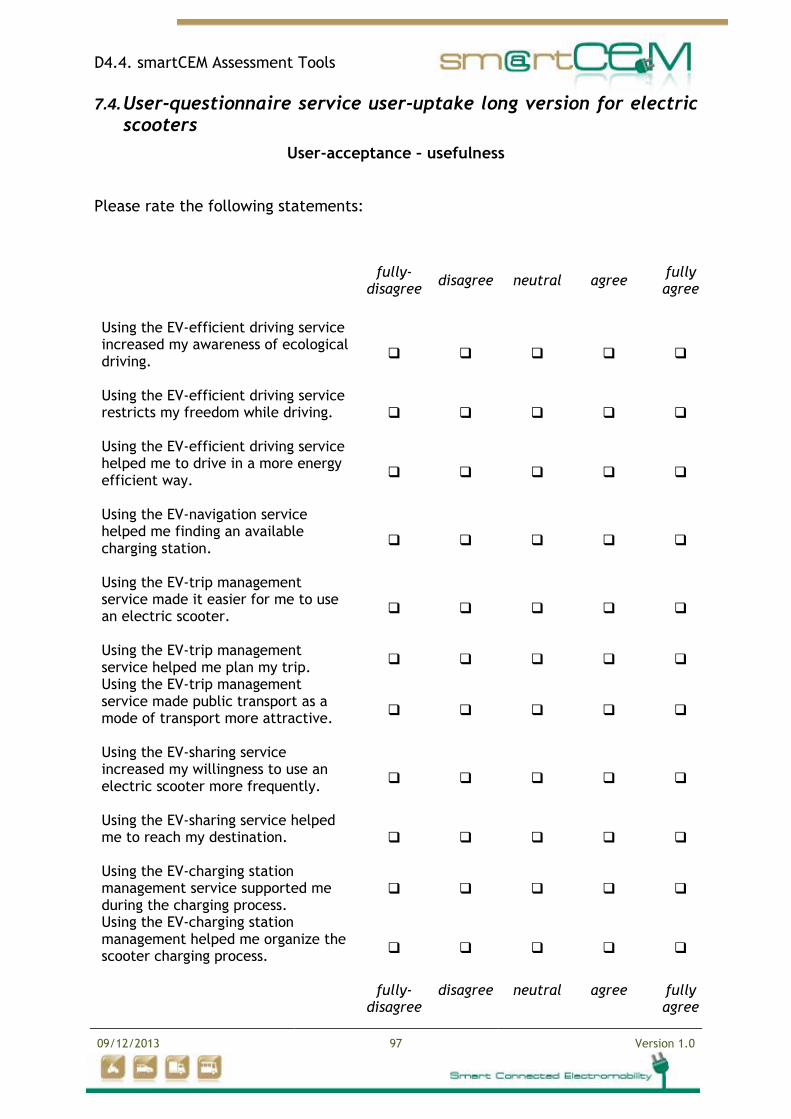
D4.4. smartCEM Assessment Tools
09/12/2013 97 Version 1.0
7.4. User-questionnaire service user-uptake long version for electric scooters
User-acceptance – usefulness
Please rate the following statements:
fully- disagree
disagree neutral agree fully agree
Using the EV-efficient driving service increased my awareness of ecological driving.
Using the EV-efficient driving service restricts my freedom while driving.
Using the EV-efficient driving service helped me to drive in a more energy efficient way.
Using the EV-navigation service helped me finding an available charging station.
Using the EV-trip management service made it easier for me to use an electric scooter.
Using the EV-trip management service helped me plan my trip.
Using the EV-trip management service made public transport as a mode of transport more attractive.
Using the EV-sharing service increased my willingness to use an electric scooter more frequently.
Using the EV-sharing service helped me to reach my destination.
Using the EV-charging station management service supported me during the charging process.
Using the EV-charging station management helped me organize the scooter charging process.
fully-
disagree disagree neutral agree fully
agree
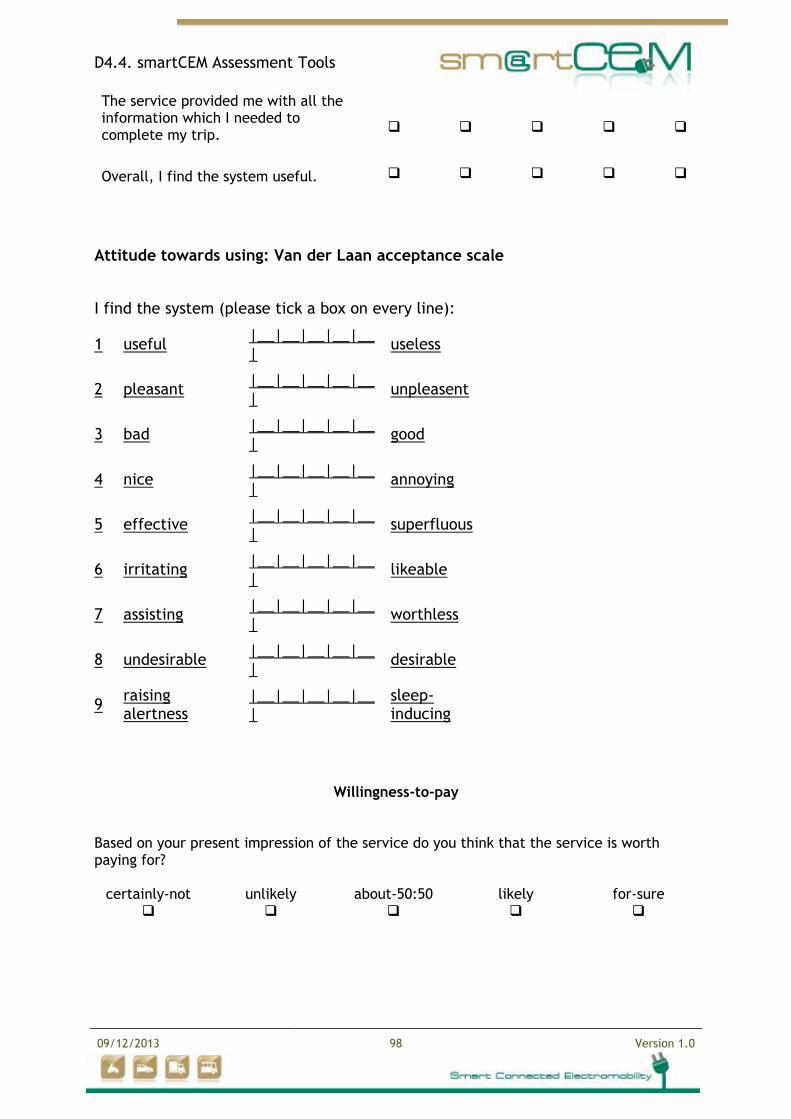
D4.4. smartCEM Assessment Tools
09/12/2013 98 Version 1.0
The service provided me with all the information which I needed to complete my trip.
Overall, I find the system useful.
Attitude towards using: Van der Laan acceptance scale
I find the system (please tick a box on every line):
1 useful |__|__|__|__|__|
useless
2 pleasant |__|__|__|__|__|
unpleasent
3 bad |__|__|__|__|__|
good
4 nice |__|__|__|__|__|
annoying
5 effective |__|__|__|__|__|
superfluous
6 irritating |__|__|__|__|__|
likeable
7 assisting |__|__|__|__|__|
worthless
8 undesirable |__|__|__|__|__|
desirable
9 raising alertness
|__|__|__|__|__|
sleep-inducing
Willingness-to-pay Based on your present impression of the service do you think that the service is worth paying for?
certainly-not unlikely about-50:50 likely for-sure
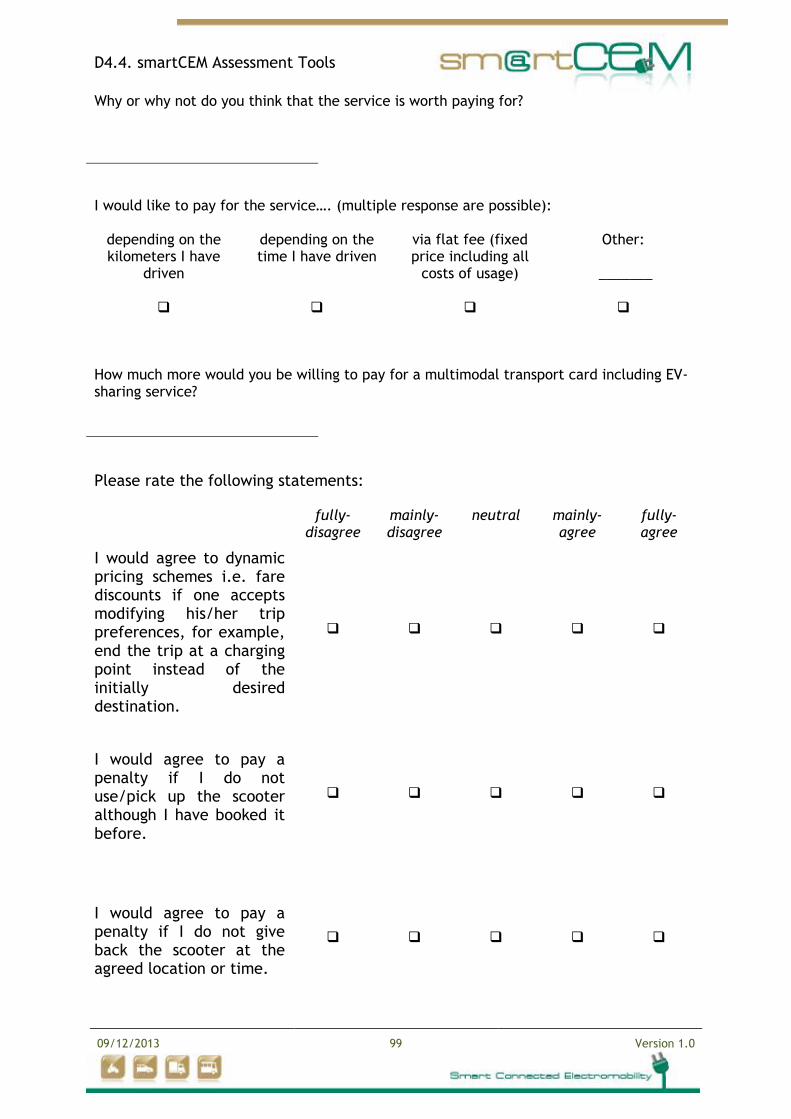
D4.4. smartCEM Assessment Tools
09/12/2013 99 Version 1.0
Why or why not do you think that the service is worth paying for?
I would like to pay for the service…. (multiple response are possible):
depending on the kilometers I have
driven
depending on the time I have driven
via flat fee (fixed price including all
costs of usage)
Other:
_______
How much more would you be willing to pay for a multimodal transport card including EV-sharing service?
Please rate the following statements: fully-
disagree mainly-disagree
neutral mainly-agree
fully-agree
I would agree to dynamic pricing schemes i.e. fare discounts if one accepts modifying his/her trip preferences, for example, end the trip at a charging point instead of the initially desired destination.
I would agree to pay a penalty if I do not use/pick up the scooter although I have booked it before.
I would agree to pay a penalty if I do not give back the scooter at the agreed location or time.
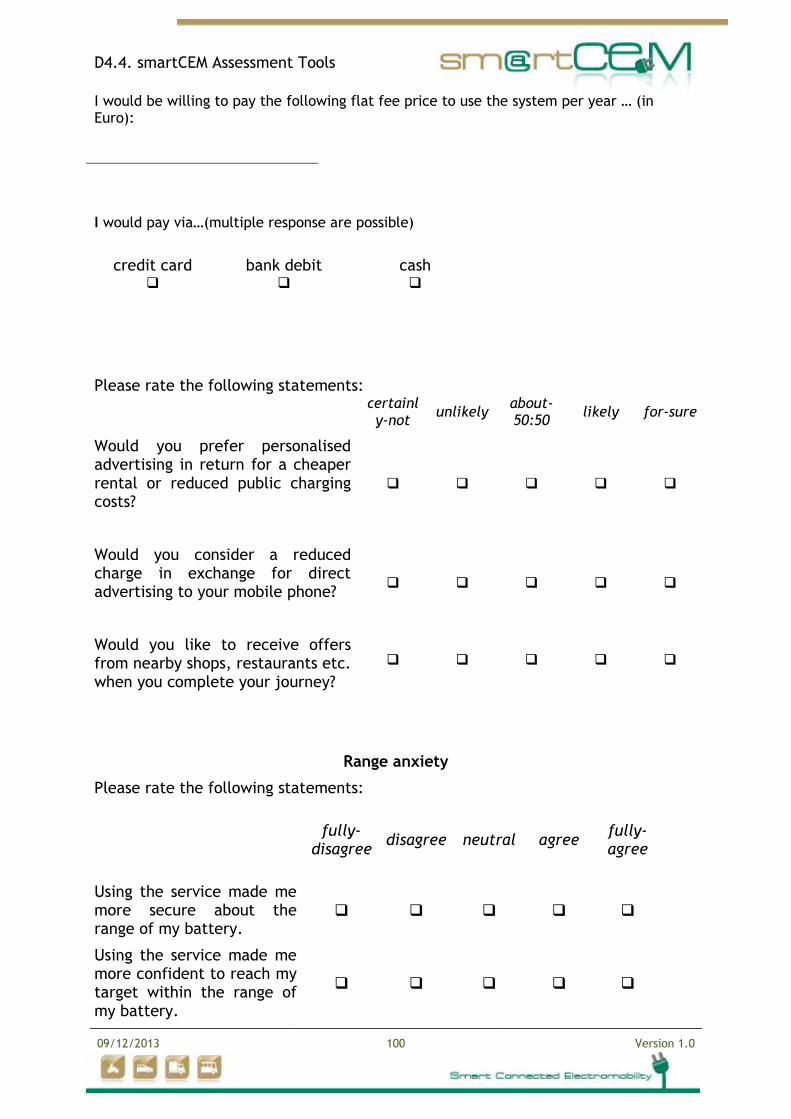
D4.4. smartCEM Assessment Tools
09/12/2013 100 Version 1.0
I would be willing to pay the following flat fee price to use the system per year … (in Euro):
I would pay via…(multiple response are possible)
credit card bank debit cash
Please rate the following statements: certainl
y-not unlikely
about-50:50
likely for-sure
Would you prefer personalised advertising in return for a cheaper rental or reduced public charging costs?
Would you consider a reduced charge in exchange for direct advertising to your mobile phone?
Would you like to receive offers from nearby shops, restaurants etc. when you complete your journey?
Range anxiety
Please rate the following statements:
fully- disagree
disagree neutral agree fully- agree
Using the service made me more secure about the range of my battery.
Using the service made me more confident to reach my target within the range of my battery.
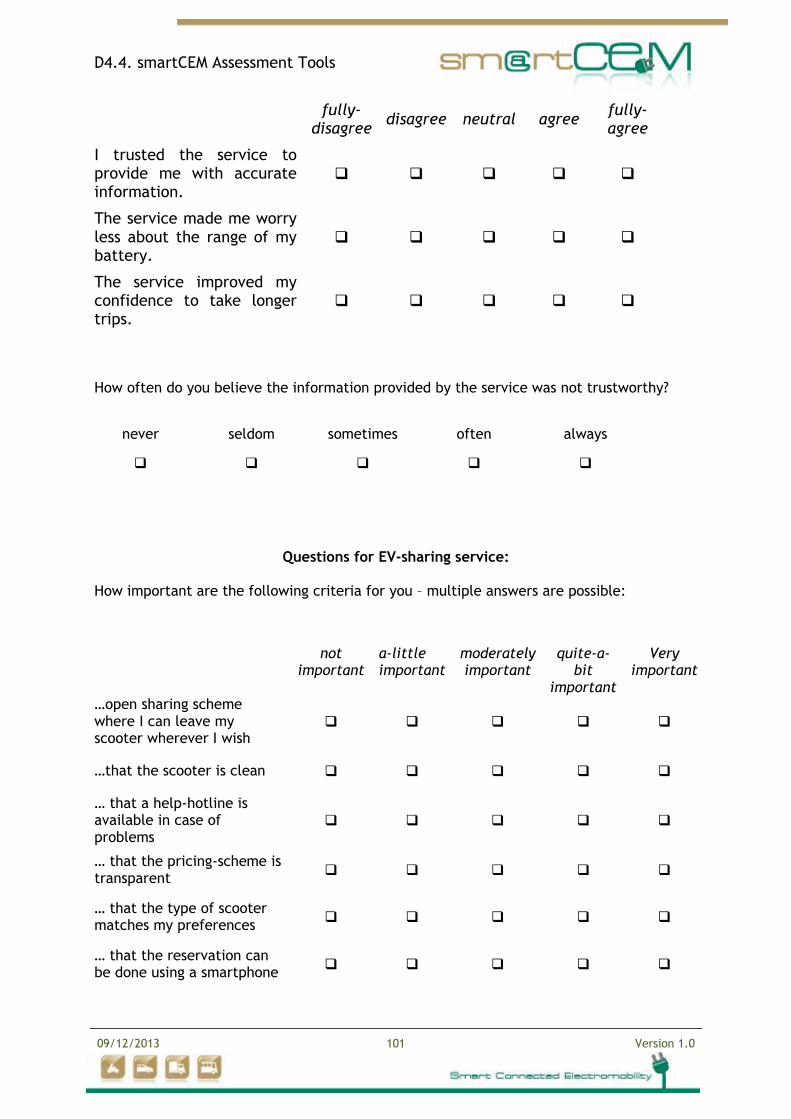
D4.4. smartCEM Assessment Tools
09/12/2013 101 Version 1.0
fully- disagree
disagree neutral agree fully- agree
I trusted the service to provide me with accurate information.
The service made me worry less about the range of my battery.
The service improved my confidence to take longer trips.
How often do you believe the information provided by the service was not trustworthy?
never seldom sometimes often always
Questions for EV-sharing service: How important are the following criteria for you – multiple answers are possible:
not
important
a-little important
moderately important
quite-a-
bit important
Very
important
…open sharing scheme where I can leave my scooter wherever I wish
…that the scooter is clean
… that a help-hotline is available in case of problems
… that the pricing-scheme is transparent
… that the type of scooter matches my preferences
… that the reservation can be done using a smartphone

D4.4. smartCEM Assessment Tools
09/12/2013 102 Version 1.0
Would you use conventional scooter-sharing?
certainly-not unlikely about-50:50 likely for-sure
Please specify why or why not?
What motivates you to use this sharing service? scooter is electric… I like the concept of sharing a scooter… other: _____
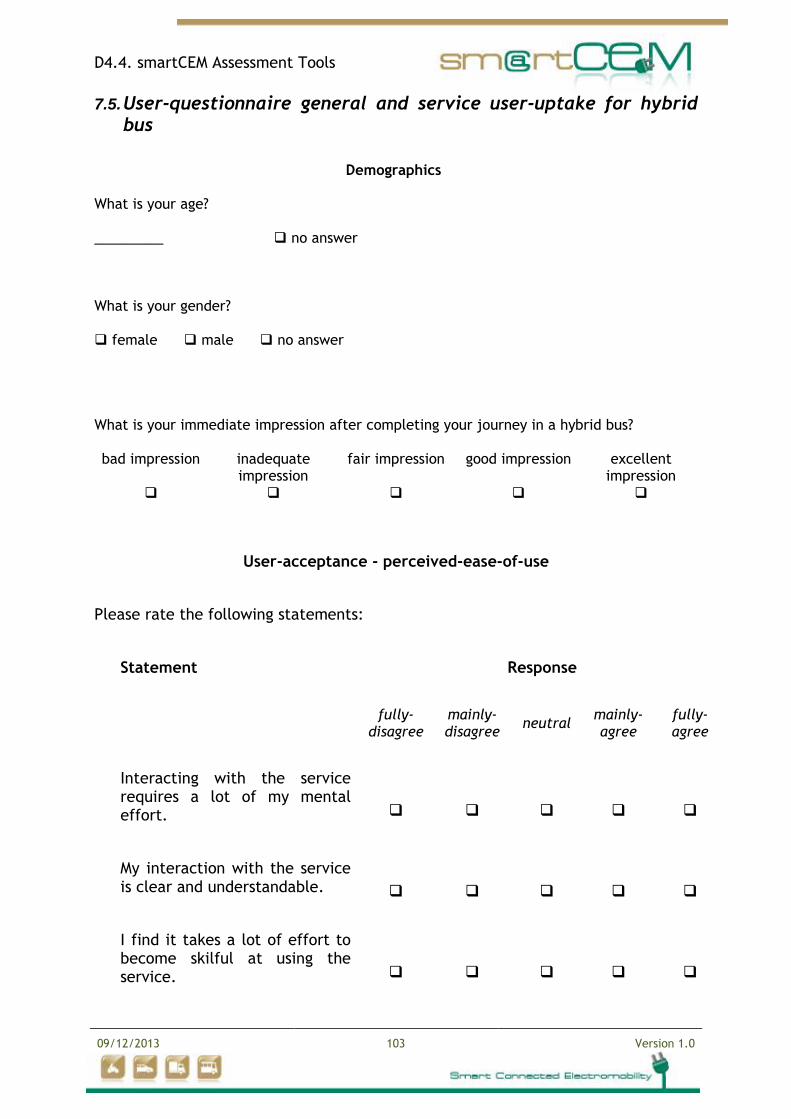
D4.4. smartCEM Assessment Tools
09/12/2013 103 Version 1.0
7.5. User-questionnaire general and service user-uptake for hybrid bus
What is your immediate impression after completing your journey in a hybrid bus? bad impression inadequate
impression fair impression good impression excellent
impression
User-acceptance - perceived-ease-of-use
Please rate the following statements:
Statement Response
fully-
disagree mainly- disagree
neutral mainly-agree
fully- agree
Interacting with the service requires a lot of my mental effort.
My interaction with the service is clear and understandable.
I find it takes a lot of effort to become skilful at using the service.
Demographics
What is your age? _________ no answer
What is your gender? female male no answer
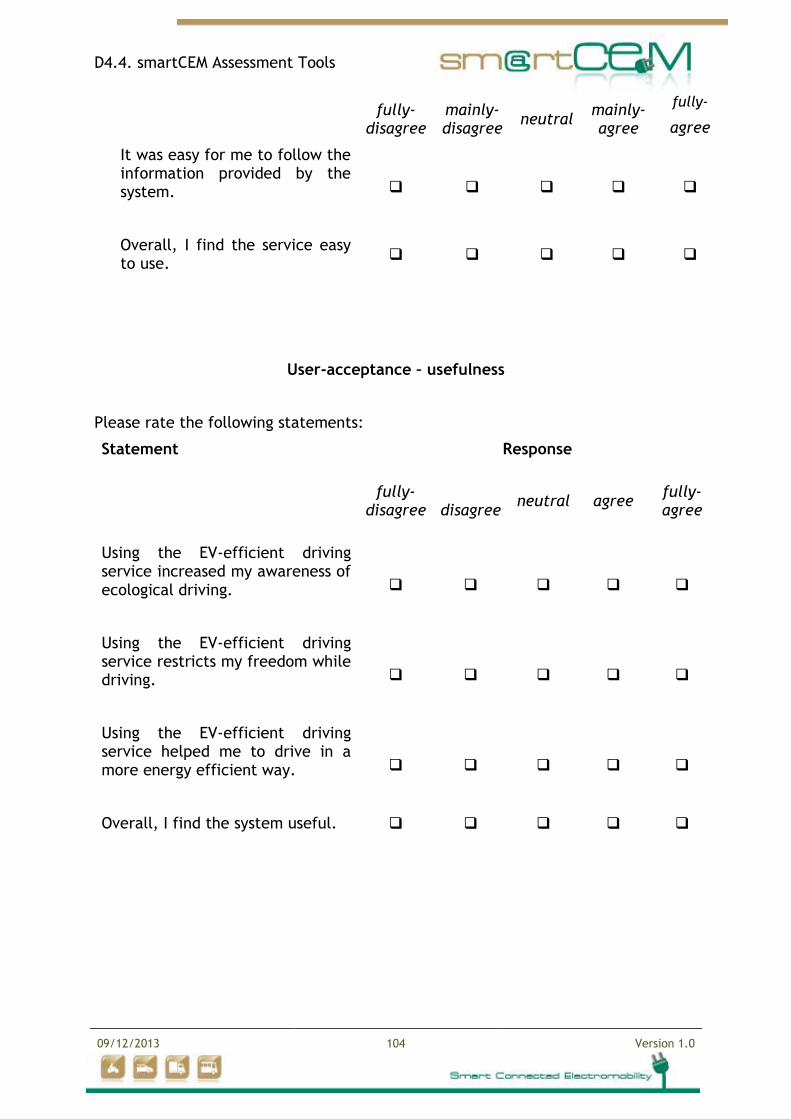
D4.4. smartCEM Assessment Tools
09/12/2013 104 Version 1.0
fully-disagree
mainly- disagree
neutral mainly-agree
fully-
agree
It was easy for me to follow the information provided by the system.
Overall, I find the service easy to use.
User-acceptance – usefulness
Please rate the following statements:
Statement Response
fully- disagree
disagree
neutral agree fully-agree
Using the EV-efficient driving service increased my awareness of ecological driving.
Using the EV-efficient driving service restricts my freedom while driving.
Using the EV-efficient driving service helped me to drive in a more energy efficient way.
Overall, I find the system useful.
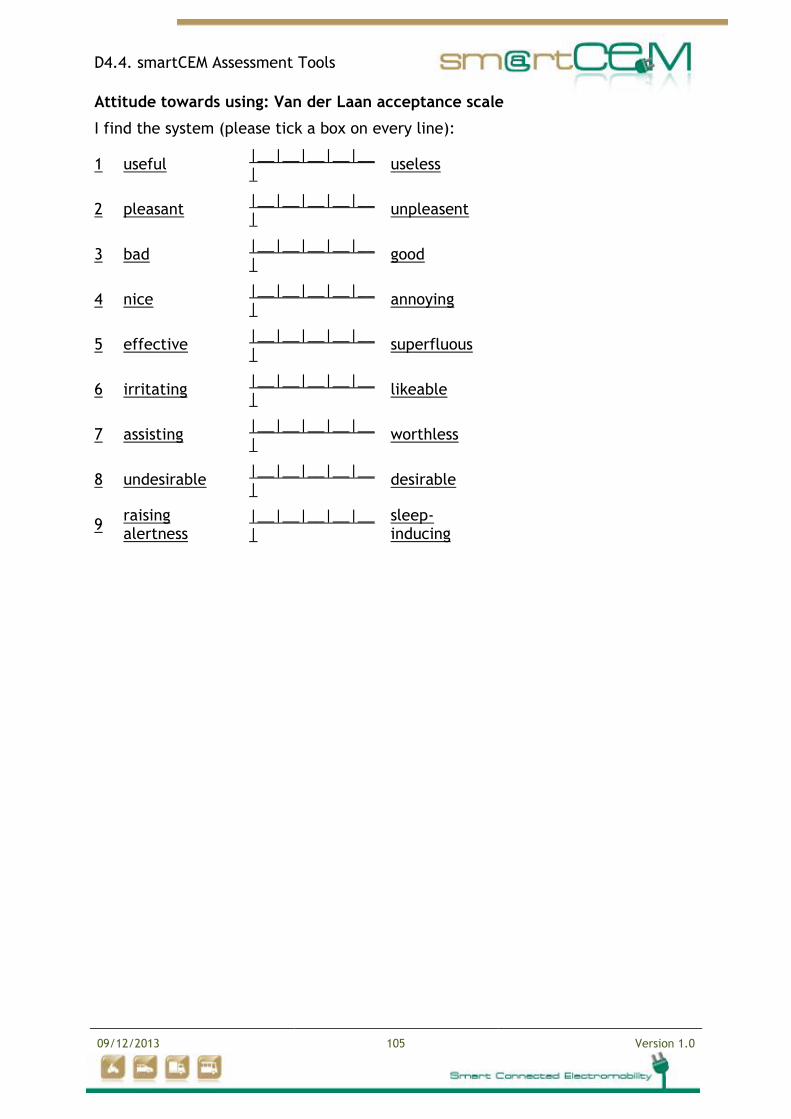
D4.4. smartCEM Assessment Tools
09/12/2013 105 Version 1.0
Attitude towards using: Van der Laan acceptance scale
I find the system (please tick a box on every line):
1 useful |__|__|__|__|__|
useless
2 pleasant |__|__|__|__|__|
unpleasent
3 bad |__|__|__|__|__|
good
4 nice |__|__|__|__|__|
annoying
5 effective |__|__|__|__|__|
superfluous
6 irritating |__|__|__|__|__|
likeable
7 assisting |__|__|__|__|__|
worthless
8 undesirable |__|__|__|__|__|
desirable
9 raising alertness
|__|__|__|__|__|
sleep-inducing
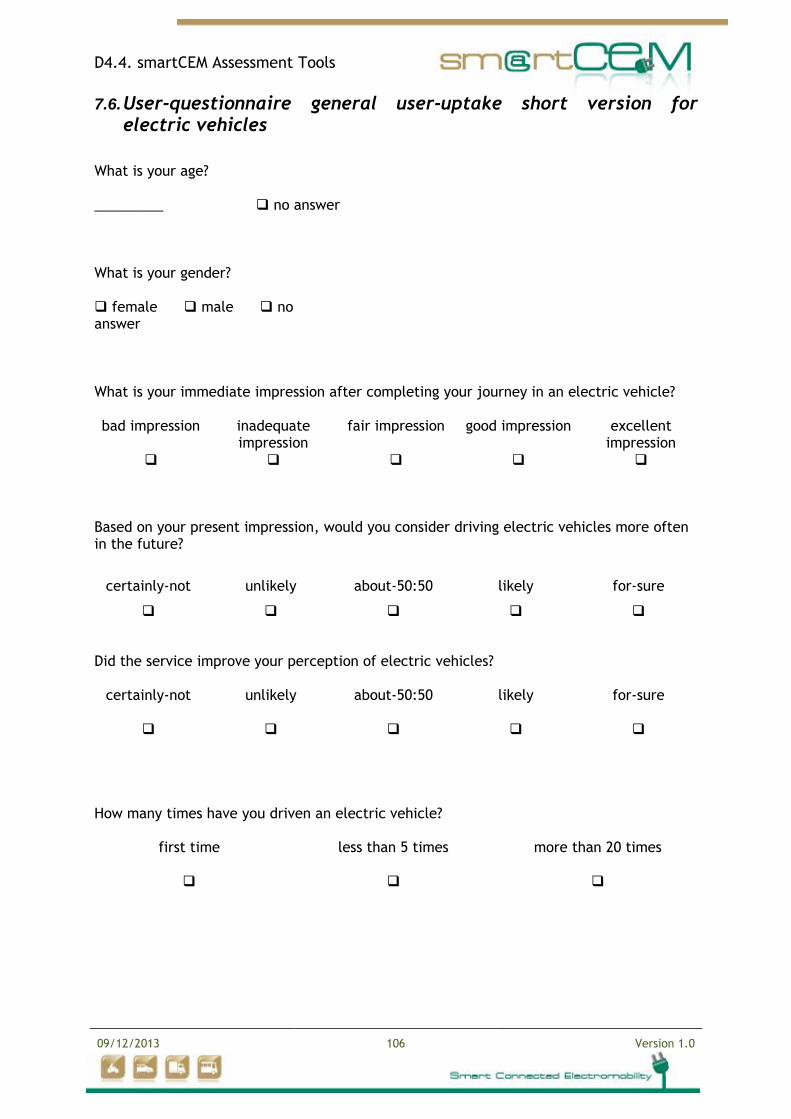
D4.4. smartCEM Assessment Tools
09/12/2013 106 Version 1.0
7.6. User-questionnaire general user-uptake short version for electric vehicles
What is your immediate impression after completing your journey in an electric vehicle? bad impression inadequate
impression fair impression good impression excellent
impression
Based on your present impression, would you consider driving electric vehicles more often in the future?
certainly-not unlikely about-50:50 likely for-sure
Did the service improve your perception of electric vehicles?
certainly-not unlikely about-50:50 likely for-sure
How many times have you driven an electric vehicle?
first time less than 5 times more than 20 times
What is your age? _________ no answer
What is your gender? female male no answer
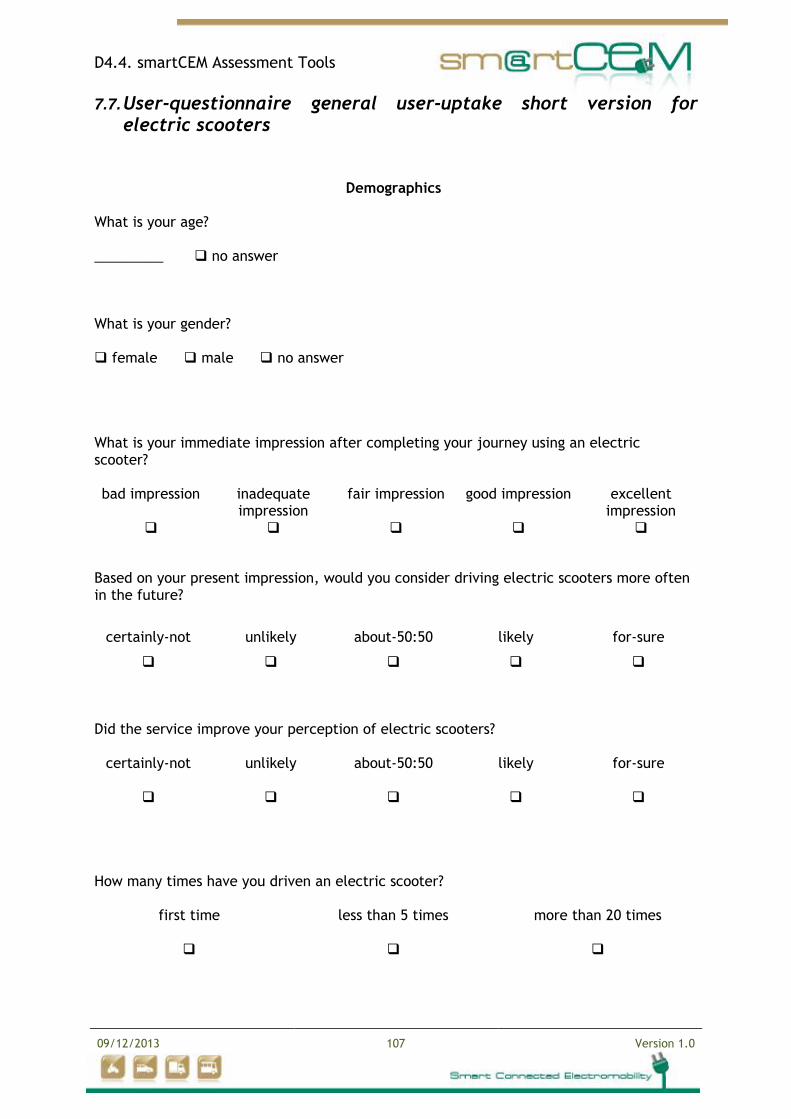
D4.4. smartCEM Assessment Tools
09/12/2013 107 Version 1.0
7.7. User-questionnaire general user-uptake short version for electric scooters
What is your immediate impression after completing your journey using an electric scooter? bad impression inadequate
impression fair impression good impression excellent
impression
Based on your present impression, would you consider driving electric scooters more often in the future?
certainly-not unlikely about-50:50 likely for-sure
Did the service improve your perception of electric scooters?
certainly-not unlikely about-50:50 likely for-sure
How many times have you driven an electric scooter?
first time less than 5 times more than 20 times
Demographics
What is your age? _________ no answer
What is your gender? female male no answer
D4.4. smartCEM Assessment Tools
09/12/2013 108 Version 1.0


