Data & Policy Program
Data-driven analysis to guide sustainable materials management
MSW Management Facilities in the U.S.
2010 & 2013
Publication date: 2017
Free Executive Summary
Full Report Available October 10th at www.erefdn.org

All rights reserved. No part of this publication may be reproduced in any form, in an electronic retrieval system, or otherwise, without prior express permission of the publisher.
3301 Benson Drive, Suite 101
Raleigh, North Carolina 27609
Phone: 919.861.6876
E-mail: [email protected]
Web: www.erefdn.org
Corresponding Authors: Bryan F. Staley, Ph.D., P.E. and Debra L. Kantner. Questions regarding the content of
this report may be directed to the corresponding authors at the e-mail address noted above.
Please cite as: The Environmental Research & Education Foundation (2017). MSW Management Facilities in the
U.S.: 2010 & 2013 Retrieved from www.erefdn.org
Cover photo: Waste-to-Energy plant in Zurich, Switzerland; Compost facility in Charlotte, North Carolina, USA;
Recycling facility in Charlotte, North Carolina, USA; Landfill location unknown
About EREF
The mission of the Environmental Research & Education Foundation (EREF) is to fund and
direct scientific research and educational initiatives for waste management practices to benefit
industry participants and the communities they serve.
EREF’s Data & Policy Program
EREF’s Data & Policy Program was developed as part of the foundation’s effort to expand its mission to
advance knowledge and education for sustainable solid waste management. The primary objective of
the Data & Policy Program is to aggregate and analyze solid waste data. The program also provides
valuable experience to undergraduate and graduate students who assist in data gathering and
analysis. Fees charged for this report are used to support internships to college students who assist in
data gathering and analysis efforts.
i EREF-D&P/FACILITY10-13
No part of this publication may be reproduced in any form, in an electronic retrieval system, or otherwise, without prior express permission of the publisher.
ACKNOWLEDGEMENTS
EREF gratefully acknowledges the contributions for the following:
EREF Interns
Brianna Holland
Corey Johnson-Erday
John Mullan, Rehrig Pacific Intern for 2017
James Wallace
The countless state agency personnel and facility owners and operators who provided key data necessary for
this project.

1 EREF—D&P/FACILITY10-13
No part of this publication may be reproduced in any form, in an electronic retrieval system, or otherwise, without prior express permission of the publisher.
EXECUTIVE SUMMARY
Each year, a significant amount of municipal solid waste (MSW)
is generated in the United States and subsequently managed via
various strategies and endpoints (e.g. landfilling, incineration,
recycling, composting). To estimate the total tonnage of MSW
managed in the U.S, in 2010 and 2013, the Environmental
Research & Education Foundation (EREF) implemented a facility
-based methodology. As part of this effort, MSW management
facilities were documented and data were aggregated into
state, regional, and national statistics, totaling 342.6 million
tons of MSW managed in 2010 and 347.0 million tons of MSW in
2013. To identify facilities and quantify tonnage, MSW was
defined according to the U.S. EPA definition; details are
available in the MSW Management in the U.S.: 2010 & 2013
report (EREF, 2016)
The lists of facilities provided here were identified as actively
managing MSW in 2010 and/or 2013. All efforts were made to
collect accurate information, including: federal, state, and
private facility databases, telephone and e-mail contact, and
facility websites. Information presented represent the state of facility operation in 2010 and 2013 to the best
available historical information, and in many cases may change over time.
For 2013 a total of 9,028 facilities managed MSW, comprised of: 3,913 recycling
facilities, 3,494 composting facilities, 1,540 MSW landfills, and 81 waste-to-energy
(WTE) plants. Ownership trends varied by facility type, with over two-thirds (65%)
of MSW landfills being publicly-owned while the majority of recycling, composting,
and WTE facilities were privately-owned.
Note: The published facility lists are provided without warranty of any kind, either expressed or implied, and
are presented “as is”. EREF is not liable in the event of any damages in connection with or arising from
provision or use of these Facility Lists. Note that these lists are routinely updated and may not match
exactly information provided in EREF’s “Municipal Solid Waste Management in the U.S.: 2010 & 2013” since
additional information may have become available since that report’s initial publication.
Facility Lists
·Landfill Facilities
· Waste-to-Energy (WTE) Facilities
· Composting Facilities
· Recycling Facilities: MRFs
· Recycling Facilities: Non-MRFs

2 EREF—D&P/FACILITY10-13
No part of this publication may be reproduced in any form, in an electronic retrieval system, or otherwise, without prior express permission of the publisher.
Facility Information. These facility lists provide the following publicly-available information for the 9,028
facilities identified (Table ES-1):
• State: State in which the facility is located
• Facility Name: Name of the facility
• Owner/Operator Name: Name of the owner or operator, when available, recycling only
• City: City in which the facility is located
• Ownership: Facility ownership (public or private)
• Operator: Facility operator (public or private), waste-to-energy only,
• Facility Type: Type of facility (RDF or mass burn), waste-to-energy only, or
(MRF or non-MRF), recycling only
• MSW Materials Accepted: Type(s) of MSW accepted at the facility, composting only
• Non-MSW Materials Accepted: Type(s) of non-MSW accepted at the facility, composting only
Table ES-1. Facility Count Comparison to Previous Industry Estimates
aFrom Waste Business Journal (2014) bFrom Berenyi (2007). cFrom ILSR (2014) dIncludes C&D landfills eIncludes non-MSW incinerators such as medical waste incinerators
Facility information was collected from a variety of sources, including:
• Federal facility databases (e.g. LMOP, GHG reporting database)
• State agency databases and websites
• Membership and organization directories (e.g. ERC directories)
• Facility permit information
• Company and/or Facility websites
• Online mapping (e.g. Google maps)
• Newspapers and online articles regarding facility planning, operations, and closures
• Direct contact with facilities via email and phone
Type of Facility EREF
(2013 data year)
Previous Estimates
Facility Count Data Year
Recycling 3,913 1,652a 2014
MRFs 799 590b 2007
Composting 3,494 3,285c 2012
Landfills 1,540 1,802a,d 2014
Waste-to-Energy 81 94a,e 2014
Total 9,028 6,833 -

3 EREF—D&P/FACILITY10-13
No part of this publication may be reproduced in any form, in an electronic retrieval system, or otherwise, without prior express permission of the publisher.
Landfill
Information is presented for 1,615 landfills: 1,572 accepting MSW in 2010 and 1,540 accepting MSW in 2013.
Facilities that did not accept MSW during a specific year are denoted by footnote.
Waste-to-Energy
Information is presented for 86 waste-to-energy (WTE) incinerators: all 86 managed MSW in 2010. Five became
inactive by 2013, resulting in 81 active facilities for 2013. Facilities that became inactive for 2013 are denoted by
a footnote.
Composting
Information is presented for 3,514 composting operations with an estimated 3,340 accepting MSW in 2010 and
3,494 in 2013. When available, information on the types of MSW and non-MSW materials accepted is provided
by checkboxes and/or footnotes. Composting facilities are generally subject to less stringent data tracking and
reporting requirements, if any, versus landfills and WTE facilities. For this reason, MSW materials acceptance
information is presented for only 2,356 composting facilities however all listed facilities are confirmed or highly
suspected to have processed MSW as part of all of the feedstock during 2010 and/or 2013 based on permit type
or other sources of information.
Recycling
Information is presented for 3,913 recycling facilities believed to have accepted MSW in 2013. Recycling
facilities are subject to less stringent data tracking and reporting requirements, if any, and therefore facility
data were unavailable from the vast majority of state agencies. Therefore, potential MSW recycling facilities
were identified primarily through contact with recycling associations and by performing targeted online
business searches. Once identified, facility personnel were contacted via phone and/or email to confirm if the
facility processes MSW recycling. As a result, most recycling data were collected from facilities via direct
contact and online survey.
Two distinct types of recycling facilities were identified in the study: (1) traditional material recovery facilities
(MRFs) with highly automated sorting and baling lines; and (2) smaller material aggregators (termed “non-
MRFs”) which typically perform minimal sorting, may only accept specific material types (e.g. steel and
aluminum cans exclusively), and typically have limited automation of the processing line, if it is present at all.
All facilities were classified as MRFs or non-MRFs to distinguish between processing facilities (i.e. MRFs) and
material aggregator facilities (i.e. non-MRFs).
Classifications were made based upon publicly-available data, and ambiguities were resolved by contacting the
facilities directly via telephone. Several factors were taken into account to distinguish between MRFs and non-
MRFs including: types of materials accepted, quantities processed, sophistication of technologies used (e.g.
manual sorting, semi-automatic, fully automatic), and the degree of source separation (e.g. single-stream, dual-
stream, multiple-stream).
4 EREF—D&P/FACILITY10-13
No part of this publication may be reproduced in any form, in an electronic retrieval system, or otherwise, without prior express permission of the publisher.
References
Berenyi, Eileen B. (2007) Materials Recycling and Processing in the United States: 2007-2008 Yearbook and Directory.
Westport, CT: Government Advisory Associates, Inc.
Energy Recovery Council [ERC] (2014). “The 2014 EREC Directory of Waste-to-Energy Facilities”. Arlington, VA: Energy
Recovery Council
Environmental Research and Education Foundation (EREF) (2016) MSW Management in the U.S.: 2010 & 2013. Retrieved
from www.erefdn.org
Institute for Local Self-Reliance [ILSR] (2014). State of Composting in the US: What, Why, Where & How. Washington, D.C.:
Institute for Local Self-Reliance.
Resource Recovery and Conservation Act—Subtitle D, 40 CRF §§257-258 (2003).
Waste Business Journal (2014) “Directory of Waste Processing & Disposal Sites”. [Data file]
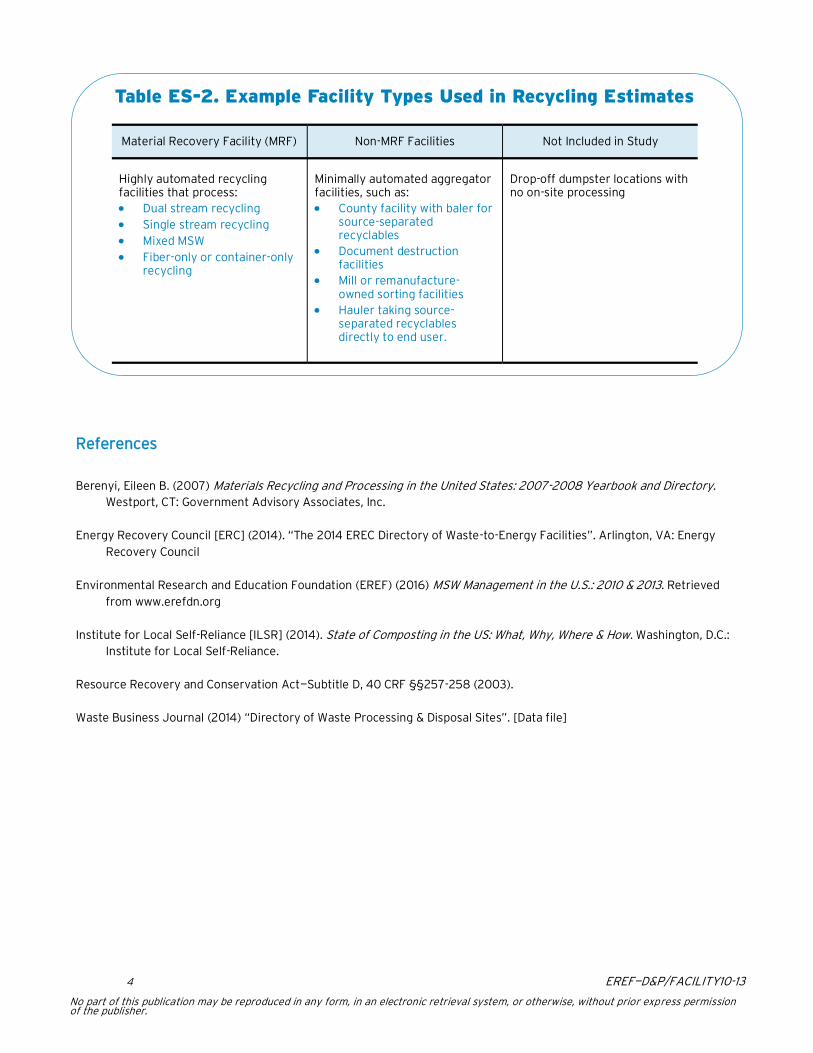
Material Recovery Facility (MRF) Non-MRF Facilities Not Included in Study
Highly automated recycling facilities that process:
• Dual stream recycling
• Single stream recycling
• Mixed MSW
• Fiber-only or container-only recycling
Minimally automated aggregator facilities, such as:
• County facility with baler for source-separated recyclables
• Document destruction facilities
• Mill or remanufacture-owned sorting facilities
• Hauler taking source-separated recyclables directly to end user.
Drop-off dumpster locations with no on-site processing
Table ES-2. Example Facility Types Used in Recycling Estimates


