
JANET WALL, ROBERT FRENCH, and RUSSELL NELSON, Jr.
Foreign Fisheries in theGulf of Alaska, 1977·78
Introduction
The Gulf of Alaska, as describedhere, encompasses the area betweenthe eastern Aleutian Islands at long.1700 W and Dixon Entrance at long.132°40'W. (Fig. 1), and covers160,000 square miles of continentalshelf. Enactment of the Fishery Conservation and Management Act of1976 (FCMA) placed the managementof the fishery resources of the region,as well as that of other areas withinthe 200-mile fishery conservation zone(FCZ), under the jurisdiction of theUnited States. One of the provisionsof the act requires that any foreignvessel permitted to fish within theFCZ must accept, and provide accommodations for, U.S. fisheryobservers.
During 1977-78, the first 2 years offishery management under FCMA, 50observers sampled on 61 differentforeign fishing vessels in the Gulf of
ABSTRACT -During /977-78. 50 U.S.obsen'ers sampled on 6/ (orei[?n I'essels inthe Cul(o(Alaska, cOI'ering 8.3 percent 0/theforeign elfort in/977 and /-1.7 percent in/978. Obsener data were used in estimating a total/oreign ground/ish catch o(nearly200,000 t in /977 and about /65,000 I in/978. The predominant species caught bothveal's and b,· all Iwtions was wal/e\'e poliock, Theragra chalcogramma, whicilmadeup 58-59 percent o( the total joreign catch.Other species and sllecies groups 0/ importance were Atka mackerel, Pleurogrammu~
monopterygius: Pacilic ocean perch,
20
Alaska. They collected data whichallowed the United States to estimatethe foreign catch and help assess thebiological status of various stocks offish. Information on the kinds of dataobtained by observers is given byNelson et al. (1981).
This report provides a brief historyand description of the foreigngroundfish fisheries in the Gulf ofAlaska, reviews the history of theobserver program, describes thesampling methods of the observers,and summarizes the data collected byobservers in the Gulf of Alaska during 1977-78.
The Foreign Groundfish Fishery
Although the foreign groundfishfishery had begun as early as 1933 in
Janet Wall, Robert French, and Russell Nelson, Jr.,are with the Northwest and Alaska Fisheries Center,National Marine Fisheries Service, NOAA, 2725Montlake Blvd. E., Seattle, WA 98112.
Sebastes alulus: (luul/rlas (mriousspecies). sable/ish, Anoplopoma t'imbria:and Pacific cod, Gadus macrocephalus. Estimates were also Inade of the incidentalcatches o(species whose retentiun was prohibited: Pacific halibut, Hirpoglossoidesslenolepis: Pacific salmon, OncorhynchusSliP .. king crab, Paralithodes and LithodesspII.: and snow (Tcl/lIler) crab. Chionoecetesspp. In /977, catch estimates o/halibul andsalmol/ were -I13,OOU and 5,270, respectil·elv. The /97X estimates Ivere 293,000halibut, -15.600 .,almon. 9-1 ,nun king crab,and 2-1 ,onn snol1' crab.
the Bering Sea with a Japanese fisheryfor yellowfin sole, Limanda aspera, itwas not until 1960 that both Japanand the U.S.S.R. first sent exploratory fishing expeditions into theGulf of Alaska. Detailed descriptionsof the historical development of theforeign fisheries are given by Chitwood (1969), Forrester et al. (1978),and the Fisheries Management Planfor the Gulf of Alaska GroundfishFishery'.
In 1962, a fleet of 70 Soviet trawlersand support vessels entered the Gulfof Alaska and began fishing forPacific ocean perch, Sebastes alutus,just south of the Shumagin Islands,and on Albatross and Portlock Banksoff Kodiak Island (Chitwood, 1969).By the end of 1965, Soviet oceanperch catches east of long. 175 oWreached a peak of 384,000 t and theyear-round fishery had extended asfar south as Dixon Entrance, BritishColumbia (Forrester et al., 1978). Insubsequent years, declining rockfishcatches resulted in the reduction ofthe Soviet trawling effort in the Gulf(Table 1) and a diversification intarget species to include walleyepollock, Theragra chalcogramma,and Atka mackerel, Pleurogrammusmonopterygius, (Fig. 2).
Following preliminary explorationsin the Gulf of Alaska in 1960 and1962, Japanese fishing operationsbegan on a commercial scale in 1963with a fleet of four independenttrawlers, a mothership, and threecatcher vessels using sunken gill nets(Forrester et al., 1978). The bottomgill-netting operation was discontinued after the first year, but thetrawl fishery continued with a gradualincrease in the number of vessels. According to Forrester et al. (1978), sidetrawlers, factory trawlers, smalltrawlers, and Danish seiners were allused to harvest a variety of groundfish species, of which rockfish(predominately Pacific ocean perch)
'North Pacific Fishery Management Council.1978 Fishery Management Plan for the Gulf ofAlaska ground fish fishery. Unpubl. manuscr.,North Pac. Fish. Manage. Counc., Suite 32. 333W. 4th Ave .. Anchorage. AK 99510.
Marine Fisheries Review

Table 1.-The range in number of fishing vessels present in the Gulf of Alaska during any ona month, 1962·78'.
Figure I.-Statistical reporting areas of the Gulf of Alaska.
implemented, which placed licensing,catch, and area restrictions on allforeign vessels fishing within the U.S.200-mile FCZ. Groundfish allocationsin the Gulf of Alaska were given toJapan, the U.S.S.R., the Republic ofKorea, Poland, and the Republic ofChina (Taiwan), i.e., all of the nations (except Canada) that hadpreviously fished in that region. In addition, in 1978 an allocation was givento Mexico, but no ships of that nationappeared on the fishing grounds. Thelargest allocations of groundfish in1977-78 were given to Japan and theU.S.S.R., which together received82.5 and 72.6 percent of the foreignallowable catch in those years, respectively.
Japan was allocated 106,822 t inthe Gulf of Alaska in 1977 and101,735 t for the period Januarythrough November 1978. During 1977and 1978, fishing for the Japaneseallotment was conducted by longlinevessels and three types of sterntrawlers: Large freezer trawlers, alarge "surimi" trawler, and smallfreezer trawlers. These vessels aredescribed by Nelson et al. (1981).
In the fall of 1978, one shipclassified as a large surimi trawlerfished in the Gulf of Alaska. Vesselsof this type were distinguished fromlarge freezer trawlers in their capability to make the minced fish productknown as surimi in addition to thefrozen fish and meal produced on thefreezer trawlers. The surimi trawlerstargeted on pollock whereas the largetrawlers fished for either pollock orrockfish.
In recent years a fleet of smallfreezer trawlers has fished in the Gulfof Alaska (Fig. 3). Pollock, as well asa variety of rockfish and flatfishspecies, were frozen whole or headedand gutted by hand on these ships. Asthe small trawlers did not have fishmeal or fish oil plants on board, nontarget species of low value were frequently discarded. Unlike the largertrawlers, small freezer trawlers usuallydid not refuel at sea or deliver theircatches to cargo vessels but returnedto Japan to unload and resupply aftera cruise of 75-90 days.
550 N
60' N
It was not until the 1970's thatfishing vessels of other nations joinedthose of the U.S.S.R. and Japan inthe Gulf of Alaska. Korean setlinevessels began targeting on sablefish in1972 and in 1976 a few trawlersentered the fishery. Poland began exploratory trawling in the Gulf in 1973and conducted small fisheries forpollock, Atka mackerel, and rockfishin 1974 and 1975. A Taiwaneselongline vessel began fishing in theGulf in 1975 and by July 1976, threelongline vessels and one stern trawlerfrom Taiwan had been observed there(footnote 1).
On I March 1977, the FCMA was
_-'lI"""'!""""----"""T"'!""""-----,...-----,...-----r' 64' N
'u.S. Fish and Wildlife Service. 1965. Foreignfishing activities, Bering Sea and Gulf ofAlaska, 1964. Unpubl. manuscr., 57 p. U.S.Dep. Inter., U.S. Fish Wildl. Serv., Bur. Commer. Fish., Off. Enforcement and Surveillance,Juneau. Alaska.
L.--17.L0'-W--~--'60J.'-W----....,5~0'~W----""":':'4=0'~W----~130'~W... 50' N
Japan U.S.S.R. Korea Taiwan Poland
Longline Longline LonglineYear Trawlers vessels Trawlers Trawlers vessels Trawlers vessels Trawlers
1962 0-2 0-701963 '1Hi 0-2001964 IHi IHi 0-1501965 0-11 IHi 10-1301966 3-13 2·9 4·1401967 3-14 2·11 5-551966 2-12 1-9 0-201969 1·20 2-9 0-15 0-21970 1·15 2-12 0-151971 1·15 2-13 0-161972 4-26 2-10 4-25 0-21973 6-16 5-11 4-36 0-2 '0-11974 6-12 7·12 1-39 0-3 0-11975 6-11 7-12 5-20 0-5 1·3 0-1 0-21976 5-11 4·14 2-21 0-19 o-a 0-1 0-41977 4·16 6-16 0-25 IHi 0-5 0-1 0-21978 0-20 0-20 0-21 0-5 0-2 0-5
1 Data obtained from National Marine Fisheries Service Enforcement Division, Juneau, Alaska.'Exploratory fishing by trawlers and gill-netters; comparable figures for 1961Hi1 exploratory surveys are not available.'Exploratory fishing by one stern trawler from Poland.
constituted the greatest proportion ofthe total weight through 1970. Thelongline fishery began in 1964 (U.S.Fish and Wildlife Service'>, althoughat that time, because of concern forincidental catches of Pacific halibut,Hippoglossus stenolepis, it wasrestricted to fishing for sablefish,Anoplopoma fimbria, in depthsgreater than 500 m.
May 1981, 43(5) 21

Figure 2.-A codend of Atka mackerel is dumped in a deck bin of a Soviettrawler.
•
Figure 3.-The Ryujin Maru No.8. typical of the class of small Japanese freezertrawlers that fish in the Gulf of Alaska.
22
The Japanese long1ine vessels fished for sablefish at depths greater than500 m and for Pacific cod, Gadusmacrocephalus, in shallower waters.Figure 4 illustrates the preparation ofthe gear prior to making a longlineset. The sablefish, cod, and bycatches of rockfish and flatfish werenormally headed and gutted by handbefore being frozen. At times, theovaries, testes, stomachs, and a portion of the throat or pectoral girdle ofthe target species were kept andfrozen separately. No observers havebeen placed on either Taiwanese orKorean longline vessels, but theseships are thought to be similar to theJapanese longline vessels in configuration and operation.
The Soviet Union was allocated110,364 t of groundfish in 1977 and103,156 t for the period Januarythrough November 1978. In recentyears the Soviet fleet has been almostentirely composed of large freezertrawlers of two types-BMRT andRTM stern trawlers (Nelson et al.,1981). The majority of the Sovietvessels that were observed in the Gulfof Alaska were of the BMRT class.On both types of ships, pollock,Pacific cod, and rockfish were usuallyheaded and gutted or filleted beforethey were frozen. Atka mackerel, flatfish, and sometimes rockfish werefrozen whole.
The Republic of Korea was allocated 37,826 t of groundfish in 1977 and36,564 t in 1978. The stern trawlers inthe Korean fleet were similar in sizeand horsepower to the large Japanesefreezer trawlers; but, in general, thefactories were much less mechanizedand the vessels carried larger crews(85-165, of whom 9-17 were officers).Minced fish products were not produced on the South Korean ships.Most of the groundfish were frozen inthe round, although occasionallylarge pollock and Pacific cod werefilleted.
Polish stern trawlers, somewhatsimilar in size and configuration totheir Soviet counterparts, were 79-90m in length, 2,300-2,500 GRT, hadpropulsion engines of 2,400 to 3,600hp, and a crew of 78 to 91. Processing
Marine Fisheries Review

Table 2.-Summary 01 gear dimensions used by '"",Ign vessels fishing In the Gulf of Alaska, 1977·78. (U.S. observerdata.)
Figure 4.-A crew member on a longline vessel prepares the units of the gear,called "hachi."
Regulation of theForeign Fishery
Material
Qtterboard
Size Shape
mutual concessions in which theUnited States granted permission tofish or carry out support activitieswithin the 12-mile contiguous fishingzone (CFZ) in exchange for agreements to follow certain restrictions onfishing outside the CFZ. The earliest
5\M4.8 90-100 2.2x4.4 Rectangular Iron or steelto
2.7x3.65\M4.8 90-100 2.7x4.4 Rectangular Iron or steel
to2.7x3.6
21-88.8 90-120 1.9x3.8 Rectangular Steel or woodto and steel
2.4x3.0
77.4 60·120 5.5-<3m,
Concave circular, Steelelliptical, or
24-48.8 60-120 5.5-6m2 rectangular Steel81·103 90-105 1.5x2.5 Rectangular Steel
to3.0x5.0
121.8 100 2x4 Rectangular Steel
No. hachl No. hooks Gangionper set per hachi (m) Bait
390-420 36-58 1.0-1.7 Squid and POllock
CodendHeadrope Groundrope mesh size
(m) (m) (mm)
JapanLarge surlmi vessels 50-58.6
Large freezer trawlers 50-58.6
Small freezer trawlers 22·74.2
U.S.S.R.Large freezer trawlers
Pelagic trawl 77.4
Bottom trawl 30-50Republic of Korea 60-60
Poland 121.8
HachiLongline vessels (m)
Japan 75-100
Nation andvessel type
Trawlers
Prior to FCMA enactment, foreignfisheries were regulated by treaty andbilateral agreements. These agreements normally were in the form of
machinery on board these vessels wasused to produce skinless fillets frompollock and cod of a given size range;other sizes and species such asrockfish and sablefish were headedand gutted by hand.
In November 1978, a U.S.-Koreanjoint-venture fishery took place in theShumagin area in which a Koreanstern trawler served as a processingship for the catches of pollock andcod made from a single U.S. fishingboat. Bad weather plagued the venture, however, and catches weredelivered to the processing vessel ononly 4 out of the 20 days of the operation.
The size and type of fishing gearused by the foreign fleet varied considerably depending on the nationalityand size of the vessel and the type offishery in which it was engaged. Table2 gives the general specifications ofthe trawl nets and longline gearobserved in use in the Gulf of Alaskaduring 1977-78.
Historical Groundfish Catches
The total foreign groundfishcatches from the Gulf of Alaska for1%3-78 are listed by nation in Table3. Since the initiation of experimentalfishing in 1962, the total annual catchgrew rapidly to a high of 394,000 t in1965 when the U.S.S.R. took 340,000t. After the peak in 1965, the annualforeign groundfish catch has generallyfluctuated between 100,000 and200,000 t.
The species composition of thecatch has changed over the years.Rockfish, largely Pacific ocean perch,comprised 97-98 percent of the totalreported catch during the first yearsof the fishery and only 6 percent ofthe catch in 1978. As the abundanceof Pacific ocean perch declined, otherspecies made up increasing proportions of the catch (Fig. 5). Walleyepollock, which comprised only 0.4percent of the catch in 1964, made up58-59 percent of the total foreigngroundfish catch in 1977-78. Catchesof sablefish, flatfish, Atka mackerel,and other species have also increased,making up the remaining portion ofthe catches in recent years.
May /98/, 43(5) 23

100
~ 80 Rockfish
~ 60
~ 40 Sableflsh. p.,flatfish, / \, ,/
o and other~, I )/
~ 20 ,/..J,/' /'..... ftOll0Ck
O~~-, '"1964 66 68 70 72 74 76 78
Yeor
Figure 5.-Percentage composition ofmajor species groups in foreignreported catches of the Gulf of Alaska,1964-78. Data from "All nationremovals of groundfish, herring, andshrimp from the eastern Bering Sea andNortheast Pacific Ocean," 1964-78,compiled by Sueto Murai, HaroldGangmark, and Robert French, Northwest and Alaska Fisheries Center, Nat!.Mar. Fish. Serv., Seattle, Wash. Unpub!. manuscr.
Table 3.-Foreign reported annual groundfish catches in metric tons by foreign nationsin the Guif of Alaska, 1962·78'. (Groundfish catches by Canada and shrimp catch data arenot included.)
Republic of Republic ofYear Japan U.SSR. Korea Poland China (Taiwan) Total
1962 '0 na,
0 01963 10,733 na 0 0 10,7331964 17,451 230,000 0 0 247,4511965 54,120 340,000 0 0 394,1201966 88,929 83,000 0 0 171,9291967 78,350 76,937 0 0 155,2871966 84,223 59,422 0 0 143,6451969 97,293 20,015 280 0 117,5881970 85,295 9,336 0 0 94,8311971 87,672 30,719 0 0 118,3911972 112,759 88,864 4,042 0 185,6651973 114,011 59,522 4,332 na 177,8851974 112,306 77,942 5,237 na 195,4851975 91,142 95,465 ~13.988 2.132 ~15O ~202,877
1976 89,938 79,873 37,414 0 na 207,2251977 100,079 84,700 37,826 1,465 na 204,0701978 64,187 62,927 38,584 1,269 164,947
'Catch statistics for 1963 are from Forrester et aI., 1978. Catches for 1964 through 1978 werecompiled from data on file at the Northwest and Alaska Fisheries Center, National MarineFisheries Service. See "All nation removals of groundfish, herring, and shrimp from theeastern Bering Sea and Northeast Pacific Ocean, 1964·1978". Compiled by Sueto Murai,Harold Gangmark, and Robert French. Northwest and Alaska Fisheries Center, Natl. Mar.Fish. Serv., Seattle, Wash. Unpubl. manuscr., 34 p.'Zero indicates that there was no fishing by vessels of that nationality that year.3 na = not available.
restrictions placed on foreign fishingwere designed to minimize gear conflicts between foreign trawls anddomestic crab pots or halibut longlines. Later, regulations were devisedby the International North PacificFisheries Commission (lNPFC),which were intended to help preventthe deterioration of certain commercially important fish stocks, such asPacific halibut, sablefish, and Pacificocean perch. Enforcement of theseregulations was carried out by thegovernment of the violator vessels.While the measures designed toreduce gear conflicts were highly successful, the conservation regulationswere considerably less so, partlybecause of the great length of time required to institute them (footnote 1).
In 1976, the FCMA was passed,which extended jurisdiction overfisheries resources and authorizedfederal management of thoseresources between the 3- and 200-milelimits. Under the Act, foreign nationsare allowed to harvest that portion ofthe total allowable catch in the FCZ(established by the regional fisheriesmanagement council) which is nottaken by U.S. fishermen. The Actauthorizes the establishment of feesand permits for the licensing offoreign vessels, the setting of catch
24
allocations and charges for the fishcaught, the requirement for the submission of detailed catch and effortdata, the placement of U.S. observerson any foreign vessel, and the establishment and enforcement of varioustime, area, and gear restrictions onthe fishing by foreign vessels as deemed appropriate by the councils.
Foreign FisheriesObserver Program
With the initiation of foreignfishing off the Alaskan coasts, interest was expressed by U.S. fishermen and fishery managers about theeffect these vessels might have on thefishery resources of the continentalshelf. There was particular concernover the decreased catch of Pacifichalibut by U.S. and Canadian setlinevessels during the late 1960's and early1970's (Miller et al., 1976). It wassuspected that the incidental catch ofhalibut by the foreign trawlers was atleast partially responsible for thedecline, but insufficient data wereavailable at that time.
Negotiations with the Japanesegovernment led to an agreement byJapan in 1973 to allow U.S. observersaboard a limited number of Japanesevessels throughout the year to determine the incidental catch rate of
halibut and crab. In the Gulf ofAlaska it was agreed that observerscould be placed on two trawlers perquarter commencing in 1975.
As the result of similar bilateralagreements with the U.S.S.R., alimited number of U.S. fisheryobservers were allowed to sampleaboard Soviet trawlers for 2-weekperiods, beginning with a trip in theGulf of Alaska in November 1974.Although Korean, Polish, andTaiwanese vessels fished in the Gulfof Alaska, no observers had boardedany of those ships before FCMA wasimplemented.
Due to the concern for the incidental catch, the primary duties of theobservers during the first years of theobserver program were to determinethe incidental catch rates of Pacifichalibut; Pacific salmon, Oncorhynchus spp.; king crab, Para/ithodescamtschatica; and snow (Tanner)crab, Chionoecetes spp.; and to collect size and mortality data on thesespecies. Additional duties includeddetermining the species compositionof the catch, gathering length and agedata on the commercially importantgroundfish, collecting catch statistics,and reporting on observations ofmarine mammals. As there waslimited observer coverage on numbers
Marine Fisheries Review

Table 4.-Summary of observer effort, foreign vessel effort, and observer coverage (observer month/foreign effort x 100)In the Gulf of Alaska, 1977·78'.
Figure 6.-Aboard a small Japanese freezer trawler, a U.S, fishery observergathers a sample of the catch.
1977 1978
Nation and Observer Vessel Percent Observer Vessel Percentvessel type months months coverage months months coverage
JapanSmall freezer trawlers2 9.3 57.0 163Large freezer and surimi 122 972 12.6 10.7 41.1 26.0
trawlersLongllne vessels 6.2 95.8 6.5 15.1 93.4 16.2
U.S.S.R.Large freezer trawlers 75 80.8 9.3 4.3 61.9 7.0
Republic of KoreaLarge freezer trawlers 0.0 13.7 0.0 2.4 19.1 12.6Longllne vessels 0.0 22.3 0.0 0.0 9.1 0.0
PolandLarge freezer trawlers 0.0 2.1 0.0 0.0 3.0 14.7
Total 25.9 311.9 8.3 41.8 2846 14.7
'One vessel or observer month is equal to 28 days.'Effort data for large and small trawlers was not separated for 1977.
program at the Northwest and AlaskaFisheries Center was the technique ofestimating foreign fleet catches basedon observer sampling of a portion ofthe vessels in a fleet. After a day ofsampling, an observer extrapolatedthe species composition of thesamples to the total catch weightestimated by vessel officers to have
Foreign Groundfish Catch Estimates
An important part of the observer
similar to those of observers on Bering Sea vessels and are described byNelson et al. (1981).
Results of ObserverSampling In 1977-78
and types of ships, no attempt wasmade to use the observer data tomake independent estimates of thetotal groundfish catch by the foreignfleets.
After the implementation ofFCMA, the observer program wasseen as part of a plan to help insurecompliance with fishery regulations.The determination of the species composition of the catches became increasingly important as the datacollected by observers were used tocompile an ongoing estimate of theforeign catch by species throughoutthe fishing season. Observers werealso asked to make independentestimates of the trawl hauls andlongline catches that they observed,and these were compared with theestimates made by ship personnel.Any suspected violations of fishingregulations seen by observers werereported upon their return.
Once the acceptance of observersbecame a requirement of fishing inthe FCZ and it was no longer necessary to seek permission from theforeign nations to place an observeron a fishing vessel, the number ofobserver trips in the Gulf in Alaskaincreased fivefold from 12 in 1976 to63 in 1978. Not only was increasedobserver coverage considered important in insuring compliance with theregulations, but the biological datathe observers collected became usefulto fishery managers in determiningthe status of the fishery resources.Table 4 lists the observer coveragesfor the various nationalities and vesselclasses which are calculated as apercentage of observer months tovessel months on the fishing grounds.Observer coverage ranged from 0 to26 percent for any given nationality/vessel class, and the overallcoverage increased from 8.3 percentin 1977 to 14.7 percent in 1978.
For the most part, U.S. fisheryobservers of the northeast Pacificregion were university students orgraduates in fisheries or relatedbiological fields; some of them alsohad experience in commercial fisheries. Sampling procedures (Fig. 6, 7) inthe Gulf of Alaska were generally
May 1981, 43(5) 25

Table 5.-The estimated catch in metric tons of allocated species taken by foreign ships' in the Gull of Alaska, 1977·78.(Based on U.S. observer data.)
Figure 7.-A U.S. fishery observer sorts samples of the catch at his below-deckwork station.
'This table does not include catch statistics of the Taiwanese ships which fished in the Gulf of Alaska in 1977 before 1March, the effective date of the FCMA.'NA = no allocation was given in 1977 to that nation for that species.
day was calculated. The average catchper day was then multiplied by thenumber of vessel days on the groundto give the estimated catch by speciesfor that nation, vessel class, area, andweek.
Data on fishing effort in vessel dayson the grounds were obtained fromthe U.S. Coast Guard/NMFS checkin and check-out system which required all foreign vessels to report thedate, time, and position of their entryinto or departure from the 200-mileFCZ. During 1978, vessels were alsorequired to report changes in fishingarea within the 200-mile zone, but in1977 the number of vessel days ineach of the five statistical areas in theGulf of Alaska was determined by apportioning the foreign effort in theGulf through the use of vesselsightings made by the U.S. CoastGuard or NMFS enforcement agents.
As catch estimates based solely onU.S. data might not be representativeof a particular segment of the fleetwhen observer coverage of that portion is low, provisions were made toutilize foreign reported catch statisticsin those instances. A catch report byspecies from each foreign ship whichfished in the FCZ was submittedweekly in a format compatible withthe observer radio messages. Whenobserver coverage of a vessel class foran area/week was 20 percent orgreater, extrapolated observer datawere used in the calculation of theU.S. "best estimate" of the foreigncatch. Conversely, foreign reportedstatistics were used when observercoverage of a nation/vesselclass/area/week was less than 20 percent.
The 1977-78 estimates of the Gulfof Alaska foreign groundfish catchesmade through the use of this bestestimate technique are shown in Table5 by nation and species. The total1977 groundfish catch was nearly200,000 t, and the 1978 estimate wasabout 165,000 t, approximately 83percent of the 1977 catch. Thepredominant species in the catches ofboth years was walleye pollock, whichmade up 58-59 percent of the totalforeign catch. Atka mackerel, which
area, was sent by radio-telegram tothe National Marine Fisheries Service(NMFS) in Seattle via the U.S. CoastGuard receiving stations in Alaska.These data, tahuJated by nation,vessel class, area, and species, werecombined and an average catch per
Atka Pacific Other AllYear and Floun- Pacific Sable- mack· ocean rock- Other ground·
nation Pollock Squid ders cod fish erel perch fish fish fish
1977Japan 41,174 NA' 15,462 1,246 14,356 NA 17,943 3,221 3,524 96,928U.S.S.R. 39,571 NA 582 744 9 19,246 1,683 140 1,108 63,083S. Korea 35,838 NA NA NA 1,600 NA 603 NA 100 38,141
1,256 NA NA 0 0 209 NA NA 0 1,465
Total 117.839 16,044 1,992 15,965 19,455 20,229 3,381 4,732 199,617
Percent 590 8.0 1.0 8.0 98 10.1 1.7 2.4 1000
1978Japan 26,093 186 13,809 8,846 6,458 1,131' 4,548 1,277 3,919 86,272U.S.S.R 41.956 2 196 1,140 4 18,387 570 1 381 62,637S. Korea 27.052 133 296 1,389 865 63 3,049 609 1,867 34,923Poland 1.227 1 13 14 0 0 4 9 0 1,268
Total 96,328 322 14,314 1,:169 7,127 19,586 8,171 1,896 5,987 165,100
Percent 58.4 0.2 8.7 69 43 11.£ 5.0 1.2 3.6 100.2
been landed on the ship that day. Atthe end of the week (midnight Saturday, Greenwich Mean Time), eachobserver summed the estimates of thedaily catches by species and fishingarea. This information, along with thenumber of days the ship spent in each
26 Marine Fisheries Review

was taken primarily by the U.S.S.R.,constituted only 9.8 and 11.8 percentof the total groundfish catch in 1977and 1978, respectively, but it comprised approximately 30 percent of theSoviet landings. Japanese vessels tookthe greatest amounts of the other major species and species groups: Pacificocean perch, flounders, sablefish, andPacific cod.
Incidence and IncidentalCatch of Pacific Halibut,Pacific Salmon, King Crab,and Snow Crab
An important part of the observerprogram in the Gulf of Alaska hasbeen the estimation of the numbersand tonnages of Pacific halibut,salmon, king crab, and snow crabtaken incidentally in the foreigngroundfish fishery. The data collectedby the observers on these species included the number of fish/crabobserved per metric ton of catchsampled and their average weights.The calculations used to estimate theincidence and average weight per individual for a given area and timeperiod are the same as shown byNelson et al. (1981).
Due to limited observer coverage in1977 and the resultant large numberof nonsampled month/area cells, annual incidence means and averageweights were used to make estimatesof the incidental catches for that year.No king crab or snow crab catchestimates were made for 1977 becauseof the lack of observer coverage andlow crab incidence rates. In 1978, increased levels of sampling allowedestimates to be made using observerdata on incidence rates for individualmonths. Where montWy incidencerates were lacking, the annual meanfor the appropriate area and vesselclass was used. In those instanceswhere no incidence data wereavailable for a particular nation orvessel class, judgment was made tosubstitute the rates from another nation or vessel class whose fishery wassimilar to the one without data. Noestimates were made for the 1977Japanese and Korean longline in-
May /98/, 43(5)
cidental catches since observers didnot begin to sample on longlinevessels until the fall of that year.
Pacific halibut
Although Pacific halibut have longbeen taken in the traditional setlinefishery in the eastern Bering Sea andnortheastern Pacific Ocean by U.S.and Canadian fishermen, they arealso taken during trawling directed atgroundfish species other than halibutand in foreign longline fisheries forPacific cod and sablefish. The incidental catch of Pacific halibut byforeign trawlers in the Gulf of Alaskafor 1%2-74 was described by Hoagand French (1976) and estimated torange from around 208,000 to1,200,000 fish annually or from about1,300 to 9, lOOt. The estimatedhalibut catch given in that paper,however, included 11 ,000-82,000 fishtaken in the Aleutian Islands area.
During 1975-76, the United Statesfirst placed observers on Japanese andSoviet vessels fishing in the Gulf ofAlaska, and data were collected onthe incidence of halibut in the landings. The number of observers placedon foreign vessels was low (about twoor three per quarter) and coveragewas limited to only a few vessels.Because of lack of data for allarea/month blocks (there were a possible 60 data cells-5 areas times 12months), the average incidence datathat were available for thearea/blocks and for Japanese andU.S.S.R. vessels were combined. Inall, data were available for 23area/month blocks in 1975 and 27 in1976. The average annual incidencerate for halibut was 2.498 fish permetric ton of catch in 1975 and 1.594fish in 1976. Average weights ofhalibut for the 2 years were 8.36 kgand 9.74 kg, respectively. These ratesand average weights were applied tothe foreign catch to produce anestimated incidental catch of 486,697halibut (4,069 t) in 1975 and 312,382halibut (3,043 t) in 1976. Theseestimated incidental catches byforeign trawlers were within the rangeof catches as reported for earlieryears.
During 1977-78, following implementation of FCMA, observercoverage was greatly increased overthat of former years and data wereavailable from a greater number ofarea/month blocks than previously.The annual summary of the incidenceof halibut by area for the 2 years isshown in Table 6. The average incidence combined for areas and nations (excluding Japanese longlinevessels) was 0.908 in 1977 and 1.476 in1978, rates somewhat reduced fromthose obtained in 1975 and 1976. Inboth 1977 and 1978 at least somehalibut were observed in trawl catchesin each area and each month in whichsampling occurred. In 1977 theaverage incidence of halibut in catchesof the small trawlers (1.324 fish/t ofcatch) was greater than that of thelarge stern trawlers (0.800 fish/t) andthe average incidence of halibut for allJapanese vessels (1.035), excludinglongline vessels, was similar to that onSoviet vessels (0.933). In 1978 theaverage incidence rate of the smalltrawlers was similar to that of thelarge trawlers and the incidence rateon Soviet and Korean vessels wasgenerally similar to that of theJapanese trawlers. The overallaverage incidence of halibut in trawlcatches varied by area but there appeared to be no definitive pattern.The largest incidence occurred in theShumagin area.
The incidence rate of halibut onJapanese longline vessels varied considerably between 1977 and 1978.This difference was related to depthof fishing. In 1977 the vessel carryingobservers targeted on sablefish andfished at depths of over 600 m wherethe incidence of halibut was low,ranging from 0 to O.oI8 fishlt. In1978 the longline vessels oftentargeted on Pacific cod at depthsranging from 100 to 300 m where theincidence of halibut was generallyhigher than when vessels targeted onsablefish. When fishing in shallowwaters the incidence of halibut wasabout 1.400 to 2.700 fish/t in theShumagin and Chirikof areas, respectively. When fishing deep waters inthose areas, the incidence of halibut
27

n.,....Il!'r.:T'T""T"T""!'.,..I"'"T".,..,r"T"'-------,.------,....-----.,...-, GO·N
Table B.-Average annual Incidence (number per metnc ton 01 catch) and average weight (kg) of Pacific halibut In fo",lgntrawl and longline catches, by a"'as and vessel class in the Gull ot Alaska, 1977·78. (U.S. observer data.)
Shumagin Chirikof Kodiak Yakutat Southeastern
Nation and Avg. Avg. Avg. Avg Avg. AV9· Avg. Avg. Avg. Avg.vessel class incidence wI. incidence wf incidence wI. incidence wI. incidence wI.
1977Japan
Small freezertrawlers 0.934 5.35 1.288 10.28 0.890 19.82 0.616 8.97
Large freezertrawlers 0.401 8.02 0.814 6.45 1.363 10.73 1.558 9.60
Longline vessels 0 0 0.018 7.40 0U.S.S.R.
Large freezertrawlers 0.144 16.38 0.525 12.42 1.063 11.68
1978Japan
Small freezertrawlers 3.548 390 2.131 3.70 1.017 9.30 3.157 10.57
Large freezertrawlers 5.099 4.29 1.934 338 0.676 9.96 2880 8.78 0970 8.76
Large surimitrawlers 1.320 6.52 0.417 5.35 0.329 6.51
Longline vessels 1.261 3.69 2.269 3.74 0.146 338 0.125 10.12U.S.S.R.
Large freezertrawlers 10.944 4.06 0672 1.88 0185 8.40
KoreaLarge freezertrawlers 3.185 248 2.522 3.65
'Small freezer trawlers were classified as under 1,500 gross tons and large freezer and surimi trawlers were over 1,500gross tons. Large freezer trawlers processed the catch by dressing and freezing it, whereas large surimi trawlers targetedon pollock from which surimi, a fish cake. was produced.
Figure 8.-Average incidence of Pacific halibut (number per metric ton ofcatch) by 10 long. and \/2 0 lat. areas in the Gulf of Alaska. Observer data forstern trawlers of all nations and 1977-78 were combined.
1977-78 combined is shown in Figure8. The areas of largest incidence ofhalibut (over five fish/t of catch) occurred in various places from thenortheastern Gulf of Alaska to long.17()"W. Halibut were taken in varyingquantities in most of the Gulf ofAlaska from long. 134oW to 170oW.
As was mentioned earlier, theestimated incidental catch of halibutby foreign fishing vessels was determined by multiplying average incidence rates for each month/area bythe appropriate estimated catch. In1977, because of relatively low sampling effort by observers, the averageincidence rates were combined byvessel class for each area, andseparate incidence rates for winter(December-May) and summer (JuneNovember) were applied to therespective foreign catch. It wasobserved that the incidence of halibutwas greater during the winter thanduring the summer months. Toestimate the incidental catch ofhalibut by Korean and Polish vessels,for which observer data were notavailable, we used the average incidence rates obtained from Japaneseand Soviet vessels. In 1978, when better coverage Of vessels was obtainedthan in 1977, the estimated incidentalcatch of halibut was determined byapplying the average incidence ofhalibut for each month/area to theappropriate catch. For missing datafor any month/area, the average annual incidence rate for that area wasapplied. Incidence data from Soviettrawlers and Japanese longline vesselswere used to estimate catches byPolish trawlers and Korean longlinevessels, respectively, for whichobserver data were not available.
The total estimated incidental catchof halibut (Table 7) was about413,000 fish (2,205 t) in 1977 and293,000 fish (1,289 t) in 1978. Thesetotals were not greatly different fromthose of previous years. In both yearsthe greatest number of fish were takenin the western areas-Kodiak,Chirikof, and Shumagin-althoughthe total for the Kodiak area in 1978was reduced because of the reducedfishing effort and groundfish catch inthat area by the Soviets. In 1977,
GO·
HALIBUT
;
0/1<lit
::::;:: 1 - 51t
> 51t
~~;.'/I: li 55·
-6)
.'\)j
50·1400 1300
Southeastern-compared with thefish in the western areas. The overallaverage weight of halibut (weightedby the estimated number of fishcaught) was 5.3 kg in 1977 and 4.8 kgin 1978.
The incidence of halibut by smallstatistical areas (l a long. by V2 0 lar.)for nations, all stern trawlers, and
J-+-H-+-++-H--+''rtp'~ (I
'1"' i'-J
AV
:.:.....:.:.::;:;
H-r+-t-++-+-t---B ,
was from 0.400 to 0.500 fish/t. Theincidence of halibut on longlinevessels in the Kodiak and Yakutatareas was somewhat less than in theareas to the west.
The average weight of the incidentally caught halibut varied by area butgenerally the fish were larger in theeastern areas-Kodiak, Yakutat, and
28 Marine Fisheries Review

Nation and Avg. Avg. Avg. Avg. Avg. Avg. Avg. Avg. Avg. Avg.vessel class incidence wt. incidence wt. incidence wt. incidence wt. incidence WI.
Table 7.-Estlmated Incidental catches of halibut (In numbers of fish and melric tons) by foreign groundflshvessels In the Gulf of Alaska, 1977·78. (Based on U.S. observer dala.)
Table 8.-Average annual incidence (number per metric ton at calch) and average weight (kg) of salmon in foreign trawland longline catches by areas and vessel class in the Gulf of Alaska, 1977·78. (U.S. observer data.)
1977Japan
Small Ireezertrawlers 0.032 2.2 0.020 0.3 0.021 3.2 0.049 2.4 0.068 2.6
Large freezertrawlers 0.002 4.2 0.017 4.1 0.228 2.7 0.043 2.7
Longline vessels 0 0 0 0U.S.SR.
Large freezertrawlers 0.001 12.2 0.013 3.9 0.148 3.9
area, that nation took a larger part ofthe total catch than the other nations.Pacific salmon
In the Gulf of Alaska salmonfishing areas, Pacific salmon aretraditionally caught with gill nets,purse seines, trolling gear, and a fewremaining fish traps in certain areasof southeastern Alaska. The catch ofsalmon by trawls is strictly an incidental catch to targets of groundfishspecies, but at various times andplaces fair numbers of salmon mayappear in trawl catches (French et al.,1981). By placing observers on theforeign fishing vessels, NMFS wasable to determine incidence rates ofPacific salmon and to estimate thetotal incidental catch of the species.
The average annual incidence ratesof salmon determined for 1977-78 byarea and vessel class are shown inTable 8. Salmon were taken incidentally in most of the areas fished withthe incidence varying from 0 to about0.023 fish/t of catch in 1977 and fromo to 0.421 fish/t in 1978. The incidence of salmon on Japanese vesselswas generally similar among vesselclasses in 1977, and there was no appreciable difference between incidence rates on Japanese and Soviettrawlers. Where data were availablefor comparison, the incidence ofsalmon was also generally similaramong areas. No salmon wereobserved on longline gear in 1977.
In 1978 the incidence of salmonvaried by nation and vessel class, withthe highest average incidence occurring on Korean vessels in theShumagin area. The incidence onJapanese small trawlers was generallysimilar to that of Japan's largetrawlers, with some variation occurring between areas. The highest incidence rates occurred on Korean andJapanese large trawlers (freezer andsurimi trawlers combined) duringNovember and February. The catchof salmon on Japanese longlinevessels was infrequent and occurredonly during summer months.
The overall incidence rate ofsalmon by area, nation, and vesselclass (excluding longline vessels) combined was 0.059 fish/t in 1977 and
Totals
No.
Southeastern
6 27.406 328
783 11
234 2---
T 67,311 179
37,921 211
T 124,693 465470 2
46 293,374 1,259
45 58,475 336
1 25,871 23518,320 70
T' 182,074 778
125 413,009 2,200
119 164,825 877
No.
5,165
Southeastern
Yakutat
Yakutat
NO.
Kodiak
because of a large incidence of halibuton Korean vessels in the Shumagin
Kodiak
No.
16,258 158 18,902 201
Chirikof
Chirikof
No
Shumagin
Shumagin
No.
180,180 6B8 72,889 197Total
Japan took the majority of the incidental halibut catch, but in 1978,
'T = trace: Less than 0.5 fish or less than 0.5 t.
1977Japan
Large surimiand freezertrawlers 73,543 332 48,609 161 18,347 142 10,165 123 14,161
Small freezertrawlers 5,093 23 1,250 5 11,027 100 9,396 194 640
U.S.S.R.Large freezer
trawlers 3,247 42 27,375 131 147,914 596 3,507 9 31South Korea
Large freezertrawlers 34,534 198 3,387 13
PolandLarge freezer
trawlers 783 11
1978Japan
Small freezertrawlers 0.183 2.6 0.068 3.4 0.100 2.9 0.052 4.2
Large freezertrawlers 0.252 3.1 0.178 3.1 0.029 2.5 0.003 2.1 0.024 3.9
Large surimitrawlers 0 0.020 4.9 0.091 3.0
Longline vessels 0.002 2.6 0.060 1.8 0 0.009 0.3U.S.S.R.
Large freezertrawlers 0.166 3.6 0.089 2.4 0.200 2.1
KoreaLarge freezer
trawlers 0.421 3.0 0.006 3.4
Nation andvessel class
Total 116,417 595 80,621 310 178,071 849 23,068 326 14,8321978Japan
Large surimiand freezertrawlers 23,446 95 14,090 61 8,362 85 5,480 51 5,097
Small freezertrawlers 6,866 28 996 4 5,141 58 12,811 145 57
Longliners 5,683 20 10,379 38 1,667 6 591 5US.S.R.
Large freezertrawlers 21,405 87 45,075 85 803 20 T 8
South KoreaLarge freezer
trawlers 122,480 457 2.210 8Longliners 280 1 139 1 T T
PolandLarge freezer
trawlers 234
May 1981, 43(5) 29

Figure 9.-Average incidence of salmon (number per metric ton of catch) by 1°long. and !/z 0 lat. areas in the Gulf of Alaska. Observer data for stern trawlersof all nations and 1977-78 were combined.
Table 9.-Esllmated incidental catches 01 salmon On numbers of fish and metric tons) by loreign groundllsh vessels Inthe Gull 01 Alaska. 1977·78. (Based on U.S. observer data.)
Shumagin Chiriko! Kodiak Yakutat Southeastern TotalsNation and
vessel class No. No. No. No. No. No.
1977Japan1
Large surimiand freezertrawlers 740 2.87 14 004 250 0.97 294 0.78 234 0.63 1,532 5.29
Small freezertrawlers 107 0.41 T' 123 0.48 277 0.74 10 0.03 518 1.66
U.S.S.R.Large freezer
trawlers 15 006 144 0.42 2,748 10.69 36 0.10 2,943 11.27South KoreaLarge freezer
trawlers 209 0.81 7 0.02 216 0.83PolandLarge freezer
trawlers 63 0.25 63 0.25
Total 1.071 4.15 166 0.48 3,184 12.39 607 1.62 244 0.66 5,272 19.30
1978Japan
Large surimiand freezer!rawlers 955 3.01 1,291 4.13 725 1.98 6 0.01 127 0.50 3,104 9.63
Small freezertrawlers 319 0.85 30 0.10 471 1.34 295 1.21 T 1,116 3.50
Longliners 4 0.01 225 0.41 20 T 249 0.42U.S.S.R.
Large freezertrawlers 325 1.18 6,538 15.14 869 1.79 T T T T 7,732 18.11
South KoreaLarge freezer
trawlers 33,139 99.06 5 0.02 T T 33,144 99.08Longllners 1 T 4 0.01 a T T 5 0.01
PolandLarge freezer
trawlers 253 0.52
----Total 34,743 104.11 8,093 1981 2,318 5.63 321 1.22 128 0.50 45,603 131.27
,T = trace: Less than 0.5 fish or less than 0.005 t.
5,300 salmon estimated for 1977. the U.S.S.R. in 1978, about 12,000Aside from the Korean catch, the fish, is over twice that estimated forestimated salmon catch by Japan and those two countries in 1977. The main
Marine Fisheries Review
0.133 fish/t in 1978. Average weightsof the salmon were 3.38 kg and 2.90kg, respectively, for the 2 years.
The incidence of salmon by smallstatistical areas, 1° long. by Vz ° lat.,for nations and years combined isshown in Figure 9. Areas of thelargest catches tended to be in thewestern half of the Gulf of Alaska,west of long. 148 OW. The incidence inthe eastern part of the Gulf of Alaskawas generally less than in the westernGulf. The area of highest incidence ofsalmon was centered around theShumagin Islands, long. 160° to161°W and lat. 54° to 55°N.
In 1977 the incidental salmonobserved consisted of 91 percentchinook salmon, Oncorhynchustshawytscha, and 9 percent chumsalmon, O. keta, averaging 4.3 and3.9 kg, respectively. All five species ofPacific salmon occurred in the incidental catches in 1978, but chinooksalmon greatly predominated, 93 percent, as they did in 1977. Otherspecies made up 1-2 percent of thecatch. The size of the chinook salmon(ranging from about 2 to 12 kg) indicated that the catch was probablymade up of maturing and immaturefish-those that would have returnedto spawn in the year of capture andthose that would have remained at seafor I or more years.
Table 9 indicates a total estimatedcatch of 5,272 salmon (19.3 t) in 1977and 45,603 salmon (13I.3 t) in 1978.The largest catches of salmon in 1977were in the Kodiak and Shumaginareas, and Soviet trawlers took about56 percent of the catch. In 1978 thelargest catch by far was made byKorean stern trawlers in theShumagin area. The high catchresulted from a relatively high incidence rate in October andNovember at a time when theestimated total groundfish catch wassubstantial-over 21,000 t. Thus, ofthe total salmon catch, about 32,000fish (71 percent) were accounted forby Korean trawlers in the Shumaginarea during October and November.Primarily because of the very largecatch attributed to Korea, the total ofabout 45,000 salmon in 1978 wasabout 8 times the total of around
30
o :~~.
o 0
'-1-
---I-;'
SALMON
Q~~~/~5/tI>O.51t
60·
1'\11
50·

Table 10.-lncidence (number per metric ton 01 catch) and average weight (kg) of king crab taken by the lorelgn ground·fish Iisherv In the Gull 01 Alaska. 1978. (U.S. observer data.)
Table 11.-Estlmated Incidental catches of king crab (In numbers of crab and metric tons) by foreign groundlish vesselsIn the Gulf of Alaska. 1978. (Based on U.S. observer data.)
Shumagin Chirikof Kodiak Yakutat Southeastern
Nation and Avg. Avg. Avg. Avg. Avg. Avg. Avg. Avg. Avg. Avg.vessel class incidence wI. incidence wI. incidence wI. incidence wI. incidence wI.
JapanSmall trawlers 0,019 188 0 0.004 2.10 0.099 1.19Large freezer and
surimi trawlers 0.066 2.31 0 0.004 2.69 0.034 1.40 0Longline vessels 0.531 1.01 0.030 1.21 0.196 0.87 0.265 0.72
V.S.S.A.Large freezer
trawlers 0 0 0
Republic of KoreaLarge freezertrawlers 10.081 1.42 0
Nation andShumagin Chirikof Kodiak Yakutat Southeastern Totals
vessel class No. No. No. No. No. No. I
JapanLarge surimi
and freezertrawlers 463 1.07 0 44 0.11 72 0.10 0 579 1.28
Small Ireezertrawlers 36 0.07 0 55 0.11 678 0.73 0 769 0.91
Longlinevessels 1.518 1.36 139 0.16 648 0.53 923 0.67 0 3.228 2.74
V.S.S.A.Large freezer
trawlers 0 0 0 T' 0 TSoulh Korea
Large freezertrawlers 89.19313029 0 89,193 130.29
Longline vessels 34 0.03 2 T 69 006 T 106 0.09Poland
Large freezertrawlers 0
---- ----Total 91,244 132.84 141 016 816 0.81 1,674 1.50 0 0 93,875 135.31
relatively low observer coverage andbecause the data available indicated arelatively low incidence. Observers inthe Gulf of Alaska in 1977 counted589 snow crab in a sample weight of4,850 t of groundfish; of those, 420 or71 percent were observed on smallJapanese trawlers in the Yakutat areawhere the annual incidence rate was1.58 crab/t.
Data on the incidence of snow crabobtained by observers were summarized for 1978 to illustrate the sizeof the incidental catch and indicatewhere most of them were taken. Fromthe annual incidence data in Table 12,the highest rates have occurred onJapanese longline vessels (2.9 crab/t)and small trawlers (1.3 crab/t) in theYakutat area.
The total estimated incidental takeof snow crab in 1978 was about24,000 (14 t) (Table 13). These were
total catch.The incidental king crab taken by
Korean trawlers differed markedly inspecies composition from those takenby Japanese vessels. Observer data indicate that red king crab, Paralithodescamtschatica, made up 100 percent ofthe king crab caught by Korean ships.The Japanese catch of king crab wascomposed of 62 percent golden,Lithodes aequispina, 37 percent red,and 1 percent blue king crab,Paralithodes platypus. The overallspecies composition was 97 percentred king crab, 3 percent golden, and atrace of blue king crab.
Snow crab
In the Gulf of Alaska, snow crabusually form only a small incidentalcatch for foreign trawlers targeting ongroundfish. No catch estimates ofsnow crab were made for 1977 due to
'T ; Irace: Less Ihan 0.5 crab or less than 0.005 I.
reason for the increase was thegenerally increased incidence ratesobserved in 1978 compared with 1977.
King crab
No catch estimates of king crabwere made for 1977 due to relativelylow observer coverage and becausethe data available indicated a very lowincidence. Observers in the Gulf ofAlaska in 1977 recorded a total of 96king crab found in 4,850 t of groundfish.
In 1978, observers sampled onKorean vessels fishing in the Gulf ofAlaska for the first time, and therewas greater overall observer coverageof the various foreign fleets and vesselclasses. The incidence of king crab onKorean trawlers in the Shumagin areain the summer of 1978 proved to beunusually high, and the annualaverage for the region was around 10crab (average of 1.4 kg) per metric tonof catch (Table 10). This incidencerate was much larger than noted fortrawlers of other nations in the samearea. Examination of the incidencerates by 1° long. by Yz ° lat. areas indicated that the highest king crab incidence rates for the Korean vesselsoccurred just south of UnalaskaIsland in the eastern Aleutian IslandsOat. 52°30' to 53°30'N by long. 166°to 168°W).
Also observed in 1978 was theaverage incidence of about 0.5 kingcrab per metric ton of catch byJapanese longline vessels. Presumablythe crab grab the bait and become entangled with the hooks as they arehauled. Normally they are easilydislodged from the hooks as the gearreaches the vessel and are allowed todrop back into the water relativelyunharmed.
Table 11 gives the total estimatedincidental take of king crab for 1978as about 94,000 crab, of which 89,000or 95 percent were caught by Koreantrawlers. Approximately 3,200 kingcrab were taken incidentally byJapanese longline vessels. By area, thelargest catches came from theShumagin area which produced 97percent of the total landed. Again,this was due primarily to the high incidence rates on the observed Koreantrawlers which were used to estimate
May /98/, 43(5) 3/

Table 13.-Estimated incidental catches of snow crab (in numbers of crab and metric tons) by foreign groundfish vesselsin the Gulf of Alaska, 1978. (Based on U.S. observer data.)
Table 12.-lncldence (number per metric ton of catch) and average weight (kg) of snow crab taken by the loreign ground·fish fishery in the Gull 01 Alaska, 1978. (U.S. observer data.)
Shumagin Chlrlkof Kodiak Yakutat Southeastern
Nation and Avg. Avg. Avg. Avg. Avg.vessel class Incidence wI. Incidence wI. Incidence wI. Incidence wt. Incidence wI.
JapanSmall trawlers 0 0 0.064 0.40 1.297 0.49Large freezer and
surimi trawlers 0 0.002 0.07 0.002 057 0.007 0.60 0Longline vessels 0.052 0.99 0.058 0.93 0.209 0.18 2.890 0.79
U.S.S.R.Large freezer
trawlers 0 0 0Republic of Korea
Large freezertrawlers 0.275 0.45 0
Shumagin
Nation and
vessel class No.
Chirikof
No.
Kodiak
No.
Yakutat
No.
Southeastern
No.
Totals
No.
catches. In cases in which no speciescomposition data were available for aparticular data cell, a substitution wasmade with the species compositionfrom another nation, area, or vesselclass which was judged to best reflectthe expected catch composition. Asnations which did not receive a 1977rockfish or flatfish allocation did notreport catches of those species groups,it was not possible to make corresponding catch estimates by species.The 1977 estimates also do not include the catch by species of rockfishor flatfish on Japanese longlinevessels because of lack of observerspecies composition data on thatvessel class.
14 T' 29 0.02 15 0.01 0 58 0.03
0 308 0.15 7,506 3.88 0 7,814 4.03
0.79 238 0.22 580 0.44 7,656 5.69 9,241 7.14
0 0 T T 0 T T
2.88 0 0 6,757 2.88
0.01 T 73 0.06 10 0.01 99 0.08
taken primarily by Japanese longlinevessels, small Japanese trawlers, andlarge freezer trawlers from Korea.Over half of the incidental catch (63percent) was taken in the Yakutatarea and most of the remainder in theShumagin area. Two species of snowcrab were represented in the catches:Chionoecetes bairdi composedrougWy 65 percent of the total snowcrab catch and C. opilio made up theremaining 35 percent.
Species Composition and EstimatedCatch of RockfISh and Flatfish
Foreign nations were required bythe United States under FCMAregulations to report the catch ofPacific ocean perch separately but tocombine the catch data for all otherrockfish. Similarly, in the Gulf of
'T = trace: Less than 0.5 crab or less than 0.005 I.
JapanLarge surimiand freezertrawlers a
Small freezertrawlers 0
Longlinevessels 767
U.S.S.R.Large freezer
trawlers 0South Korea
Large freezerIrawlers 6,757
Longlinevessels 12
PolandLarge freezer
trawlers
Rockfish catches
The total estimated rockfish catchby species is given in Table 14. In1977, approximately 23,600 t ofrockfish were estimated to have beentaken by foreign fishing vessels in theGulf of Alaska and in 1978 onlyabout 10,000 t, or 43 percent of the1977 tonnage. Thirty different speciesof Sebastes and Sebastolobus wereidentified by observers as appearing inforeign catches in those years, butbecause ready recognition of rockfishcomes only with long study, errors inidentification may have occurred.
Pacific ocean perch was thepredominant rockfish species, makingup 61.9 percent of the total rockfishlandings in 1977 and 81.2 percent in1978. This species also made up thegreatest percentage of the rockfishcatch taken by trawlers of all nationsand vessel classes, but shortspinethornyhead, Sebastolobus alascanus,predominated in the 1978 incidentalrockfish catch taken by Japaneselongline vessels targeting on Pacificcod or sablefish.
Japanese small and large freezertrawlers frequently target on rockfishin the Gulf of Alaska and land thegreatest portion of the total rockfishcatch. For each of the 12 rockfishspecies most commonly taken onthose vessels, Table 15 gives thepercentage of weight of the catch ofthat species that was taken at each offive depth intervals. One species, the
o 23,969 14.16o0.67 15,187 9.59
Alaska, statistic~ on all foreign-caughtflatfish species were grouped as"flounders." Observers, however,during sampling for the species composition of the catch, identified andreported on the catch of the individualrockfish and flatfish species.
Estimates of the 1977-78 rockfishand flatfish catches by species weremade by applying the annual speciescomposition (percentage of catch byweight) computed from U.S. observerdata and stratified by nation, vesselclass, and area to the correspondingtotal catches of rockfish and flatfish.The 1977 observer data were extrapolated to the foreign reportedcatches of rockfish and flatfish,whereas the 1978 species compositiondata were applied to the U.S.estimates of the rockfish and flatfish
o
990256 0.227,538 3.68Total
32 Marine Fisheries Review
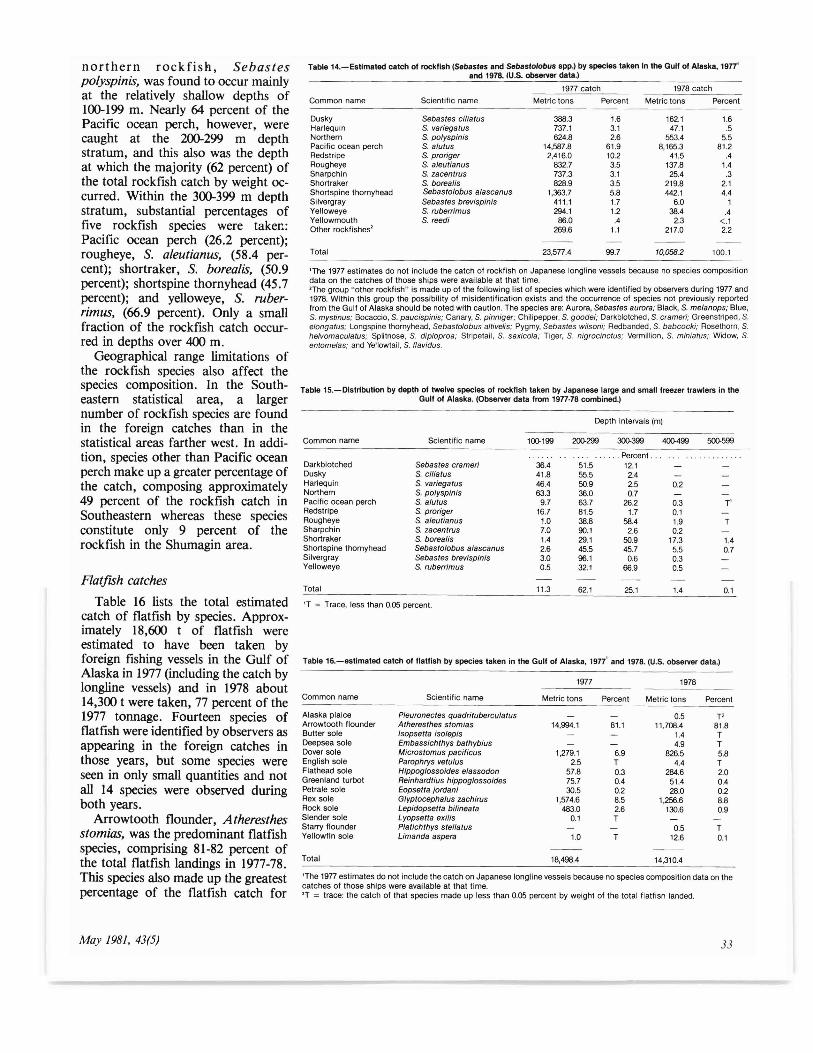
northern rockfish, Sebastespolyspinis, was found to occur mainlyat the relatively shallow depths of100-199 m. Nearly 64 percent of thePacific ocean perch, however, werecaught at the 200-299 m depthstratum, and this also was the depthat which the majority (62 percent) ofthe total rockfish catch by weight occurred. Within the 300-399 m depthstratum, substantial percentages offive rockfish species were taker.:Pacific ocean perch (26.2 percent);rougheye, S. aleutianus, (58.4 percent); shortraker, S. borealis, (50.9percent); shortspine thornyhead (45.7percent); and yelloweye, S. ruberrimus, (66.9 percent). Only a smallfraction of the rockfish catch occurred in depths over 400 m.
Geographical range limitations ofthe rockfish species also affect thespecies composition. In the Southeastern statistical area, a largernumber of rockfish species are foundin the foreign catches than in thestatistical areas farther west. In addition, species other than Pacific oceanperch make up a greater percentage ofthe catch, composing approximately49 percent of the rockfish catch inSoutheastern whereas these speciesconstitute only 9 percent of therockfish in the Shumagin area.
Flatfish catches
Table 16 lists the total estimatedcatch of flatfish by species. Approximately 18,600 t of flatfish wereestimated to have been taken byforeign fishing vessels in the Gulf ofAlaska in 1977 (including the catch bylongline vessels) and in 1978 about14,300 t were taken, 77 percent of the1977 tonnage. Fourteen species offlatfish were identified by observers asappearing in the foreign catches inthose years, but some species wereseen in only small quantities and notall 14 species were observed duringboth years.
Arrowtooth flounder, Atheresthesstomias, was the predominant flatfishspecies, comprising 81-82 percent ofthe total flatfish landings in 1977-78.This species also made up the greatestpercentage of the flatfish catch for
May 1981, 43(5)
Table 14.-Estlmated catch of rockfish (Sabaslas and Sabaslolobus spp.) by species takan In the Gulf of Aleska, 19IT'and 1978. (U.S. observer data.)
1977 catch 1978 catch
Common name Scientific name Metric tons Percent Metric tons Percent
Dusky Sebastes ciliatus 388.3 1.6 162.1 1.6Harlequin S. variegatus 737.1 31 47.1 .5Northern S. polyspinis 624.8 2.6 553.4 5.5Pacific ocean perch S. alutus 14,587.8 61.9 8,165.3 81.2Redstripe S. proriger 2,416.0 10.2 41.5 .4Rougheye S. a/eutianus 832.7 3.5 137.8 1.4Sharpchin S. zacentrus 737.3 3.1 25.4 .3Shortraker S. borealis 828.9 3.5 219.8 2.1Shortspine thornyhead Sebasto/obus alascanus 1,383.7 5.8 442.1 4.4Silvergray Sebasfes brevispinis 411.1 1.7 6.0 1Yelloweye S. (uberrimus 294.1 1.2 38.4 .4Yellowmouth S. reedi 86.0 .4 2.3 <.1Other rockfishes' 269.6 1.1 217.0 2.2
Total 23,577.4 99.7 to,058.2 100.1
'The 1977 estimates do not include the catch of rockfish on Japanese longline vessels because no species compositiondata on the catches of those ships were available at that time.'The group "other rockfish" is made up of the following list of species which were identified by observers during 1977 and1978. Within this group the possibility of misidentification exists and the occurrence of species not previously reportedfrom the Gulf of Alaska should be noted with caution. The species are: Aurora, Sebastes aurora; Black, S. melanops; Blue,S. mystinus; Bocaccio, S. paucispinis; Canary, S. pinniger; Chili pepper, S. goodei; Darkblotched, S. crameri; Greenstriped, S.elongatus; Longspine thornyhead, Sebast%bus allivelis; Pygmy, Sebastes wilsoni; Redbanded, S. babcocki; Rosethorn, S.helvomaculatus; Splitnose, S. diploproa; Stripetail, S. saxicola; Tiger, S. nigrocinctus; Vermillion, S. miniatus; Widow, S.entome/as; and Yellowtail, S. f1avidus.
Table 15.-Distribution by depth of twelve species of rockfish taken by Japanese large and small freezer trawlers in theGulf of Alaska. (Observer data from 1977·78 combined.)
Depth intervals (m)
Common name SCientific name 1()(}199 200-299 300-399 400-499 500-599
.. Percent.Darkblotched Sebastes cramer; 38.4 51.5 12.1Dusky S. ciliatus 41.8 55.5 2.4Harlequin S. variegatus 46.4 50.9 2.5 0.2Northern S. po/yspinis 83.3 38.0 0.7Pacific ocean perch S. alutus 9.7 83.7 26.2 0.3 T'Redstripe S. proriger 16.7 81.5 1.7 0.1Rougheye S. aleut/anus 1.0 38.8 58.4 1.9 TSharpchin S. zacentrus 7.0 90.1 2.6 0.2Shortraker S. borealis 1.4 29.1 5O.9 17.3 1.4Shortspine thornyhead Sebasto/obus alascanus 2.6 45.5 45.7 5.5 0.7Silvergray Sebastes brev;sp;nis 3.0 96.1 0.6 0.3Yelloweye S. ruberr;mus 0.5 32.1 86.9 0.5
Total 11.3 62.1 25.1 1.4 0.1
'T = Trace, less than 0.05 percent.
Table lB.-estimated catch of flatfish by species taken in the Gulf of Alaska, 1977' and 1978. (U.S. observer data.)
1977 1978
Common name Scientific name Metric tons Percent Metric tons Percent
Alaska plaice Pleuronectes quadriluberculatus 0.5 T'Arrowtooth flounder Atheresthes stomias 14,994.1 81.1 11,708.4 81.8Butter sale Isopsetta iso/epis 1.4 TDeepsea sole Embassichthys bathybius 4.9 TDover sole Microstomus pacllicus 1,279.1 6.9 826.5 5.8English sale Parophrys vetulus 2.5 T 4.4 TFlathead sole Hippoglossoides elassodon 57.8 0.3 284.6 2.0Greenland turbot Reinhardtius hippoglossoides 75.7 0.4 51.4 0.4Petrale sale Eopsetta ;ordani 30.5 0.2 28.0 0.2Rex sale G/yptocephalus zachirus 1,574.6 8.5 1,256.6 8.8Rock sole Lepidopsetta bilineata 483.0 2.6 130.6 O.gSlender sole Lyopsetta exilis 0.1 TStarry flounder Plalichthys stellatus 0.5 TYellowfin sale Limanda aspera 1.0 T 12.6 0.1
Total 18,498.4 14,310.4
'The 1977 estimates do not inciude the catch on Japanese long line vessels because no species composition data on thecatches of those ships were available at that time.'T = trace: the catch of that species made up less than 0.05 percent by weight of the total flatfish landed.
33

Table H.-Distribution by depth otlour species olllallish taken by Japanese trawlars In the Gull 01 Alaska. (Observerdata from 1977·78 combined.)
Arrowtooth flounderDover saleRex saleRock sale
Total
Atheresthes stomiasMicrostomus pacificusGlypfocephalus zach/rusLepidopsetta bilineata
Depth intervals (m)
0-99 100-199 200-299 300-399 400-499 500-599
Percent0.5 5.7 42.0 46.6 4.9 0.4
2.5 29.1 56.8 8.2 3.5T' 5.7 31.6 53.9 8.6 0.1
70.4 24.7 5.0
0.4 5.5 39.4 48.4 5.7 0.7
'T = Trace, <0.05 percent.
each vessel type in nearly every area,constituting 64-97 percent of the flatfish taken. The only exception occurred in the 1978 catches of Japanesesmall trawlers in the Chirikof area,where rex sole, Glyptocephaluszachirus, predominated and arrowtooth was second in percentage byweight.
Japanese vessels frequently targeton flatfish in the Gulf of Alaska, andconsequently land the greatest portionof the total flatfish catch. The fourmost commonly taken flatfish speciesin 1977-78 were arrowtooth flounder,Dover sole, Microstomus pacificus,rex sole, and rock sole, Lepidopsettabilineata. For each of those species,Table 17 gives the percentage byweight of the catch of that species thatwas taken at each of six depth intervals. Only one species, rock sole, wasfound to occur mainly at the relativelyshallow depths of 100-199 m. Approximately equal percentages of arrowtooth flounder were caught at the200-299 m and the 300-399 m depthstrata: the depths at which the majority (88.6 percent) of the arrowtoothflounder and the greatest portion ofthe overall flatfish catch occurred. Arelatively small fraction of the flatfishcatch occurred at depths over 400 m.
Summary
Foreign groundfish fisheries in theGulf of Alaska expanded rapidlyfrom the first exploratory expeditionsby the U.S.S.R. and Japan in 1960 toa peak catch in 1965 of nearly 400,000t. Since then, annual catches havefluctuated between 100,000 and200,000 t; the primary target species
34
of the fishery has changed fromPacific ocean perch to walleyepollock. The Republic of Korea,Poland, and the Republic of Taiwanlater joined the U.S.S.R. and Japanin harvesting the groundfish resourcesof the Gulf.
Concern expressed by U. S.fishermen and fishery managersabout the effect the foreign vesselsmight have on the fishery resources,especially the stocks of Pacifichalibut, led to agreements with Japanand the Soviet Union to permit alimited number of U.S. observersaboard some of the vessels to monitorthe catch. Data were collected on theincidental catch rates of Pacifichalibut, Pacific salmon, king crab,and snow crab as well as on speciescomposition of the catches andlength/age information of the commercially important groundfishspecies.
With the enactment of FCMA, theforeign fishery observer program wasgreatly expanded, and the data collected by observers on species composition were used to compile anongoing estimate of the foreigncatches by species throughout theseason. As the sampling effort was increased, the biological data collectedby the observers also became increasingly useful to fishery managers indetermining the status of the fisheryresources.
During 1977-78, 50 observerssampled on 61 foreign vessels, covering 8.3 percent of the foreign effort in1977 and 14.7 percent in 1978.Observer data were used in estimatinga total foreign groundfish catch ofnearly 200,000 t in 1977 and about
Marine Fisheries Review

a wealth of information was gatheredby U.S. observers on the foreignfishing vessels in the Gulf of Alaska.As long as the foreign fleets continueto take a large percentage of thegroundfish catch of this region, it isexpected that the observer programwill serve as an ongoing source ofdata useful in making fisheriesmanagement decisions.
May /98/, 43(5)
Literature Cited
Chitwood, P. E. 1969. Japanese, Soviet, andSouth Korean fisheries off Alaska. Development and history through 1966. U.S. FishWild\. Serv., Circ. 310, 34 p.
Forrester, C. R., A. J. Beardsley, and Y. Takahashi. 1978. Groundfish, shrimp, and herringfisheries in the Bering Sea and northeastPacific-historical catch statistics through1970. Int. North Pac. Fish. Comm., Bull. 37,147 p.
French, R., R. Nelson, Jr., and J. Wall. 1981.The foreign fisheries off Washington,
Oregon, and California, 1977-78. Mar. Fish.Rev. 43(5):36-44.
Hoag, S. H., and R. R. French. 1976. The incidental catch of halibut by foreign trawlers.Int. Pac. Halibut Comrn., Sci. Rep. 60, 24 p.
Miller, M., L. Nelson, R. French, and S. Hoag.1976. U.S. observers board Japanese trawlvessels in Bering Sea. Mar. Fish. Rev.38(4):1-10.
Nelson, R., Jr., R. French, and J. Wall. 1981.Sampling by U.S. observers on foreignfishing vessels in the eastern Bering Sea andAleutian Island region, 1977-78. Mar. Fish.Rev. 43(5): 1-19.
35


