
Page 1 of 62
Final Report of a 12 month Long Term Bat Monitoring Study
- For the proposed Noupoort Wind Energy Facility, Northern Cape.
Compiled by: Werner Marais
27 May 2013
Page 2 of 62
PREPARED FOR:
Mainstream Renewable Power South Africa Cape Town
by
CK 2009/057469/23
P.O. Box 6892
Weltevredenpark Gauteng
1715 +27 78 190 3316
www.animalia-consult.co.za
Ref: R-1212-49
Page 3 of 62
Terms of Reference
To study the habitat types and determine the species of bats that utilises the different parts of
the proposed wind energy site for a period of 12 months. Important roosts and geographical
features that have the potential to attract bats (for foraging and/or roosting) are to be verified.
Determination of bat activity by transecting it with a bat detector as well as using passive bat
detection systems is forming part of the methodology. The aim of the pre-construction survey
will be to identify potential high risk areas and or time periods within the envelope areas, and
direct mitigation as needed and if needed.
Appointment of Specialist (Animalia Zoological & Ecological Consultation CC)
Specialist Company: Animalia Zoological & Ecological Consultation CC
Fieldwork conducted by:
Werner Marais & Chantal Kruger
Report done by: Werner Marais
Overseen/reviewed by:
Werner Marias
Appointed by: Mainstream Renewable Power South Africa
For: 12 Month pre-construction bat activity monitoring
Independence:
Animalia Zoological & Ecological Consultation CC has no connection with the developer.
Animalia Zoological & Ecological Consultation CC is not a subsidiary, legally or financially of the
developer; remuneration for services by the developer in relation to this proposal is not linked
to approval by decision-making authorities responsible for permitting this proposal and the
consultancy has no interest in secondary or downstream developments as a result of the
authorisation of this project.
Applicable Legislation:
Legislation dealing with biodiversity applies to bats and includes the following:
NATIONAL ENVIRONMENTAL MANAGEMENT: BIODIVERSITY ACT, 2004 (ACT 10 OF 2004;
Especially sections 2, 56 & 97)
The act calls for the management and conservation of all biological diversity within South
Africa. Bats constitute an important component of South African biodiversity and therefore
all species receive attention additional to those listed as Threatened or Protected.

Page 4 of 62
1 Table of Contents 1 INTRODUCTION AND METHODOLOGY ................................................................................................. 8
1.1 First site visit and report ............................................................................................................... 9
1.2 Second site visit and report ........................................................................................................ 11
1.3 Third site visit and report ............................................................................................................ 12
1.4 Fourth site visit ............................................................................................................................ 13
1.5 Fifth site visit ............................................................................................................................... 14
1.6 Sixth site visit .............................................................................................................................. 15
1.7 Seventh site visit (supplementary) ............................................................................................. 15
2 RESULTS .............................................................................................................................................. 18
2.1 Assumptions and limitations ....................................................................................................... 18
2.2 Vegetation units and climate ...................................................................................................... 19
2.3 Literature based species probability of occurrence .................................................................... 22
2.4 Ecology of most applicable bat species recorded on site ........................................................... 24
2.5 Transects ..................................................................................................................................... 28
2.5.1 Second site visit ................................................................................................................... 28
2.5.2 Fourth site visit .................................................................................................................... 29
2.5.3 Sixth site visit ...................................................................................................................... 30
2.5.4 Composite transect map ..................................................................................................... 31
2.6 Sensitivity map ............................................................................................................................ 32
2.7 Passive data ................................................................................................................................. 36
2.7.1 Second report ...................................................................................................................... 36
2.7.2 Third report ......................................................................................................................... 39
2.7.3 Fourth report ...................................................................................................................... 42
3 PROPOSED MITIGATION MEASURES AND DETAILS ............................................................................ 56
3.1 Bat mortalities due to blade collisions and barotrauma during foraging ................................... 56
4 CONCLUSION ....................................................................................................................................... 58
5 REFERENCES ........................................................................................................................................ 60

Page 5 of 62
Figure 1: Overview of the study area (yellow boundary) and its proximity to the town of Noupoort (to
the west). Diamond shapes indicate one of the proposed turbine locality options. ................................... 7
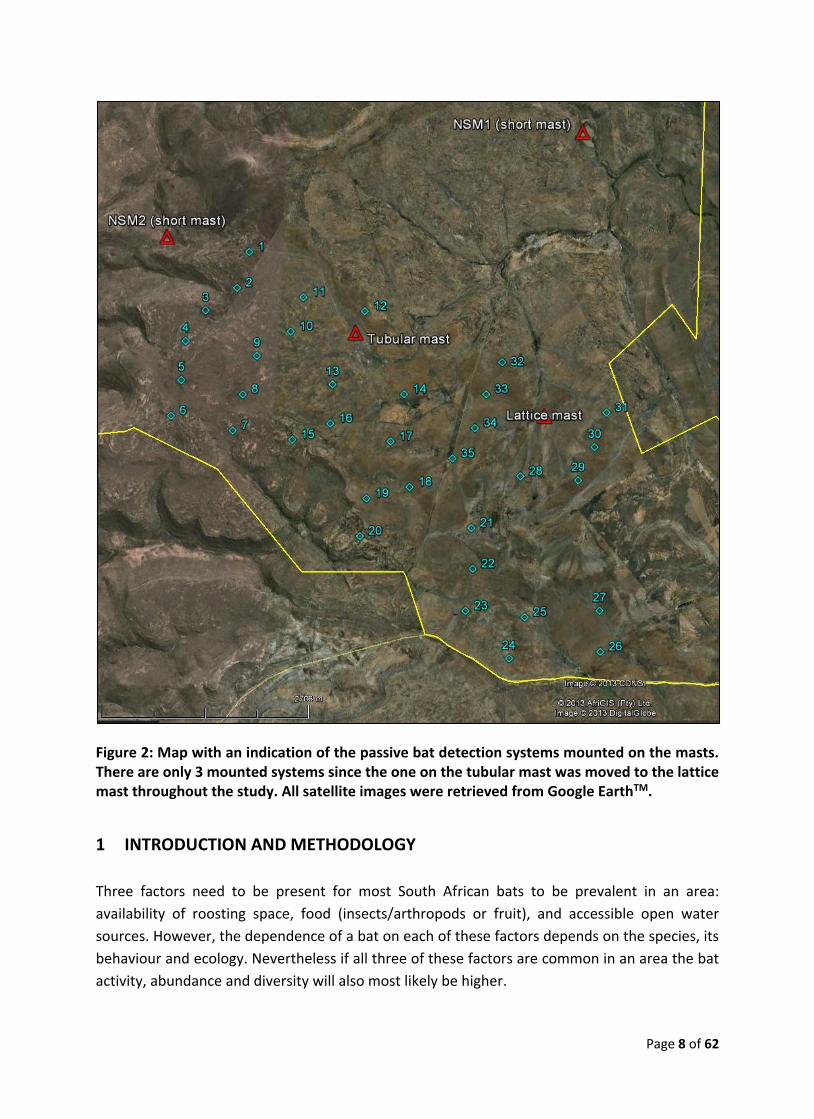
Figure 2: Map with an indication of the passive bat detection systems mounted on the masts. There are
only 3 mounted systems since the one on the tubular mast was moved to the lattice mast throughout
the study. All satellite images were retrieved from Google EarthTM. ........................................................... 8
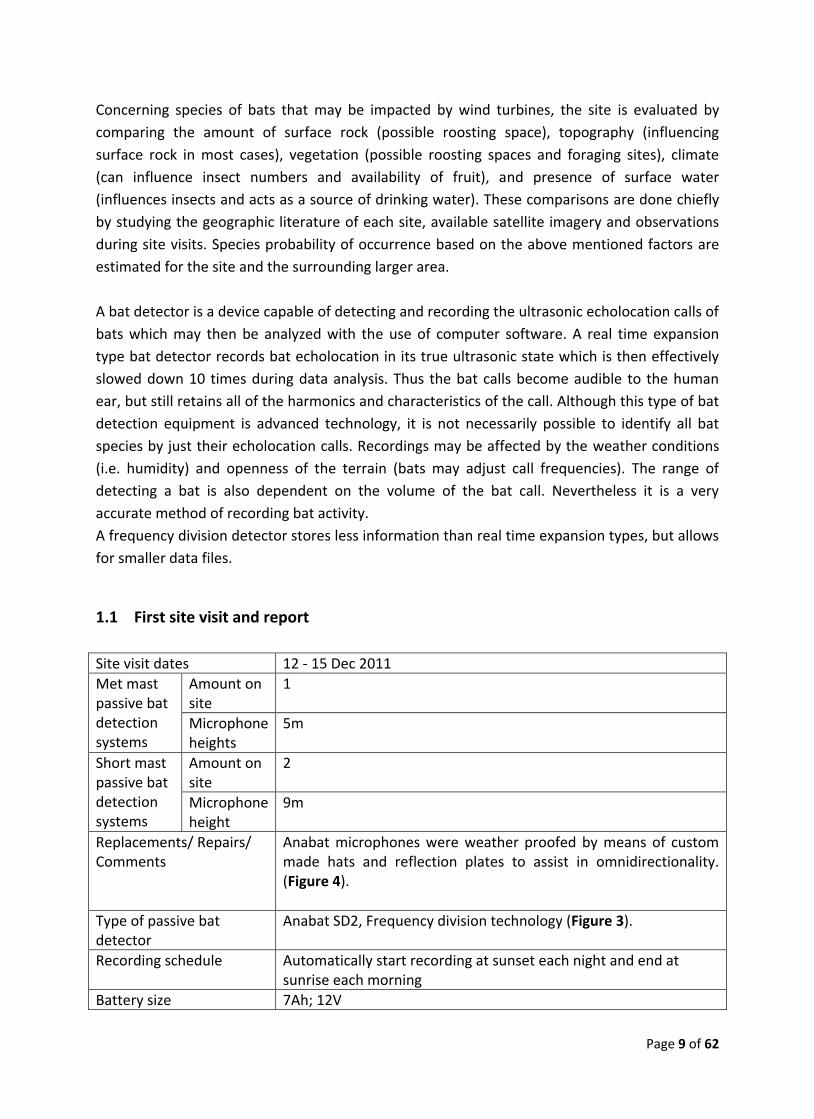
Figure 3: Anabat SD2 frequency division detector. .................................................................................... 10
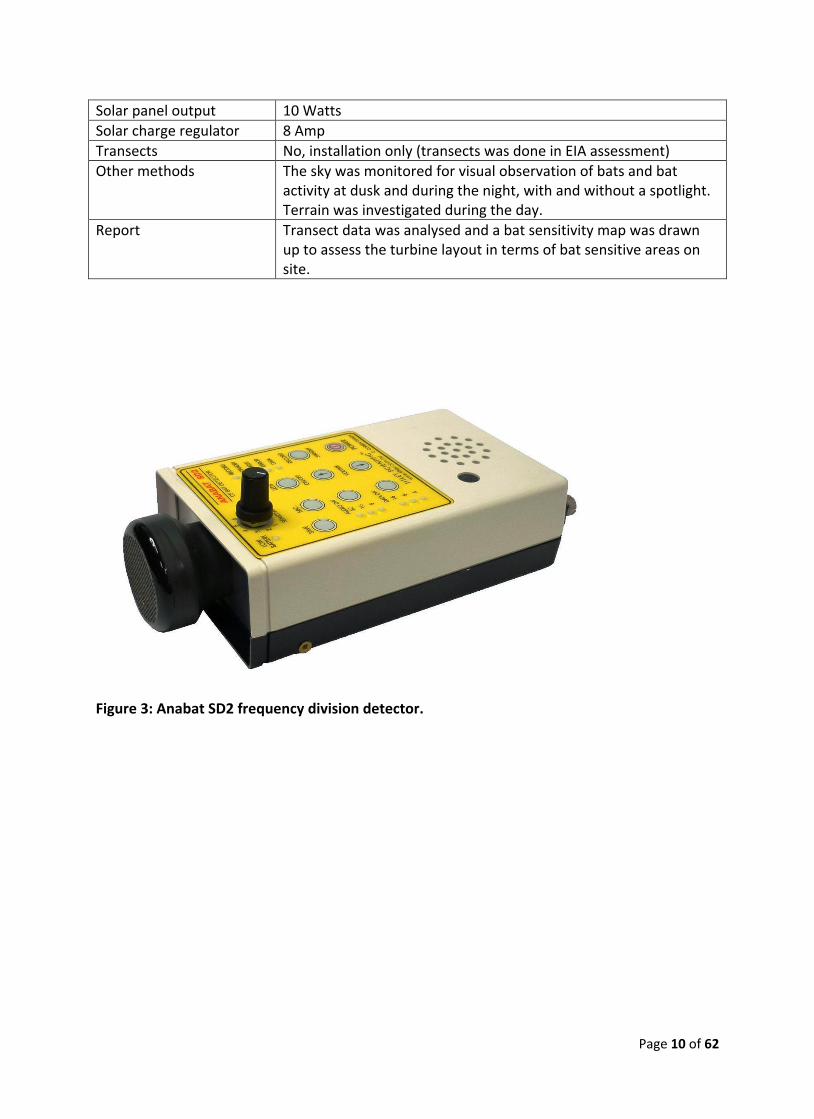
Figure 4: White weather box (with Anabat detector inside) and solar panel mounted on tubular mast. . 11
Figure 5: Vegetation units on and around the site (Mucina & Rutherford, 2006) ..................................... 19
Figure 6: The featureless terrain of the areas in which turbines are proposed (Karoo Escarpment
Grassland), however on the edges of these areas rock crevices provides roosting space for bats. .......... 20
Figure 7: Example of Tarkastad Montane Shrubland on site. ..................................................................... 21
Figure 8: Extent of the site traversed and bats detected during transects on the 2nd trip. ...................... 28
Figure 9: Extent of the site traversed and bats detected during transects on the 3rd trip. Note the even
higher activity close to NSM1 in the north east. ........................................................................................ 29
Figure 10: Extent of the site traversed and bats detected during transects on the 3rd trip. ..................... 30
Figure 11: Composite transect map that combines the 2nd and 6th transect maps above, the 4th map has
been omitted from this composite image for display purposes since it would hide all other details. Blue
diamonds indicate approximate proposed turbine layout area ................................................................. 31
Figure 12: Bat sensitivity map of the Noupoort site. .................................................................................. 34
Figure 13: The southern part of the site. .................................................................................................... 35
Figure 14: Average bat triggers/night detected at NSM1 short mast for all bat detector nights. Note the
abnormally low activity for January 2012, emphasising the unreliability of the systems. ......................... 36
Figure 15: Average bat triggers/night detected at NSM2 short mast for all bat detector nights. Note the
difference in activity of January 2012 with NSM1. ................................................................................... 37
Figure 16: Temporal (time) distribution of total bat passes over a 24 hour cycle for the sampling period,
by the NSM1 short mast. ............................................................................................................................ 38
Figure 17: Temporal (time) distribution of total bat passes over a 24 hour cycle for the sampling period,
by the NSM2 short mast. ............................................................................................................................ 38
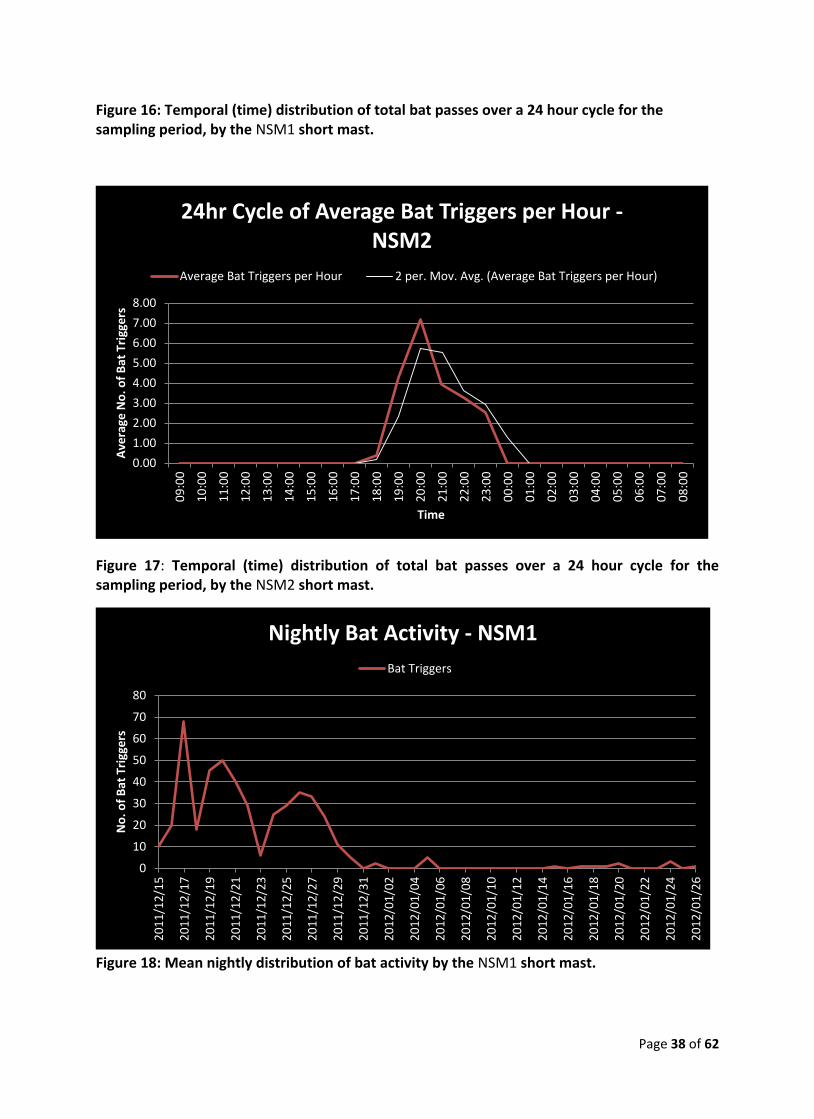
Figure 18: Mean nightly distribution of bat activity by the NSM1 short mast. .......................................... 38
Figure 19: Mean nightly distribution of bat activity by the NSM2 short mast, note the extremely low
activity of Miniopterus natalensis. .............................................................................................................. 39
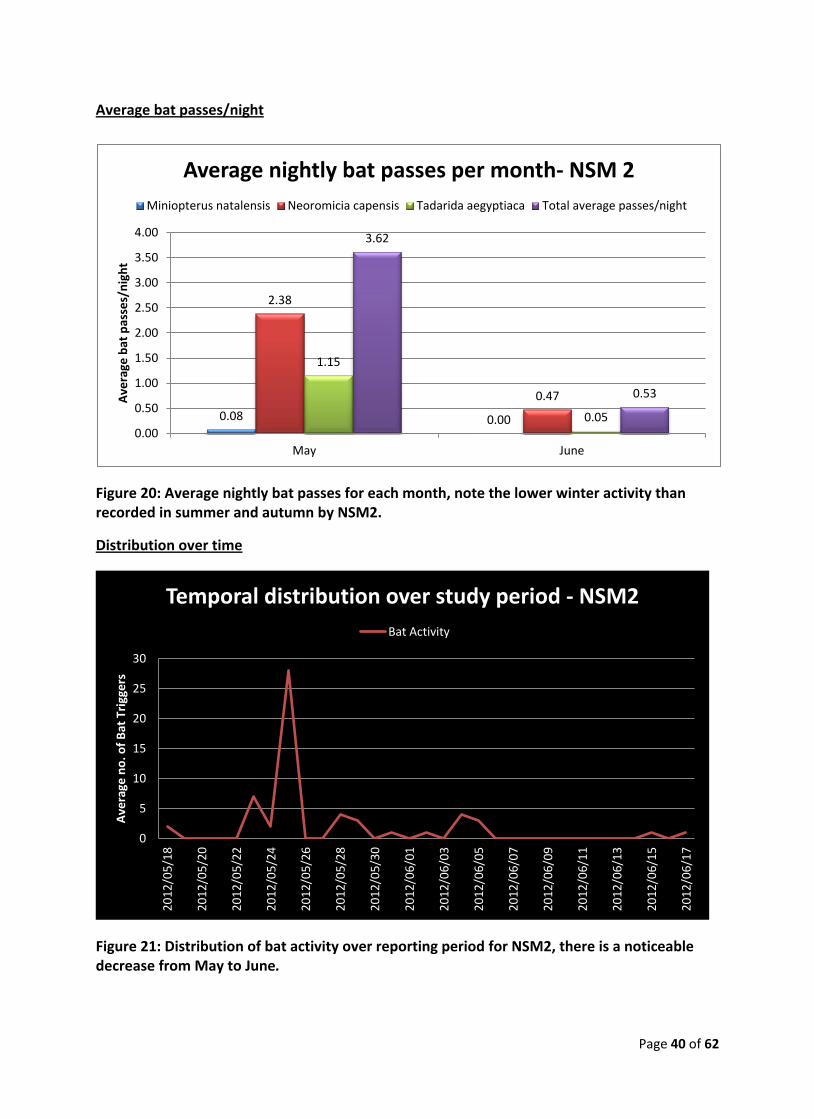
Figure 20: Average nightly bat passes for each month, note the lower winter activity than recorded in
summer and autumn by NSM2. .................................................................................................................. 40
Figure 21: Distribution of bat activity over reporting period for NSM2, there is a noticeable decrease
from May to June. ....................................................................................................................................... 40
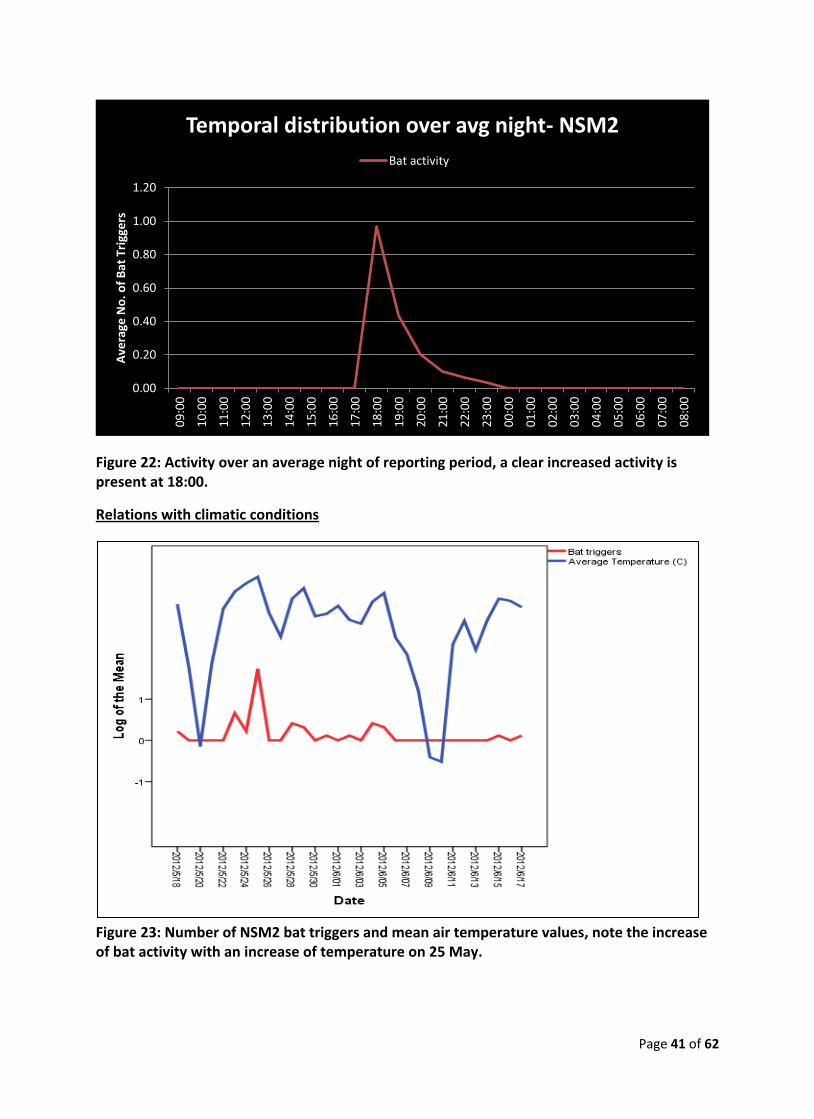
Figure 22: Activity over an average night of reporting period, a clear increased activity is present at
18:00. .......................................................................................................................................................... 41
Figure 23: Number of NSM2 bat triggers and mean air temperature values, note the increase of bat
activity with an increase of temperature on 25 May. ................................................................................ 41
Figure 24: Number of NSM2 bat triggers and average humidity. ............................................................... 42
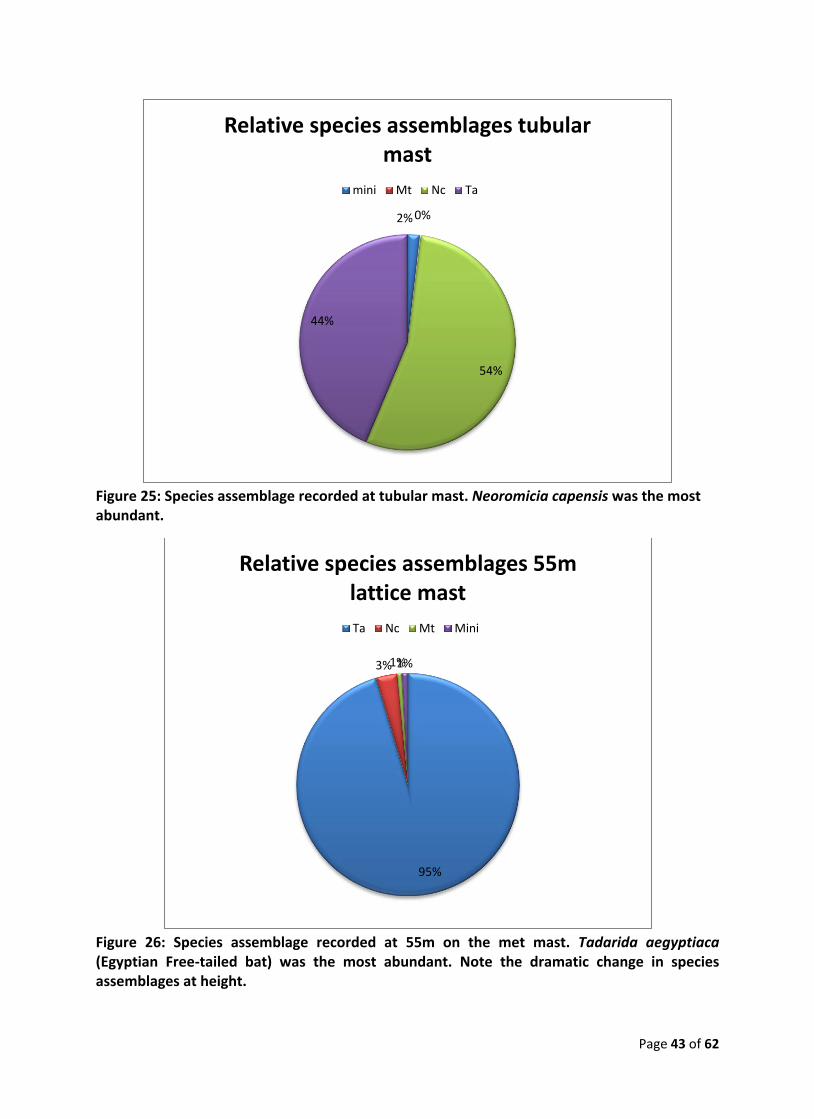
Figure 25: Species assemblage recorded at tubular mast. Neoromicia capensis was the most abundant. 43
Figure 26: Species assemblage recorded at 55m on the met mast. Tadarida aegyptiaca (Egyptian Free-
tailed bat) was the most abundant. Note the dramatic change in species assemblages at height. .......... 43
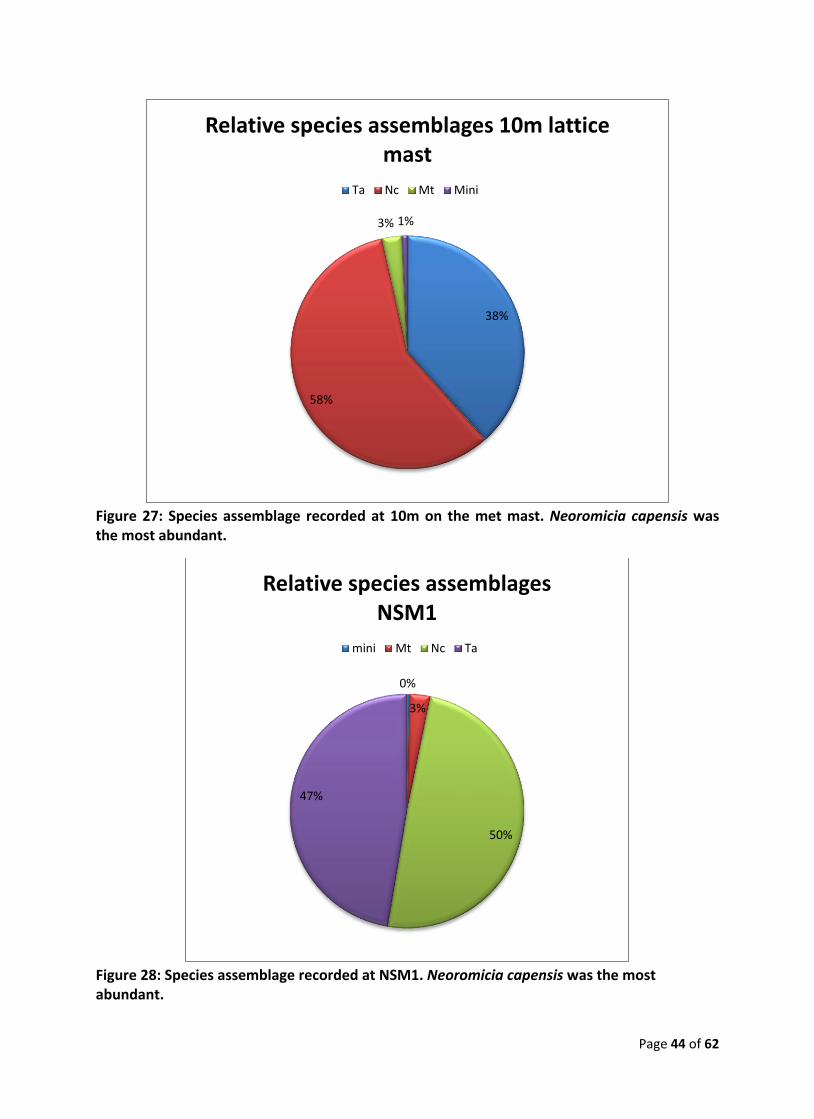
Figure 27: Species assemblage recorded at 10m on the met mast. Neoromicia capensis was the most
abundant. .................................................................................................................................................... 44
Page 6 of 62
Figure 28: Species assemblage recorded at NSM1. Neoromicia capensis was the most abundant. .......... 44
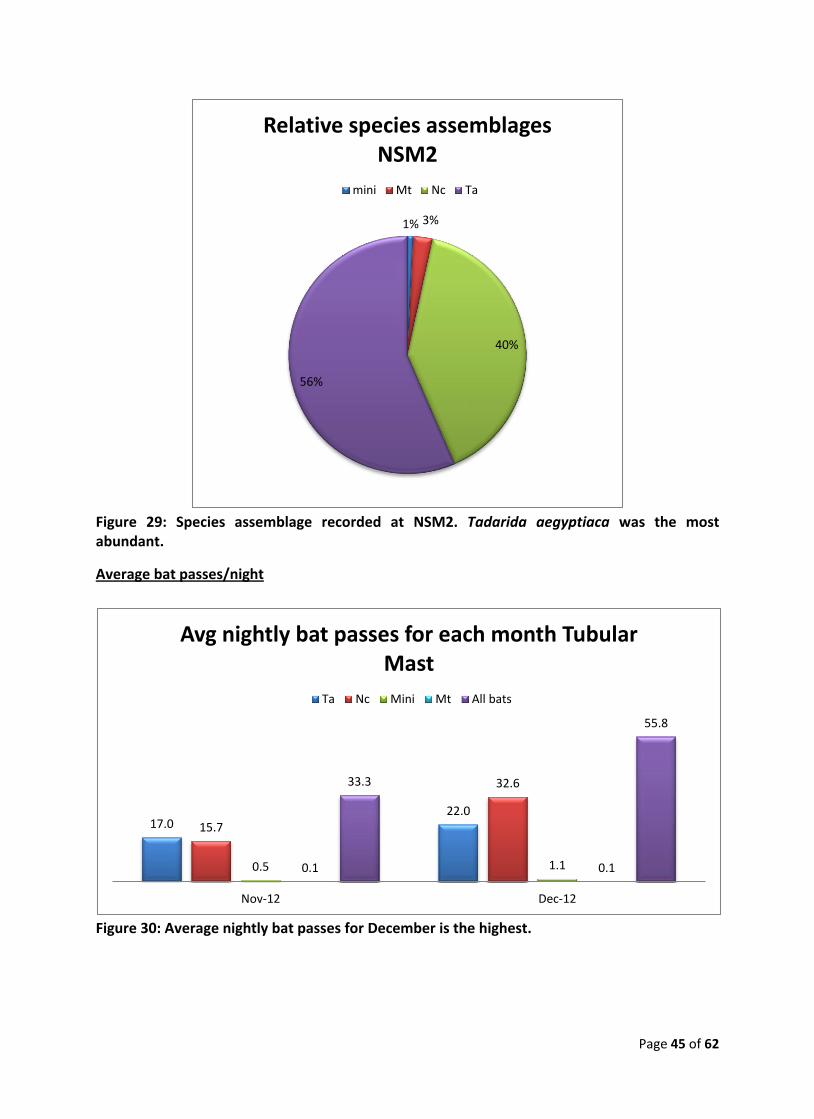
Figure 29: Species assemblage recorded at NSM2. Tadarida aegyptiaca was the most abundant. .......... 45
Figure 30: Average nightly bat passes for December is the highest. .......................................................... 45
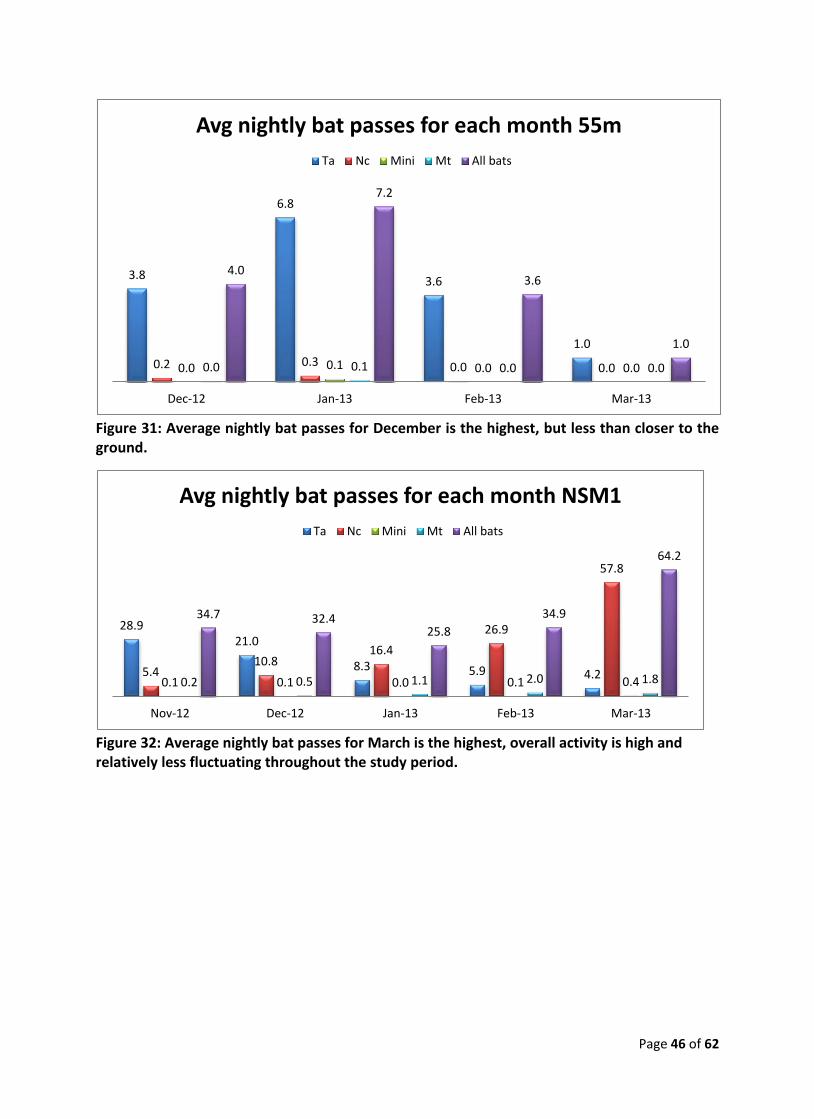
Figure 31: Average nightly bat passes for December is the highest, but less than closer to the ground. . 46
Figure 32: Average nightly bat passes for March is the highest, overall activity is high and relatively less
fluctuating throughout the study period. ................................................................................................... 46
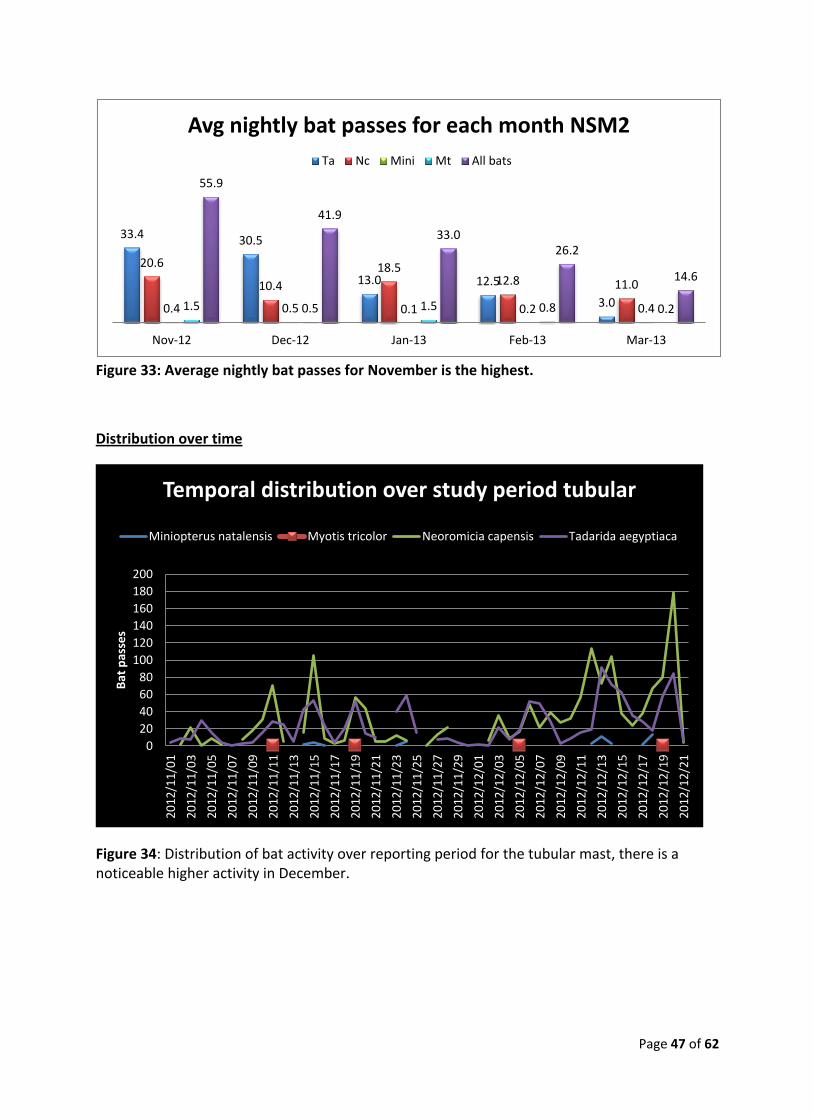
Figure 33: Average nightly bat passes for November is the highest. ......................................................... 47
Figure 34: Distribution of bat activity over reporting period for the tubular mast, there is a noticeable
higher activity in December. ....................................................................................................................... 47
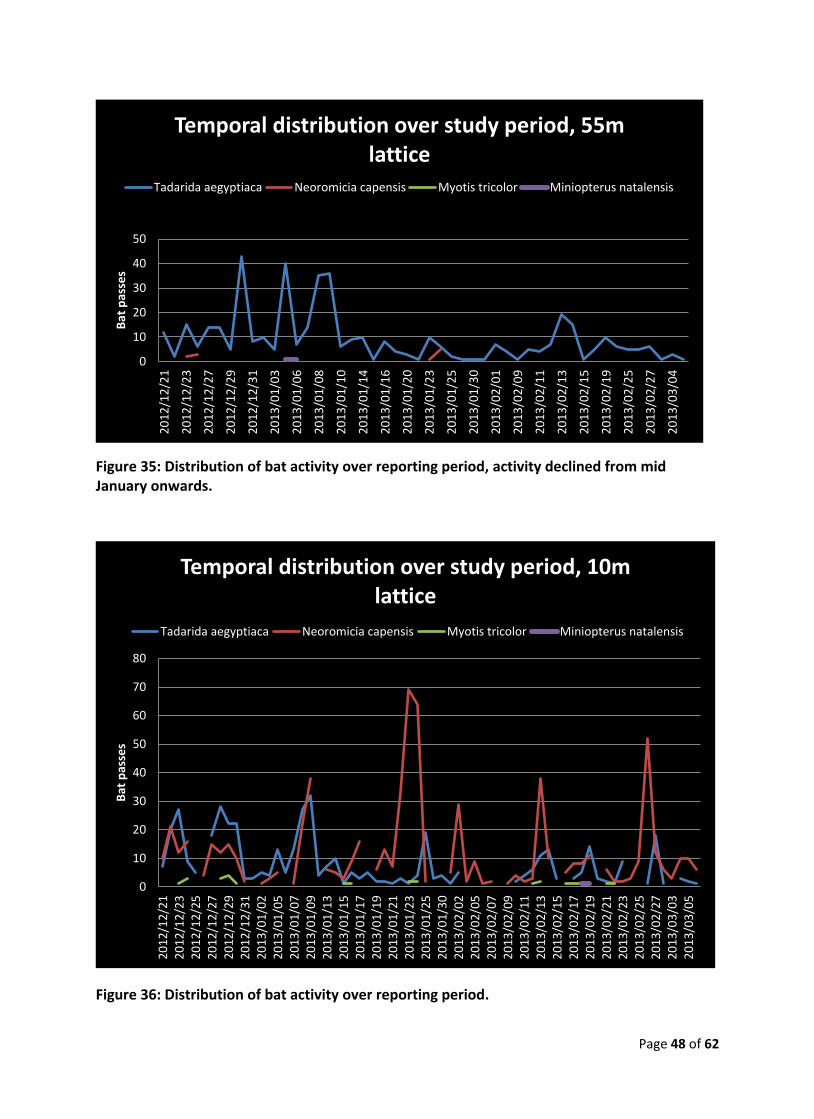
Figure 35: Distribution of bat activity over reporting period, activity declined from mid January onwards.
.................................................................................................................................................................... 48
Figure 36: Distribution of bat activity over reporting period. .................................................................... 48
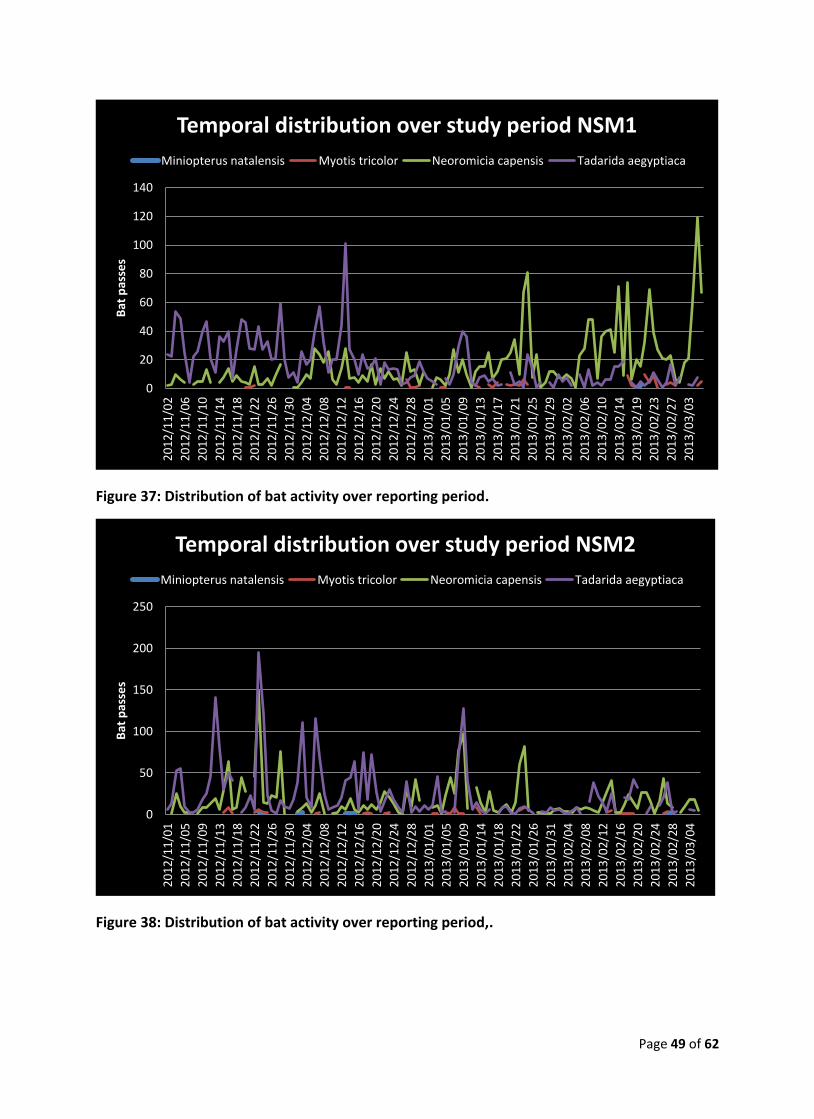
Figure 37: Distribution of bat activity over reporting period. .................................................................... 49
Figure 38: Distribution of bat activity over reporting period,. ................................................................... 49
Figure 39: Activity over an average night of reporting period.................................................................... 50
Figure 40: Activity over an average night of reporting period. Activity is relatively spread. ..................... 50
Figure 41: Activity over an average night of reporting period.................................................................... 51
Figure 42: Activity over an average night of reporting period.................................................................... 51
Figure 43: Activity over an average night of reporting period.................................................................... 52
Figure 44: Grouping of bat activity over wind speed, a strong group is between 2 -5.5 m/s. ................... 52
Figure 45: The percentage of bat passes (% of total) that were detected below a given wind speed, 80%
of bats were detected below 6.5m/s. ......................................................................................................... 53
Figure 46: Grouping of bat activity over temperature. ............................................................................... 53
Figure 47: Less than 18% of activity occurred below 16.5°C. ..................................................................... 54
Figure 48: Bat activity over Relative Humidity. ........................................................................................... 54
Figure 49: Less than 22% of activity occurred below 25% RH. ................................................................... 55
Page 7 of 62
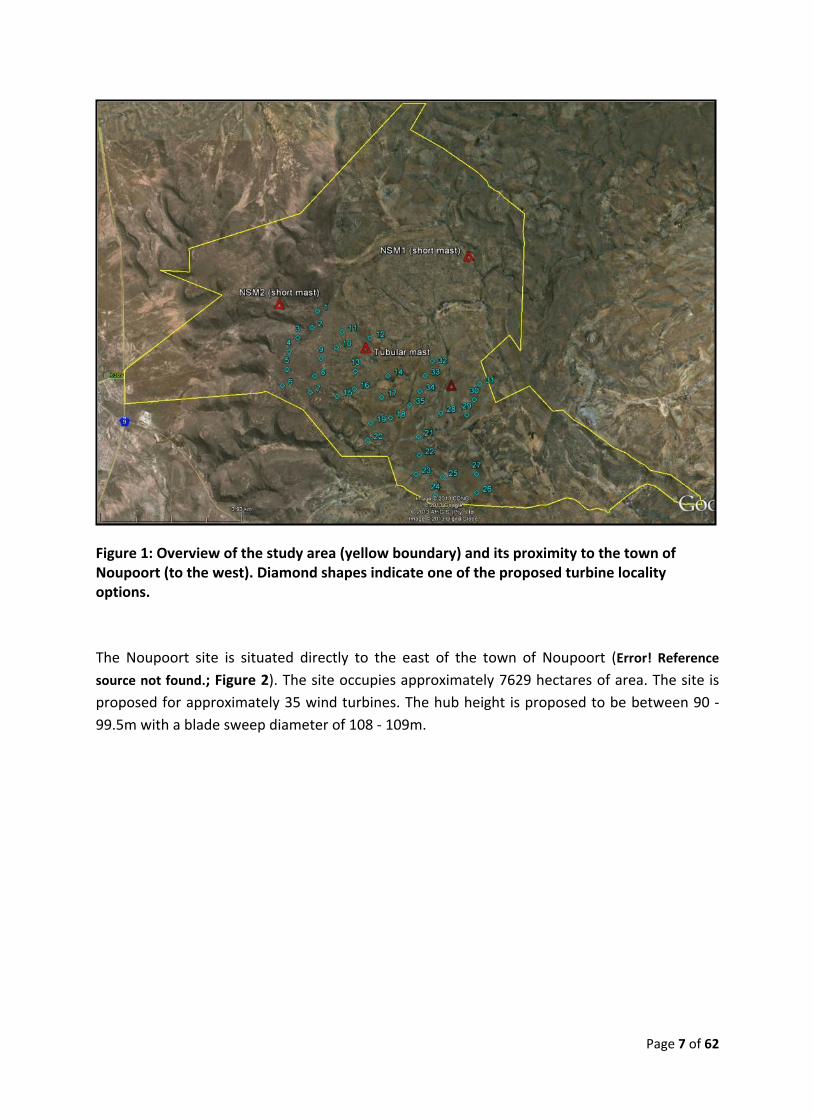
Figure 1: Overview of the study area (yellow boundary) and its proximity to the town of Noupoort (to the west). Diamond shapes indicate one of the proposed turbine locality options.
The Noupoort site is situated directly to the east of the town of Noupoort (Error! Reference
source not found.; Figure 2). The site occupies approximately 7629 hectares of area. The site is
proposed for approximately 35 wind turbines. The hub height is proposed to be between 90 -
99.5m with a blade sweep diameter of 108 - 109m.
Page 8 of 62
Figure 2: Map with an indication of the passive bat detection systems mounted on the masts. There are only 3 mounted systems since the one on the tubular mast was moved to the lattice mast throughout the study. All satellite images were retrieved from Google EarthTM.
1 INTRODUCTION AND METHODOLOGY
Three factors need to be present for most South African bats to be prevalent in an area:
availability of roosting space, food (insects/arthropods or fruit), and accessible open water
sources. However, the dependence of a bat on each of these factors depends on the species, its
behaviour and ecology. Nevertheless if all three of these factors are common in an area the bat
activity, abundance and diversity will also most likely be higher.
Page 9 of 62
Concerning species of bats that may be impacted by wind turbines, the site is evaluated by
comparing the amount of surface rock (possible roosting space), topography (influencing
surface rock in most cases), vegetation (possible roosting spaces and foraging sites), climate
(can influence insect numbers and availability of fruit), and presence of surface water
(influences insects and acts as a source of drinking water). These comparisons are done chiefly
by studying the geographic literature of each site, available satellite imagery and observations
during site visits. Species probability of occurrence based on the above mentioned factors are
estimated for the site and the surrounding larger area.
A bat detector is a device capable of detecting and recording the ultrasonic echolocation calls of
bats which may then be analyzed with the use of computer software. A real time expansion
type bat detector records bat echolocation in its true ultrasonic state which is then effectively
slowed down 10 times during data analysis. Thus the bat calls become audible to the human
ear, but still retains all of the harmonics and characteristics of the call. Although this type of bat
detection equipment is advanced technology, it is not necessarily possible to identify all bat
species by just their echolocation calls. Recordings may be affected by the weather conditions
(i.e. humidity) and openness of the terrain (bats may adjust call frequencies). The range of
detecting a bat is also dependent on the volume of the bat call. Nevertheless it is a very
accurate method of recording bat activity.
A frequency division detector stores less information than real time expansion types, but allows
for smaller data files.
1.1 First site visit and report
Site visit dates 12 - 15 Dec 2011
Met mast passive bat detection systems
Amount on site
1
Microphone heights
5m
Short mast passive bat detection systems
Amount on site
2
Microphone height
9m
Replacements/ Repairs/ Comments
Anabat microphones were weather proofed by means of custom made hats and reflection plates to assist in omnidirectionality. (Figure 4).
Type of passive bat detector
Anabat SD2, Frequency division technology (Figure 3).
Recording schedule Automatically start recording at sunset each night and end at sunrise each morning
Battery size 7Ah; 12V
Page 10 of 62
Solar panel output 10 Watts
Solar charge regulator 8 Amp
Transects No, installation only (transects was done in EIA assessment)
Other methods The sky was monitored for visual observation of bats and bat activity at dusk and during the night, with and without a spotlight. Terrain was investigated during the day.
Report Transect data was analysed and a bat sensitivity map was drawn up to assess the turbine layout in terms of bat sensitive areas on site.
Figure 3: Anabat SD2 frequency division detector.
Page 11 of 62
Figure 4: White weather box (with Anabat detector inside) and solar panel mounted on tubular mast.
1.2 Second site visit and report
Site visit dates 26 - 29 March 2012
Met mast passive bat detection systems
Amount on site
1
Microphone heights
5m
Short mast passive bat detection systems
Amount on site
2
Microphone height
9m
Replacements/ Repairs/ Comments
It was found after analyzing the downloaded data that the system on the tubular mast was not functioning correctly and limited bat activity was logged before shutting down completely. The reason for this malfunction is uncertain, as the system appeared to be
Page 12 of 62
working correctly after the site visit was completed. Similarly NSM1 was also found to be malfunctioning and only recorded bat activity up to the 26th of January 2012, this was presumably due to water damage. NSM2 functioned perfectly and recorded activity for the entire study period. It should be noted that at both short mast systems there appeared to be heavy damage attributed to baboon activity. Especially to the microphone cables. These damages were repaired, and microphone cables replaced.
Type of passive bat detector
Anabat SD2, Frequency division technology (Figure 3).
Recording schedule Automatically start recording at sunset each night and end at sunrise each morning
Battery size 7Ah; 12V
Solar panel output 10 Watts
Solar charge regulator 8 Amp
Transects Yes, driven transects where accesable. Griffin Batbox Time Expansion type
Other methods The sky was monitored for visual observation of bats and bat activity at dusk and during the night, with and without a spotlight. Terrain was investigated during the day.
Report Passive bat activity data as well as transect data was analysed.
1.3 Third site visit and report
Site visit dates 18 - 26 June 2012
Met mast passive bat detection systems
Amount on site
1
Microphone heights
5m
Short mast passive bat detection systems
Amount on site
2
Microphone height
9m
Replacements/ Repairs/ Comments
The microphone cable on the tubular mast had developed a fault. Similarly NSM1 was also found to be malfunctioning and recorded limited bat calls. The error log files for this system read “Warning: bat microphone voltage low”. The power supply system was then replaced, and after an inspection the next morning it proved to have worked correctly the previous night. NSM2 functioned correctly between 18 and 17 June, after microphone cables damaged by baboons was replaced. Razor wire was installed at both short mast systems for protection against baboons.

Page 13 of 62
Type of passive bat detector
Anabat SD2, Frequency division technology (Figure 3).
Recording schedule Automatically start recording at sunset each night and end at sunrise each morning
Battery size 7Ah; 12V
Solar panel output 10 Watts
Solar charge regulator 8 Amp
Transects No, due to bad weather conditions and priority on repairing the passive systems.
Report Passive bat activity data was analysed. Passive bat activity data was correlated with environmental climate data.
1.4 Fourth site visit
Site visit dates 12 - 16 October 2012
Met mast passive bat detection systems
Amount on site
1
Microphone heights
5m
Short mast passive bat detection systems
Amount on site
2
Microphone height
9m
Replacements/ Repairs/ Comments
Both systems on the short masts was moved to the top of the mast (including weather box and all components), in order to allow the microphone to be plugged directly into the detector and bypass the unrelaible microphone cables. It was found that the detectors was never started correctly by the field operator at the end of the 3rd visit, and therefore only the tubular mast system recorded data.
Type of passive bat detector
Anabat SD2, Frequency division technology (Figure 3).
Recording schedule Automatically start recording at sunset each night and end at sunrise each morning
Battery size 7Ah ; 12V
Solar panel output 10 Watts
Solar charge regulator 8 Amp
Transects Yes, driven transects where accesable. The EM3 Real time expansion type detector was used.
Other methods The sky was monitored for visual observation of bats and bat activity at dusk and during the night, with and without a spotlight.
Page 14 of 62
Terrain was investigated during the day.
1.5 Fifth site visit
Site visit dates 31 Oct - 1 Nov 2012
Met mast passive bat detection systems
Amount on site
1
Microphone heights
5m
Short mast passive bat detection systems
Amount on site
2
Microphone height
9m
Replacements/ Repairs/ Comments
All Anabat SD2 systems was decommissioned and replaced with the superior and more reliable SM2BAT+ Real Time Expansion passive bat detectors. The charge regulators were also replaced with Phocos 8 Amp ddeep discharge protection regulators, all batteries was also replaced with new ones.
Type of passive bat detector
SM2BAT+, Real Time Expansion (RTE) type
Recording schedule Automatically enter trigger mode at sunset each night and end at sunrise each morning (times set according to its latitude and longitude, compensating for seasonal changes). Trigger mode for a half hour, for the entire half hour, and then return to ‘sleep’ mode for a minute. After the minute of ‘sleep’ mode the detector then enters trigger mode for another half hour, the detector then cycles between these half hours of trigger mode and one minutes sleeping periods for the entire night. This enables a fine resolution of the bat activity for the duration of the night.
Trigger threshold >16KHz, 18dB
Trigger window (time of recording after trigger ceased)
2 seconds
Microphone gain setting 48dB
Compression WAC1
Single memory card size (each systems uses 4 cards)
32GB
Battery size 7Ah; 12V
Solar panel output 10 Watts
Solar charge regulator 8 Amp with low voltage/deep discharge protection
Transects No, only an installation field visit.
Page 15 of 62
1.6 Sixth site visit
Site visit dates 19 - 21 Dec 2012
Met mast passive bat detection systems
Amount on site
1
Microphone heights
5m
Short mast passive bat detection systems
Amount on site
2
Microphone height
9m
Replacements/ Repairs/ Comments
The SM2BAT+ system on the tubular mast was moved to the newly available lattice mast, installing one microphone at 10m and another at 55m. All systems functioned correctly with no complications.
Type of passive bat detector
SM2BAT+, Real Time Expansion (RTE) type
Recording schedule Automatically enter trigger mode at sunset each night and end at sunrise each morning (times set according to its latitude and longitude, compensating for seasonal changes).
Trigger threshold >16KHz, 18dB
Trigger window (time of recording after trigger ceased)
0.5 seconds (according to new standards)
Microphone gain setting 36dB
Compression WAC0
Single memory card size (each systems uses 4 cards)
32GB
Battery size 7Ah; 12V
Solar panel output 10 Watts
Solar charge regulator 8 Amp with low voltage/deep discharge protection
Transects Yes, EM3 Real Time Expansion detector.
Other methods The sky was monitored for visual observation of bats and bat activity at dusk and during the night, with and without a spotlight. Terrain was investigated during the day.
Report Passive bat activity data as well as transect data was analysed (covered in this report)
1.7 Seventh site visit (supplementary)
Page 16 of 62
Site visit dates 5 -7 March 2013
Met mast passive bat detection systems
Amount on site
1
Microphone heights
5m
Short mast passive bat detection systems
Amount on site
2
Microphone height
9m
Replacements/ Repairs/ Comments
Passive data was downloaded and all systems with their microphones functioned correctly.
Type of passive bat detector
SM2BAT+, Real Time Expansion (RTE) type (Figure 3).
Recording schedule Automatically enter trigger mode at sunset each night and end at sunrise each morning (times set according to its latitude and longitude, compensating for seasonal changes).
Trigger threshold >16KHz, 18dB
Trigger window (time of recording after trigger ceased)
0.5 seconds (according to new standards)
Microphone gain setting 36dB
Compression WAC0
Single memory card size (each systems uses 4 cards)
32GB
Battery size 7Ah; 12V
Solar panel output 10 Watts
Solar charge regulator 8 Amp with low voltage/deep discharge protection
Transects No, data retrivel visit only.
Other methods
Report Passive bat activity data as well as transect data was analysed (covered in this report)
The passive data of bat activity was analyzed by classifying (as near to species level as possible)
and counting positive bat passes detected by the passive systems. A bat pass is defined as a
sequence of ≥1 echolocation calls where the duration of each pulse is ≥2ms (one echolocation
call can consist of numerous pulses). Where there is a gap between pulses of >500ms in one
file, this then represents a new bat pass. These bat passes were then summed into 10 minute
intervals which were used to calculate nocturnal distribution patterns over time. Bat activity
was grouped into 10 minute periods as the wind data was received in these intervals. Only
nocturnal, dusk and dawn values of environmental parameters from the wind data was utilized,
as this is the only time insectivorous bats are active. Times of sunset and sunrise were adjusted
with the time of year.

Page 17 of 62
Bat activity was then correlated with the environmental parameters of wind speed, air
temperature, relative humidity and barometric pressure. Patterns in the distribution of bat
activity were also investigated.

Page 18 of 62
2 RESULTS
2.1 Assumptions and limitations
Distribution maps of South African bat species still require further refinement such that the bat
species proposed to occur on the site (that were not detected) are assumed accurate. If a
species has a distribution marginal to the site it was assumed to occur in the area. The literature
based table of species probability of occurrence may include a higher number of bat species
than actually present.
The migratory paths of bats are largely unknown, thus limiting the ability to determine if the
wind farm will have a large scale effect on migratory species. This limitation however will be
overcome with this long-term sensitivity assessment.
The satellite imagery partly used to develop the sensitivity map may be slightly imprecise due to
land changes occurring since the imagery was taken. Satellite imagery from Google Earth for
2012 was utilized to minimize this limitation.
Species identification with the use of bat detection and echolocation is less accurate when
compared to morphological identification, nevertheless it is a very certain and accurate
indication of bat activity and their presence with no harmful effects on bats being surveyed.
It is not possible to determine actual individual bat numbers from acoustic bat activity data,
whether gathered with transects or the passive monitoring systems. However, bat passes
per night are internationally used and recognized as a comparative unit for indicating levels
of bat activity in an area.
Spatial distribution of bats over the study area cannot be accurately determined by means
of transects, although the passive systems can provide comparative data for different areas
of the site. The transects may still possibly uncover high activity in areas where it is not
necessarily expected and thereby increase insight into the site.
Exact foraging distances from bat roosts or exact commuting pathways cannot be
determined by the current methodology. Radio telemetry tracking of tagged bats is
required to provide such information if needed.
Costly radar technology is required to provide more quantitative data on actual bat
numbers as well as spatial distribution of multiple bats.
The discovery of all bat roosts on site is not possible within the timeframes, instead focus is
on habitat types and features that are known for offering roosting space to bats. However
any roosts discovered is incorporated into the study.
Page 19 of 62
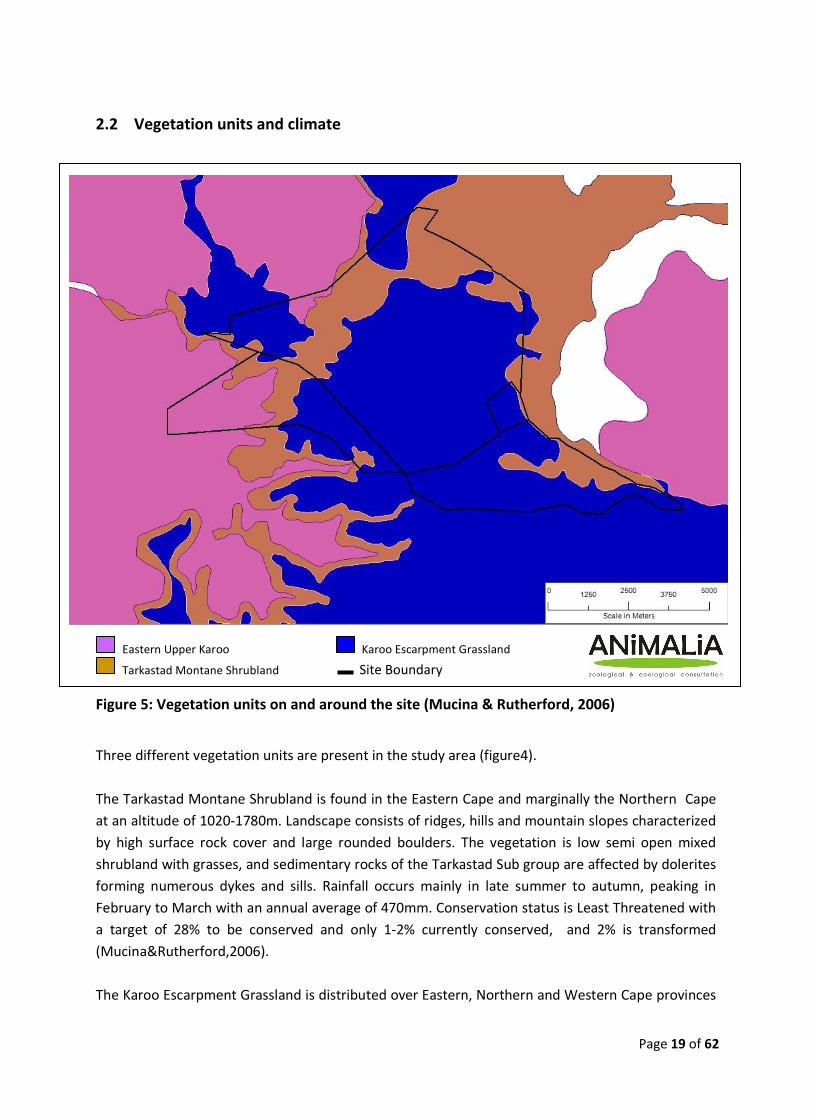
2.2 Vegetation units and climate
Eastern Upper Karoo Karoo Escarpment Grassland
Tarkastad Montane Shrubland Site Boundary
Figure 5: Vegetation units on and around the site (Mucina & Rutherford, 2006)
Three different vegetation units are present in the study area (figure4).
The Tarkastad Montane Shrubland is found in the Eastern Cape and marginally the Northern Cape
at an altitude of 1020-1780m. Landscape consists of ridges, hills and mountain slopes characterized
by high surface rock cover and large rounded boulders. The vegetation is low semi open mixed
shrubland with grasses, and sedimentary rocks of the Tarkastad Sub group are affected by dolerites
forming numerous dykes and sills. Rainfall occurs mainly in late summer to autumn, peaking in
February to March with an annual average of 470mm. Conservation status is Least Threatened with
a target of 28% to be conserved and only 1-2% currently conserved, and 2% is transformed
(Mucina&Rutherford,2006).
The Karoo Escarpment Grassland is distributed over Eastern, Northern and Western Cape provinces
Page 20 of 62
with an altitude of 1100-2502m. Landscape comprises mountain summits, low mountains and hills
with wiry tussock grasslands and low shrubs. Shallow soils are present on mudstones and
sandstones of the Beaufort Group, and dolerite intrusions form ridges. The rainfall shows minor
peaks in March and Nov-Dec with very dry winters, and an annual average of 300-580mm. Frost
incidence is from 20-100 days per year and is more likely at the higher elevations and also some
snow in higher elevations (Mucina & Rutherford, 2006).
The Eastern Upper Karoo is found in the Northern, Eastern and Western Cape provinces and the
altitude varies between 1000-1700m. Flat sand gently sloping planes dotted with hills and rocky
areas form part of the landscape, with grasses and shrubs. Geology comprises mudstone and
sandstones of the Beaufort Group, with limited dolerite intrusions. Rainfall is mainly in autumn and
summer and the annual average ranges from 180mm in the west of the vegetation unit to 430mm
in the east. Mean maximum and minimum monthly temperatures are 36.1°C and -7.2°C for January
and July respectively. This unit is Least Threatened with a target of 21% to be conserved and 2% has
already been transformed (Mucina & Rutherford, 2006).
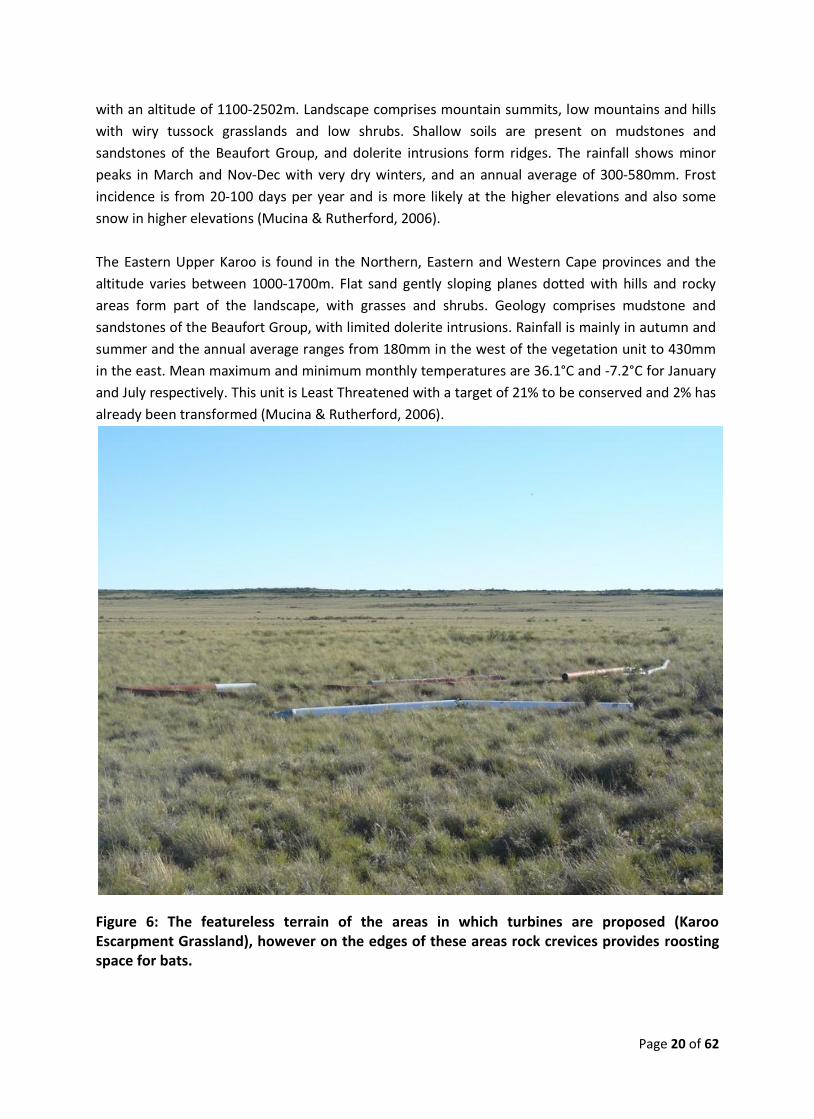
Figure 6: The featureless terrain of the areas in which turbines are proposed (Karoo Escarpment Grassland), however on the edges of these areas rock crevices provides roosting space for bats.
Page 21 of 62
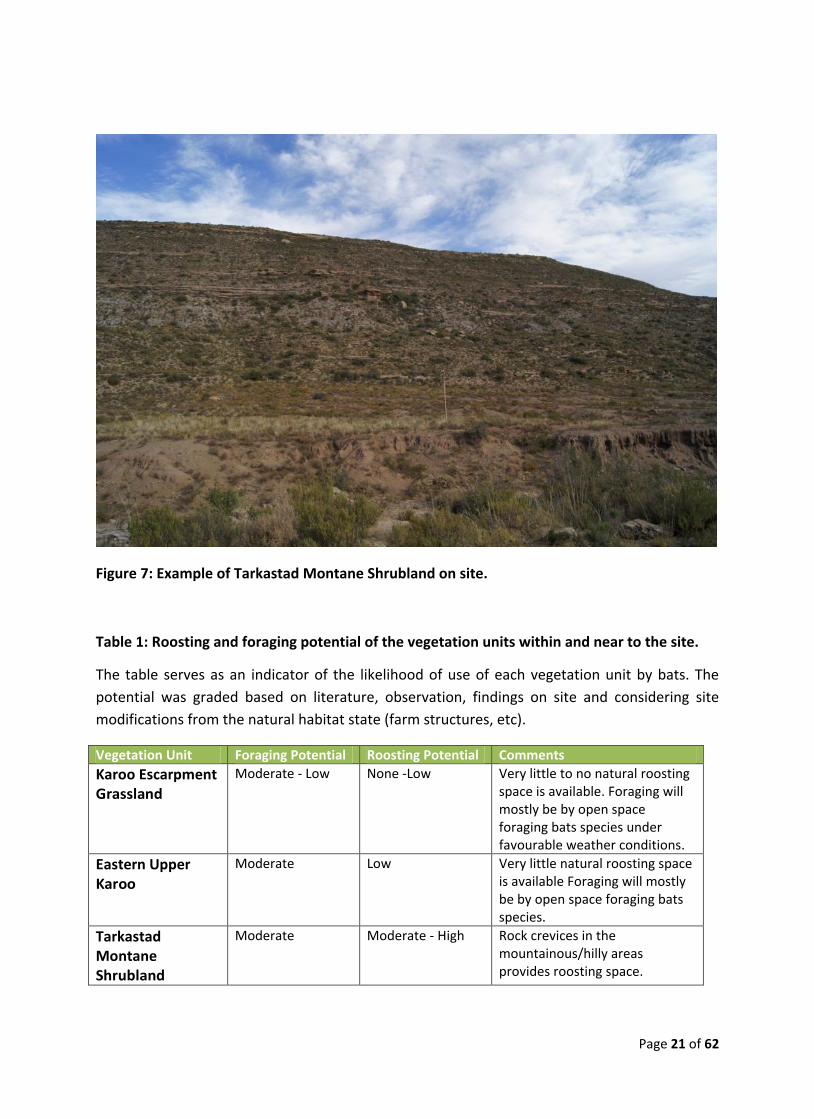
Figure 7: Example of Tarkastad Montane Shrubland on site.
Table 1: Roosting and foraging potential of the vegetation units within and near to the site.
The table serves as an indicator of the likelihood of use of each vegetation unit by bats. The
potential was graded based on literature, observation, findings on site and considering site
modifications from the natural habitat state (farm structures, etc).
Vegetation Unit Foraging Potential Roosting Potential Comments
Karoo Escarpment Grassland
Moderate - Low None -Low Very little to no natural roosting space is available. Foraging will mostly be by open space foraging bats species under favourable weather conditions.
Eastern Upper Karoo
Moderate Low Very little natural roosting space is available Foraging will mostly be by open space foraging bats species.
Tarkastad Montane Shrubland
Moderate Moderate - High Rock crevices in the mountainous/hilly areas provides roosting space.

Page 22 of 62
2.3 Literature based species probability of occurrence
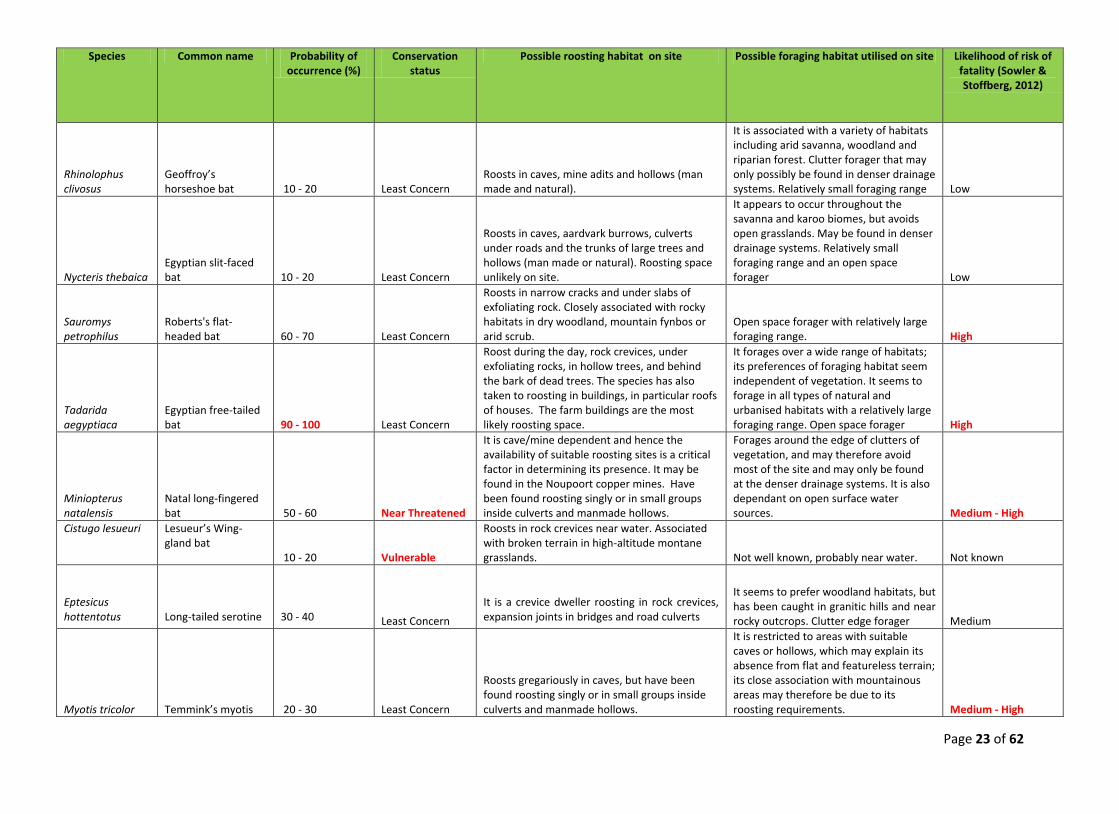
Table 2: Table of species that may be roosting or foraging on the study area, the possible site specific roosts, and their probability of occurrence based on literature (Monadjem et al., 2010).
“Probability of Occurrence” is assigned based on consideration of the presence of roosting sites and foraging habitats on the site, compared to
literature described preferences. The probability of occurrence is described by a percentage indicative of the expected numbers of individuals
present on site and the frequency at which the site will be visited by the species (in other words the likelihood of encountering the bat
species). Bat species that were detected on site are noted as Confirmed in the “Probability of Occurrence” column.
The column of “Likely risk of impact” describes the likelihood of risk of fatality from direct collision or barotrauma with wind turbine blades for
each bat species. The risk was assigned by Sowler & Stoffberg (2012) based on species distributions, altitudes at which they fly and distances
they traverse; and assumes a 100% probability of occurrence.
Page 23 of 62
Species Common name Probability of occurrence (%)
Conservation status
Possible roosting habitat on site Possible foraging habitat utilised on site Likelihood of risk of fatality (Sowler & Stoffberg, 2012)
Rhinolophus clivosus
Geoffroy’s horseshoe bat 10 - 20 Least Concern
Roosts in caves, mine adits and hollows (man made and natural).
It is associated with a variety of habitats including arid savanna, woodland and riparian forest. Clutter forager that may only possibly be found in denser drainage systems. Relatively small foraging range Low
Nycteris thebaica Egyptian slit-faced bat 10 - 20 Least Concern
Roosts in caves, aardvark burrows, culverts under roads and the trunks of large trees and hollows (man made or natural). Roosting space unlikely on site.
It appears to occur throughout the savanna and karoo biomes, but avoids open grasslands. May be found in denser drainage systems. Relatively small foraging range and an open space forager Low
Sauromys petrophilus
Roberts's flat-headed bat 60 - 70 Least Concern
Roosts in narrow cracks and under slabs of exfoliating rock. Closely associated with rocky habitats in dry woodland, mountain fynbos or arid scrub.
Open space forager with relatively large foraging range. High
Tadarida aegyptiaca
Egyptian free-tailed bat 90 - 100 Least Concern
Roost during the day, rock crevices, under exfoliating rocks, in hollow trees, and behind the bark of dead trees. The species has also taken to roosting in buildings, in particular roofs of houses. The farm buildings are the most likely roosting space.
It forages over a wide range of habitats; its preferences of foraging habitat seem independent of vegetation. It seems to forage in all types of natural and urbanised habitats with a relatively large foraging range. Open space forager High
Miniopterus natalensis
Natal long-fingered bat 50 - 60 Near Threatened
It is cave/mine dependent and hence the availability of suitable roosting sites is a critical factor in determining its presence. It may be found in the Noupoort copper mines. Have been found roosting singly or in small groups inside culverts and manmade hollows.
Forages around the edge of clutters of vegetation, and may therefore avoid most of the site and may only be found at the denser drainage systems. It is also dependant on open surface water sources. Medium - High
Cistugo lesueuri Lesueur’s Wing- gland bat
10 - 20 Vulnerable
Roosts in rock crevices near water. Associated with broken terrain in high-altitude montane grasslands. Not well known, probably near water. Not known
Eptesicus hottentotus
Long-tailed serotine
30 - 40 Least Concern
It is a crevice dweller roosting in rock crevices, expansion joints in bridges and road culverts
It seems to prefer woodland habitats, but has been caught in granitic hills and near rocky outcrops. Clutter edge forager Medium
Myotis tricolor Temmink’s myotis 20 - 30 Least Concern
Roosts gregariously in caves, but have been found roosting singly or in small groups inside culverts and manmade hollows.
It is restricted to areas with suitable caves or hollows, which may explain its absence from flat and featureless terrain; its close association with mountainous areas may therefore be due to its roosting requirements. Medium - High
Page 24 of 62
2.4 Ecology of most applicable bat species recorded on site
Miniopterus natalensis
Miniopterus natalensis, commonly called the Natal - clinging bat, occurs widely across the country but mostly within the southern and eastern
regions. It is listed as a Near Threatened conservation category.
It is a cave-dependent species, such that the presence of suitable roosting sites in an area may be more important in predicting its presence
than the vegetation. However, personal observations have proved this species to also utilise culverts as roosts, either singly or in very low
numbers. This species assembles in large numbers to roost within caves. It utilises separate caves for winter hibernating activities and summer
maternity behaviour. Winter hibernacula generally occur in more temperate areas of the country and at higher altitudes, while summer
maternity roosts are warmer and lower altitudes (Monadjem et al., 2010). For this particular site, if a suitable roosting cave is located near to
the site it would most likely be used as a summer maternity roost. But no locations of any caves or mine adits are known within the area of the
site.
Miniopterus natalensis undertake short migratory journeys between hibernacula and maternity roosts. Due to this migratory behaviour, they
are considered to be at high risk of fatality from wind turbines, if a wind farm is placed within a migratory path. The mass movement of bats
during migratory periods could result in large kill-offs if wind turbines happen to be positioned right on a mass migratory route, and such
turbines are not effectively mitigated. The problem lies in that very little is known about bat migratory behaviour and paths in South Africa for
this species, and such migrations can be up to 150 kilometres in distance. There is a pressing need for research in this direction. However, if
Neoromicia capensis Cape serotine 80 -90 Least Concern
Roosts under the bark of trees, at the base of aloe leaves, and inside the roofs of houses. The farm buildings are the most likely roosting space.
It appears to tolerate a wide range of environmental conditions from arid semi-desert areas to montane grasslands, forests, and savannas. Highly adaptable species, but a clutter edge forager limiting its utilisation of the site. Medium - High
Page 25 of 62
the site is located within a migratory path the bat detecting system should detect high
Miniopterus natalensis numbers and activity during the remainder of the 12 month monitoring
survey. No signs of mass migrations were detected during the entire study period.
Sowler & Stoffberg (2012) advise the likelihood of risk of fatality affecting Miniopterus
natalensis, is that of Medium – High risk. Their evaluation was of the risk was based on broad
ecological features, excluding migratory tendencies.
A study of the habitat preference for foraging activities of Miniopterus natalensis showed that
urban areas were by far the most used habitat category (54.0%), followed by open areas (19.8
%), woodlands (15.5%), orchards and parks (9.1 %), and water bodies (1.5 %). On a finer scale,
preferred foraging habitats were mainly urban areas (types of artificial lighting effects
unmeasured) and deciduous or mixed woodlands, followed by crops and vineyards, pastures,
meadows and scrublands, delimited by hedgerows or next to woodland, orchards and parks and
water bodies (Vincent et al., 2011).
The areas of wooded and agricultural habitats were prioritised in the sensitivity maps as this
species has a higher vulnerability to mortality from turbines in these areas.
Several North American studies indicate the impact of wind turbines to be highest on migratory
bats, however there is evidence to the impact on resident species. Fatalities from turbines
increase during natural changes in the behaviour of bats leading to increased activity in the
vicinity of turbines. Increases in non migrating bat mortalities around wind turbines in North
America corresponded with when bats engage in mating activity (Cryan & Barclay, 2009). This
long term assessment will also be able to indicate seasonal peaks in species activity and bat
presence.
Mating and fertilisation generally occur in March–April, followed by a period of delayed embryo
development until July–August and birth in October–December. Females congregate at
maternity roosts where each one gives birth to a single young.
Neoromicia capensis
Commonly called the Cape Serotine, Neoromicia capensis has a Least Concern conservation
category as it is widespread over much of sub-Saharan Africa in high numbers. High mortality
rates of this species due to wind turbines would be a cause of concern as Neoromicia capensis
are abundant and widespread and thus, have more significant roles to play within the local
ecosystem than the rarer bat species.
It roosts individually or in small groups of two or three bats in a variety of shelters, such as
under the bark of trees, at the base of aloe leaves, and under the roofs of houses. They will
Page 26 of 62
utilise most man-made structures as day roosts (Monadjem et al., 2010). These types of
roosting sites on the farms must be considered as sensitive.
They do not undertake migrations and thus are considered residents of the site.
They are tolerant of a wide range of environmental conditions as they survive and prosper
within arid semi-desert areas to montane grasslands, forests, and savannas; inferring that they
may occupy several habitat types across the site, and are adaptable towards habitat changes.
They are however clutter-edge foragers, meaning they prefer to hunt on the edge of vegetation
clutter mostly, but may occasionally forage in open spaces.
They are thought to have a Medium – High likelihood of risk of fatality due to wind turbines
(Sowler & Stoffberg, 2012).
Mating takes place from the end of March until the beginning of April. Spermatozoa are stored
in the uterine horns of the female from April until August, when ovulation and fertilisation
occurs. They give birth to twins during late October and November.
Tadarida aegyptiaca
The Egyptian Free-tailed Bat, Tadarida aegyptiaca, is a Least Concern species as it has a wide
distribution and high abundance throughout South Africa, and is part of the Free-tailed bat
family (Molossidae). It occurs from the Western Cape of South Africa, north through to Namibia
and southern Angola; and through Zimbabwe to central and northern Mozambique (Monadjem
et al., 2010). This species is protected by national legislation in South Africa (ACR, 2010).
They roost communally in small (dozens) to medium-sized (hundreds) groups in caves, rock
crevices, under exfoliating rocks, in hollow trees and behind the bark of dead trees. Tadarida
aegyptiaca has also adapted to roosting in buildings, in particular roofs of houses (Monadjem et
al., 2010). Thus man-made structure and large trees on the site would be important roosts for
this species.
Tadarida aegyptiaca forages over a wide range of habitats, flying above the vegetation canopy.
It appears that the vegetation has little influence on foraging behaviour as the species forages
over desert, semi-arid scrub, savanna, grassland and agricultural lands. Its presence is strongly
associated with permanent water bodies due to concentrated densities of insect prey
(Monadjem et al., 2010).
Page 27 of 62
The Egyptian Free-tailed bat is considered to have a High likelihood of risk of fatality due to
wind turbines (Sowler & Stoffberg, 2012). Due to the high abundance and widespread
distribution of this species, high mortality rates due to wind turbines would be a cause of
concern as these species have more significant ecological roles than the rarer bat species. The
sensitivity maps are strongly informed by the areas that may be utilised by this species.
After a gestation of four months, a single young is born, usually in November or December,
when females give birth once a year. In males, spermatogenesis occurs from February to July
and mating occurs in August. Maternity colonies are apparently established by females in
November
Myotis tricolor
Myotis tricolor (Temminck’s myotis) has a distribution spread from Cape Town, east along the
coast to the Eastern Cape, then north through Lesotho and the Free State to northern South
Africa and east to western KwaZulu-Natal and Swaziland. It is of Least Concern conservation
category due to its widespread distribution and assumed abundance (Monadjem et al., 2010).
Myotis tricolor roosts gregariously in caves. They undertake short migrations between winter
hibernacula and summer maternity caves, where they may occur in groups of up to 1500
individuals (Monadjem et al., 2010). Their occurrence in an area is restricted by the presence of
suitable caves, such that they are largely absent from flat and open terrain. However personal
observations have proven them to roost even singly in hollows such as road culverts.
Several members of the Myotis genus have been shown to forage mostly over water bodies.
Black (1974) categorized the diet of Myotis yumanensis as the 'over-water' strategy. Kunz
(1974) found that Myotis velifer fed mainly along water courses in Kansas and Oklahoma.
Belwood and Fenton (1976) found that Myotis lucifugus fed mainly over water in north-eastern
North America and relied heavily on aquatic insects for food. Thus it can be said that Myotis
tricolor should be more prevalent within the vicinity of water sources.
Page 28 of 62
2.5 Transects
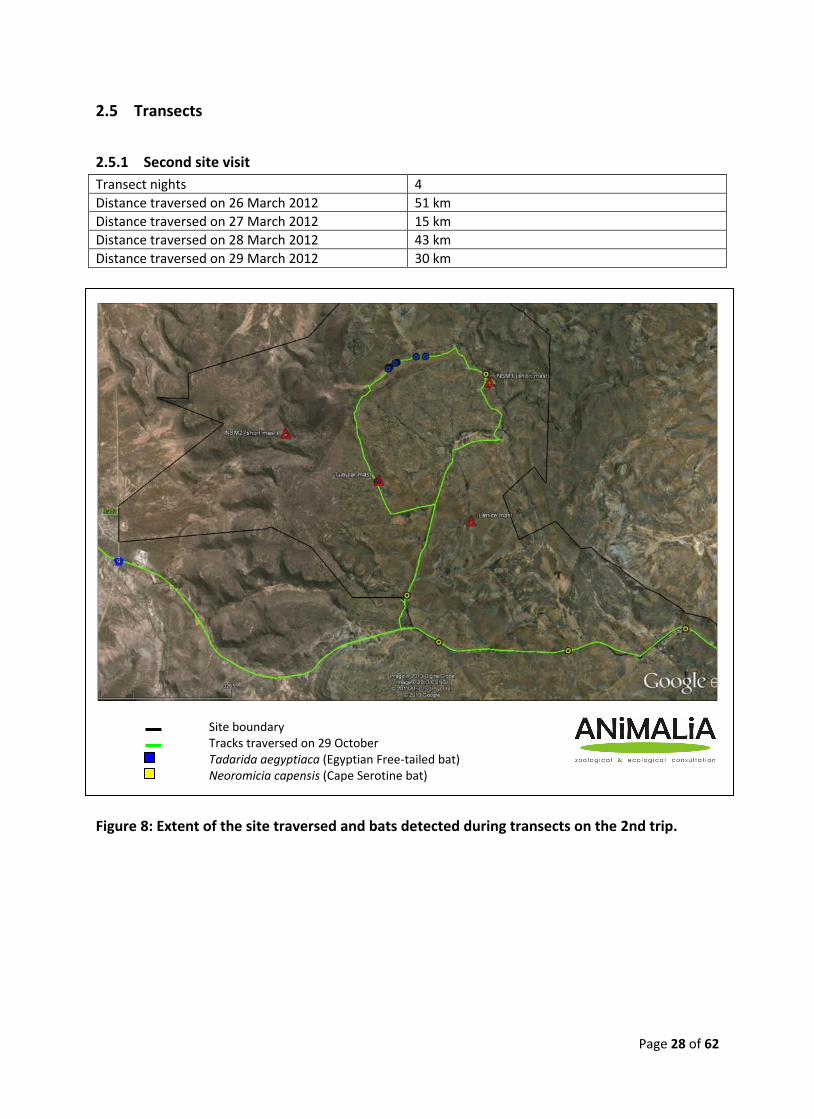
2.5.1 Second site visit
Transect nights 4
Distance traversed on 26 March 2012 51 km
Distance traversed on 27 March 2012 15 km
Distance traversed on 28 March 2012 43 km
Distance traversed on 29 March 2012 30 km
Site boundary Tracks traversed on 29 October
Tadarida aegyptiaca (Egyptian Free-tailed bat) Neoromicia capensis (Cape Serotine bat)
Figure 8: Extent of the site traversed and bats detected during transects on the 2nd trip.

Page 29 of 62
2.5.2 Fourth site visit
Take note that the weather conditions during the transects of this site visit was exceptionally good for
bat activity. Insects were exceptionally active before heavy rains and more bats than usual were
observed. The exact weather conditions at which this occurs is indicated by further results in this report.
This emphasises the strong effect of weather conditions on bat activity on this site.
Transect nights 2
Distance traversed on 13 October 2012 30 km
Distance traversed on 14 October 2012 46 km
Site boundary Tracks traversed on 15 January 2013
Tadarida aegyptiaca (Egyptian Free-tailed bat) Neoromicia capensis (Cape Serotine bat)
Figure 9: Extent of the site traversed and bats detected during transects on the 3rd trip. Note the even higher activity close to NSM1 in the north east.
Page 30 of 62
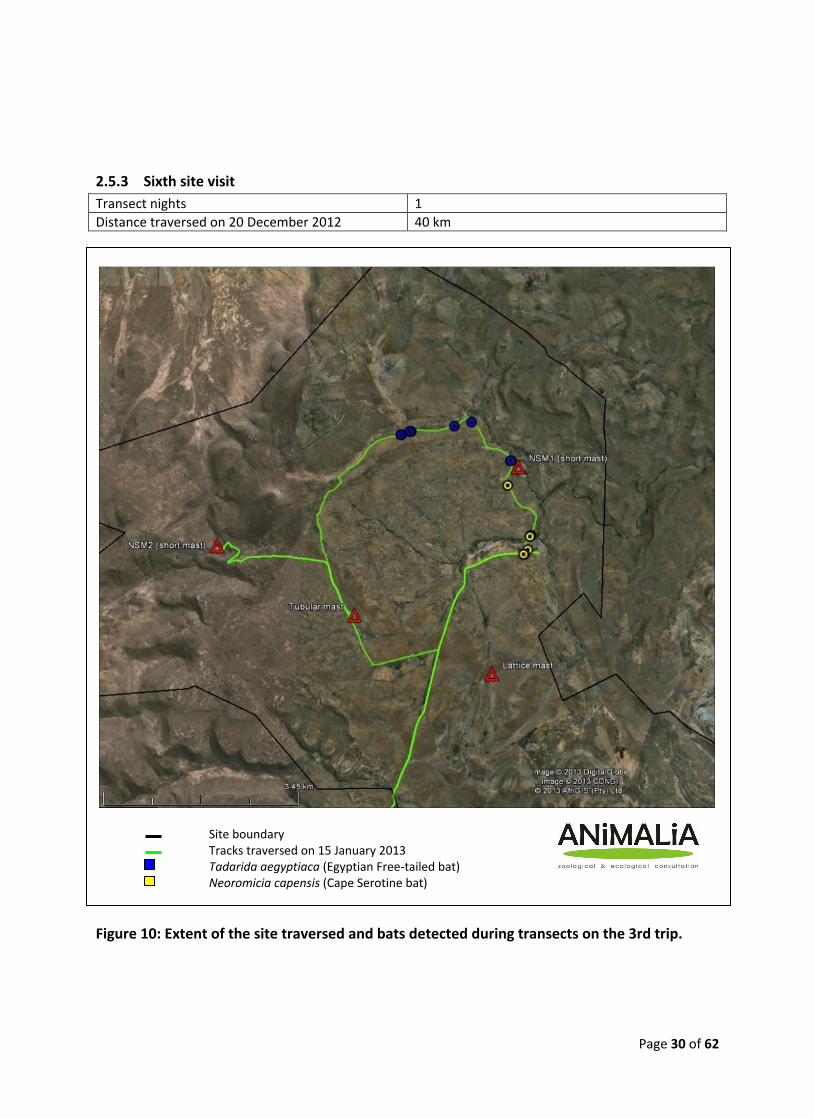
2.5.3 Sixth site visit
Transect nights 1
Distance traversed on 20 December 2012 40 km
Site boundary Tracks traversed on 15 January 2013
Tadarida aegyptiaca (Egyptian Free-tailed bat) Neoromicia capensis (Cape Serotine bat)
Figure 10: Extent of the site traversed and bats detected during transects on the 3rd trip.
Page 31 of 62
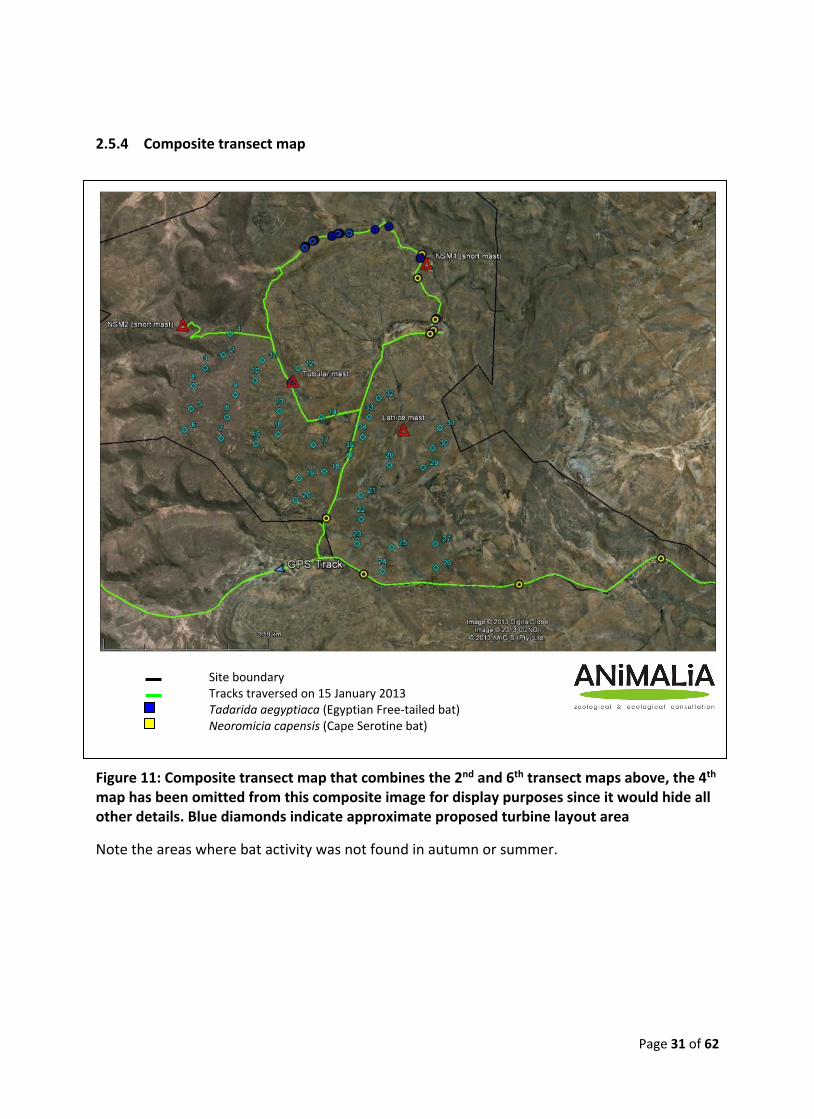
2.5.4 Composite transect map
Site boundary Tracks traversed on 15 January 2013
Tadarida aegyptiaca (Egyptian Free-tailed bat) Neoromicia capensis (Cape Serotine bat)
Figure 11: Composite transect map that combines the 2nd and 6th transect maps above, the 4th map has been omitted from this composite image for display purposes since it would hide all other details. Blue diamonds indicate approximate proposed turbine layout area
Note the areas where bat activity was not found in autumn or summer.

Page 32 of 62
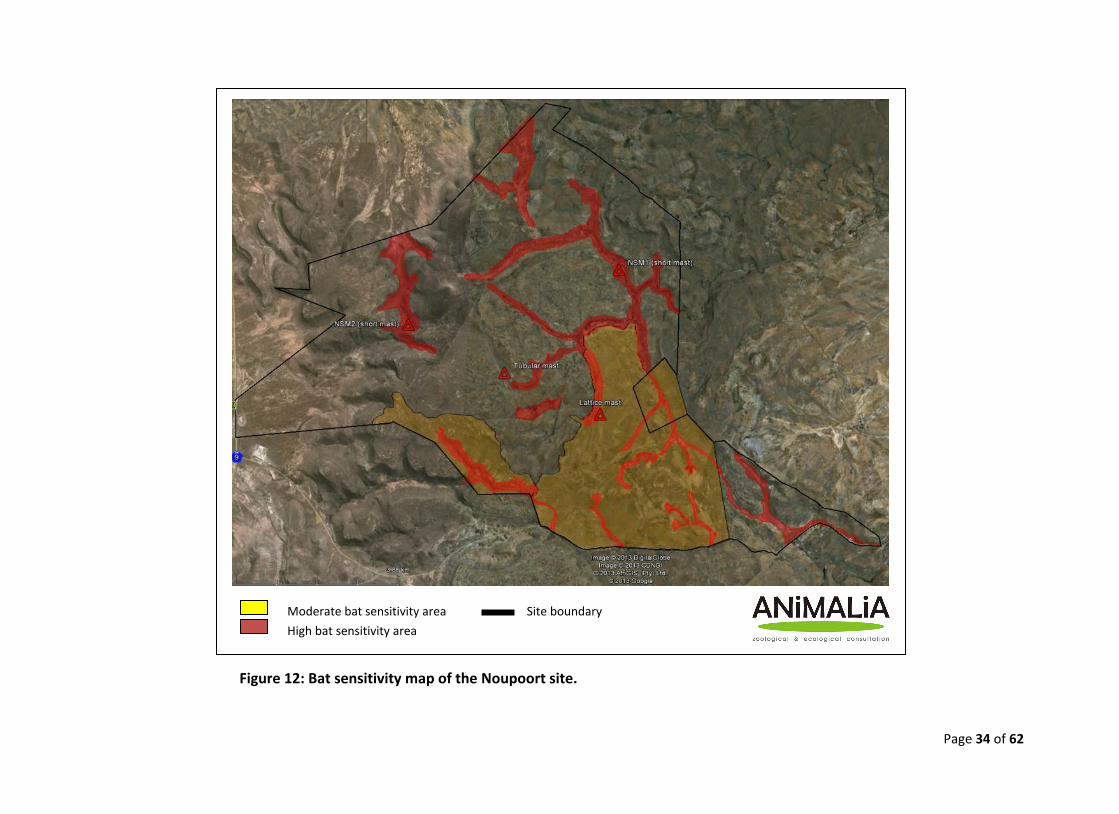
2.6 Sensitivity map
Figure 12 depict the sensitive areas of the site, based on features
identified to be important for foraging and roosting of the species that are confirmed and most
probable to occur on site. Thus the sensitivity map is based on species ecology and habitat
preferences. This map can be used as a pre-construction mitigation in terms of improving
turbine placement with regards to bat preferred habitats on site.
Last iteration November 2012 Features used to develop the sensitivity map
Manmade structures, such as farm houses, barns, sheds, road culverts and mine audits, these structures provide easily accessible roosting sites.
Clumps of larger woody plants. These features provide natural roosting spaces or tend to attract insect prey.
Presence of riparian/water drainage habitat is used as indicators of
probable foraging areas.
Topography, hilly and rocky areas that offer roosting space for bats.
Open water sources, be it man-made farm dams or natural streams and
wetlands, are important sources of drinking water and provide habitat
that host insect prey.
There are no South African guidelines for the consideration of specific buffer zone distances for
bats in relation to wind farms. Guidance can be taken from other guidelines:
Gauteng Department of Agriculture and Rural Development recommend a 500m buffer for
natural bat caves and a 200m buffer on Class 1 ridge systems, 200m buffer on conservation
important vegetation and a 50m buffer from riparian edge habitats.
The Eurobats Guidance (Rodrigues et al., 2008) proposes a minimum buffer distance of
200m from forest edges.
The Natural England Interim Guidance suggests a 50m buffer from turbine blade tip to the
nearest bat important feature (Mitchell-Jones & Carlin, 2009).
Page 33 of 62
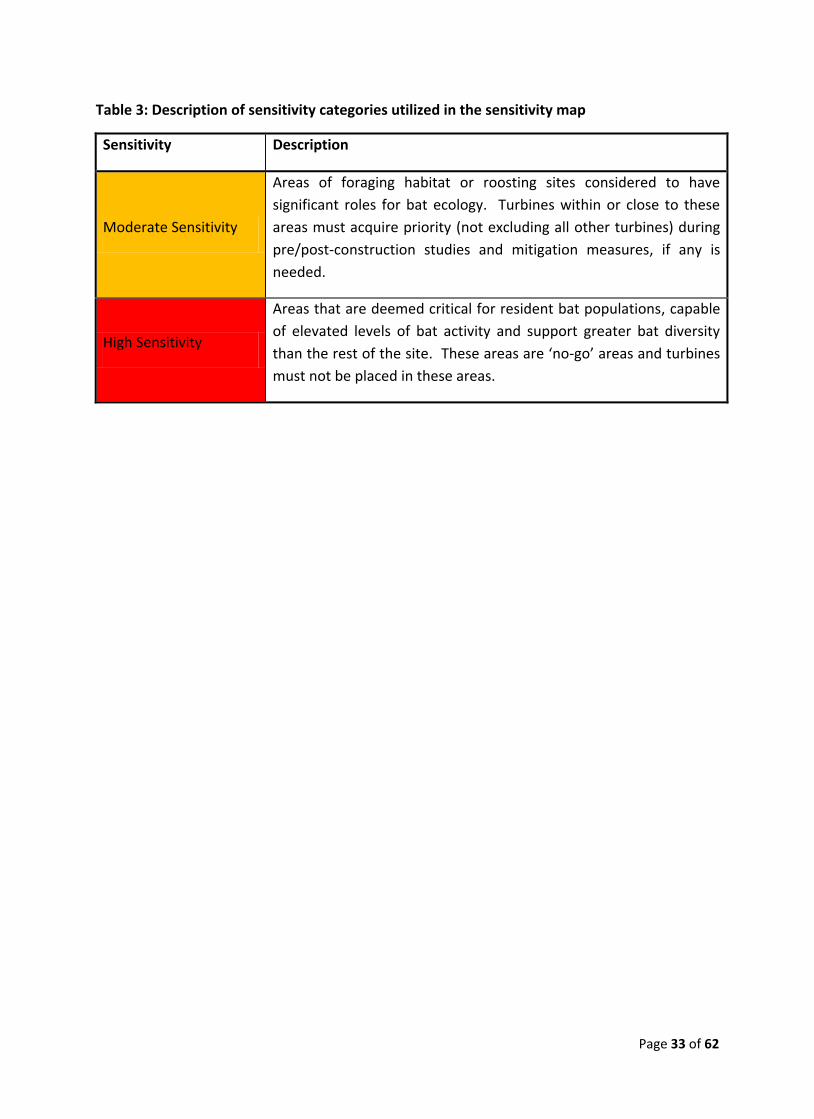
Table 3: Description of sensitivity categories utilized in the sensitivity map
Sensitivity Description
Moderate Sensitivity
Areas of foraging habitat or roosting sites considered to have
significant roles for bat ecology. Turbines within or close to these
areas must acquire priority (not excluding all other turbines) during
pre/post-construction studies and mitigation measures, if any is
needed.
High Sensitivity
Areas that are deemed critical for resident bat populations, capable
of elevated levels of bat activity and support greater bat diversity
than the rest of the site. These areas are ‘no-go’ areas and turbines
must not be placed in these areas.
Page 34 of 62
Moderate bat sensitivity area Site boundary
High bat sensitivity area
Figure 12: Bat sensitivity map of the Noupoort site.
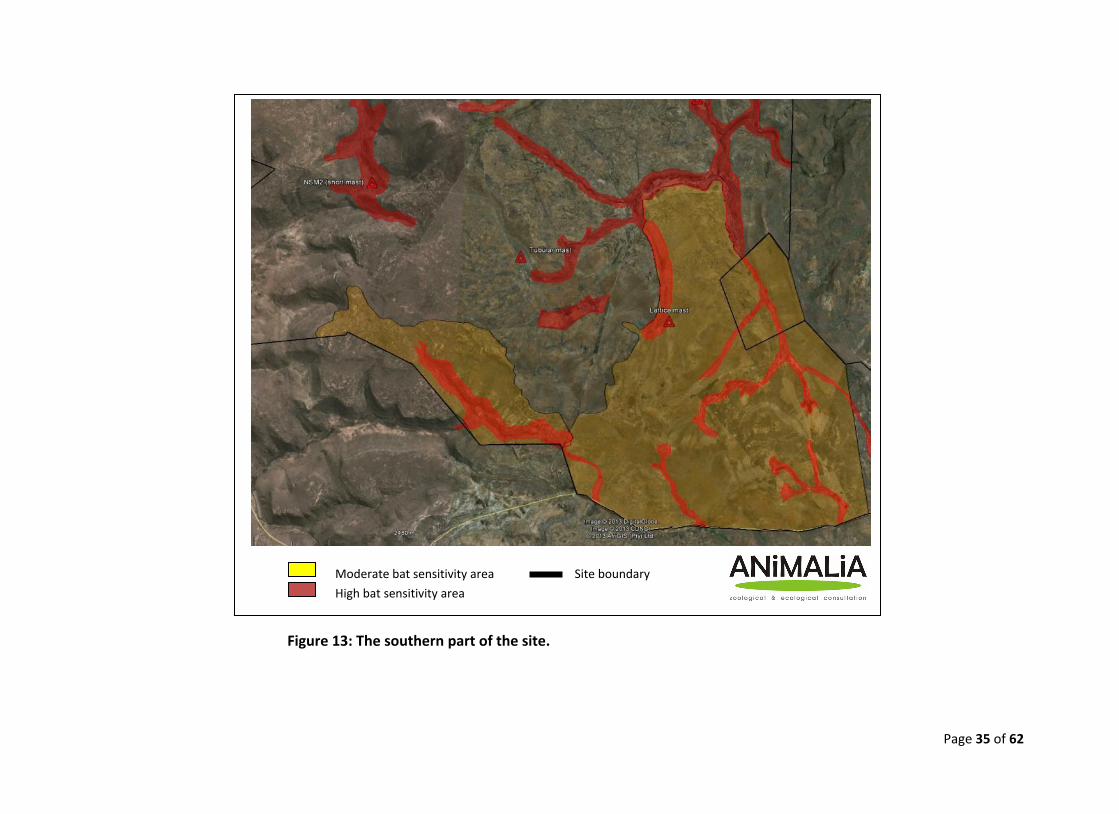
Page 35 of 62
Moderate bat sensitivity area Site boundary
High bat sensitivity area
Figure 13: The southern part of the site.

Page 36 of 62
2.7 Passive data
Ta = Tadarida aegyptiaca; Nc = Neoromicia capensis; Mn/Mini = Miniopterus natalensis;
Mt = Myotis tricolor
2.7.1 Second report
Time period of report 15 December 2011 - 29 March 2012
Time period of data acquisition- NSM1
15 December 2011 - 26 January 2012
Time period of data acquisition- NSM2
15 December 2011 - 29 March 2012
Table 4: Bat species detected with the passive systems and during transects as well as their respective conservation status.
Scientific name Common name Conservation status
Miniopterus natalensis Natal long-fingered bat Near Threatened
Neoromicia capensis Cape serotine Least Concern
Tadarida aegyptiaca Egyptian free-tailed bat Least Concern
Average bat passes/night
Figure 14: Average bat triggers/night detected at NSM1 short mast for all bat detector nights. Note the abnormally low activity for January 2012, emphasising the unreliability of the systems.
14.45
0.57
0
2
4
6
8
10
12
14
16
December January
No
. of
Bat
Tri
gge
rs
Monthly Averages of Bat Activity per night -NSM1
Average Bat Triggers per night
Page 37 of 62
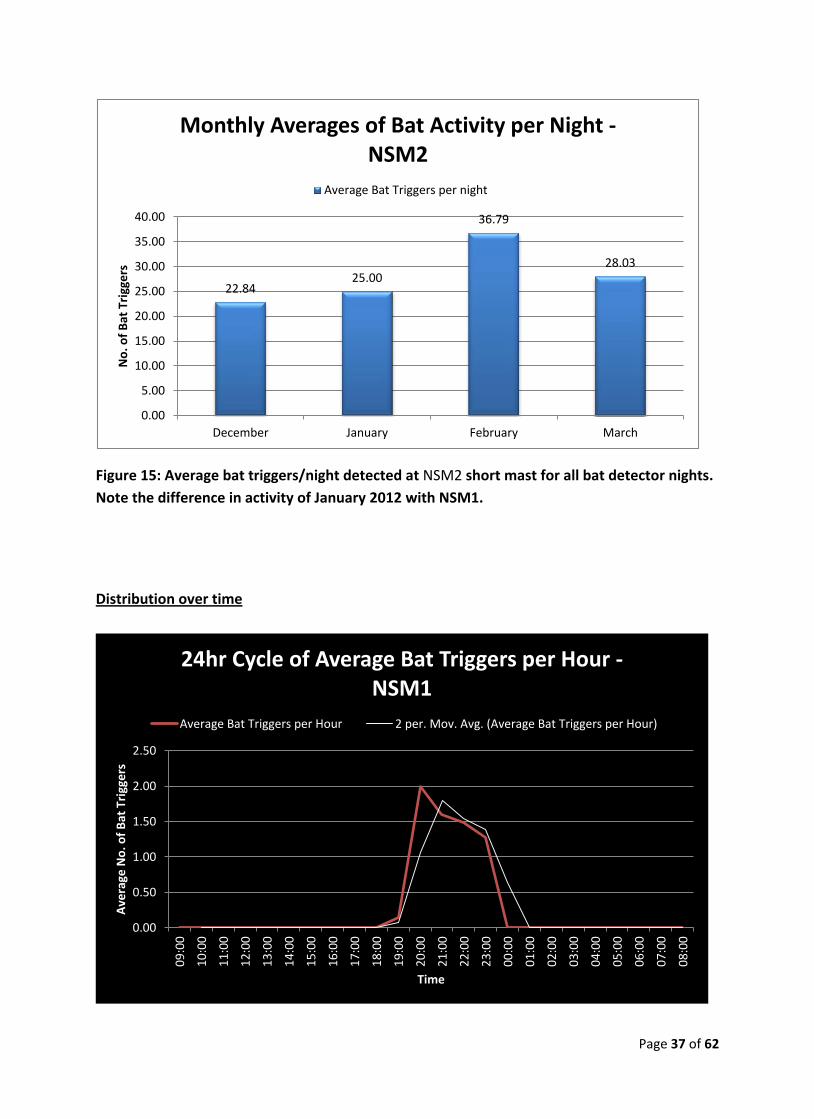
Figure 15: Average bat triggers/night detected at NSM2 short mast for all bat detector nights.
Note the difference in activity of January 2012 with NSM1.
Distribution over time
22.8425.00
36.79
28.03
0.00
5.00
10.00
15.00
20.00
25.00
30.00
35.00
40.00
December January February March
No
. of
Bat
Tri
gge
rsMonthly Averages of Bat Activity per Night -
NSM2
Average Bat Triggers per night
0.00
0.50
1.00
1.50
2.00
2.50
09
:00
10
:00
11
:00
12
:00
13
:00
14
:00
15
:00
16
:00
17
:00
18
:00
19
:00
20
:00
21
:00
22
:00
23
:00
00
:00
01
:00
02
:00
03
:00
04
:00
05
:00
06
:00
07
:00
08
:00
Ave
rage
No
. of
Bat
Tri
gge
rs
Time
24hr Cycle of Average Bat Triggers per Hour -NSM1
Average Bat Triggers per Hour 2 per. Mov. Avg. (Average Bat Triggers per Hour)
Page 38 of 62
Figure 16: Temporal (time) distribution of total bat passes over a 24 hour cycle for the sampling period, by the NSM1 short mast.
Figure 17: Temporal (time) distribution of total bat passes over a 24 hour cycle for the sampling period, by the NSM2 short mast.
Figure 18: Mean nightly distribution of bat activity by the NSM1 short mast.
0.00
1.00
2.00
3.00
4.00
5.00
6.00
7.00
8.00
09
:00
10
:00
11
:00
12
:00
13
:00
14
:00
15
:00
16
:00
17
:00
18
:00
19
:00
20
:00
21
:00
22
:00
23
:00
00
:00
01
:00
02
:00
03
:00
04
:00
05
:00
06
:00
07
:00
08
:00
Ave
rage
No
. of
Bat
Tri
gge
rs
Time
24hr Cycle of Average Bat Triggers per Hour -NSM2
Average Bat Triggers per Hour 2 per. Mov. Avg. (Average Bat Triggers per Hour)
0
10
20
30
40
50
60
70
80
20
11
/12
/15
20
11
/12
/17
20
11
/12
/19
20
11
/12
/21
20
11
/12
/23
20
11
/12
/25
20
11
/12
/27
20
11
/12
/29
20
11
/12
/31
20
12
/01
/02
20
12
/01
/04
20
12
/01
/06
20
12
/01
/08
20
12
/01
/10
20
12
/01
/12
20
12
/01
/14
20
12
/01
/16
20
12
/01
/18
20
12
/01
/20
20
12
/01
/22
20
12
/01
/24
20
12
/01
/26
No
. of
Bat
Tri
gge
rs
Nightly Bat Activity - NSM1
Bat Triggers

Page 39 of 62
Figure 19: Mean nightly distribution of bat activity by the NSM2 short mast, note the extremely low activity of Miniopterus natalensis.
2.7.2 Third report
Please note that both microphones at the met mast was dysfunctional, but with no visible damage of
any kind, therefore the problem was detected and remediated only during the 3rd visit (middle January
2013). These microphones are being investigated by the supplier.
Time period of data 30 March 2012 - 17 June 2012
Time period of data acquisition- NSM2
18 May 2012 - 17 June 2012
Table 5: Bat species detected with the passive systems and during transects as well as their respective conservation status.
Scientific name Common name Conservation status
Miniopterus natalensis Natal long-fingered bat Near Threatened
Neoromicia capensis Cape serotine Least Concern
Tadarida aegyptiaca Egyptian free-tailed bat Least Concern
0
20
40
60
80
100
120
140
20
11
/12
/15
20
11
/12
/22
20
11
/12
/29
20
12
/01
/05
20
12
/01
/12
20
12
/01
/19
20
12
/01
/26
20
12
/02
/02
20
12
/02
/09
20
12
/02
/16
20
12
/02
/23
20
12
/03
/01
20
12
/03
/08
20
12
/03
/15
20
12
/03
/22
No
. of
Bat
Tri
gge
rsNightly Bat Activity - NSM2
Bat Triggers Miniop Triggers
Page 40 of 62
Average bat passes/night
Figure 20: Average nightly bat passes for each month, note the lower winter activity than recorded in summer and autumn by NSM2.
Distribution over time
Figure 21: Distribution of bat activity over reporting period for NSM2, there is a noticeable decrease from May to June.
0.08 0.00
2.38
0.47
1.15
0.05
3.62
0.53
0.00
0.50
1.00
1.50
2.00
2.50
3.00
3.50
4.00
May June
Ave
rage
bat
pas
ses/
nig
ht
Average nightly bat passes per month- NSM 2
Miniopterus natalensis Neoromicia capensis Tadarida aegyptiaca Total average passes/night
0
5
10
15
20
25
30
20
12
/05
/18
20
12
/05
/20
20
12
/05
/22
20
12
/05
/24
20
12
/05
/26
20
12
/05
/28
20
12
/05
/30
20
12
/06
/01
20
12
/06
/03
20
12
/06
/05
20
12
/06
/07
20
12
/06
/09
20
12
/06
/11
20
12
/06
/13
20
12
/06
/15
20
12
/06
/17
Ave
rage
no
. of
Bat
Tri
gge
rs
Temporal distribution over study period - NSM2
Bat Activity
Page 41 of 62
Figure 22: Activity over an average night of reporting period, a clear increased activity is present at 18:00.
Relations with climatic conditions
Figure 23: Number of NSM2 bat triggers and mean air temperature values, note the increase of bat activity with an increase of temperature on 25 May.
0.00
0.20
0.40
0.60
0.80
1.00
1.200
9:0
0
10
:00
11
:00
12
:00
13
:00
14
:00
15
:00
16
:00
17
:00
18
:00
19
:00
20
:00
21
:00
22
:00
23
:00
00
:00
01
:00
02
:00
03
:00
04
:00
05
:00
06
:00
07
:00
08
:00
Ave
rage
No
. of
Bat
Tri
gge
rsTemporal distribution over avg night- NSM2
Bat activity

Page 42 of 62
Figure 24: Number of NSM2 bat triggers and average humidity.
2.7.3 Fourth report
Time period of data 1 Nov 2012 - 5 Mar 2013 (1 Nov - 21 Dec for tubular mast; 21 Dec - 5 Mar for lattice mast)
Time period of data acquisition- tubular mast
1 Nov 2012 - 21 Dec 2012
Time period of data acquisition- lattice mast
21 Dec 2012 - 5 March 2013
Time period of data acquisition- NSM1
1 November 2012 - 5 March 2013
Time period of data acquisition- NSM2
1 November 2012 - 5 March 2013
Table 6: Bat species detected with the passive systems and during transects as well as their respective conservation status.
Scientific name Common name Conservation status
Miniopterus natalensis Natal long-fingered bat Near Threatened
Neoromicia capensis Cape serotine Least Concern
Tadarida aegyptiaca Egyptian free-tailed bat Least Concern
Myotis tricolor Temminck's hairy myotis Least Concern
Page 43 of 62
Figure 25: Species assemblage recorded at tubular mast. Neoromicia capensis was the most abundant.
Figure 26: Species assemblage recorded at 55m on the met mast. Tadarida aegyptiaca (Egyptian Free-tailed bat) was the most abundant. Note the dramatic change in species assemblages at height.
2% 0%
54%
44%
Relative species assemblages tubular mast
mini Mt Nc Ta
95%
3%1%1%
Relative species assemblages 55m lattice mast
Ta Nc Mt Mini
Page 44 of 62
Figure 27: Species assemblage recorded at 10m on the met mast. Neoromicia capensis was the most abundant.
Figure 28: Species assemblage recorded at NSM1. Neoromicia capensis was the most abundant.
38%
58%
3% 1%
Relative species assemblages 10m lattice mast
Ta Nc Mt Mini
0%
3%
50%
47%
Relative species assemblages NSM1
mini Mt Nc Ta
Page 45 of 62
Figure 29: Species assemblage recorded at NSM2. Tadarida aegyptiaca was the most abundant.
Average bat passes/night
Figure 30: Average nightly bat passes for December is the highest.
1% 3%
40%
56%
Relative species assemblages NSM2
mini Mt Nc Ta
17.022.0
15.7
32.6
0.5 1.10.1 0.1
33.3
55.8
Nov-12 Dec-12
Avg nightly bat passes for each month Tubular Mast
Ta Nc Mini Mt All bats
Page 46 of 62
Figure 31: Average nightly bat passes for December is the highest, but less than closer to the ground.
Figure 32: Average nightly bat passes for March is the highest, overall activity is high and relatively less fluctuating throughout the study period.
3.8
6.8
3.6
1.0
0.2 0.3 0.0 0.00.0 0.1 0.0 0.00.0 0.1 0.0 0.0
4.0
7.2
3.6
1.0
Dec-12 Jan-13 Feb-13 Mar-13
Avg nightly bat passes for each month 55m
Ta Nc Mini Mt All bats
28.921.0
8.3 5.9 4.25.410.8
16.4
26.9
57.8
0.1 0.1 0.0 0.1 0.40.2 0.5 1.1 2.0 1.8
34.7 32.425.8
34.9
64.2
Nov-12 Dec-12 Jan-13 Feb-13 Mar-13
Avg nightly bat passes for each month NSM1
Ta Nc Mini Mt All bats
Page 47 of 62
Figure 33: Average nightly bat passes for November is the highest.
Distribution over time
Figure 34: Distribution of bat activity over reporting period for the tubular mast, there is a noticeable higher activity in December.
33.4 30.5
13.0 12.5
3.0
20.6
10.4
18.512.8 11.0
0.4 0.5 0.1 0.2 0.41.5 0.5 1.5 0.8 0.2
55.9
41.9
33.026.2
14.6
Nov-12 Dec-12 Jan-13 Feb-13 Mar-13
Avg nightly bat passes for each month NSM2
Ta Nc Mini Mt All bats
0
20
40
60
80
100
120
140
160
180
200
20
12
/11
/01
20
12
/11
/03
20
12
/11
/05
20
12
/11
/07
20
12
/11
/09
20
12
/11
/11
20
12
/11
/13
20
12
/11
/15
20
12
/11
/17
20
12
/11
/19
20
12
/11
/21
20
12
/11
/23
20
12
/11
/25
20
12
/11
/27
20
12
/11
/29
20
12
/12
/01
20
12
/12
/03
20
12
/12
/05
20
12
/12
/07
20
12
/12
/09
20
12
/12
/11
20
12
/12
/13
20
12
/12
/15
20
12
/12
/17
20
12
/12
/19
20
12
/12
/21
Bat
pas
ses
Temporal distribution over study period tubular
Miniopterus natalensis Myotis tricolor Neoromicia capensis Tadarida aegyptiaca
Page 48 of 62
Figure 35: Distribution of bat activity over reporting period, activity declined from mid January onwards.
Figure 36: Distribution of bat activity over reporting period.
0
10
20
30
40
50
20
12
/12
/21
20
12
/12
/23
20
12
/12
/27
20
12
/12
/29
20
12
/12
/31
20
13
/01
/03
20
13
/01
/06
20
13
/01
/08
20
13
/01
/10
20
13
/01
/14
20
13
/01
/16
20
13
/01
/20
20
13
/01
/23
20
13
/01
/25
20
13
/01
/30
20
13
/02
/01
20
13
/02
/09
20
13
/02
/11
20
13
/02
/13
20
13
/02
/15
20
13
/02
/19
20
13
/02
/25
20
13
/02
/27
20
13
/03
/04
Bat
pas
ses
Temporal distribution over study period, 55m lattice
Tadarida aegyptiaca Neoromicia capensis Myotis tricolor Miniopterus natalensis
0
10
20
30
40
50
60
70
80
20
12
/12
/21
20
12
/12
/23
20
12
/12
/25
20
12
/12
/27
20
12
/12
/29
20
12
/12
/31
20
13
/01
/02
20
13
/01
/05
20
13
/01
/07
20
13
/01
/09
20
13
/01
/13
20
13
/01
/15
20
13
/01
/17
20
13
/01
/19
20
13
/01
/21
20
13
/01
/23
20
13
/01
/25
20
13
/01
/30
20
13
/02
/02
20
13
/02
/05
20
13
/02
/07
20
13
/02
/09
20
13
/02
/11
20
13
/02
/13
20
13
/02
/15
20
13
/02
/17
20
13
/02
/19
20
13
/02
/21
20
13
/02
/23
20
13
/02
/25
20
13
/02
/27
20
13
/03
/03
20
13
/03
/05
Bat
pas
ses
Temporal distribution over study period, 10m lattice
Tadarida aegyptiaca Neoromicia capensis Myotis tricolor Miniopterus natalensis
Page 49 of 62
Figure 37: Distribution of bat activity over reporting period.
Figure 38: Distribution of bat activity over reporting period,.
0
20
40
60
80
100
120
140
20
12
/11
/02
20
12
/11
/06
20
12
/11
/10
20
12
/11
/14
20
12
/11
/18
20
12
/11
/22
20
12
/11
/26
20
12
/11
/30
20
12
/12
/04
20
12
/12
/08
20
12
/12
/12
20
12
/12
/16
20
12
/12
/20
20
12
/12
/24
20
12
/12
/28
20
13
/01
/01
20
13
/01
/05
20
13
/01
/09
20
13
/01
/13
20
13
/01
/17
20
13
/01
/21
20
13
/01
/25
20
13
/01
/29
20
13
/02
/02
20
13
/02
/06
20
13
/02
/10
20
13
/02
/14
20
13
/02
/19
20
13
/02
/23
20
13
/02
/27
20
13
/03
/03
Bat
pas
ses
Temporal distribution over study period NSM1
Miniopterus natalensis Myotis tricolor Neoromicia capensis Tadarida aegyptiaca
0
50
100
150
200
250
20
12
/11
/01
20
12
/11
/05
20
12
/11
/09
20
12
/11
/13
20
12
/11
/18
20
12
/11
/22
20
12
/11
/26
20
12
/11
/30
20
12
/12
/04
20
12
/12
/08
20
12
/12
/12
20
12
/12
/16
20
12
/12
/20
20
12
/12
/24
20
12
/12
/28
20
13
/01
/01
20
13
/01
/05
20
13
/01
/09
20
13
/01
/14
20
13
/01
/18
20
13
/01
/22
20
13
/01
/26
20
13
/01
/31
20
13
/02
/04
20
13
/02
/08
20
13
/02
/12
20
13
/02
/16
20
13
/02
/20
20
13
/02
/24
20
13
/02
/28
20
13
/03
/04
Bat
pas
ses
Temporal distribution over study period NSM2
Miniopterus natalensis Myotis tricolor Neoromicia capensis Tadarida aegyptiaca

Page 50 of 62
Figure 39: Activity over an average night of reporting period.
Figure 40: Activity over an average night of reporting period. Activity is relatively spread.
0
10
20
30
40
50
60
70
80
90
00
:00
00
:20
00
:40
01
:00
01
:20
01
:40
02
:00
02
:20
02
:40
03
:00
03
:30
03
:50
04
:10
19
:10
19
:30
19
:50
20
:10
20
:30
20
:50
21
:10
21
:30
21
:50
22
:10
22
:30
22
:50
23
:10
23
:30
23
:50
03
:10
04
:50
05
:00
18
:50
05
:40
Bat
pas
ses
Temporal distribution over an avg night, tubular
Miniopterus natalensis Myotis tricolor Neoromicia capensis Tadarida aegyptiaca
0
5
10
15
20
25
00
:00
00
:20
00
:40
01
:00
01
:20
01
:40
02
:00
02
:20
02
:40
03
:00
03
:30
03
:50
04
:10
19
:10
19
:30
19
:50
20
:10
20
:30
20
:50
21
:10
21
:30
21
:50
22
:10
22
:30
22
:50
23
:10
23
:30
23
:50
Bat
pas
ses
Temporal distribution over an avg night, 55m
Tadarida aegyptiaca Neoromicia capensis Myotis tricolor Miniopterus natalensis

Page 51 of 62
Figure 41: Activity over an average night of reporting period.
Figure 42: Activity over an average night of reporting period.
0
5
10
15
20
25
30
35
40
00
:00
00
:20
00
:40
01
:00
01
:20
01
:40
02
:00
02
:20
02
:40
03
:00
03
:30
03
:50
04
:10
19
:10
19
:30
19
:50
20
:10
20
:30
20
:50
21
:10
21
:30
21
:50
22
:10
22
:30
22
:50
23
:10
23
:30
23
:50
04
:30
04
:40
05
:10
Bat
pas
ses
Temporal distribution over an avg night, 10m lattice
Tadarida aegyptiaca Neoromicia capensis Myotis tricolor Miniopterus natalensis
0
20
40
60
80
100
120
00
:00
00
:20
00
:40
01
:00
01
:20
01
:40
02
:00
02
:20
02
:40
03
:00
03
:30
03
:50
04
:10
19
:10
19
:30
19
:50
20
:10
20
:30
20
:50
21
:10
21
:30
21
:50
22
:10
22
:30
22
:50
23
:10
23
:30
23
:50
03
:10
04
:50
05
:00
Bat
pas
ses
Temporal distribution over an avg night NSM1
Miniopterus natalensis Myotis tricolor Neoromicia capensis Tadarida aegyptiaca
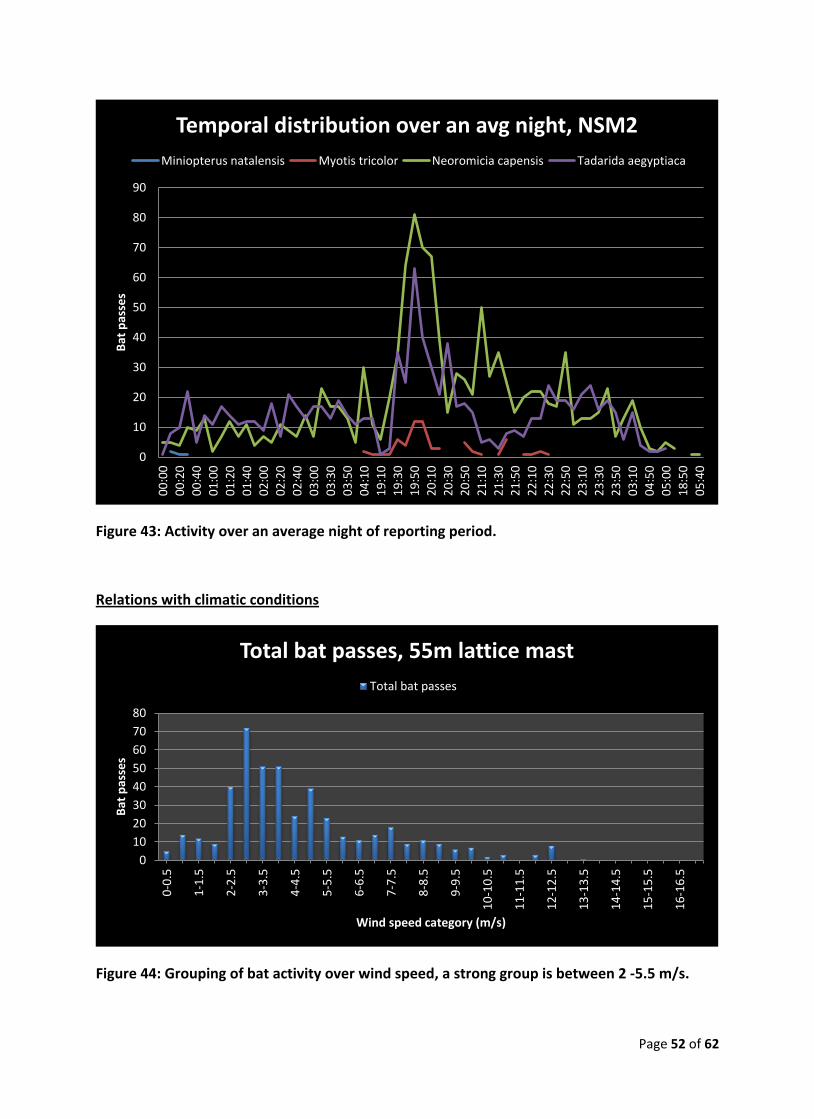
Page 52 of 62
Figure 43: Activity over an average night of reporting period.
Relations with climatic conditions
Figure 44: Grouping of bat activity over wind speed, a strong group is between 2 -5.5 m/s.
0
10
20
30
40
50
60
70
80
90
00
:00
00
:20
00
:40
01
:00
01
:20
01
:40
02
:00
02
:20
02
:40
03
:00
03
:30
03
:50
04
:10
19
:10
19
:30
19
:50
20
:10
20
:30
20
:50
21
:10
21
:30
21
:50
22
:10
22
:30
22
:50
23
:10
23
:30
23
:50
03
:10
04
:50
05
:00
18
:50
05
:40
Bat
pas
ses
Temporal distribution over an avg night, NSM2
Miniopterus natalensis Myotis tricolor Neoromicia capensis Tadarida aegyptiaca
0
10
20
30
40
50
60
70
80
0-0
.5
1-1
.5
2-2
.5
3-3
.5
4-4
.5
5-5
.5
6-6
.5
7-7
.5
8-8
.5
9-9
.5
10
-10
.5
11
-11
.5
12
-12
.5
13
-13
.5
14
-14
.5
15
-15
.5
16
-16
.5
Bat
pas
ses
Wind speed category (m/s)
Total bat passes, 55m lattice mast
Total bat passes
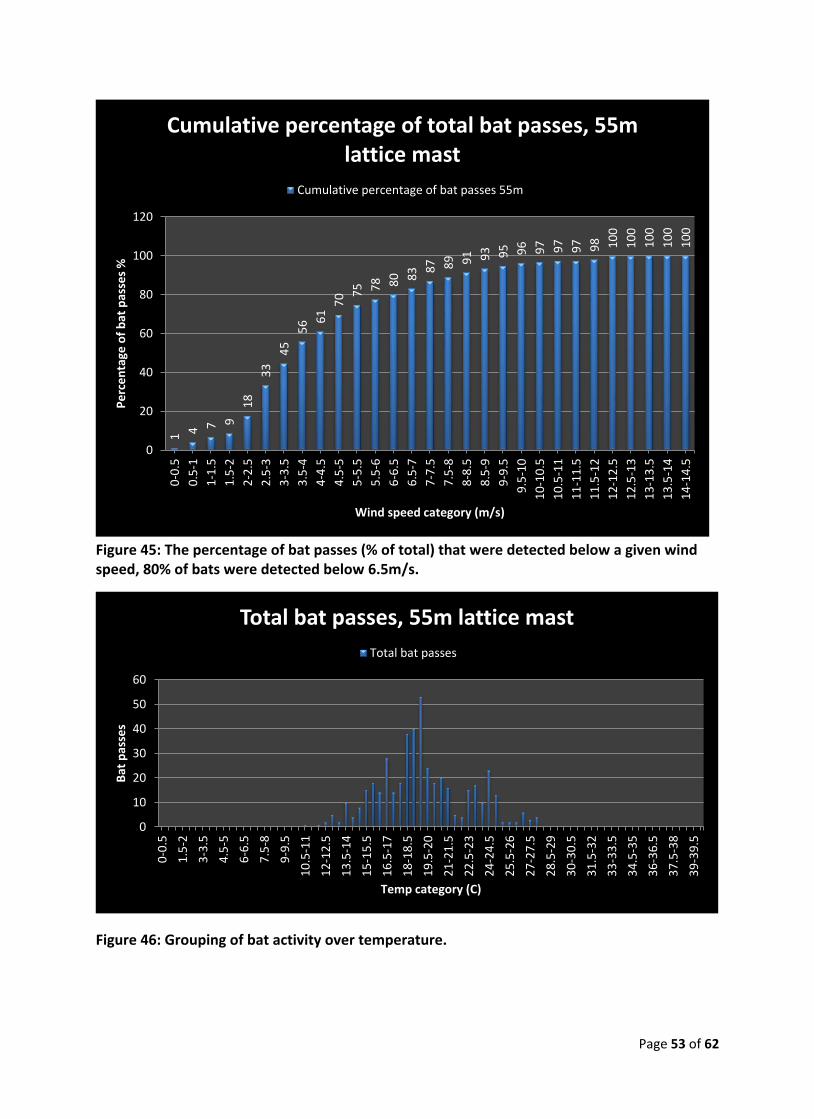
Page 53 of 62
Figure 45: The percentage of bat passes (% of total) that were detected below a given wind speed, 80% of bats were detected below 6.5m/s.
Figure 46: Grouping of bat activity over temperature.
1 4 7 9
18
33
45
56 6
1
70 7
5 78 80 83 8
7 89 91 93 95 96 97 97
97 98 10
0
10
0
10
0
10
0
10
0
0
20
40
60
80
100
120
0-0
.5
0.5
-1
1-1
.5
1.5
-2
2-2
.5
2.5
-3
3-3
.5
3.5
-4
4-4
.5
4.5
-5
5-5
.5
5.5
-6
6-6
.5
6.5
-7
7-7
.5
7.5
-8
8-8
.5
8.5
-9
9-9
.5
9.5
-10
10
-10
.5
10
.5-1
1
11
-11
.5
11
.5-1
2
12
-12
.5
12
.5-1
3
13
-13
.5
13
.5-1
4
14
-14
.5
Pe
rce
nta
ge o
f b
at p
asse
s %
Wind speed category (m/s)
Cumulative percentage of total bat passes, 55m lattice mast
Cumulative percentage of bat passes 55m
0
10
20
30
40
50
60
0-0
.5
1.5
-2
3-3
.5
4.5
-5
6-6
.5
7.5
-8
9-9
.5
10
.5-1
1
12
-12
.5
13
.5-1
4
15
-15
.5
16
.5-1
7
18
-18
.5
19
.5-2
0
21
-21
.5
22
.5-2
3
24
-24
.5
25
.5-2
6
27
-27
.5
28
.5-2
9
30
-30
.5
31
.5-3
2
33
-33
.5
34
.5-3
5
36
-36
.5
37
.5-3
8
39
-39
.5
Bat
pas
ses
Temp category (C)
Total bat passes, 55m lattice mast
Total bat passes
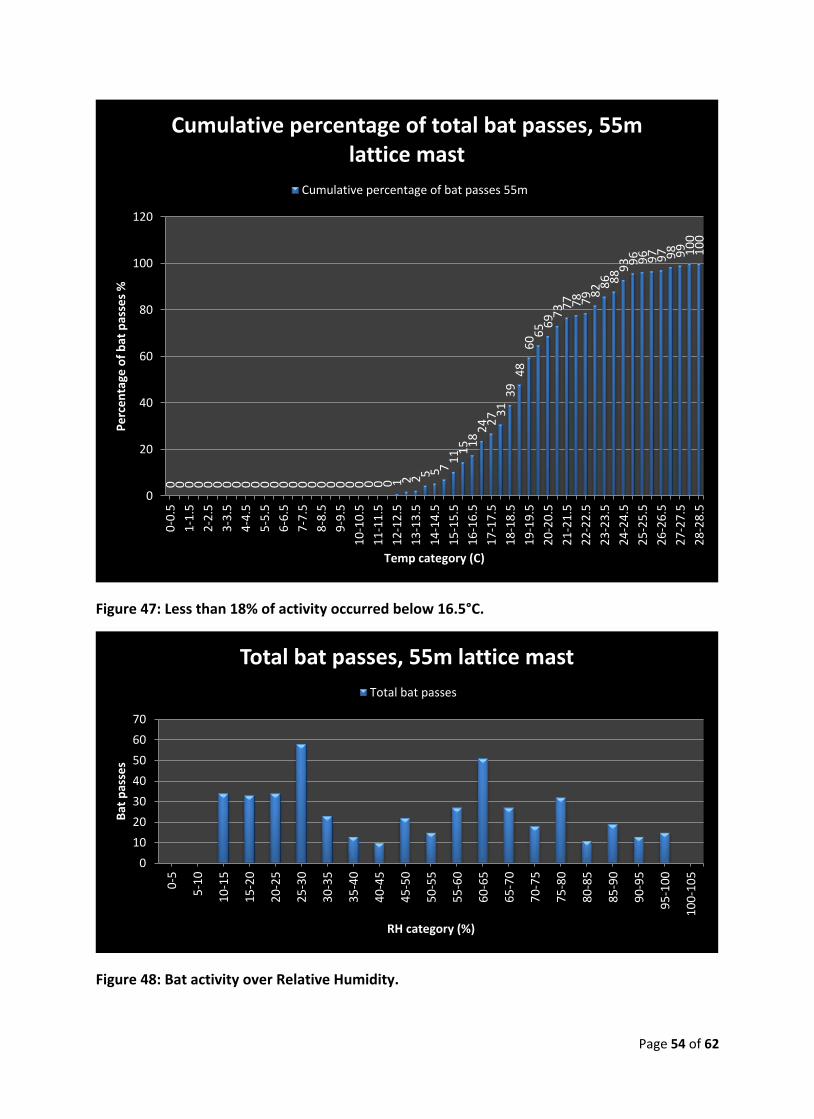
Page 54 of 62
Figure 47: Less than 18% of activity occurred below 16.5°C.
Figure 48: Bat activity over Relative Humidity.
0 0 0 0 0 0 0 0 0 0 0 0 0 0 0 0 0 0 0 0 0 0 0 0 1 2 2 5 5 71
1 15 1
82
4 27 3
13
94
86
0 65 6
9 73 7
7 78 79 8
2 86 88 9
3 96 96 97 97 98 99 10
01
00
0
20
40
60
80
100
120
0-0
.5
1-1
.5
2-2
.5
3-3
.5
4-4
.5
5-5
.5
6-6
.5
7-7
.5
8-8
.5
9-9
.5
10
-10
.5
11
-11
.5
12
-12
.5
13
-13
.5
14
-14
.5
15
-15
.5
16
-16
.5
17
-17
.5
18
-18
.5
19
-19
.5
20
-20
.5
21
-21
.5
22
-22
.5
23
-23
.5
24
-24
.5
25
-25
.5
26
-26
.5
27
-27
.5
28
-28
.5
Pe
rce
nta
ge o
f b
at p
asse
s %
Temp category (C)
Cumulative percentage of total bat passes, 55m lattice mast
Cumulative percentage of bat passes 55m
0
10
20
30
40
50
60
70
0-5
5-1
0
10
-15
15
-20
20
-25
25
-30
30
-35
35
-40
40
-45
45
-50
50
-55
55
-60
60
-65
65
-70
70
-75
75
-80
80
-85
85
-90
90
-95
95
-10
0
10
0-1
05
Bat
pas
ses
RH category (%)
Total bat passes, 55m lattice mast
Total bat passes
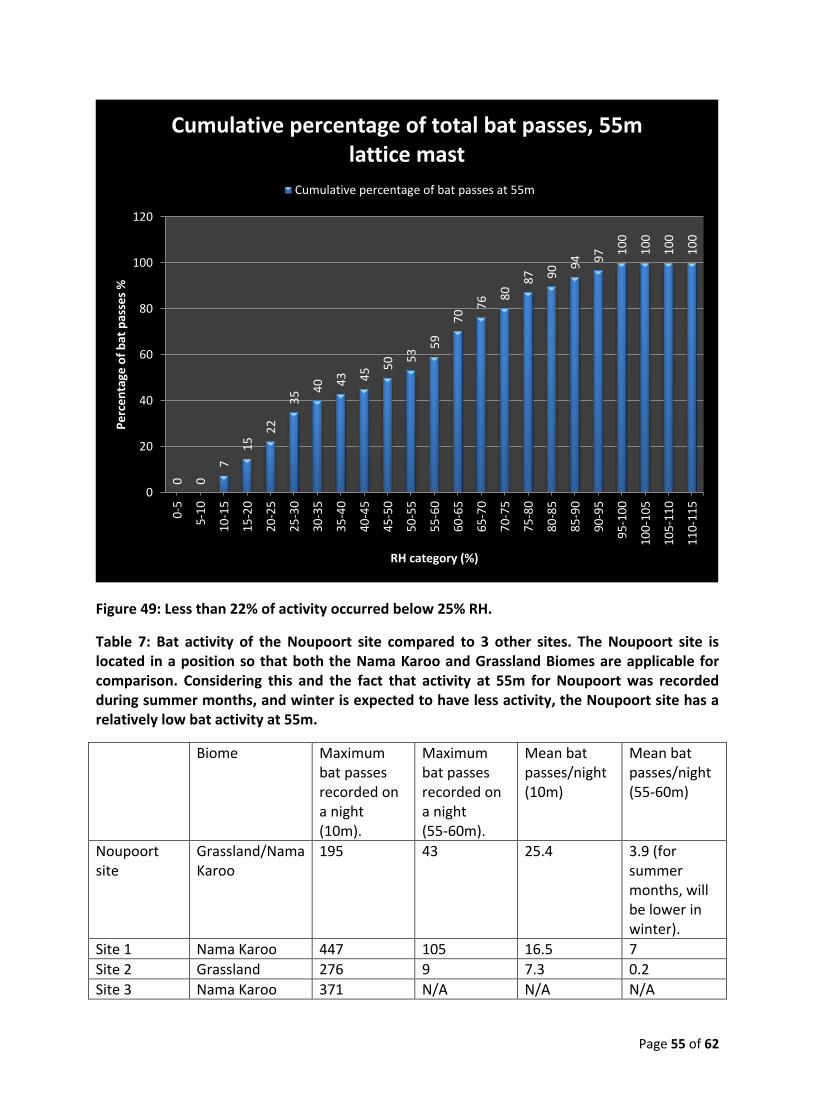
Page 55 of 62
Figure 49: Less than 22% of activity occurred below 25% RH.
Table 7: Bat activity of the Noupoort site compared to 3 other sites. The Noupoort site is located in a position so that both the Nama Karoo and Grassland Biomes are applicable for comparison. Considering this and the fact that activity at 55m for Noupoort was recorded during summer months, and winter is expected to have less activity, the Noupoort site has a relatively low bat activity at 55m.
Biome Maximum bat passes recorded on a night (10m).
Maximum bat passes recorded on a night (55-60m).
Mean bat passes/night (10m)
Mean bat passes/night (55-60m)
Noupoort site
Grassland/Nama Karoo
195 43 25.4 3.9 (for summer months, will be lower in winter).
Site 1 Nama Karoo 447 105 16.5 7
Site 2 Grassland 276 9 7.3 0.2
Site 3 Nama Karoo 371 N/A N/A N/A
0 0
7
15
22
35 4
0 43 45 5
0 53
59
70
76 8
0
87 90 9
4 97 1
00
10
0
10
0
10
0
0
20
40
60
80
100
120
0-5
5-1
0
10
-15
15
-20
20
-25
25
-30
30
-35
35
-40
40
-45
45
-50
50
-55
55
-60
60
-65
65
-70
70
-75
75
-80
80
-85
85
-90
90
-95
95
-10
0
10
0-1
05
10
5-1
10
11
0-1
15
Pe
rce
nta
ge o
f b
at p
asse
s %
RH category (%)
Cumulative percentage of total bat passes, 55m lattice mast
Cumulative percentage of bat passes at 55m
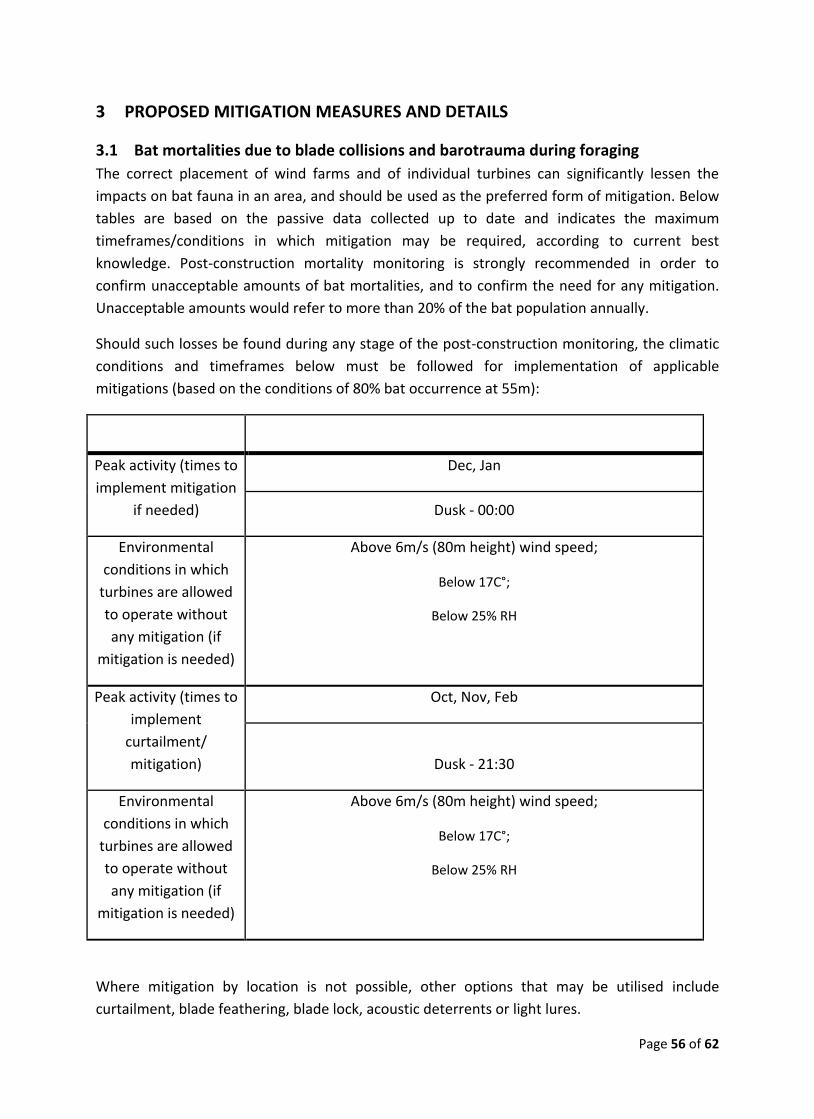
Page 56 of 62
3 PROPOSED MITIGATION MEASURES AND DETAILS
3.1 Bat mortalities due to blade collisions and barotrauma during foraging
The correct placement of wind farms and of individual turbines can significantly lessen the
impacts on bat fauna in an area, and should be used as the preferred form of mitigation. Below
tables are based on the passive data collected up to date and indicates the maximum
timeframes/conditions in which mitigation may be required, according to current best
knowledge. Post-construction mortality monitoring is strongly recommended in order to
confirm unacceptable amounts of bat mortalities, and to confirm the need for any mitigation.
Unacceptable amounts would refer to more than 20% of the bat population annually.
Should such losses be found during any stage of the post-construction monitoring, the climatic
conditions and timeframes below must be followed for implementation of applicable
mitigations (based on the conditions of 80% bat occurrence at 55m):
Peak activity (times to
implement mitigation
if needed)
Dec, Jan
Dusk - 00:00
Environmental
conditions in which
turbines are allowed
to operate without
any mitigation (if
mitigation is needed)
Above 6m/s (80m height) wind speed;
Below 17C°;
Below 25% RH
Peak activity (times to
implement
curtailment/
mitigation)
Oct, Nov, Feb
Dusk - 21:30
Environmental
conditions in which
turbines are allowed
to operate without
any mitigation (if
mitigation is needed)
Above 6m/s (80m height) wind speed;
Below 17C°;
Below 25% RH
Where mitigation by location is not possible, other options that may be utilised include
curtailment, blade feathering, blade lock, acoustic deterrents or light lures.

Page 57 of 62
Curtailment is when the blades are locked until a preset wind speed is reached, thereafter the
turbine functions normally. Blade feathering can be applied to slow down blade tip speed
between the manufacturers cut in speed and the mitigation cut in speed, still allowing partial
operation below the mitigation cut in speed.
Blade feathering can also be applied to slow down the blade tip before any cut in speed is
reached, instead of allowing free rotation below the manufacturers cut in speed.
Blade locking can be applied to render blades motionless below the manufacturers cut in speed,
and not allow free rotation without the gearbox engaged.
Acoustic deterrents are a developing technology and will need investigation closer to time of
operation.
Light lures refer to the concept where strong lights are placed on the periphery (or only a few
sides) of the wind farm to lure insects and therefore bats away from the turbines. The long term
effects on bat populations and local ecology of this method is unknown.
Page 58 of 62
4 CONCLUSION
This is the fourth report linked to a long term preconstruction monitoring study.
Four different species were detected by the two passive monitoring systems, with only
Miniopterus natalensis having a Near Threatened conservation status (in negligibly low
numbers). Neoromicia capensis and Tadarida aegyptiaca are the most common and abundant
insectivorous bat species found across South Africa. They dominated the bat assemblage
detected by the monitoring systems, and T. aegyptiaca dominates activity at 55m. The common
and more abundant species are of value to the local ecosystems as they provide important
ecological services, due to their greater abundance than Red Listed species. These two species
have a conservation category of Least Concern. The overall bat diversity is low and the site is not
perceived as a bat hot spot.
According to the data gathered, the migrating species does not occur in high enough numbers
on site to indicate any migrations.
No mass roosting locations were discovered , only habitat capable of hosting smaller bat roosts, which is demarcated as sensitive in the sensitivity map. Referring to Table 7, the Noupoort site is located in a position so that both the Nama Karoo and Grassland Biomes are applicable for comparison. Considering this and the fact that activity at 55m for Noupoort was recorded during summer months, and winter is expected to have less activity, the Noupoort site has a relatively low bat activity at 55m.
The fluctuation of bat activity indicates a strong dependency on nightly climatic conditions, the
relationship of these conditions with bat activity is indicated in Sections 2 & 3. Comparison of
the short masts (NSM1 & 2) with the tubular and lattice mast systems, indicate bat activity to
be noticeably lower in the Karoo Escarpment Grassland (area of proposed layout) than in the
Tarkastad Montane Shrubland. This concludes that the habitat of the site chosen for the
proposed turbine layout has the lowest bat activity and diversity relative to the rest of the
site.
There is also a dramatic change in species assemblages and activity at height. Microphones at
10m recorded mainly the smaller Neoromicia capensis while the microphone at 55m recorded
95% the stronger flying Tadarida aegyptiaca. Overall bat activity was 2.8 times less at 55m than
at 10m on the lattice mast, and is expected to decrease in numbers and frequency with an
increase in height.
The proposed mitigation measures in section 3.1 are the maximum mitigations recommended
to be implemented and are likely to be only applicable to turbines within the moderate bat
sensitivity area as displayed in Figure 12, only if post construction monitoring indicates
unacceptable bat losses (more than 20% of the population annually).

Page 59 of 62
Should such losses be found during any stage of the post-construction monitoring, the climatic
conditions and timeframes in Section 3 must be followed for implementation of applicable
mitigations, only at the specific turbines identified to be the cause of unacceptable bat losses
(based on the conditions of 80% bat occurrence at 55m).

Page 60 of 62
5 REFERENCES
I. African Chiroptera Report. (2010). African Chiroptera Project, Pretoria. ixviii, 4325.
II. Belwood, J.J. & Fenton, M.B. (1976). Variation in the diet of Myotis lucifugus (Chiroptera:
Vespertilionidae). Can. J. Zool. 54: 1674-1678.
III. Black, H.L. (1974). A north temperate bat community: structure and prey populations. J.
Mammal 55: 138-157.
IV. Cryan, P.M. and Barclay, R.M. (2009). Causes of bat fatalities at wind turbines: hypotheses and
predictions. Journal of Mammalogy 90(6):1330–1340.
V. Mitchell-Jones, T. and Carlin, C. (2009). Bats and onshore wind turbines, Interim guidance,
Natural England Technical Information Note TIN051, 9pp. Available from:
www.naturalengland.org.uk (Accessed April 2010).
VI. Monadjem, A., Taylor, P.J., Cotterill, F.P.D. & Schoeman, M.C. (2010). Bats of southern
and central Africa – A biogeographic and taxonomic synthesis, Ultra Litho (Pty) Ltd,
Johannesburg.
VII. MUCINA L & RUTHERFORD MC, 2006, The Vegetation of South Africa, Lesotho and Swaziland-
Strelitzia 19, South African National Biodiversity Institute, Pretoria.
VIII. RODRIGUES LL, BACH MJ, DUBOURG-SAVAGE, GOODWIN J, & HARBUSCH C, 2008, Guidelines for
consideration of bats in wind farm projects, EUROBATS Publication Series No. 3(English version),
UNEP/EUROBATS Secretariat, Bonn, Germany, 51pp.
IX. Sowler, S. and Stoffberg, S. (2012). South African good practice guidelines for surveying bats in
wind farm developments. Endangered Wildlife Trust.
X. Vincent, S., Nemoz, M. & Aulagnier, S. (2011). Activity and foraging habitats of Miniopterus
schreibersii (Chiroptera, Miniopteridae) in Southern France: Implications for its conservation.
Hystrix It. J. Mamm 22(1) 2011: 57-72.

Page 61 of 62
Werner Marais
Zoologist and Ecologist MSc (Biodiversity & Conservation, UJ)
Pr.Sci.Nat. – SACNASP
(Zoological Science)

Page 62 of 62
DISCLAIMER
The services carried out and reported in this document have been done as accurately and
scientifically as allowed by the resources and knowledge available to Animalia Zoological &
Ecological Consultation CC at the time on which the requested services were provided to the
client. Animalia Zoological & Ecological Consultation CC reserves the right to modify aspects of
the document including the recommendations if and when new information may become
available from ongoing research or further work in this field, or pertaining to this
investigation.
Although great care and pride have been taken to carry out the requested services accurately
and professionally, and to represent the relevant data in a clear and concise manner; no
responsibility or liability will be accepted by Animalia Zoological & Ecological Consultation CC.
And the client, by receiving this document, indemnifies Animalia Zoological & Ecological
Consultation CC and its staff against all claims, demands, losses, liabilities, costs, damages and
expenses arising from or in connection with services rendered, directly or indirectly by
Animalia Zoological & Ecological Consultation CC; and by the use of the information contained
in this document. The primary goal of Animalia’s services is to provide professionalism that is
to the benefit of the environment as well as the community.
COPYRIGHT
This document may not be altered or added to without the prior written consent of the author.
This also refers to electronic copies of this document which are supplied for the purposes of
inclusion as part of other reports. Similarly, any recommendations, statements or conclusions
drawn from or based on this document must make reference to this document.


