
Food and MoodMetabolic Underpinnings of CNS Function
Kevin Niswender MD, PhDDiabetes, Endocrinology and Metabolism
Vanderbilt School of Medicine Tennessee Valley Healthcare System

PW: Diabetes Natural History
Aug '05
Feb '0
6
Jun '0
7
Nov '08
May '0
9
Jan '1
0
Dec '1
0
200
225
250
4
6
8
10HbA1C
Wei
ght
(lbs) H
bA1c (%
)
Aug '05
Feb '0
6
Jun '0
7
Nov '08
May '0
9
Jan '1
0
Dec '1
0
200
225
250
4
6
8
10HbA1C
WeightWei
ght
(lbs) HbA
1c (%)
depression/
sleep
substance
cognition

Diabetes Outcomes: Epidemiology(Niswender clinic)
1) HbA1C 6.0-6.5 with little effort or input from me.
2) HbA1C 7.0-8.0 with lots of effort on part of patient, me, and my team.
3) HbA1C >9.0 despite lots of visits, many hours, me, educator, dietician, pleading, bribery, threats, guilt trips etc…..

Diabesity barriers
Diabetes
Obesity
DepressionAddiction
Cognition

Addiction
Cognition
Obesity Depression
Diabesity barriers
Diabetes
inflammation
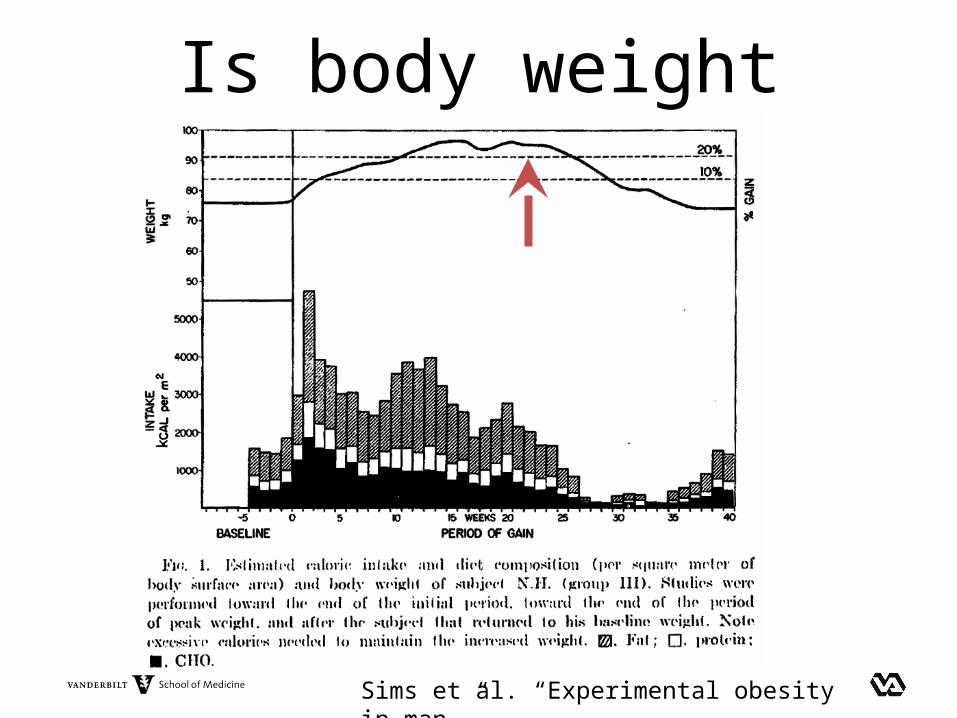
Is body weight regulated?
Sims et al. “Experimental obesity in man.”

Adiposity Negative Feedback Signalingregulation of “metabolic drive”
Schwartz MW et al., Nature 2000
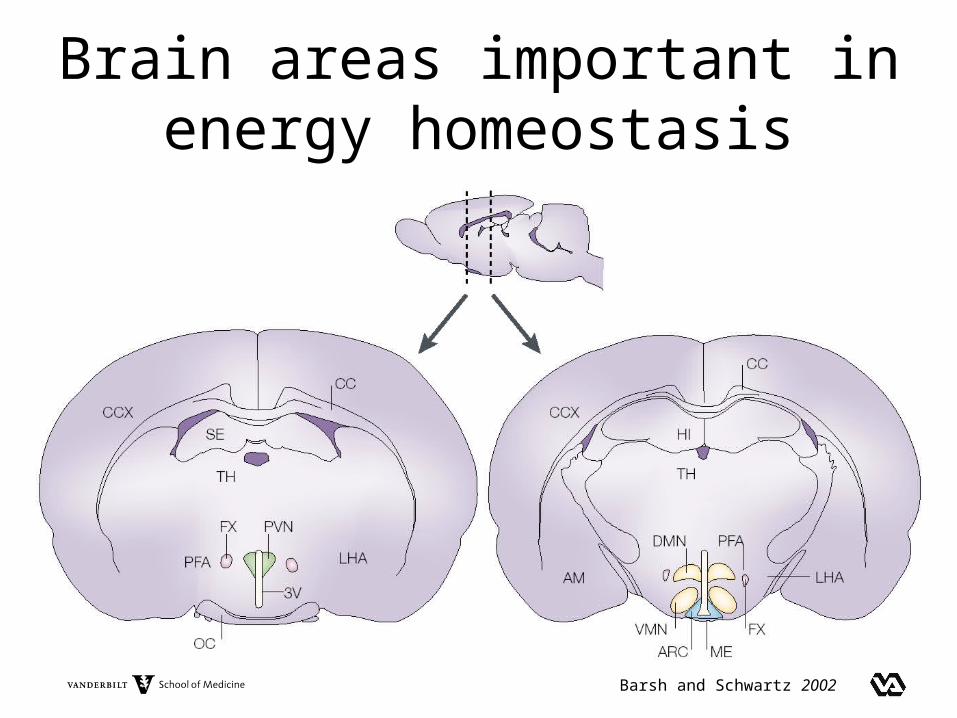
Brain areas important inenergy homeostasis
Barsh and Schwartz 2002

0 10 20 30 40275325375425475
low fat (10%)high fat (60%)
day
body
weig
ht (g
ram
s)
Obesity: brain insulin and leptin resistance
low fa
t, veh
icle
low fa
t, ins
ulin
high f
at, ve
hicle
high f
at, in
sulin
0255075
100 *
food
inta
ke (K
cal/2
4 hr
)0
255075
100*
food
inta
ke (K
cal/2
4 hr
)low
fat, v
ehicl
elow
fat, l
eptin
high f
at, ve
hicle
high f
at, le
ptin
Posey, KA Am J Physiol Endocrinol Metab. 2009

High-fat diet
central insulin and leptin resistance
obesity
Lipotoxicity Inflammatory signaling
IKKB >>> NFKB
Model

Does CNS inflammation modulate feeding?
020406080
100120
diet fat content low low high high
*
IKK inhibitor - + - +
food
inta
ke(K
cal/2
4hr)

PW likes big meals….
…with lots of fat and sugar, and certain illicit substances.

High-fat hyperphagia
-2 -1 0 1 2 3 4 5 6 7
60
70
80
90
100
110LFHF
*
* ** * ** **
70time (days)
food
inta
ke (k
cal)
Kelly Rogers

Feeding is complicated
Berthoud, Ann. Rev. Psych. 2008

Feeding is really complicated
Berthoud, Ann. Rev. Psych. 2008
***

Hypothesis: dopaminergic “reward” systems drive overconsumption of high-fat, high-carbohydrate, energy dense foods
Cami NEJM 2003

Insulin administration in brain reduces preference for fat
Figlewicz, Behav. Neurosci. 2004.
Train Test-50
0
50
100
150
200
-100
Test Only Train Only
CPP
Scor
e
LeptinInsulinCSF

Does high-fat feeding induce midbrain insulin resistance?
*
P-A
kt(T
hr30
8) (
% o
f con
trol)
Striatum
Low Fat High Fat
*
P-A
kt(T
hr30
8) (
% o
f con
trol)
Substania Nigra
Low Fat High Fat
Speed et al., PLoS One 2011

IRSY
IRSYp85
p110
p110
PIP2 PIP3PDK1
PKC
AKTST
Insulin receptor
YY
YY
} PI3K
glut4
glut4
Can insulin resistance be (genetically) rescued?
DAT
DAT

IRS-2 rescues Akt activation…P-Akt (Thr308)
LF GFP LF IRS2 HF GFP HF IRS20
25
50
75
100
125
p-Ak
t (Th
r308
) (%
of c
ontr
ol)
P-Ak
t (Th
r308
) (%
of c
ontr
ol) *
*
Speed et al., PLoS One 2011

LF-GFP
HF-GFP
HF-IRS2
0
100
200
300 *fo
od in
take
(kca
l)
Rescuing insulin action in “addiction” brain areas normalizes high-fat food intake
Speed et al., PLoS One 2011

Reward/addiction areas are targets for obesity therapy!
Cami NEJM 2003

PW struggles with depression…
..that has not responded terribly well to treatment.

0 7 14 21 28
0.40.60.81.01.2 LF (10%)
HF (45%)
p<0.05
days on diet
time
stru
gglin
g(n
orm
aliz
ed to
LF)
High-fat Food and Mood
Rogers, Dunn, Dosovitz, Lukasiewicz, Saadat
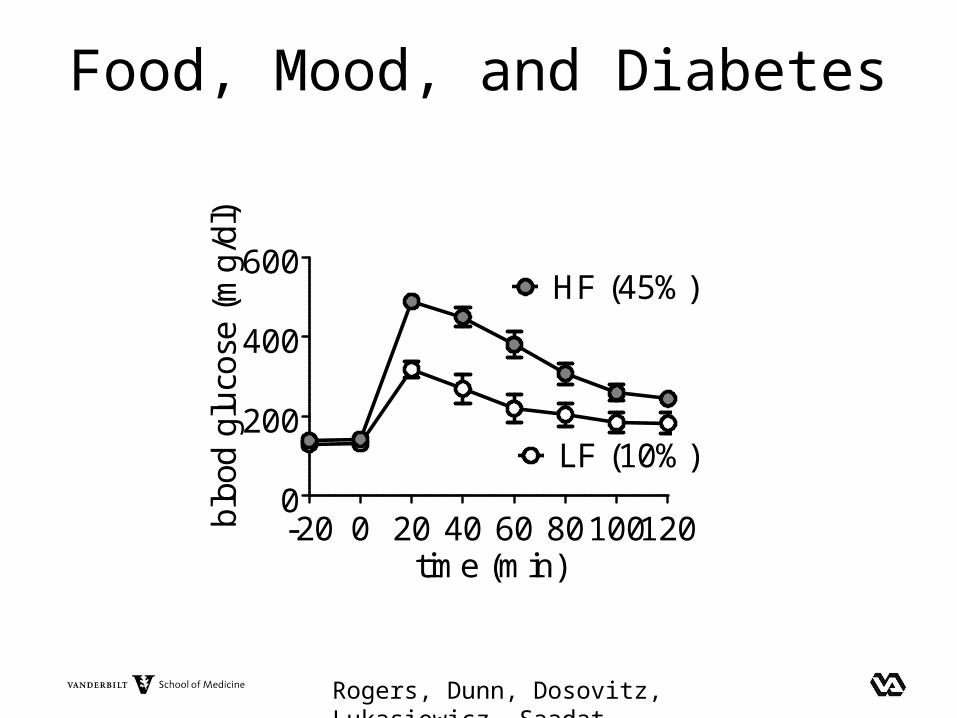
-20 0 20 40 60 801001200
200
400
600
LF (10%)
HF (45%)
time (min)
bloo
d gl
ucos
e (m
g/dl
)
Food, Mood, and Diabetes
Rogers, Dunn, Dosovitz, Lukasiewicz, Saadat

0 7 14 21 28 35
50
100
150
LF (10%) HF (45%)
time (days on diet)
food
inta
ke (k
cal)
Food, Mood, Stress, and more Food
Rogers, Dunn, Dosovitz, Lukasiewicz, Saadat

Serotonin
Robbins Nat. Neurosci. 2005

Depression and inflammation
Shelton and Miller Prog. Neurobiol. 2010

Obesity and depression Rx response
Oskooilar et al., J. Clin. Psych. 2009
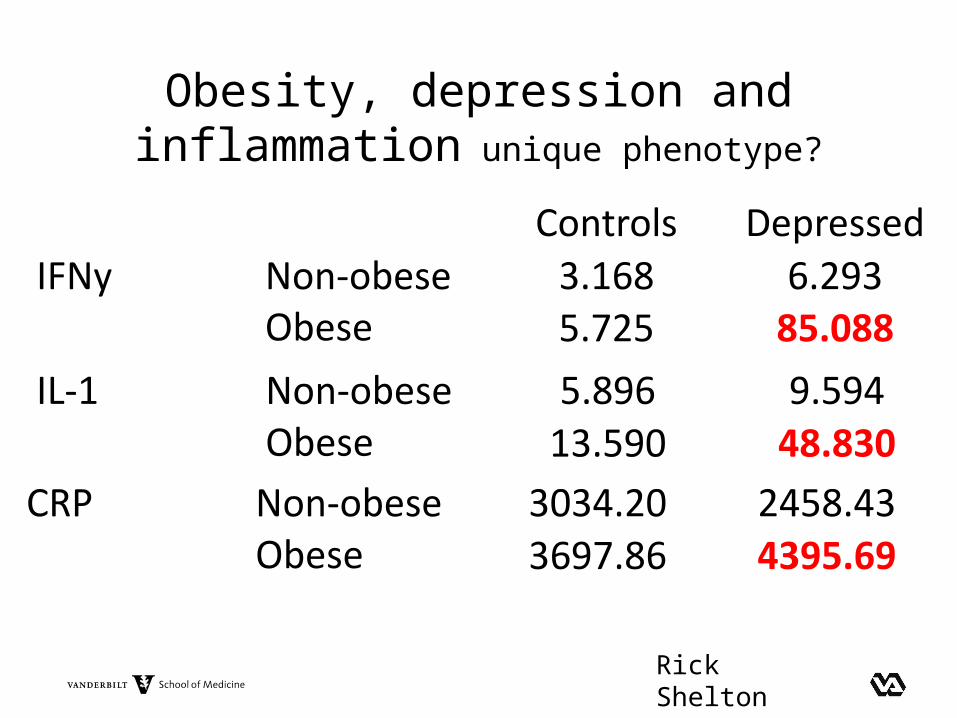
Obesity, depression and inflammation unique phenotype?
Rick Shelton
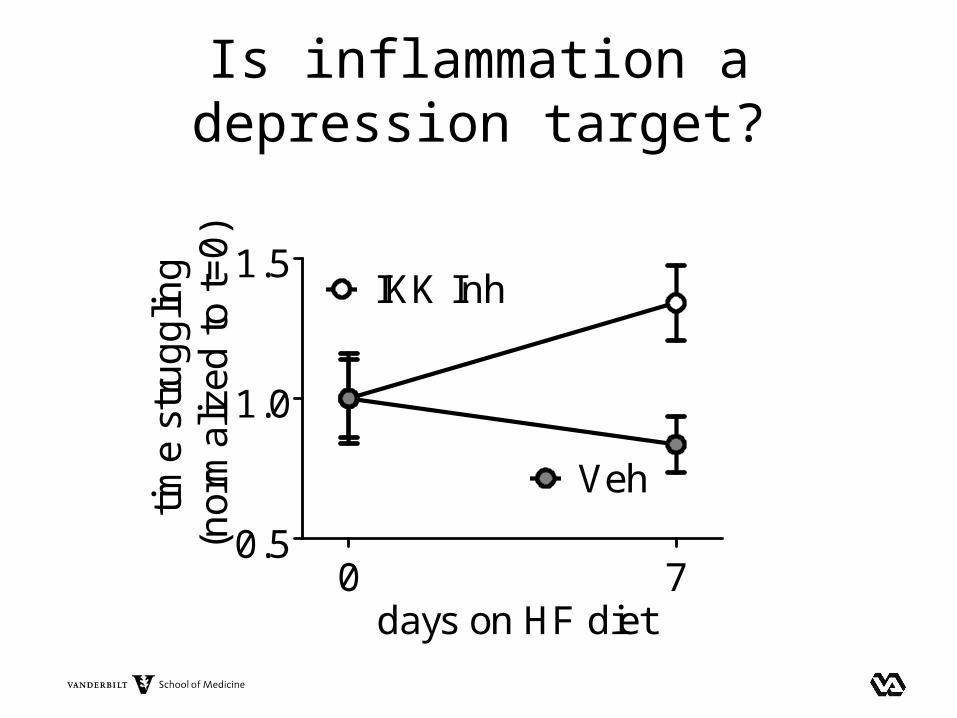
Is inflammation a depression target?
0 70.5
1.0
1.5IKK Inh
Veh
days on HF diet
time
stru
gglin
g(n
orm
aliz
ed to
t=0)
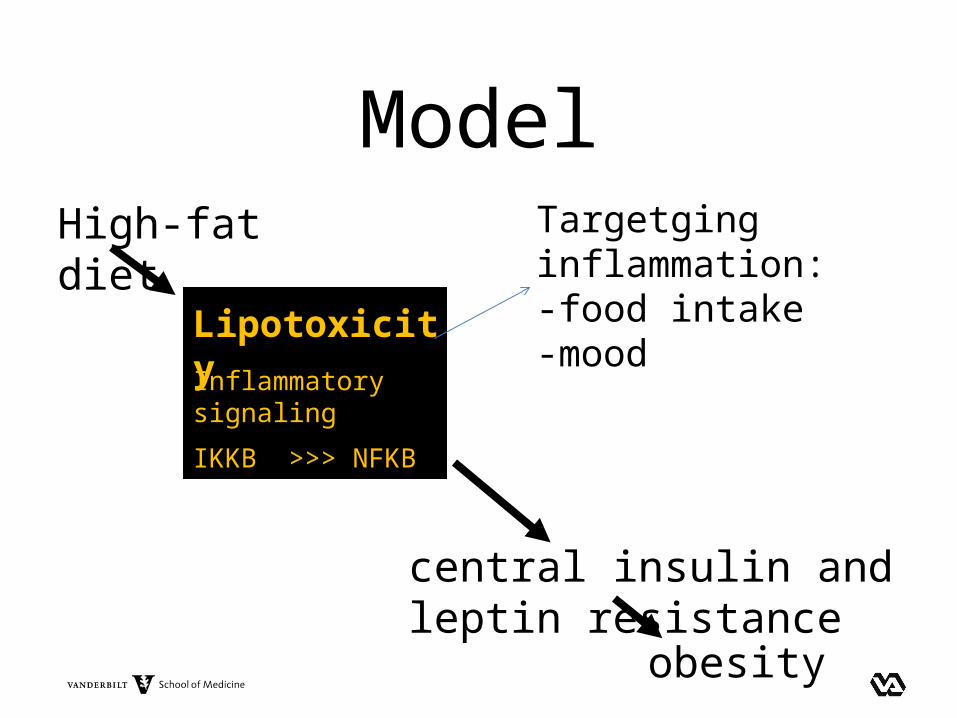
High-fat diet
central insulin and leptin resistance
obesity
Lipotoxicity Inflammatory signaling
IKKB >>> NFKB
ModelTargetging inflammation:-food intake-mood
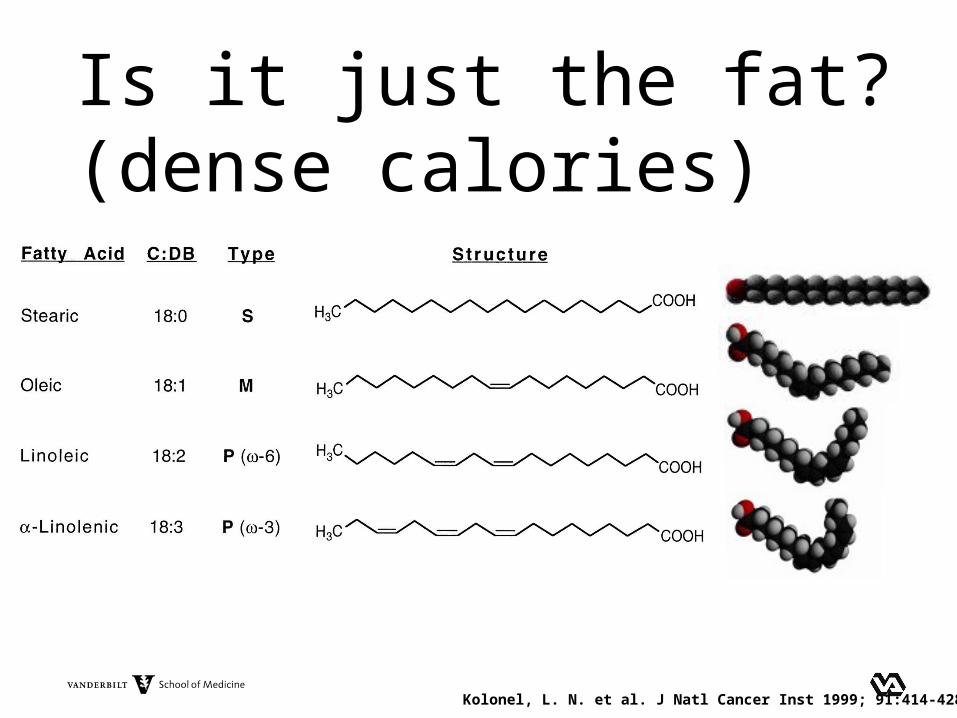
Is it just the fat?(dense calories)
Kolonel, L. N. et al. J Natl Cancer Inst 1999; 91:414-428

1 2 3 4 5 6 7 8 9 100
300
400
500
600
high-saturated fatlow-fat
high-monounsaturatedfat
weeks on diet
body
wei
ght (
g)Fat saturation makes a difference

0
50
100
150
200
250 high-saturated fatlow-fat
high-monounsaturatedfat
total fat
**
*
**
p=0.08
wei
ght g
ain
(g)
low-fat high-sat high-mono0
4000
5000
6000
7000
****
tota
l foo
d in
take
(kc
al)
Fat saturation makes a difference

0.5
1.0
1.5
2.0
2.5LFHFMU
p'PERK p'p66shc
a
b
a
bb
rela
tive
inte
nsity
Saturated fat in the diet induces CNS ER stress and oxidant stress

Saturated fat is inflammatory
LF HF-SFA HF-MUFA0
2
4
6 * **
IL-6
mR
NA
(rel
ativ
e ex
pres
sion
)

Saturation and Depression• Mediterranean diet
– Metanalysis of 22 studies
– Stroke RR=0.71, 95%CI: 0.57-0.89– Cognitive impairment RR=0.60, 95%CI: 0.43-0.83– Depression RR=0.68, 95%CI: 0.54-0.86
Psaltopoulou et al., An. Neurol. 2013

PW stays up all night…
..does very little productive in the day.

High-fat diet alters circadian patterns
Pendergast et al., Eur. J. Neurosci. 2013

Night Eating Syndrome
Lundgren et al., Eating Behavior 2009
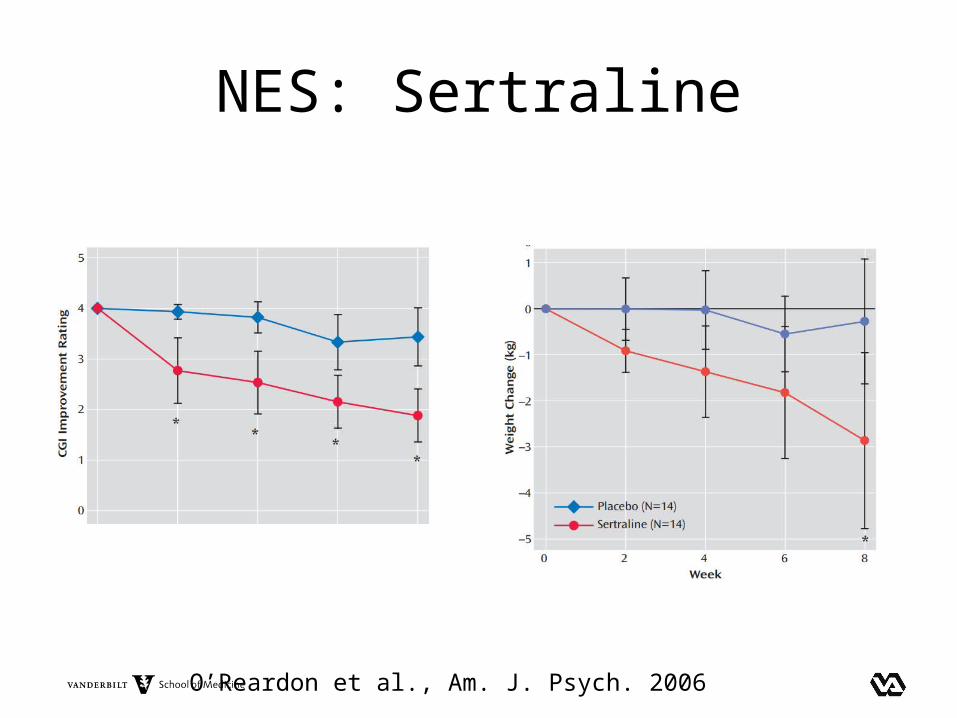
NES: Sertraline
O’Reardon et al., Am. J. Psych. 2006
Acknowledgements•Kelly Rogers• Jennifer Rojas•Heidi Kocalis• Lindsey Morris•Richard Printz•Maxine Turney• Leena George •Sanaz Saadat•Simon Dosovitz• Jennifer Lukasiewicz
•Aurelio Galli•Mike Siuta•Sabrina Robertson•Nicole Speed•Christine Saunders
•Calum Avison• Jason Williams• Nelli Byun• Rob Barry
TranslationHeidi Silver Richard Shelton David Zald Hakmook Kang
Calum Avison Ron Cowan Robert Kessler


