Download - Fomc 19710921 Gb Sup 19710917

Prefatory Note The attached document represents the most complete and accurate version available based on original copies culled from the files of the FOMC Secretariat at the Board of Governors of the Federal Reserve System. This electronic document was created through a comprehensive digitization process which included identifying the best-preserved paper copies, scanning those copies,1
and then making the scanned versions text-searchable.2
Though a stringent quality assurance process was employed, some imperfections may remain. Please note that some material may have been redacted from this document if that material was received on a confidential basis. Redacted material is indicated by occasional gaps in the text or by gray boxes around non-text content. All redacted passages are exempt from disclosure under applicable provisions of the Freedom of Information Act. 1 In some cases, original copies needed to be photocopied before being scanned into electronic format. All scanned images were deskewed (to remove the effects of printer- and scanner-introduced tilting) and lightly cleaned (to remove dark spots caused by staple holes, hole punches, and other blemishes caused after initial printing). 2 A two-step process was used. An advanced optical character recognition computer program (OCR) first created electronic text from the document image. Where the OCR results were inconclusive, staff checked and corrected the text as necessary. Please note that the numbers and text in charts and tables were not reliably recognized by the OCR process and were not checked or corrected by staff.
Content last modified 6/05/2009.
CONFIDENTIAL (FR)
SUPPLEMENT
CURRENT ECONOMIC AND FINANCIAL CONDITIONS
Prepared for theFederal Open Market Committee
September 17, 1971
By the StaffBoard of Governors
of the Federal Reserve System
SUPPLEMENTAL NOTES
The Domestic Economy
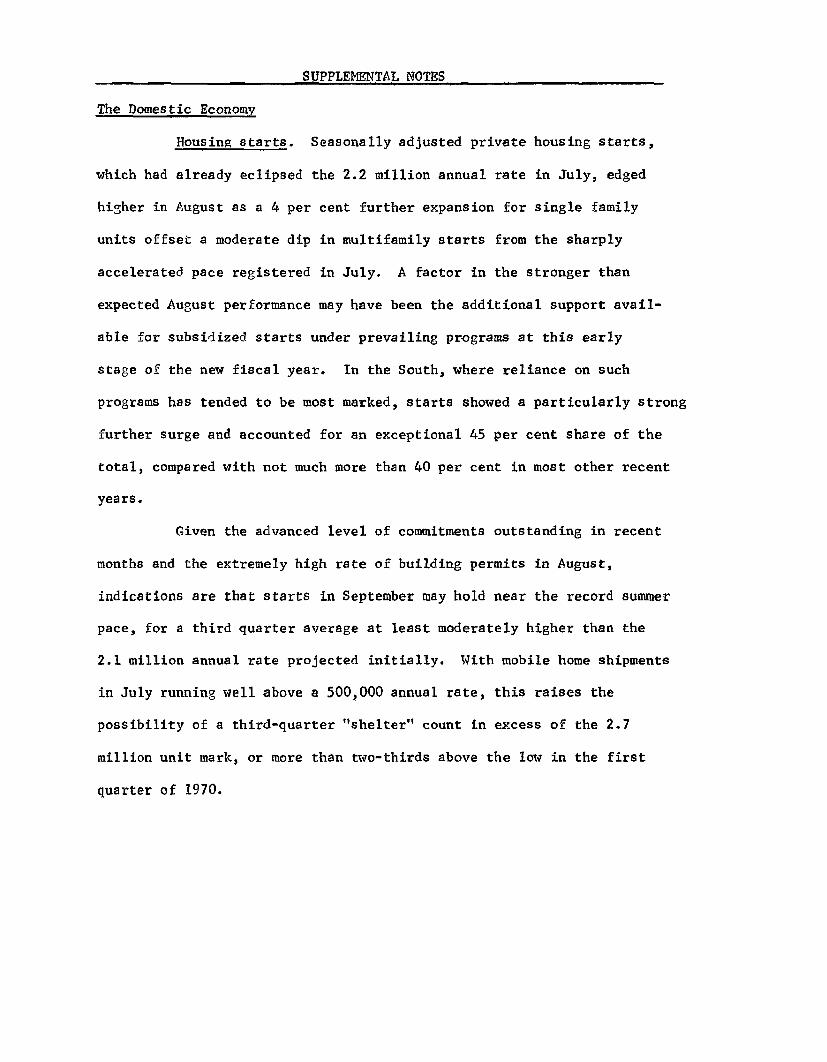
Housing starts. Seasonally adjusted private housing starts,
which had already eclipsed the 2.2 million annual rate in July, edged
higher in August as a 4 per cent further expansion for single family
units offset a moderate dip in multifamily starts from the sharply
accelerated pace registered in July. A factor in the stronger than
expected August performance may have been the additional support avail-
able for subsidized starts under prevailing programs at this early
stage of the new fiscal year. In the South, where reliance on such
programs has tended to be most marked, starts showed a particularly strong
further surge and accounted for an exceptional 45 per cent share of the
total, compared with not much more than 40 per cent in most other recent
years.
Given the advanced level of commitments outstanding in recent
months and the extremely high rate of building permits in August,
indications are that starts in September may hold near the record summer
pace, for a third quarter average at least moderately higher than the
2.1 million annual rate projected initially. With mobile home shipments
in July running well above a 500,000 annual rate, this raises the
possibility of a third-quarter "shelter" count in excess of the 2.7
million unit mark, or more than two-thirds above the low in the first
quarter of 1970.

-2-
PRIVATE HOUSING STARTS AND PERMITS(Seasonally adjusted annual rates, in thousands of units)
StartsPer Cent Per Cent 2/
Total 1/ Single-family FHA-insured- Permits(FHA Series)
1970 - Annual 1,434 57 29 1,324
1970
IIQ 1,286 58 28 1,257IIIQ 1,512 56 28 1,358IQ 1,777 58 35 1,593
1971
IQ 1,813 55 24 1,608
IIQ (r) 1,962 58 22 1,805
1971
June (r) 2,000 59 24 1,847July (r) 2,215 53 22 2,052August (p) 2,228 55 n.a. 2,0081/ Apart from starts, mobile home shipments for domestic use in
July--the latest month for which data are available--advanced toa record seasonally adjusted annual rate of 531,000. This wasmore than a tenth above the expanded second quarter average.
2/ Based on unadjusted totals for all periods. FHA-insured startsinclude both subsidized and nonsubsidized units.

-3-
Personal income. Personal income advanced $8.8 billion in
August to $868 billion (annual rate), with wage and salary disbursements
accounting for $6.6 billion of the increase following little change in
the previous month. In the government sector, most of the gain re-
flected the $300 per employee one-time bonus payment to postal workers
amounting to about $2.0 billion and another $0.5 billion to a pay raise.
In the private sector, manufacturing payrolls increased $0.6 billion
after declining in July, and in distributive industries rose $1.6 billion
after showing no increase the previous month. Nonfarm payroll employment
was about unchanged in August and payroll increases were due to higher
hourly earnings and longer average weekly hours. Farm income rose
again, by $0.9 billion, to $17.0 billion.
PERSONAL INCOMESeasonally adjusted, annual rate, billions of dollars
1971
Net ChangeJune July August July-August
Total 870.1 859.2 868.0 8.8
Wage and salary disb. 574.8 574.7 581.3 6.6Government 123.0 123.6 126.7 3.1Private 451.8 451.1 454.6 3.5Manufacturing 162.4 161.4 162.0 .6Distributive 138.6 138.6 140.2 1.6Services 105.7 106.3 107.3 1.0Other 45.1 44.8 45.1 .3
Transfer payments 109.0 96.2 96.5 .3Other income 217.7 219.8 221.7 1.9
-4-
The Domestic Financial Situation
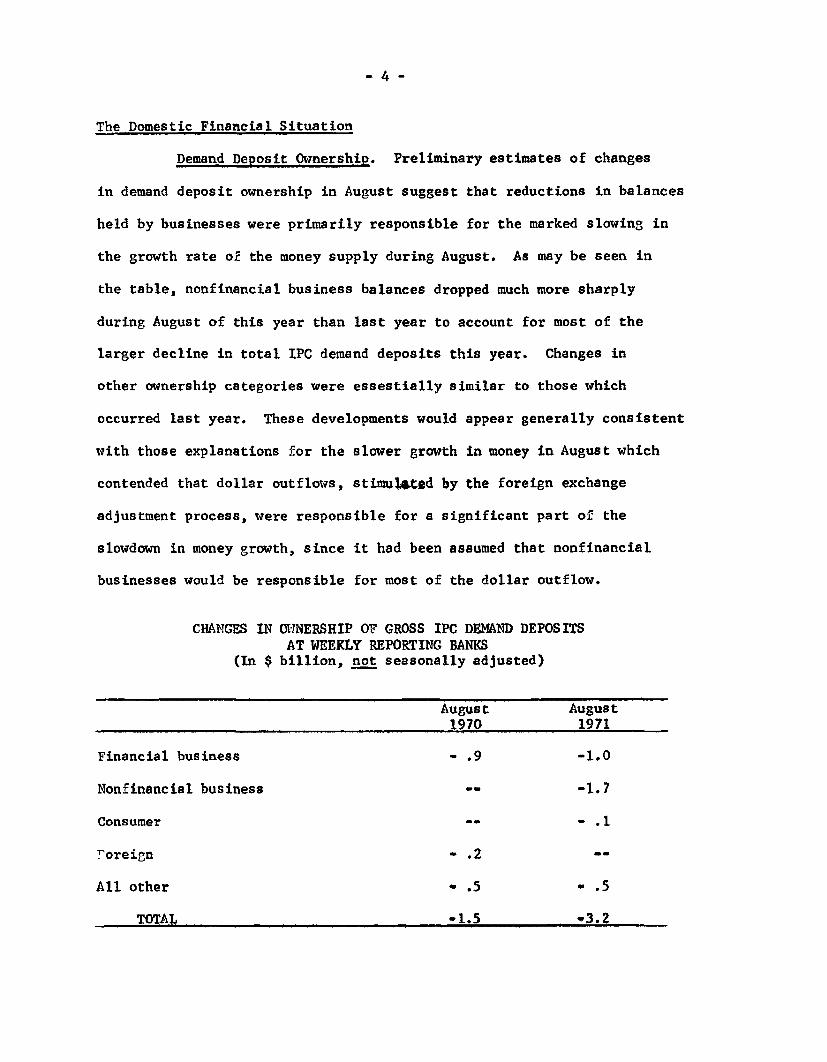
Demand Deposit Ownership. Preliminary estimates of changes
in demand deposit ownership in August suggest that reductions in balances
held by businesses were primarily responsible for the marked slowing in
the growth rate of the money supply during August. As may be seen in
the table, nonfinancial business balances dropped much more sharply
during August of this year than last year to account for most of the
larger decline in total IPC demand deposits this year. Changes in
other ownership categories were essestially similar to those which
occurred last year. These developments would appear generally consistent
with those explanations for the slower growth in money in August which
contended that dollar outflows, stimulated by the foreign exchange
adjustment process, were responsible for a significant part of the
slowdown in money growth, since it had been assumed that nonfinancial
businesses would be responsible for most of the dollar outflow.
CHANGES IN OWNERSHIP OF GROSS IPC DEMAND DEPOSITSAT WEEKLY REPORTING BANKS
(In $ billion, not seasonally adjusted)
August August1970 1971
Financial business - .9 -1.0
Nonfinancial business -- -1.7
Consumer - - .1
Foreign - .2
All other - .5 - .5
TOTAL -1.5 -3.2
-5-
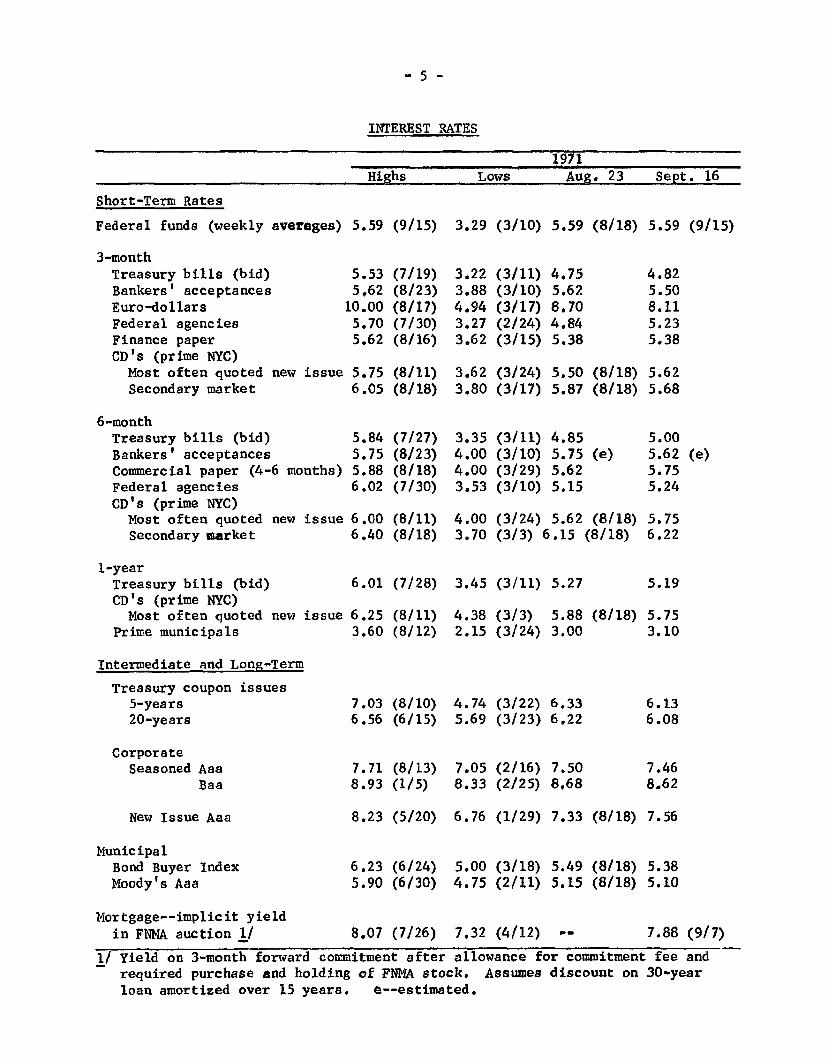
INTEREST RATES
1971Highs Lows Aug. 23 Sept. 16
Short-Term Rates
Federal funds (weekly averages) 5.59
3-monthTreasury bills (bid)Bankers' acceptancesEuro-dollarsFederal agenciesFinance paperCD's (prime NYC)
Most often quoted new issueSecondary market
6-monthTreasury bills (bid)Bankers' acceptancesCommercial paper (4-6 months)Federal agenciesCD's (prime NYC)
Most often quoted new issueSecondary market
1-yearTreasury bills (bid)CD's (prime NYC)Most often quoted new issue
Prime municipals
Intermediate and Long-Term
Treasury coupon issues5-years20-years
CorporateSeasoned Aaa
Baa
New Issue Aaa
MunicipalBond Buyer IndexMoody's Aaa
5.535.62
10.005.705.62
(9/15)
(7/19)(8/23)(8/17)(7/30)(8/16)
5.75 (8/11)6.05 (8/18)
5.845.755.886.02
(7/27)(8/23)(8/18)(7/30)
6.00 (8/11)6.40 (8/18)
6.01 (7/28)
6.25 (8/11)3.60 (8/12)
7.03 (8/10)6.56 (6/15)
7.71 (8/13)8.93 (1/5)
8.23 (5/20)
6.23 (6/24)5.90 (6/30)
3.29 (3/10) 5.59 (8/18) 5.59 (9/15)
3.223.884.943.273.62
(3/11)(3/10)(3/17)(2/24)(3/15)
4.755.628.704.845.38
4.825.508.115.235.38
3.62 (3/24) 5.50 (8/18) 5.623.80 (3/17) 5.87 (8/18) 5.68
3.354.004.003.53
(3/11)(3/10)(3/29)(3/10)
4.855.75 (e)5.625.15
4.00 (3/24) 5.62 (8/18)3.70 (3/3) 6.15 (8/18)
3.45 (3/11) 5.27
4.38 (3/3) 5.882.15 (3/24) 3.00
4.74 (3/22) 6.335.69 (3/23) 6.22
7.05 (2/16) 7.508.33 (2/25) 8.68
5.005.625.755.24
5.756.22
5.19
(8/18) 5.753.10
6.136.08
7.468.62
6.76 (1/29) 7.33 (8/18) 7.56
5.00 (3/18) 5.49 (8/18) 5.384.75 (2/11) 5.15 (8/18) 5.10
Mortgage--implicit yieldin FNMA auction 1/ 8.07 (7/26) 7,3
Yield on 3-month forward commitment after allrequired purchase and holding of FNMA stock.loan amortized over 15 years. e--estimated.
2 (4/12) - 7.88 (9/7)
owance for commitment fee andAssumes discount on 30-year
-6-
International Developments
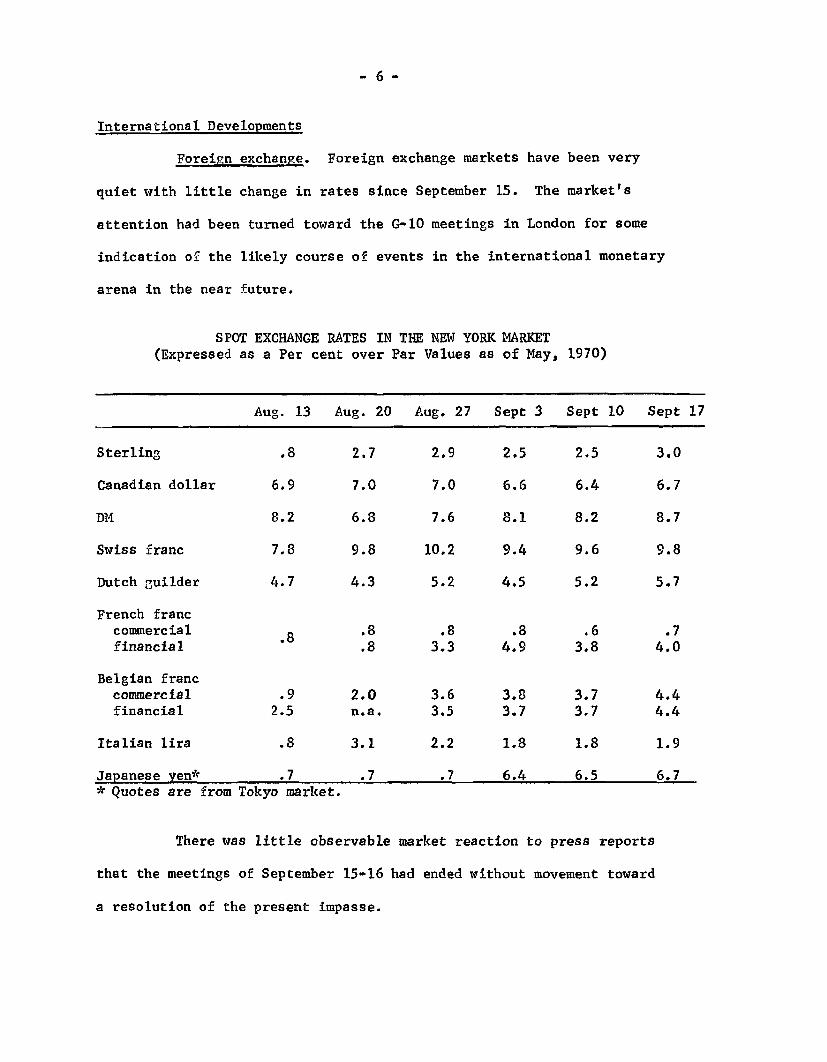
Foreign exchange. Foreign exchange markets have been very
quiet with little change in rates since September 15. The market's
attention had been turned toward the G-10 meetings in London for some
indication of the likely course of events in the international monetary
arena in the near future.
SPOT EXCHANGE RATES IN THE NEW YORK MARKET(Expressed as a Per cent over Par Values as of May, 1970)
Aug. 13 Aug. 20 Aug. 27 Sept 3 Sept 10 Sept 17
Sterling .8 2.7 2.9 2.5 2.5 3.0
Canadian dollar 6.9 7.0 7.0 6.6 6.4 6.7
DM 8.2 6.8 7.6 8.1 8.2 8.7
Swiss franc 7.8 9.8 10.2 9.4 9.6 9.8
Dutch guilder 4.7 4.3 5.2 4.5 5.2 5.7
French franccommercial .8 .8 .8 .8 .6 .7financial .8 3.3 4.9 3.8 4.0
Belgian franccommercial .9 2.0 3.6 3.8 3.7 4.4financial 2.5 n.a. 3.5 3.7 3.7 4.4
Italian lira .8 3.1 2.2 1.8 1.8 1.9
Japanese yen* .7 .7 .7 6.4 6.5 6.7* Quotes are from Tokyo market.
There was little observable market reaction to press reports
that the meetings of September 15-16 had ended without movement toward
a resolution of the present impasse.

-7-
CORRECTIONS:
Attached are Greenbook pages II-C-1 and II-C-2 inadvertently
left out of the Greenbook.
Page 11-22 footnote 2 should be SA (seasonally adjusted),
not SAAR as indicated.
GNP tables pages 11-6 and II-7 should be re-numbered II-7 and
II-8.

II-C-1ECONOMIC DEVELOPMENTS - UNITED STATES
SEASONALLY ADJUSTED, RATIO SCALE
GNP INCREASEANNUAL RATE, ARITHMETIC SCALE
CURRENT $G1 205
1 1 I 1 1 II ,I , iPER
ANNUAL RATE, ARITHMETIC SCALE
1958 $
1969 19711969 1971
INDUSTRIAL PRODUCTION - I
BILS EMPLOYMENT ESTAB BASIS
1967=100
-140
CONSUMER GOODSJULY 1159
sTTOTALJULY 1060
I l lI I I I I I I I Il l I I I I
MILUONS OF PERSONS
NONAGRICULTURAL 70AUG 706
S6520
19
MANUFACTURING -18AUG 185
HOURS
WORKWEEK-MFG. - 42AUG 399 -
1969 1 40
1969 1971
ANNUAL RATES, MILUONS OF UNITS
STARTSJULY 222
SvPERMITSS9JULY 207
1969 1971
9/14/71
1969
HOUSING
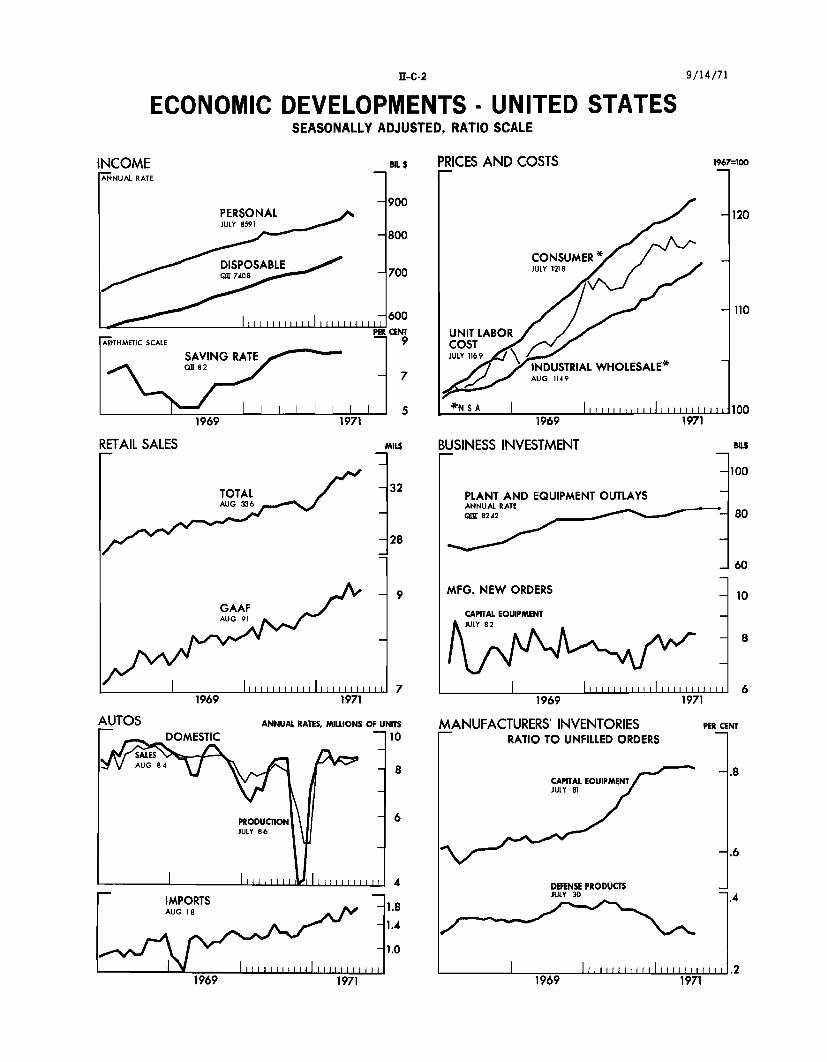
II-C-2ECONOMIC DEVELOPMENTS - UNITED STATES
SEASONALLY ADJUSTED, RATIO SCALE
MIL S PRICES AND COSTS
9/14/71
BUSINESS INVESTMENT
PLANT AND EQUIPMENT OUTLAYSANNUAL RATEQZ 8242
MFG. NEW ORDERS
CAPITAL EQUIPMENTJULY
1969
MANUFACTURERS' INVENTORIESRATIO TO UNFILLED ORDERS
CAPITAL EOUIPMENT/JULY 81
1971
PER CENT
IMPORTSAUG 18
1.0
1969 1971
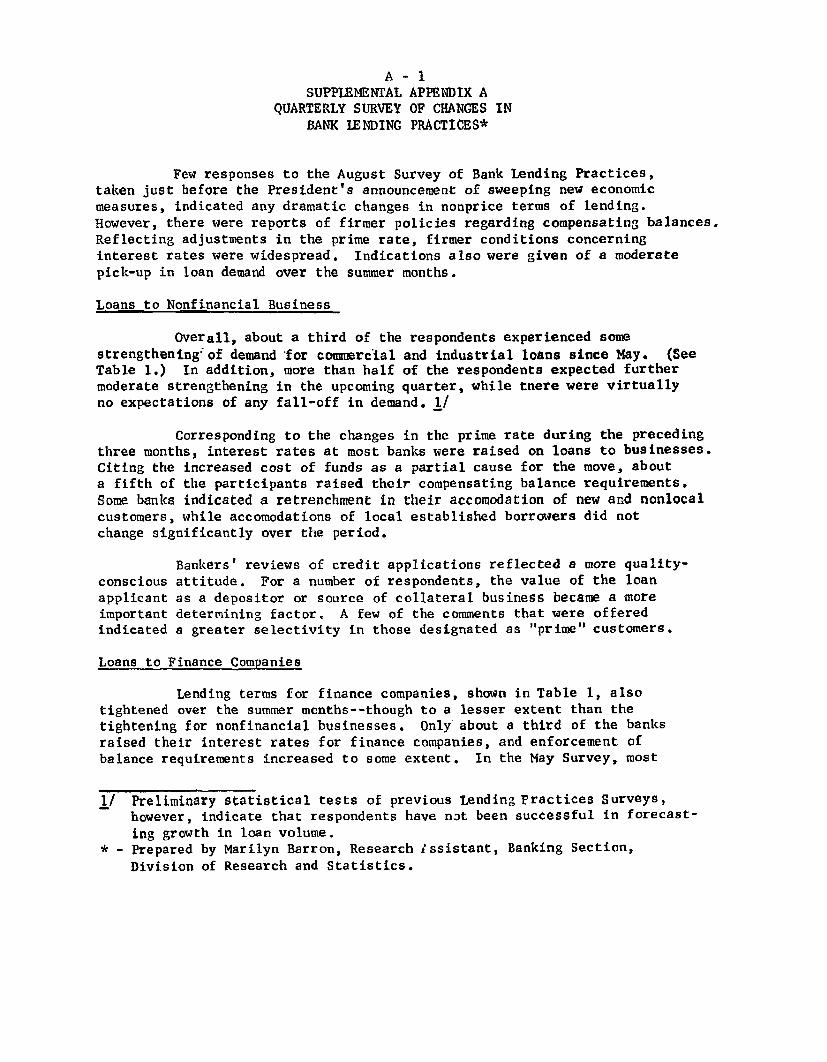
A - 1SUPPLEMENTAL APPENDIX A
QUARTERLY SURVEY OF CHANGES INBANK LENDING PRACTICES*
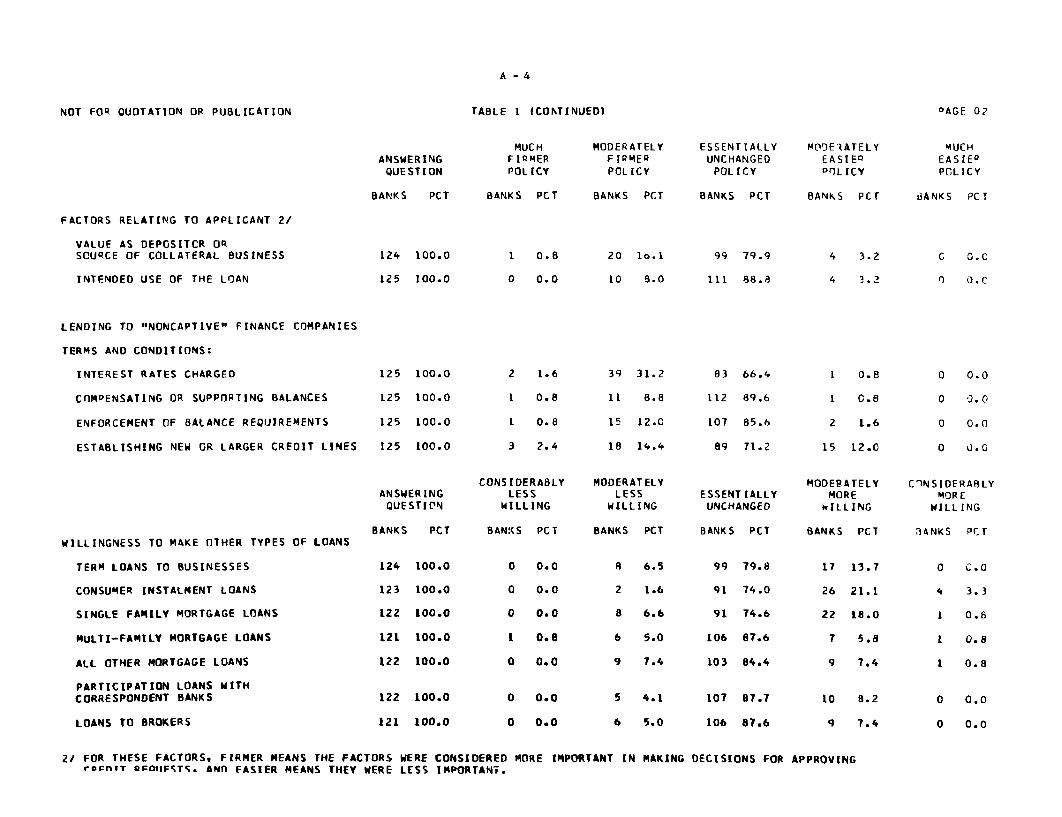
Few responses to the August Survey of Bank Lending Practices,taken just before the President's announcement of sweeping new economicmeasures, indicated any dramatic changes in nonprice terms of lending.However, there were reports of firmer policies regarding compensating balances.Reflecting adjustments in the prime rate, firmer conditions concerninginterest rates were widespread. Indications also were given of a moderatepick-up in loan demand over the summer months.
Loans to Nonfinancial Business
Overall, about a third of the respondents experienced somestrengthening of demand for commercial and industrial loans since May. (SeeTable 1.) In addition, more than half of the respondents expected furthermoderate strengthening in the upcoming quarter, while tnere were virtuallyno expectations of any fall-off in demand. 1/
Corresponding to the changes in the prime rate during the precedingthree months, interest rates at most banks were raised on loans to businesses.Citing the increased cost of funds as a partial cause for the move, abouta fifth of the participants raised their compensating balance requirements.Some banks indicated a retrenchment in their accomodation of new and nonlocalcustomers, while accomodations of local established borrowers did notchange significantly over the period.
Bankers' reviews of credit applications reflected a more quality-conscious attitude. For a number of respondents, the value of the loanapplicant as a depositor or source of collateral business became a moreimportant determining factor. A few of the comments that were offeredindicated a greater selectivity in those designated as "prime" customers.
Loans to Finance Companies
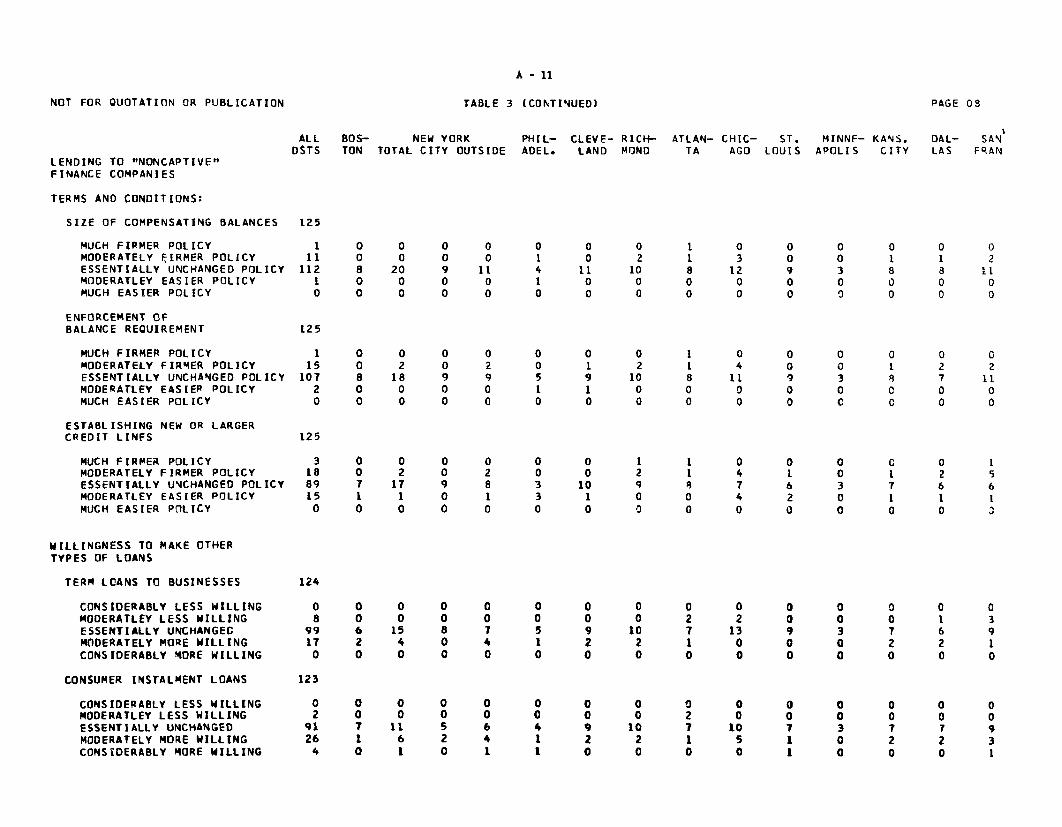
Lending terms for finance companies, shown in Table 1, alsotightened over the summer months--though to a lesser extent than thetightening for nonfinancial businesses. Only about a third of the banksraised their interest rates for finance companies, and enforcement ofbalance requirements increased to some extent. In the May Survey, most
1/ Preliminary statistical tests of previous Lending Practices Surveys,however, indicate that respondents have not been successful in forecast-
ing growth in loan volume.* - Prepared by Marilyn Barron, Research Assistant, Banking Section,
Division of Research and Statistics.

A -2
banks had moved to somewhat easier lending policies, but in the currentSurvey the net responses indicated some firming.
Other Types of Loans
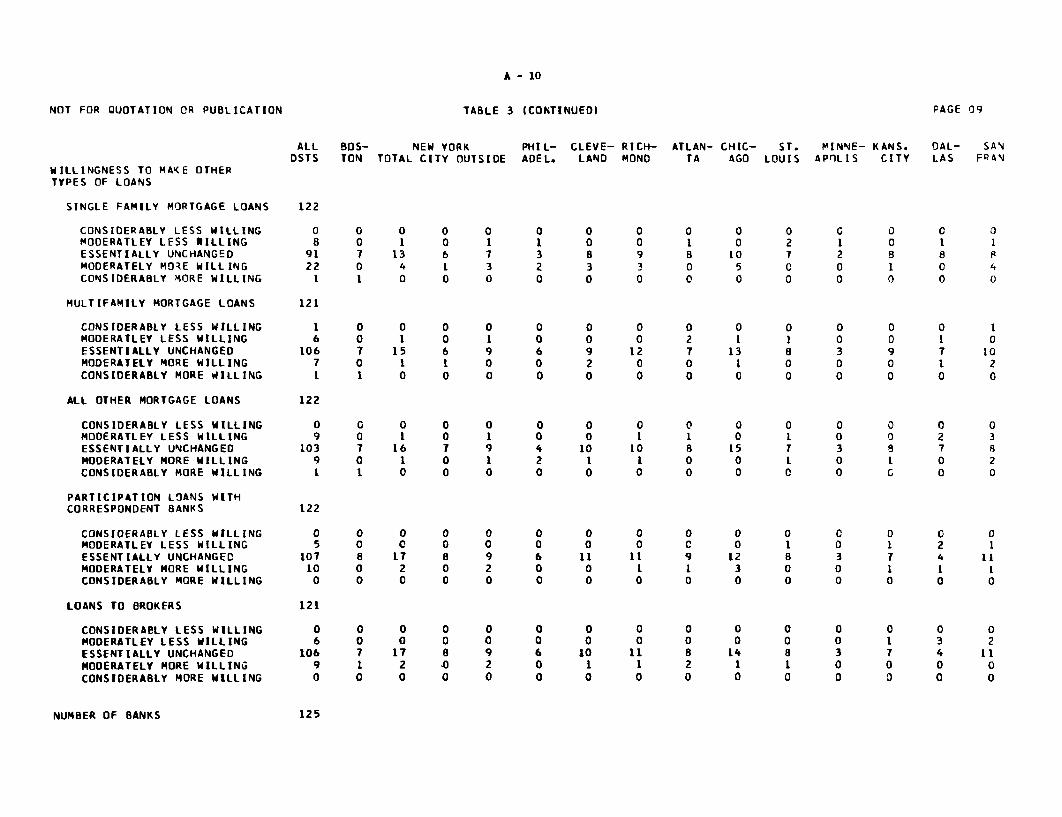
Bankers were more willing to make other types of loans thanpreviously. They seemed to be particularly interested in making consumerinstallment loans, as well as mortgages on single-family dwellings.
Other Factors
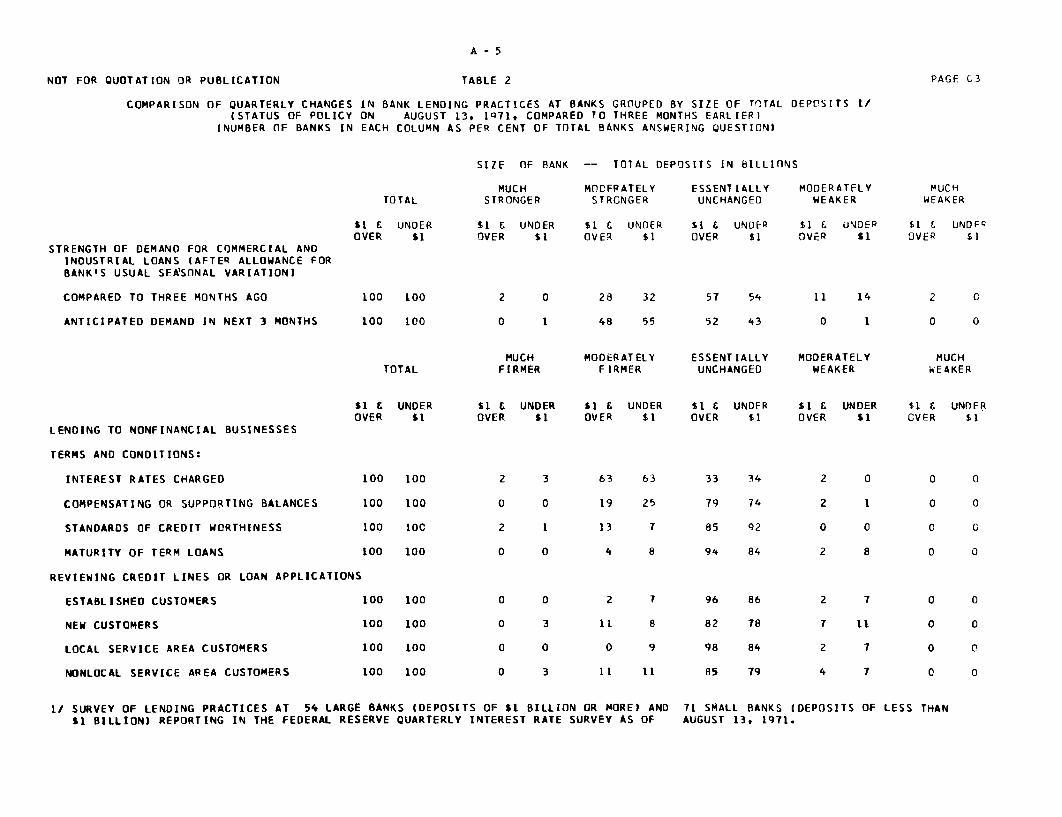
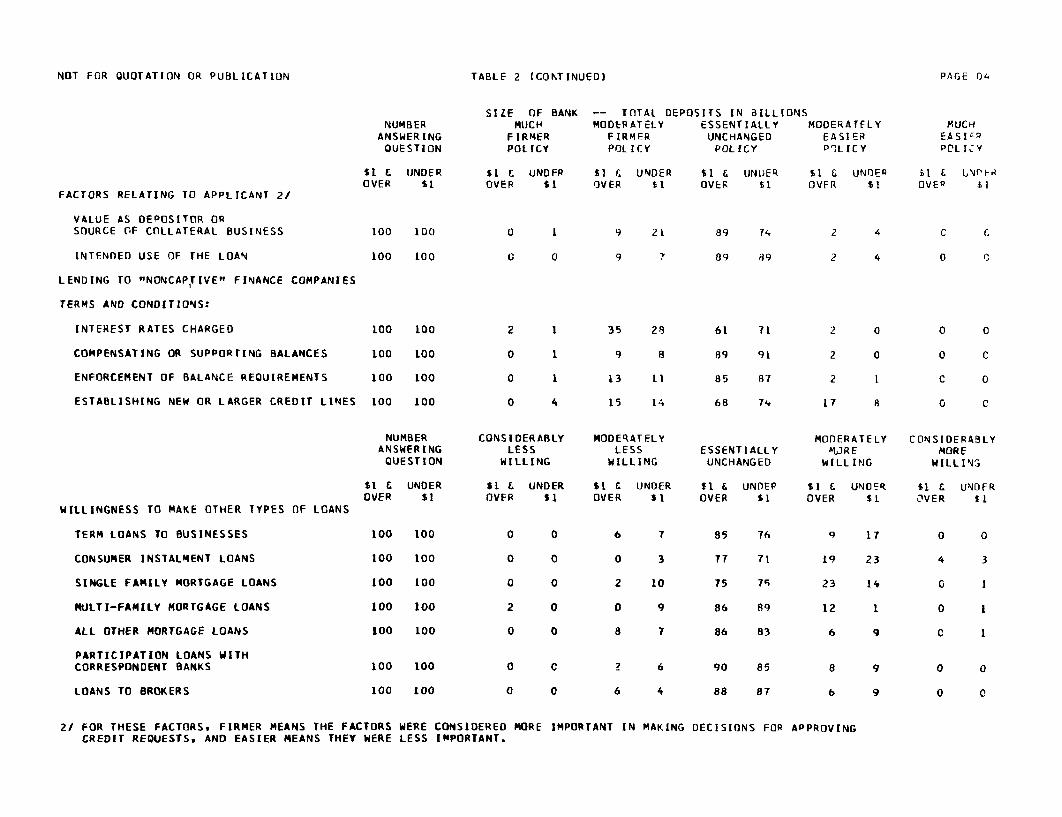
Variations in responses by size of banks were mixed. (See Table 2.)More of the banks with deposits of less than $1 billion had adopted afirmer policy in reviewing the value of the customer as a depositor and asa source of collateral business. Larger banks also showed a somewhatgreater willingness to extend single-and multi-family mortgage credits.
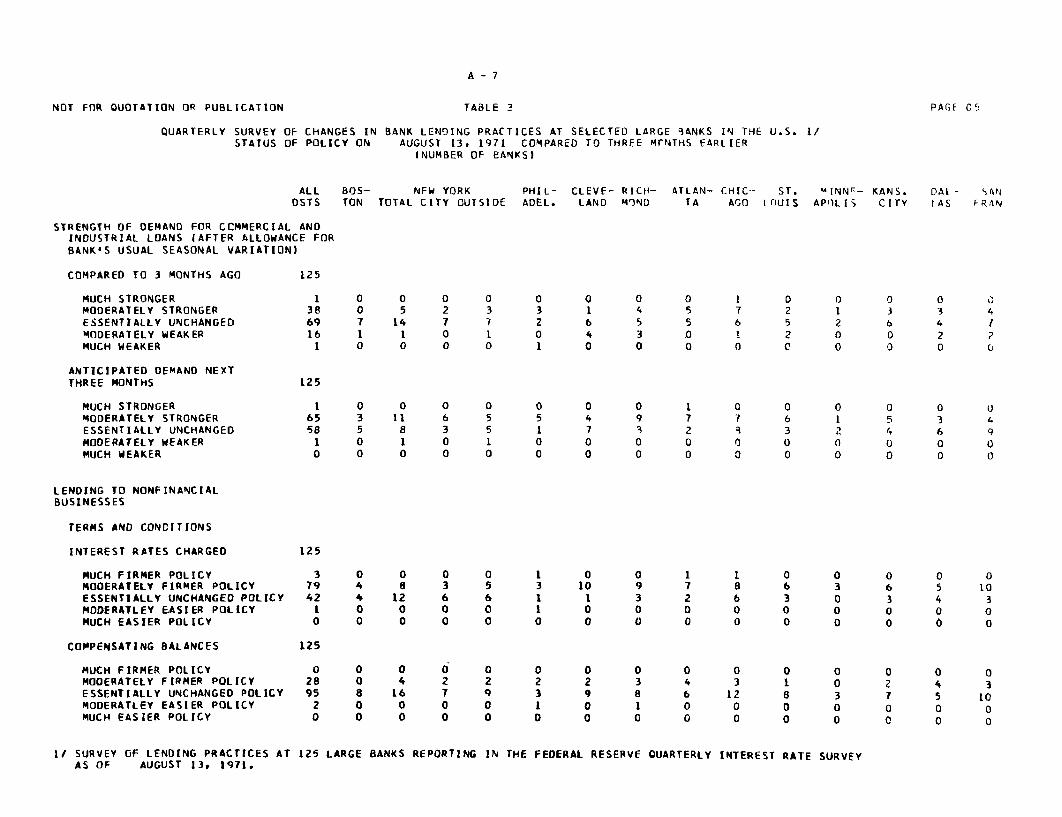
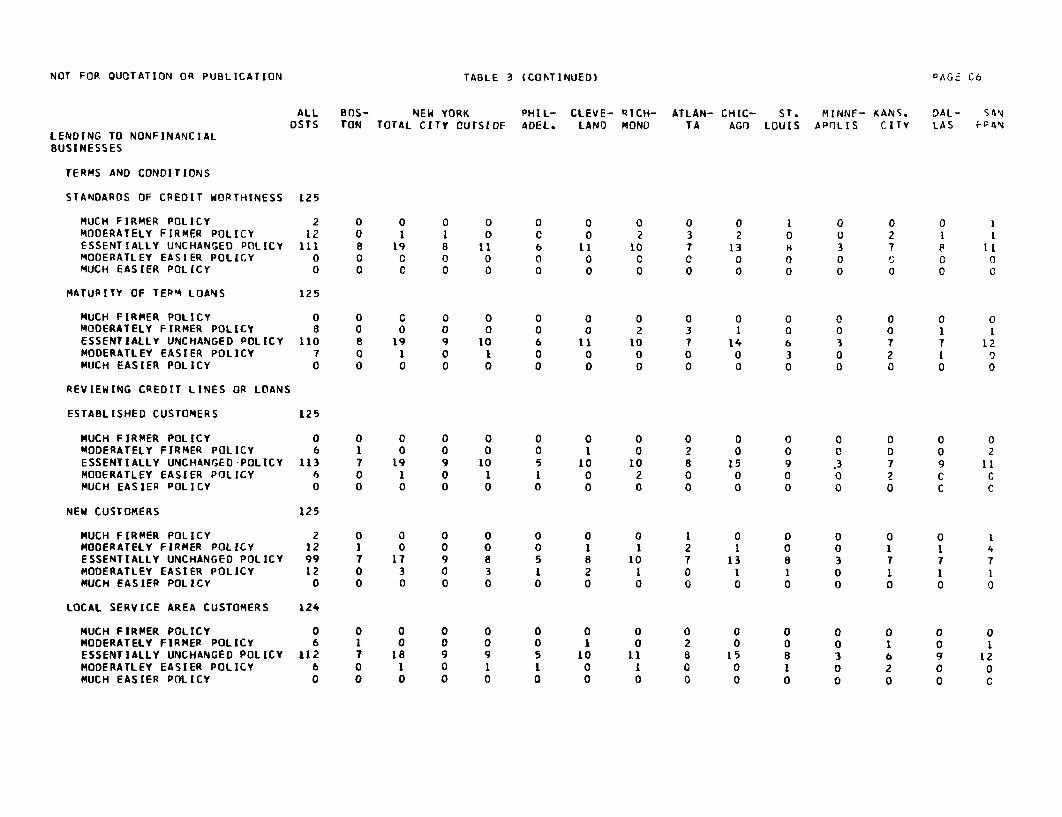
Some regional variations, displayed in Table 3, were evident inthe participants' responses. Banks in the New York and Boston Districtswere not as firm with respect to interest rates as other banks throughoutthe country. Firmer policies on interest rates were displayed at West
Coast banks than were typical for the nation as a whole, although somerespondents at these banks told of holding the line on rates on consumercredit and mortgages.
A-3
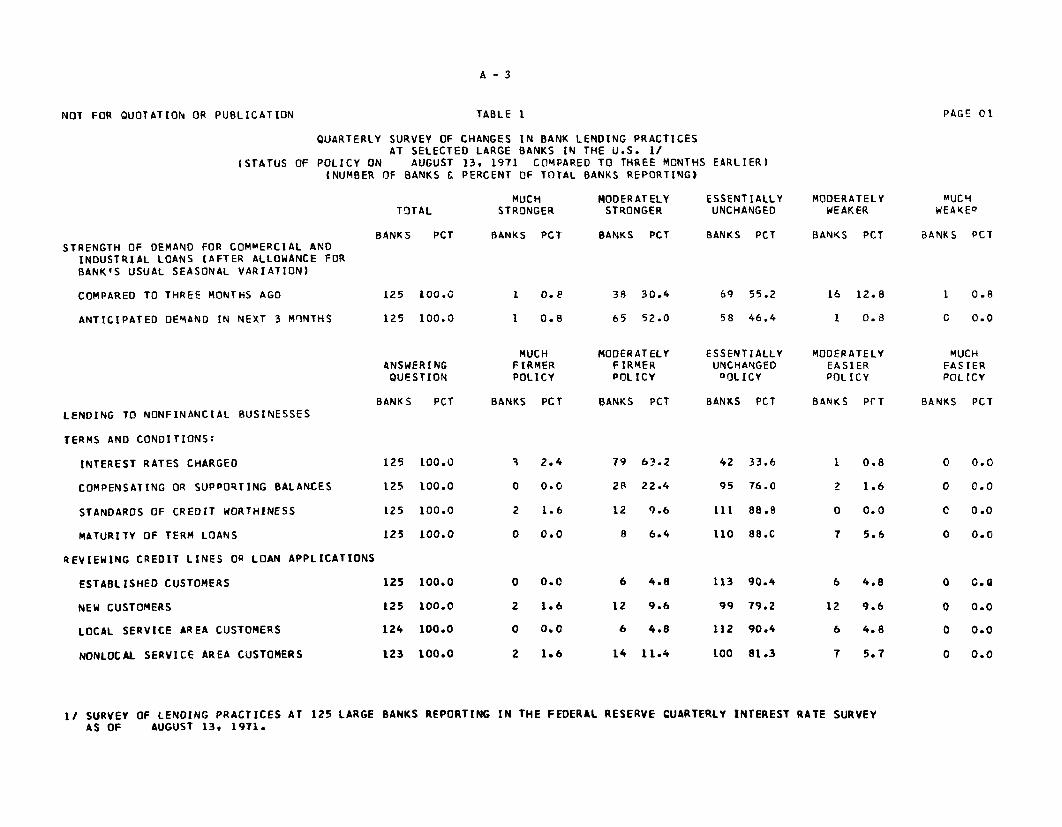
PAGE 01NOT FOR QUOTATION OR PUBLICATION TABLE 1
QUARTERLY SURVEY OF CHANGES IN BANK LENDING PRACTICESAT SELECTED LARGE BANKS IN THE U.S. 1/
(STATUS OF POLICY ON AUGUST 13, 1971 COMPARED TO THREE MONTHS EARLIER)(NUMBER OF BANKS & PERCENT OF TOTAL BANKS REPORTING)
STRENGTH OF DEMAND FOR COMMERCIAL AND
INDUSTRIAL LOANS (AFTER ALLOWANCE FOR
BANK'S USUAL SEASONAL VARIATION)
COMPARED TO THREE MONTHS AGO
ANTICIPATED DEMAND IN NEXT 3 MONTHS
LENDING TO NONFINANCIAL BUSINESSES
TERMS AND CONDITIONS:
INTEREST RATES CHARGED
COMPENSATING OR SUPPORTING BALANCES
STANDARDS OF CREDIT WORTHINESS
MATURITY OF TERM LOANS
REVIEWING CREDIT LINES OR LOAN APPLICATIONS
ESTABLISHED CUSTOMERS
NEW CUSTOMERS
LOCAL SERVICE AREA CUSTOMERS
NONLOCAL SERVICE AREA CUSTOMERS
TOTAL
BANKS PCT
125 100.0
125 100.0
ANSWERINGQUESTION
BANKS PCT
100.0
100.0
100.0
100.0
100.0
100.0
100.0
100.0
MUCHSTRONGER
BANKS PCT
MODERATELYSTRONGER
BANKS PCT
38 30.4
65 52.0
MUCH MODERATELYFIRMER FIRMERPOLICY POLICY
BANKS PCT BANKS PCT
2.4
0.0
1.6
0.0
0.0
1.6
0.0
1.6
63.2
22.4
9.6
6.4
4.8
9.6
4.8
11.4
ESSENTIALLYUNCHANGED
BANKS PCT
69 55.2
58 46.4
ESSENTIALLYUNCHANGEDDOLICY
BANKS PCT
MODERATELYWEAKER
BANKS PCT
16 12.8
1 0.8
MODERATELYEASIERPOLICY
BANKS PCT
33.6
76.0
88.8
88.C
90.4
79.2
90.4
81.3
MUCHWEAKED
BANKS PCT
MUCHFASIERPOLICY
BANKS PCT
4.8
9.6
4.8
5.7
1/ SURVEY OF LENDING PRACTICES AT 125 LARGEAS OF AUGUST 13, 1971.
BANKS REPORTING IN THE FEDERAL RESERVE CUARTERLY INTEREST RATE SURVEY
A -4
NOT FOR QUOTATION OR PUBLICATION
ANSWERINGQUESTION
BANKS PCT
TABLE 1 (CONTINUED)
MUCHFIRMERPOLICY
BANKS PCT
MODERATELYFIRMERPOLICY
BANKS PCT
ESSENTIALLYUNCHANGEDPOLICY
BANKS PCT
FACTORS RELATING TO APPLICANT 2/
VALUE AS DEPOSITCR ORSOURCE OF COLLATERAL BUSINESS
INTENDED USE OF THE LOAN
LENDING TO "NONCAPTIVE" FINANCE COMPANIES
TERMS AND CONDITIONS:
INTEREST RATES CHARGED
COMPENSATING OR SUPPORTING BALANCES
ENFORCEMENT OF BALANCE REQUIREMENTS
ESTABLISHING NEW OR LARGER CREDIT LINES
ANSWERINGQUESTION
BANKS PCTWILLINGNESS TO MAKE OTHER TYPES OF LOANS
TERM LOANS TO BUSINESSES
CONSUMER INSTALMENT LOANS
SINGLE FAMILY MORTGAGE LOANS
MULTI-FAMILY MORTGAGE LOANS
ALL OTHER MORTGAGE LOANS
PARTICIPATION LOANS WITHCORRESPONDENT BANKS
LOANS TO BROKERS
CONSIDERABLYLESS
WILLING
BANKS PCT
MODERATELYLESS
WILLING
BANKS PCT
100.0
100.0
100.0
100.0
100.0
122 100.0
121 100.0
0.0
0.0
ESSENTIALLYUNCHANGED
BANKS PCT
99 79.8
91 74.0
91 74.6
106 67.6
103 84.4
107 87.7
106 87.6
MODEBATELYMOREWILLING
BANKS PCT
CONSIDERABLYMORE
WILLING
RANKS PCT
13.7
21.1
18.0
5.8
7.4
21 FOR THESE FACTORS, FIRMER MEANS THE FACTORS WERE CONSIDERED MORE IMPORTANT IN MAKING DECISIONS FOR APPROVINGrocniT QFlIIFrTr. ANn FASIER MEANS THEY WERE LESS IMPORTANT.
124 100.0
125 100.0
MODEIATELYEASIEQPOLICY
BANKS PCT
DAGE 02
MUCHEASIEPOLICY
BANKS PCT
99 79.9
111 88.8
20 1o.1
10 9.0
39 31.2
11 8.8
15 12.0
18 14.4
100.0
100.0
100.0
100.0
66.4
89.6
85.6
71.2
0.8
C.8
1.6
12.0
A-5
NOT FOR QUOTATION OR PUBLICATION TABLE 2
COMPARISON OF QUARTERLY CHANGES IN BANK LENDING PRACTICES AT BANKS GROUPED BY SIZE OF TOTAL DEPOSITS 1/(STATUS OF POLICY ON AUGUST 13, 1971, COMPARED TO THREE MONTHS EARLIER)
(NUMBER OF BANKS IN EACH COLUMN AS PER CENT OF TOTAL BANKS ANSWERING QUESTION)
STRENGTH OF DEMAND FOR COMMERCIAL ANDINDUSTRIAL LOANS (AFTER ALLOWANCE FOR
BANK'S USUAL SEA'SONAL VARIATION)
COMPARED TO THREE MONTHS AGO
ANTICIPATED DEMAND IN NEXT 3 MONTHS
TOTAL
$1 & UNDEROVER $1
100 100
100 100
SIZE OF BANK
MUCHSTRONGER
$I G UNDEROVER $1
-- TOTAL DEPOSITS IN BILLIONS
MOCFRATELYSTRONGER
$1 £ UNDEROVER $1
ESSENTIALLYUNCHANGED
S &t UNDEPOVER $1
MODERATELYWEAKER
$1 & UNDEROVER st
MUCHWEAKER
$1 & UNDFeOVER $l
57 54 11
52 43 0
MODERATELYFIRMER
ESSENTIALLYUNCHANGED
MODERATELYWEAKER
$1 E UNDEROVER $1
LENDING TO NONFINANCIAL BUSINESSES
TERMS AND CONDITIONS:
INTEREST RATES CHARGED 100 100
COMPENSATING OR SUPPORTING BALANCES 100 100
STANDARDS OF CREDIT WORTHINESS 100 10C
MATURITY OF TERM LOANS 100 100
REVIEWING CREDIT LINES OR LOAN APPLICATIONS
ESTABLISHED CUSTOMERS 100 100
NEW CUSTOMERS 100 100
LOCAL SERVICE AREA CUSTOMERS 100 100
NONLOCAL SERVICE AREA CUSTOMERS 100 100
$1 t UNDER $1 & UNDER $1 & UNDER $1 & UNDER sl & UNDEROVER $1 OVER $1 OVER $1 OVER $1 OVER $1
1/ SURVEY OF LENDING PRACTICES AT 54 LARGE BANKS (DEPOSITS OF $I BILLION OR MORE) AND$1 BILLION) REPORTING IN THE FEDERAL RESERVE QUARTERLY INTEREST RATE SURVEY AS OF
71 SMALL BANKS (AUGUST 13, 1971.
DEPOSITS OF LESS THAN
PAGE C3
TOTALMUCH
FIRMERMUCHWEAKER
NOT FOR QUOTATION OR PUBLICATION
FACTORS RELATING TO APPLICANT 2/
VALUE AS DEPOSITOR ORSOURCE OF COLLATERAL BUSINESS
INTENDED USE OF THE LOAN
LENDING TO "NONCAPTIVE" FINANCE COMPANIES
TERMS AND CONDITIONS:
INTEREST RATES CHARGED
COMPENSATING OR SUPPORTING BALANCES
ENFORCEMENT OF BALANCE REQUIREMENTS
ESTABLISHING NEW OR LARGER CREDIT LINES
WILLINGNESS TO MAKE OTHER TYPES OF LOANS
TERM LOANS TO BUSINESSES
CONSUMER INSTALMENT LOANS
SINGLE FAMILY MORTGAGE LOANS
MULTI-FAMILY MORTGAGE LOANS
ALL OTHER MORTGAGE LOANS
PARTICIPATION LOANS WITHCORRESPONDENT BANKS
LOANS TO BROKERS
NUMBERANSWERINGQUESTION
$I C UNDEROVER $1
100 100
100 100
100 100
100 100
100 100
100 100
NUMBERANSWERINGQUESTION
$1 E UNDEROVER $1
100 100
100 100
100 100
100 100
100 100
100 100
100 100
SIZE OF BANKMUCH
FIRMERPOLICY
Sl E UNDEROVER $1
CONSIDERABLYLESS
WILLING
$1 & UNDEROVER $1
0 0
-- TOTAL DEPOSITS IN BILLIONSMODERATELY ESSENTIALLY MODERATELY
FIRMER UNCHANGED EASIERPOLICY POLICY P"LICY
$1 & UNDER $1 & UNDER $1 & UNDEROVER $1 OVER $1 OVFR $1
MODERATELYLESS
WILLING
$1 & UNDEROVER $1
ESSENTIALLYUNCHANGED
I$ & UNDEROVER 11
2 6
6 4
MODERATELYMJRE
WILLING
$1 C UNDEROVER SL
MUCHEASI -PL ICY
it E L4'aFOVER il
CONSIDERABLYMORE
WILLING
$1 & UNDFROVER Il
8 9
6 9
2/ FOR THESE FACTORS, FIRMER MEANS THE FACTORS WERE CONSIDERED MORE IMPORTANT IN MAKINGCREDIT REQUESTS, AND EASIER MEANS THEY WERE LESS IMPORTANT.
DECISIONS FOR APPROVING
TABLE 2 (CONTINUED) PAGE 04
A - 7
NOT FOR QUOTATION OR PUBLICATION TABLE 3 PAGE 05
QUARTERLY SURVEY OF CHANGES IN BANK LENDING PRACTICES AT SELECTED LARGE BANKS IN THE U.S. 1/STATUS OF POLICY ON AUGUST 13, 1971 COMPARED TO THREE MONTHS EARLIER
INUMBER OF BANKS)
ALL BOS- NFW YORK PHIL- CLEVE- RICH- ATLAN- CHIC- ST. MINNE- KANS. DAL - ANDSTS TON TOTAL CITY OUTSIDE ADEL. LAND MIND TA AGO LnUIS APOLIS CITY IAS FRAN
STRENGTH OF DEMAND FOR CCMMERCIAL ANDINDUSTRIAL LOANS (AFTER ALLOWANCE FOR
BANK'S USUAL SEASONAL VARIATION)
COMPARED TO 3 MONTHS AGO 125
MUCH STRONGER 1 0 0 0 0 0 0 0 0 1 0 0 0 0MODERATELY STRONGER 38 0 5 2 3 3 1 4 5 7 2 1 3 3 4ESSENTIALLY UNCHANGED 69 7 14 7 7 2 6 5 5 6 5 2 6 4 7MODERATELY WEAKER 16 1 1 0 1 0 4 3 0 1 2 0 0 2 ?MUCH WEAKER I 0 0 0 0 1 0 0 0 0 0 0 0 0 0
ANTICIPATED DEMAND NEXT
THREE MONTHS 125
MUCH STRONGER 1 0 0 0 0 0 0 0 1 0 0 O 0 0 0MODERATELY STRONGER 65 3 11 6 5 5 4 9 7 7 6 1 5 3 4ESSENTIALLY UNCHANGED 58 5 8 3 5 1 7 3 2 9 3 2 4 6 9MODERATELY WEAKER 1 0 1 0 1 0 0 0 0 0 0 0 0 0 0MUCH WEAKER 0 0 0 0 0 0 0 0 0 0 0 0 0 0 0
LENDING TO NONFINANCIALBUSINESSES
TERMS AND CONDITIONS
INTEREST RATES CHARGED 125
MUCH FIRMER POLICY 3 0 0 0 0 1 0 0 1 1 0 0 0 0 0MODERATELY FIRMER POLICY 79 4 8 3 5 3 10 9 7 8 6 3 6 5 10ESSENTIALLY UNCHANGED POLICY 42 4 12 6 6 1 1 3 2 6 3 0 3 4 3MODERATLEY EASIER POLICY 1 0 0 0 0 1 0 0 0 0 0 0 0 0 0MUCH EASIER POLICY 0 0 0 0 0 0 0 0 0 0 0 0 0 0 0
COMPENSATING BALANCES 125
MUCH FIRMER POLICY 0 0 0 0 0 0 0 0 0 0 0 0 0 0 0MODERATELY FIRMER POLICY 28 0 4 2 2 2 2 3 4 3 1 0 2 4 3ESSENTIALLY UNCHANGED POLICY 95 8 16 7 9 3 9 8 6 12 8 3 7 5 10MODERATLEY EASIER POLICY 2 0 0 0 0 1 0 1 0 0 0 0 0 0MUCH EASIER POLICY 0 0 0 0 0 0 0 0 0 0 0 0 0 0 0
1/ SURVEY OF LENDING PRACTICES ATAS OF AUGUST 13, 1971.
125 LARGE BANKS REPORTING IN THE FEDERAL RESERVE QUARTERLY INTEREST RATE SURVEY
NOT FOR QUOTATION OR PUBLICATION
ALL BOS- NEW YORK PHIL- CLEVE- RICH- ATLAN- CHIC- ST. MINNF- KANS. DAL- SANDSTS TON TOTAL CITY OUTSIDE ADEL. LAND MOND TA AGO LOUIS APOLIS CITY LAS FPAN
LENDING TO NONFINANCIALBUSINESSES
TERMS AND CONDITIONS
STANDARDS OF CREDIT WORTHINESS 125
MUCH FIRMER POLICY 2 0 0 0 0 0 0 0 0 0 1 0 0 0 1MODERATELY FIRMER POLICY 12 0 1 1 0 0 0 2 3 2 0 0 2 1 1ESSENTIALLY UNCHANGED POLICY 111 8 19 8 11 6 11 10 7 13 H 3 7 P 11MOOERATLEY EASIER POLICY 0 0 C O O 0 0 C O 0 0 O S 0 0MUCH EASIER POLICY O 0 C 0 0 O O 0 0 0 0 0 0 0 0
MATURITY OF TERM LOANS 125
MUCH FIRMER POLICY 0 0 C 0 0 0 0 0 0 0 0 0 0 0 0MODERATELY FIRMER POLICY 8 0 0 0 0 0 0 2 3 1 0 0 0 1 1ESSENTIALLY UNCHANGED POLICY 110 8 19 9 10 6 11 10 7 14 6 3 7 7 12MODERATLEY EASIER POLICY 7 0 1 0 1 0 0 0 0 0 3 0 2 1 0MUCH EASIER POLICY 0 O 0 0 O 0 0 0 0 0 0 0 0 0 0
REVIEWING CREDIT LINES OR LOANS
ESTABLISHED CUSTOMERS 125
MUCH FIRMER POLICY 0 0 0 0 0 0 0 0 0 0 0 0 0 0 0MODERATELY FIRMER POLICY 6 1 0 0 0 0 1 0 2 0 0 0 0 0 2ESSENTIALLY UNCHANGED-POLICY 113 7 19 9 10 5 10 10 8 15 9 .3 7 9 11MODERATLEY EASIER POLICY 6 0 1 0 1 1 0 2 0 0 0 0 2 C CMUCH EASIER POLICY 0 0 0 0 0 0 0 0 0 0 0 0 0 C C
NEW CUSTOMERS 125
MUCH FIRMER POLICY 2 0 0 0 0 0 0 0 1 0 0 0 0 0 1MODERATELY FIRMER POLICY 12 1 0 0 0 0 1 1 2 1 0 0 1 1 4ESSENTIALLY UNCHANGED POLICY 99 7 17 9 8 5 8 10 7 13 8 3 7 7 7MODERATLEY EASIER POLICY 12 0 3 0 3 1 2 1 0 1 1 0 1 1 1MUCH EASIER POLICY 0 0 0 0 0 0 0 0 0 0 0 0 0 0
LOCAL SERVICE AREA CUSTOMERS 124
MUCH FIRMER POLICY 0 0 0 0 0 0 0 0 0 0 0 0 0 0 0MODERATELY FIRMER POLICY 6 1 0 0 0 0 1 0 2 0 0 0 1 0 1ESSENTIALLY UNCHANGED POLICY 112 7 18 9 9 5 10 11 8 15 8 3 6 9 12MODERATLEY EASIER POLICY 6 0 1 0 1 1 0 1 0 0 1 0 2 0 0MUCH EASIER POLICY 0 0 0 0 0 0 0 0 0 0 0 0 0 0 C
TABLE 3 (CONTINUED) °AGE C6

A -9
NOT FOR QUOTATION OR PUBLICATION TABLE 3 (CONTINUED)
LENDING TO NONFINANCIALBUSINESSES
ALL BOS- NEW YORKDSTS TON TOTAL CITY OUTSIDE
PHIL-ADEL.
CLEVE- RICH- ATLAN- CHIC- ST.LAND MOND TA AGO LOUIS
MINNE- KANS.APOLIS CITY
REVIEWING CREDIT LINES OR LOANS
NONLOCAL SERVICE AREA CUST
MUCH FIRMER POLICYMODERATELY FIRMER POLICYESSENTIALLY UNCHANGED POLICYMODERATLEY EASIER POLICYMUCH EASIER POLICY
FACTORS RELATING TO APPLICANT 2/
VALUE AS DEPOSITOR OR SOURCEOF COLLATERAL BUSINESS
MUCH FIRMER POLICYMODERATELY FIRMER POLICYESSENTIALLY UNCHANGED POLICYMODERATLEY EASIER POLICYMUCH EASIER POLICY
INTENDED USE CF LGAN
MUCH FIRMER POLICYMODERATELY FIRMER,POLICYESSENTIALLY UNCHANGED POLICYMODERATLEY EASIER POLICYMUCH EASIER POLICY
LENDING TO "NONCAPTIVE"FINANCE COMPANIES
TERMS AND CONDITIONS
INTEREST RATES CHARGED
MUCH FIRMER POLICYMODERATELY FIRMER POLICYESSENTIALLY UNCHANGED POLICYMODERATLEY EASIER POLICYMUCH EASIER POLICY
2/ FOR THESE FACTORS, FIRMER MEANS THE FACTORS WERECREDIT REQUESTS, AND EASIER MEANS THEY WERE LESS
CONSIDERED MORE IMPORTANT IN MAKING DECISIONS FOR APPROVINGIMPORTANT.
PAGE 07
DAL- SANLAS FRAN
A - 10
NOT FOR QUOTATION OR PUBLICATION TABLE 3 (CONTINUED)
WILLINGNESS TO MAKE OTHERTYPES OF LOANS
SINGLE FAMILY MORTGAGE LOANS 122
CONSIDERABLY LESS WILLING 0MODERATLEY LESS NILLING 8ESSENTIALLY UNCHANGED 91
MODERATELY MORE WILLING 22CONSIDERABLY MORE WILLING 1
MULTIFAMILY MORTGAGE LOANS 121
CONSIDERABLY LESS WILLING 1MODERATLEY LESS WILLING 6
ESSENTIALLY UNCHANGED 106MODERATELY MORE WILLING 7
CONSIDERABLY MORE WILLING I
ALL OTHER MORTGAGE LOANS 122
CONSIDERABLY LESS WILLING 0MODERATLEY LESS WILLING 9
ESSENTIALLY UNCHANGED 103
MODERATELY MORE WILLING 9
CONSIDERABLY MORE WILLING 1
PARTICIPATION LOANS WITHCORRESPONDENT BANKS 122
CONSIDERABLY LESS WILLING 0MODERATLEY LESS WILLING 5
ESSENTIALLY UNCHANGED 107MODERATELY MORE WILLING 10CONSIDERABLY MORE WILLING 0
LOANS TO BROKERS 121
CONSIDERABLY LESS WILLING 0MODERATLEY LESS WILLING 6
ESSENTIALLY UNCHANGED 106
MODERATELY MORE WILLING 9
CONSIDERABLY MORE WILLING 0
NUMBER OF BANKS 125
ALL BOS- NEW YORKDSTS TON TOTAL CITY OUTSIDE
0 0 0 0 00 0 0 0 07 17 8 9 61 2 .0 2 00 0 0 0 0
PHIL- CLEVE- RICH- ATLAN- CHIC- ST. MINNE- KANS. OAL-ADEL. LAND MONO TA AGO LOUIS APOLIS CITY LAS
0 00 0
10 11l I1 10 0
2 10 0
SANFRAN
1 0 0 0 00 0 0 0 0
PAGE 09
A - 11
NOT FOR QUOTATION OR PUBLICATION TABLE 3 (CONTINUED) PAGE 09
ALL BOS- NEW YORK PHIL- CLEVE- RICH- ATLAN- CHIC- ST. MINNF- KANS. DAL- SANDSTS TON TOTAL CITY OUTSIDE ADEL. LAND MONO TA AGO LOUIS APOLIS CITY LAS FRAN
LENDING TO "NONCAPTIVE"FINANCE COMPANIES
TERMS AND CONDITIONS:
SIZE OF COMPENSATING BALANCES 125
MUCH FIRMER POLICY 1 0 0 0 0 0 0 0 1 0 0 0 0 0 0MODERATELY FIRMER POLICY 11 0 0 0 0 1 0 2 1 3 0 0 1 1 2ESSENTIALLY UNCHANGED POLICY 112 8 20 9 11 4 11 10 8 12 9 3 8 8 11MODERATLEY EASIER POLICY 1 0 0 0 0 1 0 0 0 0 0 0 0 0 0MUCH EASIER POLICY 0 0 0 0 0 0 0 0 0 0 0 0 0 0 0
ENFORCEMENT OFBALANCE REQUIREMENT 125
MUCH FIRMER POLICY 1 0 0 0 0 0 0 0 1 0 0 0 0 0 0MODERATELY FIRMER POLICY 15 0 2 0 2 0 1 2 1 4 0 0 1 2 2ESSENTIALLY UNCHANGED POLICY 107 8 18 9 9 5 9 10 8 11 9 3 8 7 11MODERATLEY EASIER POLICY 2 0 0 0 0 1 1 0 0 0 0 0 C 0 0MUCH EASIER POLICY 0 0 0 0 0 0 0 0 0 0 0 C C 0 0
ESTABLISHING NEW OR LARGERCREDIT LINFS 125
MUCH FIRMER POLICY 3 0 0 0 0 0 0 1 1 0 0 0 C 0 1MODERATELY FIRMER POLICY 18 0 2 0 2 0 0 2 1 4 1 0 1 2 5ESSENTIALLY UNCHANGED POLICY 89 7 17 9 8 3 10 9 8 7 6 3 7 6 6MODERATLEY EASIER POLICY 15 1 1 0 1 3 1 0 0 4 2 0 1 1 1MUCH EASIER POLICY 0 0 0 0 0 0 0 0 0 0 0 0 0 3
WILLINGNESS TO MAKE OTHERTYPES OF LOANS
TERM LOANS TO BUSINESSES 124
CONSIDERABLY LESS WILLING 0 0 0 0 0 0 0 0 0 0 0 0 0 0 0MODERATLEY LESS WILLING 8 0 0 0 0 0 0 0 2 2 0 0 0 1 3ESSENTIALLY UNCHANGEC 99 6 15 8 7 5 9 10 7 13 9 3 7 6 9MODERATELY MORE WILLING 17 2 4 0 4 1 2 2 1 0 0 0 2 2 1CONSIDERABLY MORE WILLING 0 0 0 0 0 0 0 0 0 0 0 0 0 0 0
CONSUMER INSTALMENT LOANS 123
CONSIDERABLY LESS WILLING 0 0 0 0 0 0 0 0 0 0 0 0 0 0 0 0MODERATLEY LESS WILLING 2 0 0 0 0 0 0 0 2 0 0 0 0 0 0ESSENTIALLY UNCHANGED 91 7 11 5 6 4 9 10 7 10 7 3 7 7 9MODERATELY MORE WILLING 26 1 6 2 4 1 2 2 1 5 1 0 2 2 3CONSIDERABLY MORE WILLING 4 0 1 0 1 1 0 0 0 0 1 0 0 0 1

CONFIDENTIAL (FR)
Supplemental Appendix B
STATE AND LOCAL GOVERNMENT LONG-TERM BORROWING ANTICIPATIONSAND REALIZATIONS:
Summary-Fiscal Year 1971*
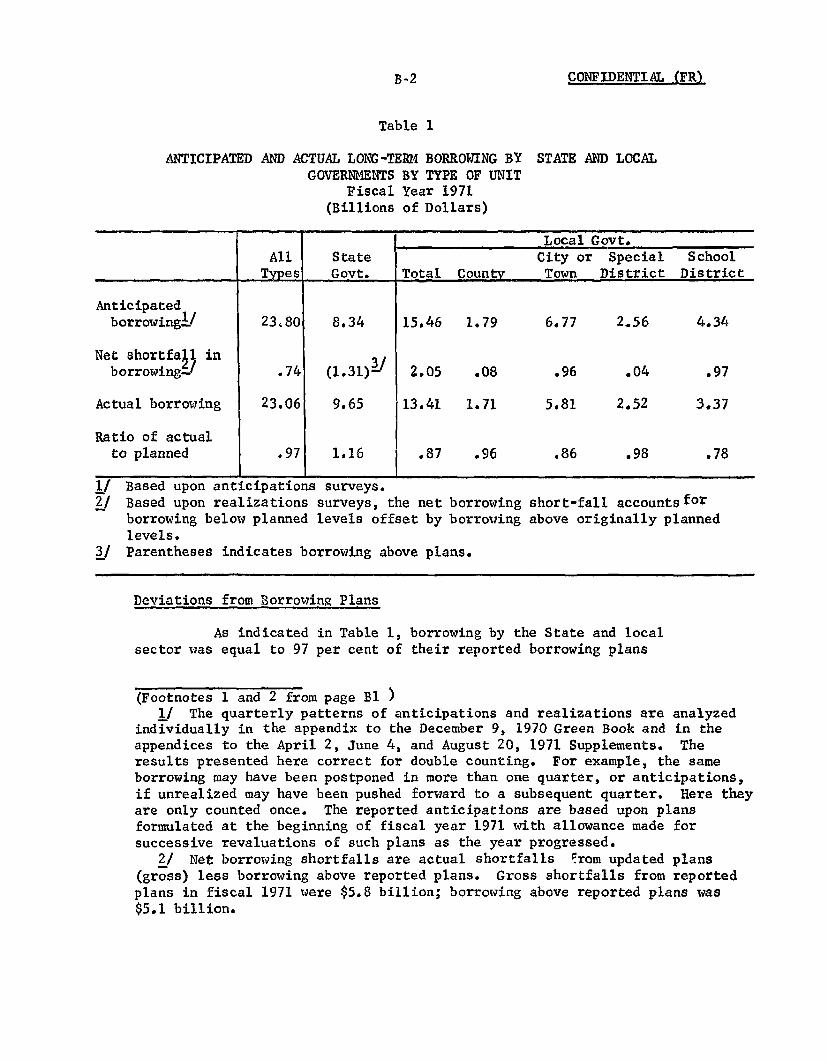
The four FRB-Census quarterly surveys of State and localgovernment long-term borrowing anticipations and realizations forfiscal year 1971 indicate that this sector was able substantially tofulfill its borrowing plans; financial markets thus did not act as abarrier to their capital spending.1/ A record volume of $23 billion inlong-term tax-exempt issues was floated during this period which hadgenerally been characterized by sharply declining interest rates andby strong demands for municipal securities by commercial banks. Actualborrowing fell only about $700 million below reported anticipations,in distinct contrast to the nearly $10 billion of net borrowing short-falls in fiscal 1970.2/
Actual and Anticipated Long-Term BorrowingState and Local Governments#/
Fiscal 1965-1972
$ Billions 25 5
SActual
20 Anticipated - 20
15 - 15
10 -10i0 I 10
1965 1966 1967 1968 1969 1970 1971 1972Fiscal Year
#/ Actual borrowing for fiscal years 1970 and 1971 is the sum of thatpart of borrowing plans successfully accomplished plus borrowing abovereported plans.
* Prepared by Paul Schneiderman, Economist, Capital Markets Section,Division of Research and Statistics.
(Footnotes 1 and 2 are on the following page)
CONFIDENTIAL (FR)
Table 1
ANTICIPATED AND ACTUAL LONG-TERM BORROWING BYGOVERNMENTS
Fiscal(Billions
STATE AND LOCALBY TYPE OF UNITYear 1971of Dollars)
Local Govt.All State City or Special School
Types Govt. Total County Town District District
Anticipatedborrowing 1/ 23.80 8.34 15.46 1.79 6.77 2.56 4.34
Net shortfall inborrowing 2/ .74 (1.31)- 2.05 .08 .96 .04 .97
Actual borrowing 23.06 9.65 13.41 1.71 5.81 2.52 3.37
Ratio of actualto planned .97 1.16 .87 .96 .86 .98 .78
1/ Based upon anticipations surveys.
2/ Based upon realizations surveys, the net borrowing short-fall accountsforborrowing below planned levels offset by borrowing above originally plannedlevels.
3/ Parentheses indicates borrowing above plans.
Deviations from Borrowing Plans
As indicated in Table 1, borrowing by the State and localsector was equal to 97 per cent of their reported borrowing plans
(Footnotes 1 and 2 from page B1 )1/ The quarterly patterns of anticipations and realizations are analyzed
individually in the appendix to the December 9, 1970 Green Book and in theappendices to the April 2, June 4, and August 20, 1971 Supplements. Theresults presented here correct for double counting. For example, the sameborrowing may have been postponed in more than one quarter, or anticipations,if unrealized may have been pushed forward to a subsequent quarter. Here theyare only counted once. The reported anticipations are based upon plansformulated at the beginning of fiscal year 1971 with allowance made forsuccessive revaluations of such plans as the year progressed.
2/ Net borrowing shortfalls are actual shortfalls from updated plans(gross) less borrowing above reported plans. Gross shortfalls from reportedplans in fiscal 1971 were $5.8 billion; borrowing above reported plans was$5.1 billion.
B-3 CONFIDENTIAL (FR)
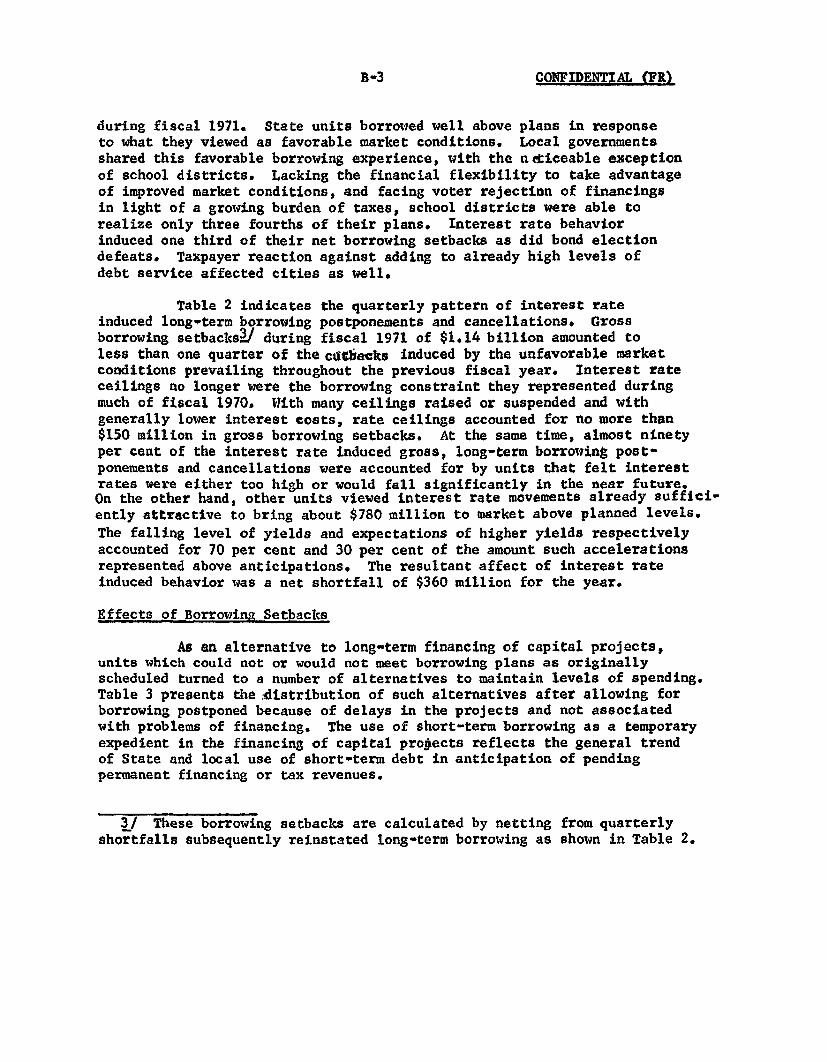
during fiscal 1971. State units borrowed well above plans in responseto what they viewed as favorable market conditions. Local governmentsshared this favorable borrowing experience, with the noticeable exceptionof school districts. Lacking the financial flexibility to take advantageof improved market conditions, and facing voter rejection of financingsin light of a growing burden of taxes, school districts were able torealize only three fourths of their plans. Interest rate behaviorinduced one third of their net borrowing setbacks as did bond electiondefeats. Taxpayer reaction against adding to already high levels ofdebt service affected cities as well.
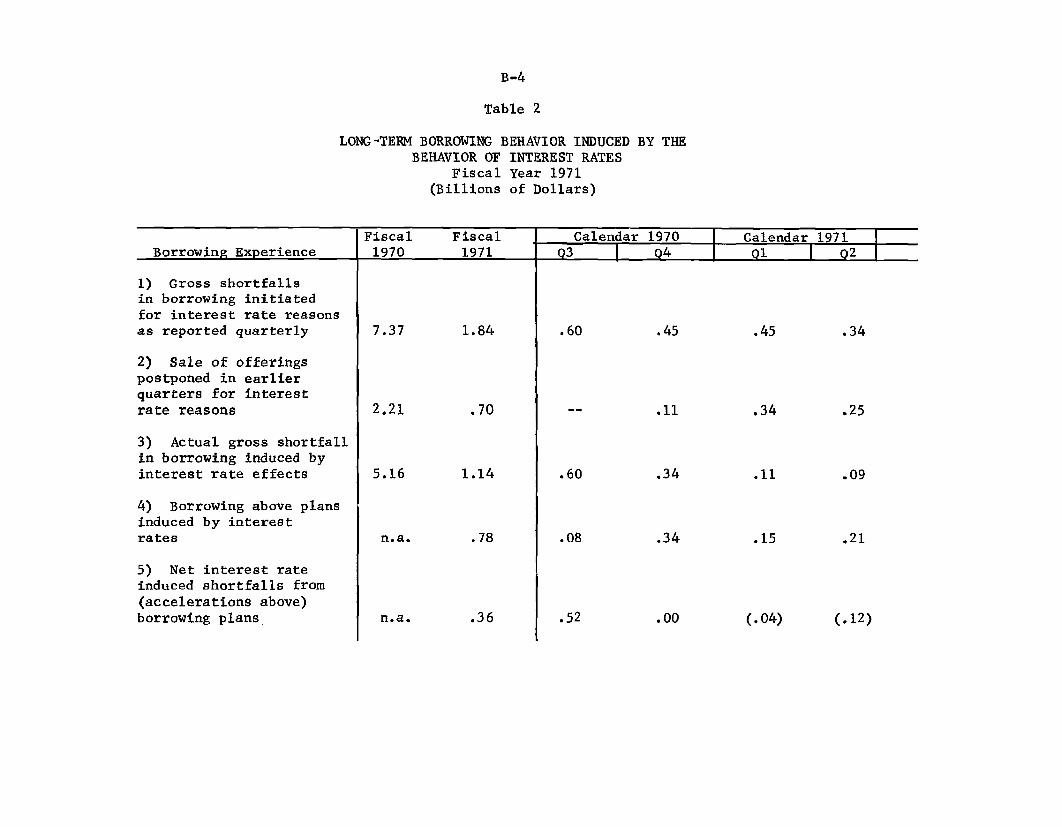
Table 2 indicates the quarterly pattern of interest rateinduced long-term borrowing postponements and cancellations. Grossborrowing setbacks 3/ during fiscal 1971 of $1.14 billion amounted toless than one quarter of the cutbacks induced by the unfavorable marketconditions prevailing throughout the previous fiscal year. Interest rateceilings no longer were the borrowing constraint they represented duringmuch of fiscal 1970. With many ceilings raised or suspended and withgenerally lower interest costs, rate ceilings accounted for no more than$150 million in gross borrowing setbacks. At the same time, almost ninetyper cent of the interest rate induced gross, long-term borrowing post-ponements and cancellations were accounted for by units that felt interestrates were either too high or would fall significantly in the near future.On the other hand, other units viewed interest rate movements already suffici-ently attractive to bring about $780 million to market above planned levels.
The falling level of yields and expectations of higher yields respectivelyaccounted for 70 per cent and 30 per cent of the amount such accelerationsrepresented above anticipations. The resultant affect of interest rateinduced behavior was a net shortfall of $360 million for the year.
Effects of Borrowing Setbacks
As an alternative to long-term financing of capital projects,units which could not or would not meet borrowing plans as originallyscheduled turned to a number of alternatives to maintain levels of spending.Table 3 presents the distribution of such alternatives after allowing forborrowing postponed because of delays in the projects and not associatedwith problems of financing. The use of short-term borrowing as a temporaryexpedient in the financing of capital projects reflects the general trendof State and local use of short-term debt in anticipation of pendingpermanent financing or tax revenues.
3/ These borrowing setbacks are calculated by netting from quarterlyshortfalls subsequently reinstated long-term borrowing as shown in Table 2.
B-4
Table 2
LONG-TERM BORROWING BEHAVIOR INDUCED BY THEBEHAVIOR OF INTEREST RATES
Fiscal Year 1971(Billions of Dollars)
Fiscal Fiscal Calendar 1970 Calendar 1971Borrowing Experience 1970 1971 Q3 4 Q1 Q2
1) Gross shortfallsin borrowing initiatedfor interest rate reasonsas reported quarterly 7.37 1.84 .60 .45 .45 .34
2) Sale of offeringspostponed in earlierquarters for interestrate reasons 2.21 .70 -- .11 .34 .25
3) Actual gross shortfallin borrowing induced byinterest rate effects 5.16 1.14 .60 .34 .11 .09
4) Borrowing above plansinduced by interestrates n.a. .78 .08 .34 .15 .21
5) Net interest rateinduced shortfalls from(accelerations above)borrowing plans n.a. .36 .52 .00 (.04) (.12)
CONFIDENTIAL (FR)
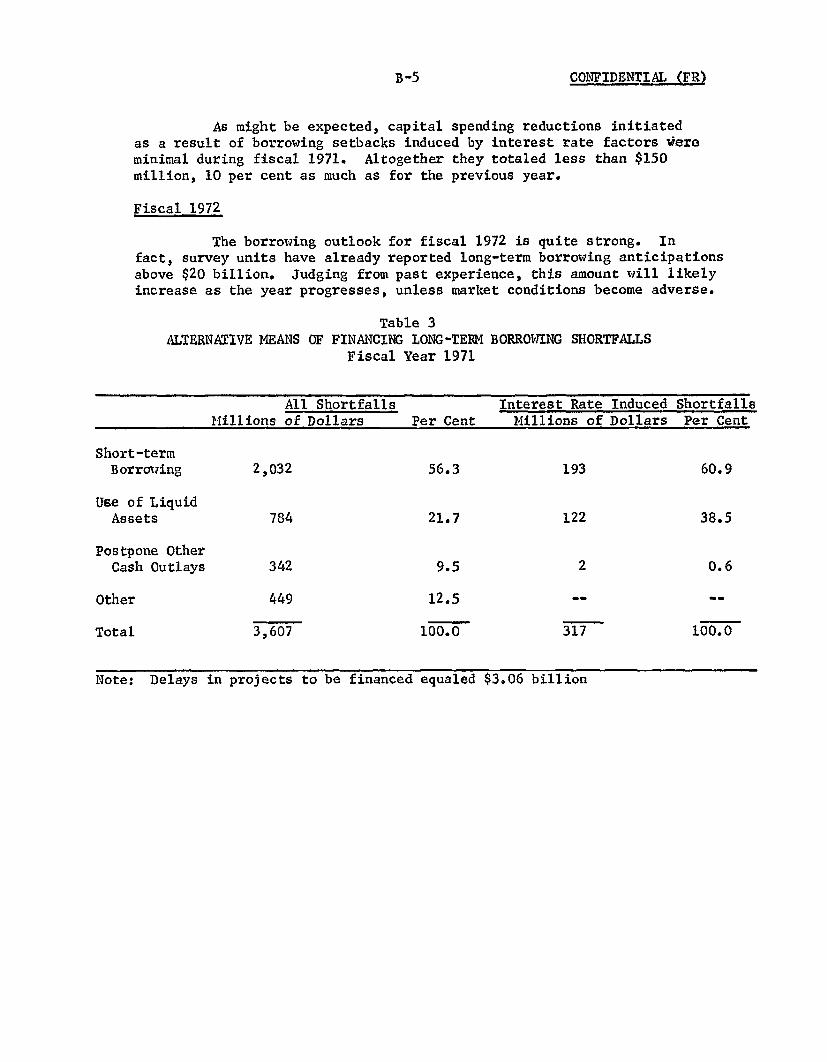
As might be expected, capital spending reductions initiatedas a result of borrowing setbacks induced by interest rate factors wereminimal during fiscal 1971. Altogether they totaled less than $150million, 10 per cent as much as for the previous year.
Fiscal 1972
The borrowing outlook for fiscal 1972 is quite strong. Infact, survey units have already reported long-term borrowing anticipationsabove $20 billion. Judging from past experience, this amount will likelyincrease as the year progresses, unless market conditions become adverse.
Table 3ALTERNATIVE MEANS OF FINANCING LONG-TERM
Fiscal Year 1971BORROWING SHORTFALLS
All Shortfalls Interest Rate Induced ShortfallsMillions of Dollars Per Cent Millions of Dollars Per Cent
Short-termBorrowing 2,032 56.3 193 60.9
Use of LiquidAssets 784 21.7 122 38.5
Postpone OtherCash Outlays 342 9.5 2 0.6
Other 449 12.5
Total 3,607 100.0 317 100.0
Note: Delays in projects to be financed equaled $3.06 billion
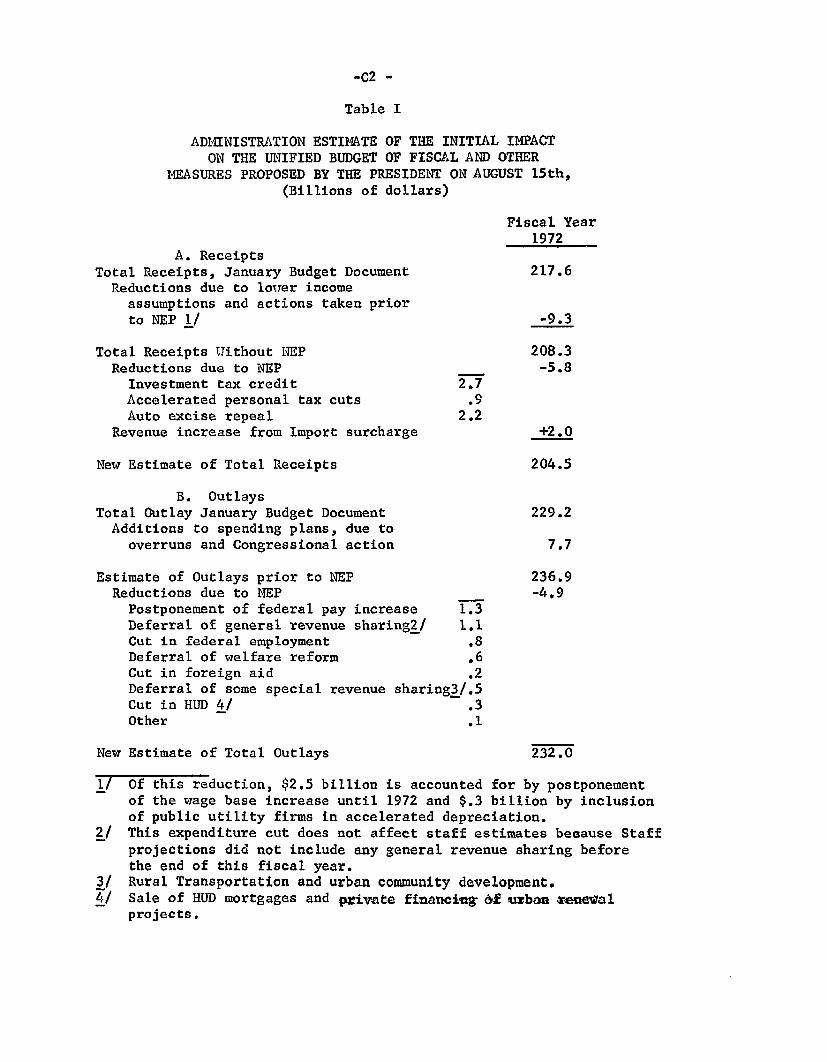
APPENDIX C FISCAL MEASURES CONTAINED IN THE "NEW ECONOMIC POLICY"*
The fiscal incentives included in the New Economic Policyannounced by the President on August 15 are intended to provideadded stimulus to the private sector economy while temporarily slowingthe growth of the public sector. To evaluate the overall impactof the President's new program, the effects of the wage-price measuresand the impact of the whole policy package on consumer and businessconfidence would need to be added to the specific effects of themore active fiscal policy proposals. Such an overall evaluation--with possible effects on the consumer saving rate--is not attemptedhere. By itself the proposed fiscal package (excluding the importsurcharge) appears to be moderately stimulative through the secondquarter of 1972, and thereafter the impact appears to grow to moresignificant proportions. The import surcharge is excluded from theabove analysis. Although it will raise Federal revenue, itsrestraining effects are more likely to fall on foreigners than ondomestic production.
Since the dollar magnitudes are about in balance, someanalysts outside of government have suggested that the impact onprivate income and spending of the proposed tax cuts would be aboutoffset by the proposed reduction in outlays. There is, however,no easy way to compare the dollar effects of programs that changeincentives--such as the repeal of the excise tax on autos that wouldreduce the price of cars, and the investment tax credit--with cuts ingovernment spending and with personal income tax cuts. As far asthe expenditure cuts are concerned staff estimates suggest that thePresident's program includes some reductions in expenditures thatwould have been unlikely in any event. Furthermore, presentindications are that the offset to the tax incentives arising fromthe recommended expenditure cuts will diminish somewhat in thesecond half of calendar 1972 because the spending cuts would beattained primarily through temporary postponement of plannedexpenditures, and because of the lagged effects of the tax cuts,particularly the investment tax credit.
I. The Fiscal Program
The Treasury's latest estimates indicate that the proposedtax cuts--all of which require Congressional approval--would reduceFederal revenues in the current fiscal year by $5.8 billion. The10 per cent surcharge could offset as much as $2.0 billion of this
* Prepared by W. Beeman, economist, Government Finance Section.
-C2 -
Table I
ADMINISTRATION ESTIMATE OF THE INITIAL IMPACTON THE UNIFIED BUDGET OF FISCAL AND OTHER
MEASURES PROPOSED BY THE PRESIDENT ON AUGUST 15th,(Billions of dollars)
Fiscal Year1972
A. ReceiptsTotal Receipts, January Budget Document 217.6
Reductions due to lower incomeassumptions and actions taken priorto NEP 1/ -9.3
Total Receipts Without NEP 208.3Reductions due to NEP -5.8
Investment tax credit 2.7Accelerated personal tax cuts .9Auto excise repeal 2.2
Revenue increase from Import surcharge +2.0
New Estimate of Total Receipts 204.5
B. OutlaysTotal Outlay January Budget Document 229.2Additions to spending plans, due to
overruns and Congressional action 7.7
Estimate of Outlays prior to NEP 236.9Reductions due to NEP -4.9
Postponement of federal pay increase 1.3Deferral of general revenue sharing2/ 1.1Cut in federal employment .8Deferral of welfare reform .6Cut in foreign aid .2Deferral of some special revenue sharing3/.5Cut in HUD 4/ .3Other .1
New Estimate of Total Outlays 232.0
1/ Of this reduction, $2.5 billion is accounted for by postponementof the wage base increase until 1972 and $.3 billion by inclusionof public utility firms in accelerated depreciation.
2/ This expenditure cut does not affect staff estimates because Staffprojections did not include any general revenue sharing beforethe end of this fiscal year.
3/ Rural Transportation and urban community development.4/ Sale of HUD mortgages and private financing of urban renewal
projects.

-C3 -
revenue loss, depending on the duration of the surcharge and theextent to which it curtails imports. On the expenditure side, thePresident has proposed a $4.9 billion reduction in expenditures,$3.8 billion in terms of prior Board staff projections.
A. Revenue Measures.
(1) The Administration proposes an investment tax credit,called the "Job Development Credit", equal to 10 per cent (or lessdepending on useful life) of the cost of new machineryand equipmentacquired after August 15, 1971 and before August 16, 1972. Thecredit would drop to 5 per cent after August 15, 1972 except forproperty ordered before August 16, 1972 and put in service byFebruary 15, 1973. No credit would be allowed for used property,for foreign-produced property or for property produced in theU.S. if more than 50 per cent of the value is attributable toimported materials. The Treasury now estimates that this measurewould reduce Federal revenues by $2.7 billion in the current fiscalyear and by $4.1 billion in fiscal year 1973.
The impact on investment spending of the proposed taxcredit is difficult to estimate as we have not previously hadexperience with a changing rate--10 per cent falling to 5 per cent--or with the foreign exclusion. Certainly the higher initial 10per cent rate is expected to shorten the lagged effect on investmentspending relative to the flat 7 per cent credit in effect earlier.One Staff simulation (FRB model) of the proposed investment taxcredit indicates that the effect on investment spending would bea net increment of about $4.0 billion (annual rates) in the secondquarter of 1972 and $10 billion in the 4th quarter of 1972. Thisestimate suggests a quicker response than previously experienced.While anticipating a significant boost in investment spending, thejudgemental forecast suggests that such a quick response is notlikely to be attained even with the added incentive of a higherinitial rate, given the substantial amounts of available capacitynow idle. Furthermore there are news reports that Congressman Millsfavors a flat 7 per cent credit which undoubtedly would both delayand reduce the initial impact on investment. Other adjustments inthe proposal that have been mentioned in the press, such as makingthe credit retroactive to April 1, 1972 and extending it to used aswell as new equipment, probably would not greatly affect theeconomic outlook.
There are also reports that the recently adopted liberalizeddepreciation may be dropped or reduced in favor of the more powerful
investment tax credit. While such a development would partiallyoffset the stimulus provided in the President's fiscal program, the
-C4 -
two measures, as proposed, are not fully additive because an
accelerated depreciation schedule can reduce the allowable invest-
ment credit as the full credit can be claimed only if the equip-
ment has a useful life of at least 8 years.
(2) The 7 per cent excise tax on domestic and foreign
autos would be repealed, effective August 15, 1971. The initial
effect of this measure is to reduce the GNP deflator and nominal
GNP, since indirect business taxes are a component of GNP. Thismeasure is also expected to reduce Federal receipts by about $2.2billion in fiscal year 1972.
By itself the repeal of the auto excise tax would reduce
prices and increase sales of domestic and foreign autos. However,
this tax cut in combination with the 10 per cent import surcharge
(6.5 per cent on autos) is expected to produce a significant increasein the demand for domestically produced autos.
(3) The President's proposal would also accelerate, toJanuary 1972, previously legislated personal income tax relief thatwas scheduled to go into effect in 1973. The personal income taxexemption would increase $100 to $750 instead of the planned $50increase and the standard deduction from 13 to 15 per cent ($2,000maximum) instead of to 14 per cent. The initial impact on receiptsof accelerating these personal tax relief measures is expected tobe at least $.9 billion in Fiscal 1972 and $2.2 billion in calendar1972. Recent news reports indicate that Congressman Mills favors aJuly 1, 1971 starting date for this speedup and also an increase inthe minimum standard deduction. Assuming that the President'srecommendation is enacted, as proposed, this acceleration of taxrelief together with previously enacted reductions in personal taxeswill have an initial impact on personal disposable income of$4.8 billion in the first quarter of 1972. Some of this stimulativeeffect will be offset by scheduled increase in social security taxes.
B. Expenditure Measures.
In his message the President also requested that thegeneral revenue sharing and welfare reform programs be postponedfor three months and one year, respectively, and that two of thespecial revenue sharing programs (rural transportation and urbancommunity development) also be postponed, one, for six months, theother for one year. The President proposed other expenditure cutsincluding: a six months postponement of the Federal pay raisescheduled for January 1972, a 5 per cent reduction in Federal employ-ment and a 10 per cent reduction in Foreign Aid. The effect ofthese measures on Federal outlays is shown in Table I.
-C5 -
Staff expenditure estimates for Fiscal 1972 are not affected
by the postponement of general revenue sharing as Congress was not
expected to appropriate funds for the projected period for this
item. Thus the Administration's $4.9 billion reduction in Fiscal 1972
outlays amounts to a $3.8 billion change in the staff projection.
Those measures which reduce Federal purchases--more than half of the
$3.8 billion--are likely to have powerful near-term effects. The
Staff has not completed detailed budget projections for the second
half of calendar 1972 but because several expenditure hikes
are scheduled to begin in July a relatively sharpincrease in expenditures is expected. However, the full year post-
ponement of welfare reform and the 5 per cent reduction in force,would still provide significant offsetting reductions in expenditures
at that time.
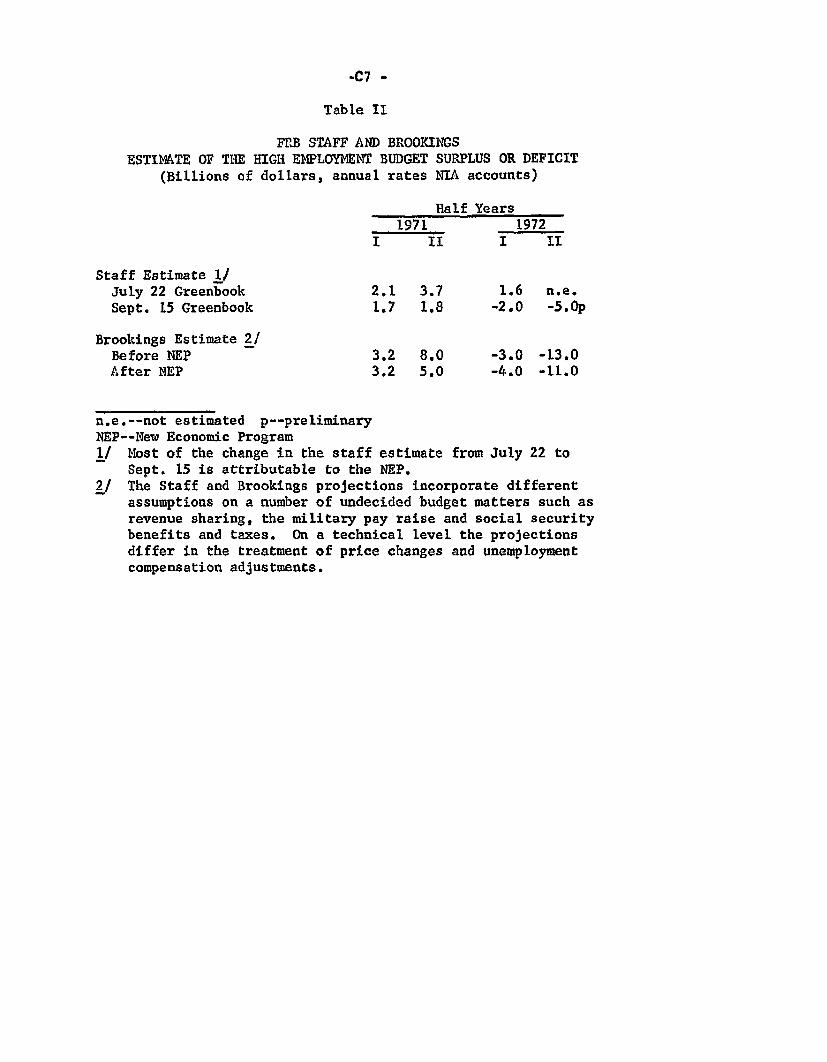
II. Measures of Net Fiscal Stimulus
The latest Staff estimate of the high employment budget (seeTable II) shows a modest surplus for the entire calendar year 1971
and no significant change in discretionary fiscal policy from thefirst to the second half of the year. A $3.8 billion shift
toward deficit is expected in the first half of calendar 1972 butless than half of this shift is attributable to the President's newprogram. Preliminary staff estimates of high employment receiptsand expenditures for the second half of calendar 1972 indicate afurther shift toward fiscal stimulus.
Administration estimates of the high employment budgeton a basis comparable to the Staff estimate (NIA accounts) are notpresently available. However, estimates made by Nancy Teeters forBrookings and by the Staff, prior to and after the New EconomicPolicy, are compared in Table II. While the Staff and Brookingsprojections employ different fiscal assumptions and estimatingtechniques, they both find that the net effect of fiscal policy isto shift the balance toward deficit in the first half of calendar1972. In the second half of calendar 1972 Brookings estimates thatdiscretionary budget policy will move sharply further toward stimulus,but that the stimulus would be greater in the half year withoutthe New Economic Program. However, the Staff views expenditureestimates for the second half of 1972 as highly conjectural at this time.
In the present circumstance these changes in the fullemployment surplus are especially difficult to interpret. Forexample, in both the Staff and Brookings estimates the surtax onimports adds about $2.0 billion, annually, to high employmentreceipts. The resulting appearance of fiscal restraint is misleadingin so far as the effect is to reduce the demand for foreign products.

-C6 -
In the Board's estimation of high employment receipts there isalso the problem that price changes are based on past trends, asituation that is not analytically applicable during the presentfreeze and the transition period thereafter. This tends tobias the staff estimate of high employment receipts and surplusupward. The Administration's official estimate of a $8 billionhigh employment deficit in fiscal 1972 (unified budget basis) isnot directly comparable to the NIA data shown in Table II on anumber of statistical grounds.
When several important and offsetting adjustments aremade in budget programs at the same time, changes in the highemployment budget balance are less useful as an indicator offiscal impact because all dollar changes are given the sameweight. In the present situation, however, other estimatingtechniques suggest that the staff's high employment budget projec-tions correctly indicate the direction of the impact of fiscalmeasures embodied in the New Economic Policy. A simulation usingthe FRB model, for example, isolates the following net effects ofthe fiscal measures,alone, included in the New Economic Policy onreal and nominal GNP. The negative effect on nominal GNP throughthe second half of 1971 is partially due to the fact that auto
NET EFFECT OF FISCAL MEASURES 1/(billions of dollars, annula rates)
1971 1972H-II H-I H-II
Impact on:Real GNP .6 2.6 12.2Nominal GNP -2.6 -3.2 9.9
1/ Does not include effect of surtax on imports and wage-price freeze.
excise taxes are included in indirect business taxes, a componentof GNP. The postponement of the Federal pay raise also reducesthe GNP deflator in the first half of 1972. Thus the effect onreal GNP is a better indicator of the direction of impact of theFiscal program, though the magnitudes shown do not include anystimulus as a result of improved consumer and business sentiment.
-C7 -
Table II
FRB STAFF AND BROOKINGSESTIMATE OF THE HIGH EMPLOYMENT BUDGET SURPLUS OR DEFICIT
(Billions of dollars, annual rates NIA accounts)
Half Years1971 1972
I II I II
Staff Estimate 1/July 22 Greenbook 2.1 3.7 1.6 n.e.Sept. 15 Greenbook 1.7 1.8 -2.0 -5.0p
Brookings Estimate 2/Before NEP 3.2 8.0 -3.0 -13.0After NEP 3.2 5.0 -4.0 -11.0
n.e.--not estimated p--preliminaryNEP--New Economic Program1/ Most of the change in the staff estimate from July 22 to
Sept. 15 is attributable to the NEP.2/ The Staff and Brookings projections incorporate different
assumptions on a number of undecided budget matters such asrevenue sharing, the military pay raise and social securitybenefits and taxes. On a technical level the projectionsdiffer in the treatment of price changes and unemploymentcompensation adjustments.


