
[741]NUPIWorkingPaper
Department of International Economics
Fisheries Trade in India:
Understanding Potentials and Barriers
Meenakshi Rajeev
NorskUtenrikspolitiskInstitutt
Norwegian Instituteof International
Affairs

Utgiver: Copyright:
ISSN:ISBN:
Besøksadresse:Addresse:
Internett:E-post:
Fax:Tel:
NUPI© Norsk Utenrikspolitisk Institutt 200882-7002-202-0978-82-7002-202-1Alle synspunkter står for forfatternes regning. De må ikke tolkes som uttrykk for oppfatninger som kan tillegges Norsk Utenrikspolitisk Institutt. Artiklene kan ikke reproduseres – helt eller delvis – ved trykking, fotokopiering eller på annen måte uten tillatelse fra forfatterne.
Any views expressed in this publication are those of the author. They should not be interpreted as reflecting the views of the Norwegian Institute of International Affairs. The text may not be printed in part or in full without the permission of the author.
C.J. Hambrosplass 2dPostboks 8159 Dep. 0033 Oslo [email protected][+ 47] 22 36 21 82[+ 47] 22 99 40 00

Fisheries Trade in India: Understanding Potentials and Barriers
Meenakshi Rajeev* Institute of Social and Economic Change, Bangalore, India e-mail: [email protected]
* The author wishes to acknowledge valuable support from Mr Sibananda in preparing this paper.


Acknowledgements
This research paper was initiated during my visit to the Norwegian Institute of International Af-
fairs (NUPI) in October, 2007. I am extremely grateful for the support of NUPI. I would like to
express my heartfelt gratitude to Prof. Arne Melchior of NUPI who first proposed this study and
thereafter I had many useful discussions with him. I am also extremely grateful to Prof. Anne
Katrine Normann from Norwegian College of Fishery Science at the University of Tromso, for
her support. I thank the Institute for Social and Economic Change, Bangalore and our Director
Prof. N Jayaram for all the support provided to complete the paper. My sincere thanks to my Col-
league Ms B P Vani for many useful suggestions.
I had useful discussions with a number of Government officials and I thank them all. I am espe-
cially grateful to the officials of MPEDA, and particularly to Dr Vishnu Bhat, Director, for spar-
ing his valuable time. Dr Sinappa of Agriculture University , Fisheries Department, had been ex-
tremely helpful. I also thank the Fishermen’s Association and the Boat Owners’ Association for
useful discussions.
My sincere thanks go to Mr Sibananda for assisting me in various ways in completing the work.
None of these organizations and people however, share any responsibility for the errors that re-
main.

Preface
This paper is a contribution to the project ”International trade regulating organisations
and South East Asian regionalisation of trade agreements”, undertaken jointly by NORUT
(Northern Research Institute, Tromsø), the University of Stavanger and NUPI; also with
the participation of FHL (Norwegian Seafood Federation) and EFF (Norwegian Seafood
Export Council). Financial support from the Norwegian Research Council, project no.
177974/I10, and co-funding from EFF and FHL, is gratefully acknowledged.
Meenakshi Rajeev, Institute of Social and Economic Change, Bangalore, was a
visiting fellow at NUPI in 2007 and she then agreed to write this paper focusing on
India’s fisheries sector. Such a paper seemed particularly relevant in the light of the
upcoming negotiations between EFTA (the European Free Trade Association) and India
about a free trade agreement, where the first round of negotiations was held in October
2008. Trade in seafood is an important issue for both parties, and the sector is important
for the livelihoods in some of India’s regions. This paper examines production, trade and
policies related to the seafood sector in India, and we hope it will provide useful
background information for the free trade negotiations as well as for increased economic
cooperation between Norway, EFTA and India. We thank Meenakshi Rajeev for her
efforts and timely completion of the paper, which also contributes to the realisation of
NUPI’s plans for extended research cooperation with India.
Oslo, 21 October 2008.
Arne Melchior
Project manager, NUPI

1. Introduction The fisheries sector assumes significance in the Indian economy in several respects. The most
important amongst them is the providence of livelihood to many poor households especially
located in the coastal areas. These households can generate income from the sector due to the
fact that many varieties of marine fishes have been exported from the country including
chilled and dried items, fish oil, shrimp and prawns. Thus from the point of view of employ-
ment and income generation, international trade has considerable significance as well. It is the
trade aspect of the sector that would be the focus of the current paper.
Including India, indeed in many developing countries prosperity of the fisheries sector
relies largely on the international trade. The total volume of world export of fisheries products
which was U S $ 64 billion in 2003, witnessed a 54% increase from the volume of export re-
corded in 10 years back. Around half of the world’s exports of fish and fish products origi-
nates from the developing countries (Ministry of Commerce, Government of India,
www.commerce.nic.in). This is higher than the combined exports of the important cash crops
and rice from these developing nations. In particular by considering India we observe that
even though India’s trade share in this sector is only 2.64% in 2006–07 to the total global
trade (with total global trade amounting to about US$ 70 billion1), in rupee terms it constitute
a non trivial amount of Rs 83630 million. Also an increasing trend being prominent shows
further relevance of trade for the sector.
These developments have taken place with the existence of plethora of barriers to
trade (both tariff and non tariff) and they have affected trade pertaining to both developed and
developing nations. India is no exception. While it faces both tariff and non-tariff barriers it
also imposes high tariff in case of imports. In case of India though currently imports consti-
tute only a small proportion in total trade, one must also not forget its relevance in the long
run. India till now has a restrictive stand as far as fish import is concerned. Though the con-
cerned government authorities are in favour of imports to some extent (at least for the purpose
of re-export) fishermen’s association is showing its opposition. In this context it is also impor-
tant to remember that India is now going ahead with a number of trading agreements with
different nations. While countries open up their markets for India , India also needs to recip-
rocate. Given such varied economic and political dimensions, it is necessary to take a stock of
the situation. This assumes all the more importance in the light of the proposed trade agree-
ment with EU.
1 Source: Virtual University of Agricultural Trade Report, www.vuatkerala.org
3

In this background we have carried out discussions with various stake holders of the
industry and tried to present a status of the sector both on the basis of such primary informa-
tion as well as analyzing secondary data. In particular, the paper tries to shed light on the so
far untouched issue of imports. Thus, Section 2 examines the fisheries sector in India in terms
of output and growth, in order to provide a background for the discussions that follows. Sec-
tion 3 analyses the trade data concerning this sector and make forecasts on the basis of the
existing trends. It in particular looks at the direct of trade and trade with Norway. The most
recent Indo-Norwegian cooperation in cage culture development is discussed in the next sec-
tion and potentials of EU-India trade agreement are taken up in Section 4. Under this trade
agreement as duties on different items of trade will be a topic of discussion, it is relevant to
understand the current tariff structure and therefore this aspect has been considered in Section
5. Trade potentials of new items such as processed semi-cooked products have been discussed
in the penultimate section. A concluding section follows thereafter.
2. Production and Growth Indian fisheries sector can be classified in 3 main categories depending on the type of water
bodies. They are: (1) marine fisheries sector, (2) inland fisheries sector and (3) fish grown in
brackish water. Profitable trade in this sector has been possible due to both supply and de-
mand side factors. As far as supply side is concerned, India is endowed with a large produc-
tion base. India has a coastline of 8118 kilometers with an exclusive economic zone (EEZ)
stretching over 2.02 million km , and a continental shelf area of 0.5 million km. India has
inland water sources covering over 190,000 km and open water bodies with a water-spread
area of over 6.6 million hectares (Government of India, 2000). Brackish water area available
for aquaculture is 1.2 million hectares (MPEDA, 2001), of which, according to the Aquacul-
ture Authority of India (AAI, 2002), some 157,000 hectares (1570 sq. km) was under shrimp
aquaculture in 2002. Potential of fish production from marine and inland sources has been
estimated at 3.9 million tonnes (2.2) million tonnes in the inshore and the rest in the offshore
waters (Government of India, 1996) and 4.5 million tonnes, respectively.
In this context it is useful to compare India’s production with few other Asian coun-
tries. Indeed as per the FAO Reports (ftp.fao.org) the world aquaculture production of fish,
crustaceans and molluscs, reached 39.8 million tones by weight in 2002, amounting to about
US $ 53.8 billion in value terms. Comparing with the previous year one observes a 5.3% in-
crease in volume and 5.7% increase in value. As is well known, China is the largest aquacul-
4

ture producer and its production reached 27.8 million tones in 2002, revealing a percentage
increment of 6.6%. In value terms (US $ 28.4 billion) shows an increment of 8.3% for China.
Thus for the world excluding China, aquaculture production was 12 million tonnes (US $ 25.4
billion) in 2002 representing a 3.3% increment in volume but a 5.9% decline in value com-
pared to 2001. While India’s production is about one-sixth of China, it is a major producer in
Asia. India produced about 2.2 million tonnes of fish, crustaceans and molluscs in 2002 which
had been valued at US$ 2.5 billion. Comparing with few other Asian producers we observe
that Indonesia has a production level of 0.9 million tones (value US$ 1.4 billion), Japan shows
0.8 million tines of production in the same period (value US $3.4 billion) Bangladesh produc-
tion was about 0.8 million tones (value US $ 1.1 billion) and Thailand produced 0.6 million
tones with value US $ 1.4 billion. Thus India’s production of fish, crustaceans and mollusks
has been considerable in comparative terms depicting a comfortable supply.
As far as domestic demand is concerned, FAO (2002) estimates as per capita availabil-
ity of fish in India to be 4.8 kg in 1997–98, which, when estimated for the fish eating popula-
tion in the country (constituting 56 percent of the total population), works out to about 9 kg
(Dehadrai and Yadava, 2004). In coastal areas, fish consumption is usually higher – perhaps
twice the normal rates. In addition to the domestic demand, as mentioned above, there is ex-
port demand. In the export market, especially with respect to shrimp, India experiences con-
siderable demand. Indian fish is exported to USA, Europe and also to the Asian countries.
There is a well-developed processing industry as well. This provides import demand for fish
for re-export. Thus the sector assumes considerable significance in the context of international
trade. In this background this paper mainly concentrates on the international trade aspects of
the fisheries sector in India with special reference to Norway.
The favourable supply and demand conditions have led to generation and growth of
income from this sector. To have an idea about the income generated from this sector one can
look at the gross domestic product figures pertaining to this sector. For the purpose of ac-
counting and computing national income, the economy in India is divided into primary, sec-
ondary and tertiary sectors. Within the primary sector there are four major sub-sectors, viz.,
agriculture, animal husbandry, forestry and fisheries sectors. India is currently the third largest
fish producer and second largest producer of freshwater fish in the world (Government of
India, 2005). If we consider India’s GDP from this sector , an increasing trend is prominent
even though its share is falling; this is mainly due to an increase in share of services sector in
total GDP (Table 1). Its share in the primary sector GDP however, is showing an increasing
trend.
5

Table 1 : GDP from fisheries sector (at constant prices 1999–‘00, Rs crores2)
Year 1999-00 2000-01 2001-02 2002-03 2003-04 2004-05 Primary Sector GDP 446515 445594 473530 439321 483274 483080 GDP from fisheries sector 19245 19719 20633 21788 22852 23207 Growth of fisheries sector GDP 2.5 4.6 5.6 4.9 1.6 Share in Primary Sector GDP 4.3 4.4 4.4 5 4.7 4.8 Share in total GDP 1.07 1.05 1.04 1.06 1.03 0.97 Source: Central statistical organization
Indeed, between 1951 and 2004, India’s fish production increased eight-fold from 0.75 mil-
lion MT to 6.4 million MT, with marine catches contributing about 3 million MT (Govern-
ment of India, 2005).
According to the FAO statistics gross value of landings in case of India in 2003 was
US $ 4845 million. If we compare India with few other nations we observe that total landings
of Norway and UK were US$ 1583 (in domestic ports in 2003) and $ 1037 (including aqua-
culture, in 2002) respectively. Total landings figure has been far too high for China at US $ 46
billion.
It is also important to note in the context of India that some 11 million people depend
upon the sector for livelihood. Much of the employment generation in the coastal areas has
been built around the export industry. In terms of exports from India, sea food stands at the
10th place. Thus, no doubt, fisheries is considered to be one of the vital sectors contributing to
economic growth, livelihood support and poverty alleviation in the country. Given its export
potential it is therefore necessary to understand the international trade scenario concerning the
sector.
3. Fisheries Sector Trade There are four distinct channels through which fish is marketed in the country. These are: (i)
local fresh fish trade; (ii) processed fish trade; (iii) export trade; and (iv) domestic urban trade
(Salagrama, 2004). Fishmeal trade is another important market chain catering to poultry and
aquaculture sectors. It is estimated that, in 1997–98; about 780 thousand tonnes of fish out of
a total production of 5.3 million tonnes (roughly 15 percent) was used for ‘non-human’ uses
(FAO, 2002), which could be for fish meal purposes. The ‘traditional’ market chains – involv-
2 Rs 1 Crore= Rs 10 Million; Rs 1 Lakh /lac= Rs 100,000; $1 = Rs 38.
6

ing local and processed fish trades – are informally organised and remain significant because
they provide employment to a large number of the poor, mainly women.
3.1 Export: Macro Trend
India has been exporting varieties of fisheries items for a long time now. India’s fish exports
even in real terms show an impressive growth from the decade of 1960s till about 1980–81.
Though a downward trend is visible thereafter, it picks up from 1999–’00 again. In Fig. 1 , we
have considered the real exports (deflated by fisheries sector export deflator, base 1978–79)
and the growth rates are presented in Fig. 2. Though as expected growth rates are fluctuating
showing even negative growths, a positive growth trend is visible for the recent years.
Fig.1 Fisheries exports from India in real terms (in $000)
Fig 1: Real Exports ($000)(1978-79=100)
0
50000
100000
150000
200000
250000
300000
1962
1964
1966
1968
1970
1972
1974
1976
1978
1980
1982
1984
1986
1988
1990
1992
1994
1996
1998
2000
2002
2004
In terms of overall exports from the country, seafood stands at tenth place, accounting for 2.7
percent of total export earnings in 2001. Among seafood exporting countries, Indian exports
stood at 17th position in terms of quantity and 12th in terms of value (Mathew, 2003), its ex-
port share in the world seafood market is about 2.4 percent (Kulkarni, 2005). Shrimp is the
most important species in the export market chains and its contribution to overall exports
went up from a mere 13 MT in 1953 (Kurien, 1985) to 110,275 MT during 1999–2000
(MPEDA, 2001). Over time, finfish exports have shown rapid growth in the export basket,
accounting for nearly 35 percent of the volume of export trade in fisheries in 2004–5. Al-
7

though this means that the contribution of shrimp to overall exports declined from about 59%
in 1978–79 to a little under 30 percent in 2004–5 in terms of volume, it still accounts for
63.50 percent of the total value of the exports (MPEDA, 2006).
The growth rates of exports are explicitly depicted in Fig. 2. Though as expected
growth rates are fluctuating, it is interesting to note that growth rates are negative almost
about the same number of years as they are positive till 1998. Only in the current decade there
is a consistent trend of having positive growth. Non-tariff barriers, fluctuating productions are
some of the reasons for such trends.
Fig.2 Growth rate of fisheries exports in India (real terms)
Fig. 2: Growth of real exports
-30-20
-10
0
1020
30
40
50
6070
Growth ofrealexports
1962
1965
1968
1971
1974
1977
1980
1983
1986
1989
1992
1995
1998
2001
2004
Source: Compiled using Comtrade data
8

3.2 Import: Overall Trend In the Indian fisheries industry, the situation for imports is quite different from that of exports.
From being a country where no imports were allowed, imports quickly increased when the
borders were opened, though the level of imports is still very low (see Fig. 1 and 3). Unlike in
the case of exports , imports do show a rather haphazard trend. Our analysis of real imports3
data for a long period of 1962 to 2005 shows that though in the initial years imports were
high, it fell drastically later and remain low till now. From the year 2000, however, an in-
creasing trend is visible. Currently, India’s imports consist primarily of fishmeal. The one
other product India has been importing is hilsa from Bangladesh. In 1998, 97% of the imports
of fresh and frozen fish came from Bangladesh.
Fig. 3 Fisheries Trade: Real Imports ($000)
Trend of real imports
0
10000
20000
30000
40000
50000
60000
70000
1962
1965
1968
1971
1974
1977
1980
1983
1986
1989
1992
1995
1998
2001
2004
Year
Impo
rts
DeflatedIm ports
Source: Compiled using comtrade data
3.3 Projection of Exports and Imports4
We next tried to project future exports and imports of India using simple time trend to the
time series data available. Given the nature of import data , at this stage it is rather difficult to
bring in other variables that may significantly influence imports, in order to arrive at a more
meaningful projection5.
First using the exports data two types of models are explored, viz., an ARIMA fit and
a cubic fit. Using the cubic fit we next tried to forecast for the next 5 years . It must be noted
here is that since we only use the time trend these forecast would contain errors. Nonetheless 3 Import is deflated using import price index of food items as separate import price index for fisheries items does not exist. 4 I acknowledge help from my colleague B P Vani in carrying out this exercise. 5 We have made certain unsuccessful attempts in this regard and decided to restrict ourselves to the time trend alone for forecasting purposes.
9

they provide some crude estimate of what to expect in the future. (ARIMA fit is not used for
projection as it is not appropriate to make long run projections using this model).
Fig.4 Actual and Fitted exports trend and projections (using cubic fit)
Fitted Exports trends
0
50000
100000
150000
200000
250000
300000
350000
400000
0 10 20 30 40 50 60
Years
cubic fit
Actual exports
ARIMA fit
Source: Computed by author
Projected exports show a growth rate if about 5 to 6%.
Table2: Projection of Exports in $’000
Year Projections using cubic fit Growth rate of Projected Exports 2005 203250.4
2006 210092.4 3.4
2007 218167.8 3.8
2008 227550.8 4.3 2009 238315.1 4.7 2010 250534.9 5.1 2011 264284.2 5.5 2012 279636.9 5.8 2013 296667.1 6.1 2014 315448.8 6.3 2015 336055.9 6.5
As mentioned above, given the haphazard nature of the data ,to arrive at a fitted trend and
forecast is a rather difficult task for imports. A linear as well as a quadratic fit have been tried
on this data set (estimation results are presented in the Appendix.). The figure below shows
the fitted trends , together with the actual imports. Based on the two fitted trends two sets of
10

estimates for the next 7 years has been computed , one (quadratic fit) representing a more op-
timistic trend.
Fig. 5 Actual and Fitted Imports (in $000 )
Source: Computed by Author
-10000
-5000
0
5000
10000
15000
20000
25000
30000
Actual importQuadratic fitLinear fit
The projected growth rates show that under the optimistic scenario growth rate may increase
to about 10 to 12% (table 3) while under the linear fit, growth rate is seen to be around 2 %.
Nonetheless a positive growth rate is apparent and hence India can be considered as a poten-
tial market in the near future. With various trade negotiations going on and the opening up of
agricultural trade (even with hesitancy) may lead us if not to the optimistic scenario may be
something better than a 2% growth.
Table 3: Projection of Imports (in $’000)
Year Quadratic fit (optimistic)
Growth rate under Optimistic scenario Linear Fit
Growth rate under linear fit
2006 12688.58 2290.763 2007 14607.57 15.1 2336.308 2.0 2008 16630.26 13.8 2381.853 1.9 2009 18756.66 12.8 2427.398 1.9 2010 20986.76 11.9 2472.943 1.9 2011 23320.58 11.1 2518.488 1.8 2012 25758.1 10.5 2564.033 1.8
Thus if we go strictly by the linear trend there is expected to be no significant change in fish
imports in the near future. However, in the post liberation period external sector of the Indian
economy is fast changing. Agricultural imports have indeed increased at a rapid rate. Thus it
11

would not be surprising if a growth rate higher than what is forecasted by the linear trend
takes place in the near future. The quadratic trend which provides an upper bound in the pre-
sent scenario gives an idea of what can be expected in a most optimistic situation. Thus these
two trends together provide us a bound within which future imports may fluctuate. .
Of course one important issue with respect to imports is the regulatory barriers both
tariff and non-tariff. Thus it is the relaxation of these barriers that will critically determine
whether a quadratic trend will be at all relevant or not. This limitation has to be borne in
mind.
3.4 Real Effective Exchange rate and Imports
The real effective exchange rates based on total trade-based weights (source: Reserve Bank of
India) show that correlation between export and reer is 0.518 with significance level of 0.12.
Reer and import correlation is 0.162 with significance level of 0.65. Thus both these correla-
tions are not statistically significant. Price does not therefore appear to be a crucial factor in
determining trade in this sector. Other tariff and non tariff barriers are possibly acting as re-
straining factors. (However, given the recent changes in exchange rate it is necessary to calcu-
late this with the most recent exchange rate to get a current picture).
3.5 Direction of Trade
India’s trading partners are from across the world including USA, countries from EU and
Asia. In export the highest share however, is that of USA (above 20%), followed by Japan,
Belgium, China and UK (Table 4, Fig 6 ). Many argue that India is largely dependent on spe-
cific export markets, which reduce the Indian exporters to the position of price takers, and
they are unable to charge higher prices in spite of rising costs of fuel, labour, maintenance and
basic necessities (Kulkarni, 2005).
12

Table 4: Export of fishery and marine products from India (Rs crores)
Country 2000-01 1999-2000 1998-99 1997-98 1996-97
Norway 253.12 79.17 175.5 37.71 149.81 Australia 5,665.83 3,171.22 3,593.93 1,726.17 867.25Canada 7,453.30 6,277.69 3,529.99 2,546.84 1,836.01Germany 5,342.15 5,398.55 2,529.87 1,909.26 3,737.12France 7,575.82 5,641.12 4,096.79 2,312.64 4,381.73Belgium 8,913.80 6,191.74 4,747.32 3,029.56 7,688.49Italy 13,415.64 10,023.16 8,578.57 6,120.52 11,160.68Hong Kong
8,389.56 5,501.96 4,518.50 7,419.07 13,722.50
U.K 27,820.53 19,742.94 13,730.54 8,036.39 18,046.76China 52,895.48 37,922.50 21,663.03 42,686.23 26,235.42U.S.A 108,332.95 77,759.63 62,254.59 51,016.72 38,048.03Japan 231,203.54 209,988.21 205,304.57 207,645.20 168,889.20Total 628,780.38 504,355.50 432,966.45 445,291.78 396,129.07Source: Compiled using data from the Ministry of Commerce, Government of India (GoI).
Fig. 6 Share of different countries in India’s fish exports from major countries, 2006-07
Share of fish exports
France4%
Canada5%
Italy5%
U.K8%
China9%Belgium
11%
U.S.A27%
Japan24%
Norway0%
Australia2%
Germany2%
Hong Kong3%
NorwayAustraliaGermanyHong KongFranceCanadaItalyU.KChinaBelgiumJapanU.S.A
Source: Compiled using data from the Ministry of Commerce, GoI.
To begin with Japan however had the highest share in India’s exports followed by USA (Ta-
ble 4). India’s export to USA over the years increased substantially by about 3 folds to have
the top position. Amongst the exporters Norway has the lowest share.
13

China, Thailand, Vietnam, Indonesia, Mexico, Greenland and Ecuador are the major
competitors of India in the main shrimp export markets. The relative compound growth rate of
shrimp export from India indicates that the country is lagging behind other shrimp exporting
countries both in terms of volume and value. Moreover, some of these countries import Indian
shrimp for reprocessing and, as Kulkarni (2005) notes, the final consumers of Indian fish in
the northern markets are not aware of the origin of their fish as ‘more than 60 percent of In-
dia’s export to south-east Asia are re-exported after processing’.
For the promotion of exports, marine products export development authority has been
constituted with its main office in Kochi (or, Cochin), Kerala, which takes various actions for
improving fish exports from India.
As mentioned above India is a net fish exporting country and imports have not been
very important to the economy. Though there was a small surge in imports in the mid-1990s
(which accounted for a little under 1 percent of the net exports), this was mainly to address
the under-utilisation of processing factories in some states (notably in Kerala), and when this
did not work out to be viable, the share of imports slid back once again. While India’s imports
are much lower that exports highest share is that of USA closely followed by Norway. There
has been a significant jump in India’s import of fishery items from Norway (Table 5, Fig. 7).
Table 5: Total Import of Fish and Crustaceans, Molluscs and other Aquatic
Invertebrates, from some selected Countries including Norway (figure in Indian Rupee crores). Country 2001-02 2002-03 2003-04 2004-05 2005-06 2006-07
Australia 1.79 41.05 21.67 0
Italy 21.12 34.08 82.34 10.83 45.72 0.23
Hong Kong 51.44 0.22 12.99
Germany 0.29 148.68 0.42 23.22 27.28
China 3.37 9.33 129.66 44.51 1.41 64.07
Belgium 117.02 60.74 122.49 36.27 72.27
France 5.36 23.92 131.22 13.5 67.05 77.12
Japan 1.78 1.26 39.17 24.1 196.07 91.33
U.K 3.58 148.44 182.35 95.96 327.52 104.14
Canada 0.05 34.37 79.73 112.12
Norway 0.77 117.67 14.72 99.34 161.59 315.67
U.S.A 408.79 308.28 466.88 523.48 1,189.74 315.94
Source: Compiled using data from the Ministry of Commerce, GoI.
14

Fig.7 India’s import share of fish and crustaceans, molluscs and other aquatic inverte-brates from major exporting countries (presented in Table 5), 2006-07
Fig. India’s Import of fish fferent countries, 2006-07 from di
Norway27%
Germany2%
Hong Kong1%
Italy0%
U.S.A27%
U.K9%
Canada9%
Japan8%
France6%
Belgium6%
China5%
Australia0%
AustraliaItalyHong KongGermanyChinaBelgiumFranceJapanU.KCanadaNorwayU.S.A
Source: Compiled using data from the Ministry of Commerce, GoI.
If we look over the years Norway in fact started with no imports in 1997–98 and over the
years have been able to strengthen its position.
The competitors of Norway are Canada, UK, Japan France , Belgium, China, Germany, Hong Kong, Italy and Australia.
Given our specific interest in Norway in this paper we examine the disaggregated trade be-
tween the two countries.
3.6 India – Norway Trade in Fisheries Sector
From the import data presented above we observe that India’s trade with Norway is increasing
at a fast rate and it has the largest share together with USA. Given this trend one can expect
future growth of trade between the two countries. In this section we examine in detail trade
between the two countries concerning the fisheries sector.
15

Table 6: Export from India ,commodity code: ( 03) Fish and Crustaceans, Molluscs and other Aquatic Invertebrates. Country: India- Norway
Sl. No. 2001-02 2002-03 2003-04 2004-05 2005-06 2006-07 1 Total export to Norway items
of 03 code (Values in Rs.Lakhs )
85.92 170.12 8.43 21.88 2.83 75.92
2 %Growth 97.99 -95.04 159.54 -87.08 2,586.14 3 Total export of 03 code items
from the world (value in Rslakhs)
580,720.67 676,326.82 568,095.28 590,405.89 629,203.80 707,773.19
4 %Growth 16.46 -16 3.93 6.57 12.49 5 %Share of Norway (1 of 3) 0.01 0.03 0 0 0 0.01
6 India’s total export to Norway (all commodities, value in RsLakhs)
25,894.76 34,276.16 34,779.23 46,642.97 57,646.14 82,972.37
7 %Growth 32.37 1.47 34.11 23.59 43.93 8 %Share of items under code 03
to all commodities export tradewith Norway (1 of 6)
0.33 0.5 0.02 0.05 0 0.09
1 lakh = 10 million Source-Government of India (GoI), Ministry of Commerce & Industry, Department of commerce
Table 7: Import by India from Norway , Commodity: 03 Fish and Crustaceans, Mol-
luscs and other Aquatic invertebrates. Country: Norway-India Sl. No. 2001-02 2002-03 2003-04 2004-05 2005-06 2006-07 1 Import of items under code 03 from
Norway (Values in Rs. Lacs ) 0.77 117.67 14.72 99.34 161.59 317.6
2 %Growth 15,107.43 -87.49 574.87 62.66 96.55 3 Total Import of the items with 03 code
from the world (value in Rs lacs) 3,849.57 3,943.22 5,171.93 6,406.38 9,906.54 10,905.61
4 %Growth 2.43 31.16 23.87 54.64 10.08 5 %Share of Norway (1 of 3) 0.02 2.98 0.28 1.55 1.63 2.91 6 Total Import of all commodities from
Norway (Rs lacs) 22,881.05 46,919.72 139,243.25 105,626.95 128,101.61 345,727.75
7 %Growth 105.06 196.77 -24.14 21.28 169.89 8 %Share of items under code 03 (1 of
6) 0 0.25 0.01 0.09 0.13 0.09
Source-Government of India, Ministry of Commerce & Industry, Department of commerce
Table 7 shows that share of imports of fisheries items from Norway is increasing over time in
terms of India’s global imports of this commodity as well as in terms of imports of all com-
modities from Norway. Right now however, import is minimal. If we look at the disaggre-
gated level the major items Norway imports to India in the recent years are salmon, smoked
fish including fillets flat fish, and other prepared and preserved fish (Table 8).
16

Table 8: Fisheries Sector: Important items Imported from Norway ($000) Year:2004
Year Commodity Code
Item name Import from Norway ($000)
Total Im-port of this product by India($000)
Share of Norway
2004 030329 Other salmonidae, excluding livers 99.493 99.8 99.7 2004 030420 Frozen fillets 20.430 919.0 2.2 2004 030541 Smoked fish, including fillets :-- 99.295 122.9 80.8 2004 150420 Fats and oils and their fractions, 24.230 785.7 3.1 2005 030219 Salmonidae, excluding livers and ro 6.618 23.3 28.4 2005 030322 Other salmonidae, excluding livers 8.467 8.5 100.0 2005 030329 Other salmonidae, excluding livers 14.650 16.0 91.4 2005 030339 Flat fish (Pleuronectidae, Bothidae 6.728 8.7 77.1 2005 030420 Frozen fillets 96.997 3921.2 2.5 2005 030490 Other 7.584 111.4 6.8 2005 030541 Smoked fish, including fillets :-- 225.379 231.4 97.4 2005 150410 Fish-liver oils and their fractions 40.045 704.3 5.7 2005 150420 Fats and oils and their fractions, 47.363 1135.2 4.2 2005 160420 Other prepared or preserved fish 10.703 68.9 15.5
Source: Compiled using Comtrade data
Thus right now import from Norway is confined to a few items only. The major item of im-
port is Salmon. Fish oil (code 150410 and 150420) is another item of imports in the year 1996
and 1999 share of which has declined of late. Thus there is scope for increasing both in terms
of number of items including processed items as well as in amount. Thus is scope for trade
relation with Norway to increase in this sector. Right now there are certain barriers to trade
with the European nations including Norway in the fisheries sector. If we look at the tariff
structure (refer to Table 9 and Table E in the Appendix), India does not have any mutually
beneficial tariff agreements with the EU countries. Also there are certain oppositions from the
fishermen unions from India against the country going for a large scale imports (see Section
6).
In this respect however, it is noteworthy that India had a history of having trade rela-
tion with Norway in this sector. Indeed cage culture development with Norway dates back to
1952. This practice has been revived recently. In this regard the recent cooperative endeavour
in cage culture development is significant.
17

4. Indo-Norwegian Cooperation in Fisheries Sector: Cage Culture Development6
Indo-Norwegian cooperation in the fisheries sector date back to 1952 when the first bilateral
fisheries development project in the world was initiated by Norway in Kerala. Since then
Norway has supported a number of fisheries related projects especially by providing techno-
logical inputs (Maritime, 2007). Recently on 14th August, 2007, Sri Mohan Kumar, Chairman,
MPEDA, has signed a memorandum of Understanding with M/s Innovation Norway, a com-
pany owned by the Norwegian Government for developing cage culture in India .
The project is supposed to carry out a detailed survey of the potential sites in India,
short list sites along the inshore regions and establish pilot-scale projects for commercial
demonstration, after examining the techno-economic feasibility under Indian conditions, on a
turnkey basis. In addition to the development of off-shore cage culture, the project also plans
to examine the possibility of development of suitable health management packages for the
cultured species.
After the EU-India trade agreements take definite shape trade relation with Norway
pertaining to this sector is expected to increase. However, it must be kept in mind that trade in
all varieties of fishes may not get boosted even after an agreement comes to force. Given the
dependency of the poor population on this sector and the demands of the trade unions, India
would try to reserve certain items in its negative list. Both countries need to sit and explore
what items can be traded in a mutually beneficial way. The current status of the agreement
and certain aspects of resistance have been discussed below.
5. Further Trade Potential in Fisheries Sector: India-EU Trade agreement7 In the India –EU summit at Helsinki on 13 October, 2006, political leaders of both regions felt
the need for a broad based trade and investment agreement. There has already been significant
preparatory work. The India-EU High Level Trade Group has been preparing the ground for
these negotiations since October 2005 and its report will form the basis for further delibera-
tion. Subsequently, on 28th June 2007, India and the EU began negotiations on a broad-based
bilateral trade and investment agreement in Brussels, Belgium8. Both parties believe that a
comprehensive and ambitious agreement that is consistent with WTO rules and principles 6 Information collected from MPEDA office, Cochin, Kerala. 7 Benefited from discussions with the Ministry of Commerce and MPEDA officials. 8 Source: ministry of Commerce http://commerce.nic.in/trade/India_EU_Joint_Stat.asp).
18

would open new markets and would expand opportunities for Indian and EU businesses. India
and the EU are important trading partners and committed proponents of the multilateral sys-
tem. Now the next step would be to carry out internal consultations on the recommendations
of the High Level Group. The European Commission will need to request and receive a nego-
tiating mandate from the Member States in the European Council. If these internal procedures
are completed, negotiations could begin in 2008–2009.
As far as most recent development is concerned (January 27, 2008 Deccan Herald
News item) India and European Free Trade Association, comprising Switzerland, Norway,
Liechtenstein and Iceland, on 25th January, 2008, agreed to set up a joint task force for negoti-
ating a broad-based trade and investment pact. Union Commerce & Industry Minister Mr
Kamal Nath held talks in this regard with his counterparts in Davos, and accepted the recom-
mendations of a joint study group, set up in December 2006, to explore the feasibility of such
an agreement. The JSG submitted a report suggesting that both sides would ‘significantly
benefit from a bilateral broad-based trade and investment agreement’. Mr Kamal Nath also
announced the setting up of a joint task force (JTF) comprising officials from India and the
European Free Trade Association ( EFTA, founded in 1960) states to monitor the implemen-
tation of JSG’s recommendations.
According to the above report, the bilateral trade between India and EFTA in 2005–06
was $7.4 billion, comprising exports of $623.11 million and imports of $6,852.25 million.
Among the four EFTA members, India’s largest trading partner is Switzerland followed by
Norway, Iceland and Liechtenstein.
It has been discussed at other forums the possibilities from this negotiation. It is ex-
pected that India will push for the removal of stringent quality norms for export to the
European Union. Industry circle predicts that the restrictions on supplying ayurvedic
(herbal) medicines to the EU countries, extremely low maximum residue limit (MRL) on
products such as spices and registration problems faced by poultry and egg suppliers would
be high on India’s agenda. The issues are likely to be brought up in the next India-EU high-
level trade group meeting. India has been requesting the EU for a long time to relax the
norms for supplying ayurvedic medicines, now classified as herbal medicines. The restric-
tions include a directive circulated in 2004 stating that companies wanting to export tradi-
tional herbal medicines to the EU must submit evidence to prove that the product has been
in medicinal use for at least 30 years preceding the date of application, including 15 years
19

within Europe. ‘This has been acting as a big technical barrier to trade for India and we will
try to take it up in the bilateral agreement’, a source said9.
EU in turn will also try to negotiation some of the items such as fisheries items to be
brought under the agreement. According to Economic Times report of Nov 27, 2007, fish-
ermen’s union and planters union will oppose trade agreements concerning import of fish
and cash crops produced in Kerala such as cashew. About 40 varieties of fish, cashew ker-
nels and salted and roasted cashew are among the products which the stakeholders from
India feel should be included in the negative list of items for India-European Union Free
Trade Agreement (FTA). The suggestions came up at a meeting organised in Kochi by the
Confederation of Indian Industry (CII) and the Ministry of Commerce to elicit the views of
the stakeholders for preparing the negative list of items for Indo-EU Trade Agreement.
Kerala Matsya Thozhilali Iykya Vedi President, Charles George wanted all 40 fish items to
be included in the ‘Most sensitive list’ as the sector was experiencing ‘untold sufferings’
and deprivation, consequent to fish import from Thailand based on FTA. In India, about 8.5
million people are engaged in fishing as their sole means of livelihood. The catch from the
sea was meagre and the operational costs are higher and most of them operate in traditional
crafts.
The Association of Planters of Kerala said the Plantation sector, comprising tea,
coffee and rubber are highly labour intensive. There are 1 million workers in Kerala alone
in the sector. Under the SAARC agreement, when tea was allowed to be imported from Sri
Lanka, India was badly hit. Though now it has been stopped, there should not be a repeat of
the earlier agreement, was the view of the union.
The above reports are indicative of the fact that certain fisheries items will remain in
the negative list of India. However, in order to understand the potentials of trade from these
negotiations it is important to understand the current tariff structures and tariff and non-
tariff barriers pertaining to the fisheries sector. Since the negotiations will be a two-way
process we elaborate here not only the barriers India imposes but also the ones India faces
in fisheries sector.
9 Economic Times Report, 27 Nov, 2007.
20

6. Current Tariff and Non tariff Barriers
6.1 Import Barriers
Currently, India imposes strong barriers on the import of fisheries items. While the official
sources feel that import should increase at least for re-export purposes, fishermen’s associa-
tions are opposing such moves (see section 6 for details). Even with such oppositions some
amount of fish gets imported and imports figures are steadily increasing over time. However,
our interviews with the actual importers reveal that barriers come from the official sources
as well.
6.1.1 Non-Tariff Barriers on Imports10
In order import fish , one requires a special import permit (SIP). This permit is given at an
office in Delhi. In order to receive each consignment in the port, one needs to acquire fresh
permits from Delhi. This creates immense amount of hassles for the importer. It also raises the
possibility of corruption on the part of the officials in charge of providing such permits. It has
been alleged that sometimes the permits takes considerable time and that adds to the cost of
storage of fish at the port.
MPEDA is advocating for allowing it to issue such permits. This can be useful as
MPEDA has offices in various states therefore, the entire process need not be Delhi-centric.
Thus the process can be made decentralized. However, such changes are not initiated yet.
6.1.2 Barrier on Ornamental Fish Imports
Our interviews with the importers of live fish (ornamental fish) bring out the immense amount
of difficulties they face. Only limited verities of fishes are allowed. Rules also appear to be
more stringent than most countries across the globe. However, as there is increasing demand
for ornamental fish from the growing corporate sector, they are often brought through the ille-
gal routes (revealed during our survey). Thus such stringent regulations have not served the
real purpose but only led to corruption.
10 As revealed during our discussions with the importers and MPEDA officials.
21

5.2 Barriers on Exports
5.2.1 From EU11
1. Harmonisation of testing procedures
The European Union has its own standards as a whole in addition to each member state
having its own standard. Indian side feels that it is essential to harmonize these standards
within EU so that the countries , which are exporting to EU could comply with one set of
norms. Due to the prevalence of separate set of norms , there is increased number of rejec-
tions of marine products export to this part of the world.
There are instances of rejection of sea-food consignments exported from India to EU ,
specifically to Italy and France, for the presence of Vibrio Parahaemolyticus, a commonly
found micro organism in coastal and estuarine waters. Indian authorities and exporters are
of the opinion that the practice of judging sea food based only on total Vibrio Parahaemo-
lyticus counts, without accounting for the virulence factors TDH/TRH is not appropriate.
2. Rejection on account of bacterial inhibitors/ unspecified antibiotics
There are instances of rejection of the Indian farm-raised and sea-caught marine products
for the presence of bacterial inhibitors/ antibiotic residues without specifying the residue
involved in such rejections. Health authorities involved in testing activities in India feel
that harmful residues are not possible to be present in the sea caught products.
3. Rapid Alert System
The procedure for lifting rapid alerts by the member countries is not harmonized. In order
to lift rapid alert, the number of minimum consecutive checks varies from member state to
member state. For example, France checks 3 consecutive consignments for lifting rapid
alert, while Spain insists on 10 and Belgium on 5 and so on. There is a need to harmonize
this system.
4. Destruction of Consignments
Destruction of consignments which have been found to contain chloraphenicoland nitrofu-
ran residues has been a major issue which India has taken up in various bilateral forum.
As a result of these discussions many countries are now agreeing to return rejected con-
11 This part is written using information gathered from MPEDA office at Cochin, Kerala.
22

signments to India. But consignments are still destroyed in UK and India is not in favour
of this practice.
5.2.2 From USA
1. After the events of September 11, 2001, the US Government has taken a number of
steps to enhance the security of the food supply. Accordingly, US Congress has passed
the Public Health Security and Bioterrorism and Response Act of 2002. This Act has
created indirect barrier for seafood exports from India as inspections have increased.
2. Indian export consignments have also been rejected under country of origin labeling
norms.
3. While catching shrimps it needs to be ensured that sea turtles are not killed. In 1996
USA banned imports from India accusing that Indian fishermen are not using turtle
excluder devices.
4. Similarly, Tuna exports need to have dolphin safe catching procedure labeling.
5.2.3 Non-Tariff Barriers from other countries
1. Saudi Arabia has been imposing a ban on India since 1984, as WHO reported India as
a country affected by cholera at that time.
2. Chinese authorities do not have details of their norms.
3. Revised quarantine measures to be imposed by Australia on prawn imports would also
create barriers to Indian exporters.
23

5.3 Tariff Barriers
5.3.1 Exports
India is faced with various tariff barriers with regards to the export of fisheries item. Barrier
imposed by USA is discussed as an example. USA had imposed anti-dumping duty on Indian
shrimps together with continuous bond requirements. This had acted as a serious trade barrier.
The seafood exporters association of India had challenged this and filed a complaint before
the US CIT challenging the amended bond directive. A meeting was later held in Geneva on
4–8 June, 2007. Subsequently since September, 2007, directive anti dumping duties have been
reduced from 10.17% to 7.22%.
5.3.2 Tariff Barriers Imposed by India
India’s general tariff (MFN) is high (about 30%) compared to the international tariff stan-
dards. However, certain countries are given tariff cuts under the existing trade agreements.
We therefore discuss briefly the existing trade agreements relevant for the sector.
5.3.3 Trade Agreements
India has trade agreements with a number of countries which allow duty free export and im-
ports including fisheries items.
The Government of India and Sri Lanka signed an agreement on December 28, 1999,
and implemented from 2000. Under this agreement the two countries decide to make progres-
sive reductions and elimination of obstacle to bilateral trade through a free trade agreement. A
number of fisheries items are allowed to be exported to India by Sri Lanka duty free under
this agreement. India also is a signatory of SAFTA (South Asian Free Trade Area) agreement
in January 2004, which comprises the SAARC nations. In addition, under SAPTA (South
Asian Preferential Trade Area) , preferential trade agreements are signed between India and
other South Asian nations such as Bhutan. In case of fisheries items Bangladesh gets preferen-
tial treatment under SAPTA (see table 9). Maldives also gets preferential treatment for certain
items under SAFTA.
Further, the Bangkok Agreement is an initiative under the Economic and Social
Commission for Asia and the Pacific (ESCAP) for trade expansion through exchange of tariff
concessions among developing country members of the ESCAP region. This agreement was
signed on 31st of July 1975. Seven countries namely, Bangladesh, India, Lao PDR, Republic
of Korea, Sri Lanka, the Philippines and Thailand met at Bangkok and agreed to a list of
24

products for mutual tariff reduction. Certain fisheries items get concessions in terms of import
tariffs under Bangkok Agreement as well.
A preferential trade agreement was signed also with the Mercosur countries (Argen-
tina, Brazil, Paraguay, Uruguay) in Jan 25, 2004. In India’s offer list ornamental fish appears ,
however, no fisheries item appears in the offer list of the other countries.
5.3.4 Tariff Structure for Imports
India’s general tariffs for fisheries items for all countries getting MFN treatment is 30% (ad-
valorem). This appears to be uniform across almost all commodities. Our analysis of TRAINS
data shows that India provides special treatment under SAPTA (to LDC) and tariff rate in
such case is 15%. Two other special categories of countries that attract even 0 tariff are Sri-
Lanka and few countries that fall under Bangkok agreement. In the appendix we present two
tables (Table C, D, E) showing India’s tariff structures for 2005 for certain selected items that
India imports from Norway. For example, in case Atlantic Salmon that India imports from
Norway, we observe that tariff rate is 30%. Similarly another item India imports from Norway
viz., oil produced from fish also attracts 30% tariff. Indeed Table 9 depicts tariff structure of a
few selected fisheries item (such as Atlantic Salmon). As mentioned above more detail Tables
are presented in the Appendix (Table C, D and E).
Table 9: Import Tariff of Selected Fisheries Items (Importing Country: India), 2005
Import Tariff in the year 2005 of Selected 03 code items Code Item Country Tariff Rate 03011000 Ornamental Fish 0.00 Preferential tariff for Bangkok agreement 03011000 Ornamental Fish Sri Lanka 0.00 Preferential tariff for Sri Lanka
03011000 Ornamental Fish 15.00Preferential tariff for SAPTA (LDC) coun-tries
03011000 Ornamental Fish World 30.00 Basic customs duty (MFN rate)
03032200 Atlantic salmon (Salmo salar) and Danube salmon (Hucho hucho) 0.00 Preferential tariff for Bangkok agreement
03032200 Atlantic salmon (Salmo salar) and Danube salmon (Hucho hucho) World 30.00 Basic customs duty (MFN rate)
03032200 Atlantic salmon (Salmo salar) and Danube salmon (Hucho hucho) Sri Lanka 0.00 Preferential tariff for Sri Lanka
03032200 Atlantic salmon (Salmo salar) and Danube salmon (Hucho hucho) 15.00
Preferential tariff for SAPTA (LDC) coun-tries
03035000 Herrings (Clupea harengus, Clupea pallasii), excluding livers and roe World 30.00 Basic customs duty (MFN rate)
03035000 Herrings (Clupea harengus, Clupea pallasii), excluding livers and roe Sri Lanka 0.00 Preferential tariff for Sri Lanka
03035000 Herrings (Clupea harengus, Clupea pallasii), excluding livers and roe 0.00 Preferential tariff for Bangkok agreement
03035000 Herrings (Clupea harengus, Clupea pallasii), excluding livers and roe 15.00
Preferential tariff for SAPTA (LDC) coun-tries
Source: Compiled using TRAINS data
25

A careful examination of Table 9 and Table D and E in the Appendix reveals that tariff
under Bangkok agreement and Sri Lanka agreement are nil. Under Sapta LDC regional
agreement incorporating countries such as Bangladesh tariff rate is 15%. Rest of the World
attracts MFN rate of 30%.
When we talk about India’s tariff on fisheries items, the muddle over duty free im-
ports of fish come to the fore. Observing the importance of this issue we tried to gather first
hand knowledge on this issue by discussing with the stakeholders. We held discussions
with the fishermen’s association, boat owner association, fish exporters association and the
MPEDA officials. The following section provides the highlights.
6. Muddle over duty-free import of Fish: Field Experiences The main views put forward by the fishermen and boat owners’ association presidents
during our field visits are as follows.
First concern is that of price dampening. Some of the common varieties such as cuttle
fish, pomphret, anchovy, ribbon fish are caught in China and Thailand as well. Import-
ing these items to India will dampen Indian price and adversely affect fishermen for
whom this is the sole source of livelihood.
Once Indian fishermen find it unprofitable to catch these fisheries items , the conse-
quences are significant. This then becomes a problem of survival of the small fisher-
men. May be for the boat owners this is a question of profit margin, but it is not so for
the poor fishermen.
It is not only the fishermen whose livelihood depends on this industry but a whole
chain of jobs is associated with the industry. They include boat workers, loading
unloading persons and so on. This employment and livelihood angle is very crucial.
Government organization such as MPEDA is propagating import of fish in order to
process and re-export. This will however benefit the large entrepreneurs who own
these processing units. It is difficult to check supply of such imported items to the do-
mestic market once imports take place. Thus in a sense there is a conflict between
capitalist and labour class.
Another interesting argument is that fish imported from China or Thailand may not be
of quality comparable to the Indian fish. Once they are processed and re-exported and
there is some complain, that will impact indigenous fish exporters as well.
26

Our interviews with the export association however, reveal an opposite view.
They are of the view that the concerns of the fishermen are genuine. However, the
vested interest political groups for their own benefit exaggerate them out of propor-
tion. Quoting the figures from the Ministry of Commerce, Government of India, asso-
ciation remarks that India imported fish worth Rs 890 million during the financial year
2006–07. Out of this, Hilsa alone worth of Rs 516.90 million is imported from Bang-
ladesh for the consumption of the people of West Bengal in India and to export for the
use of Bengali community abroad. Fish worth Rs 50 million was imported for the use
of Foreign Embassy’s and five-star hotels. Raw fish products worth Rs 110 million
was taken outside India, converted to AFD products and brought back to India for ex-
ports. Thus at the end raw fish worth only Rs 215 million was imported by the proc-
essing establishments for processing and re-export. The association feels that the pos-
sibility that fishermen’s livelihood will parish even if fish is imported for processing
and re-export is a remote one.
The Association strongly argues in favour of Government of India signing a free trade
agreement with European Union. They have given a memorandum to this effect. They
consider that this will benefit the fish processing industry and other industries of India.
Association further argues that about 10 lakh workers are engaged in the sea food
processing industry in India. Studies conducted in this area show that additional 5 mil-
lion job opportunities can be created by importing fish for processing in India for ex-
port.
MPEDA officials also echoed same views during our interview. These views are summarized
below.
India has a very well developed processing industry. These units are following strict
quality control norms that are EU certified. Indeed entrepreneurs of this sector have
upgraded their facilities by investing heavily.
Ironically however, 80% of their capacity has remained unutilized. This is a big loss to
the industry.
This is due to the fact that there is substantial scarcity of raw fish. Sea has been ex-
ploited sufficiently and the domestic production of cultured fish is also not been able
to meet the demand of this sector.
27

Under such circumstances if fish is imported from other countries and processed for
re-export, that can only benefit the economy without hampering the business of the
poor fishermen.
Thus we observe that while Government bodies and export associations are on one side , fish-
ermen’s unions are on the other. In India this is not a problem unique to the fisheries sector.
Ever since India embarked upon its liberalization program from 1990–91 onwards, each drive
to open up of the markets is looked either with skepticism or faced with protests. After open-
ing up of a sector however, Indian side has most often gained than lost. A classic example is
that of the telecom sector. With much hesitancy Government opened up this sector to end
public monopoly. Today we observe unprecedented growth of this sector, decline of prices,
and no loss of jobs and furthermore growth of secondary sectors like Business Process Out-
sourcing (BPO) Industry that depends on telecom sector.
Currently however, from the intensity of protests it appears that certain items may not
be allowed for imports in the very near future. Nonetheless, within the fisheries sector, there
are definitely items, import of which possibly will not attract much resistance from the trade
unions. Processed and ready to eat fisheries products , marketed for the higher-end customers
through super markets is a possibility. In order to understand the potentials for this segment of
products we have carried out a small survey in certain metropolitan cities of India, concentrat-
ing on the fish eating population.
7. Potentials Demand for Processed Fish: A Survey Based Analysis
Indian has a well developed processed fish industry that is capable of processing and packag-
ing fish for export. The industry indeed is under utilized. However, this industry does not
generally produce finished and semi-finished products which are either ready to eat or can be
consumed with minimal cooking. This may be due to the presumption that there is no demand
for such products in India. While this was the case may be about ten years back, the situation
is fast changing. With current 8%– 9% GDP growth, a robust manufacturing growth and an
impressively growing services sector , there are a large number of professionals in the high
income category who possess considerable disposable income and always hard pressed for
time. Indian IT/BPO industry alone employs above 16,00,0000 professionals. The profes-
sional group though currently may not have high demand for such ready to eat products but
are definitely potential customers in the long run. To understand the market potentials we
28
have carried out a survey of 100 such customers in Karnataka and Kerala. Though the survey
is confined to these two states , Bangalore being a cosmopolitan city and an IT hub, we could
get people from different parts of the country.
Survey Methodology
A structured questionnaire has been administered on the potential customers. The two stage
sampling technique is used. First a shopping mall or a company is selected and then a number
of visitors or employees are selected at random and if they are found to be consumers of fish
the interview proceeded further. The survey is conducted in Bangalore in Karnataka and
Cochin in Kerala. Sample size is 10012.
Sample Profile
Most of our respondents are from the corporate sector (71%) and another 10% are having
small and medium size business (Fig. 8). Professionals are not necessarily from the IT sector
alone. Thus 80% of the respondents are in the higher middle income category who can afford
to purchase processed, semi-cooked or ready to eat items.
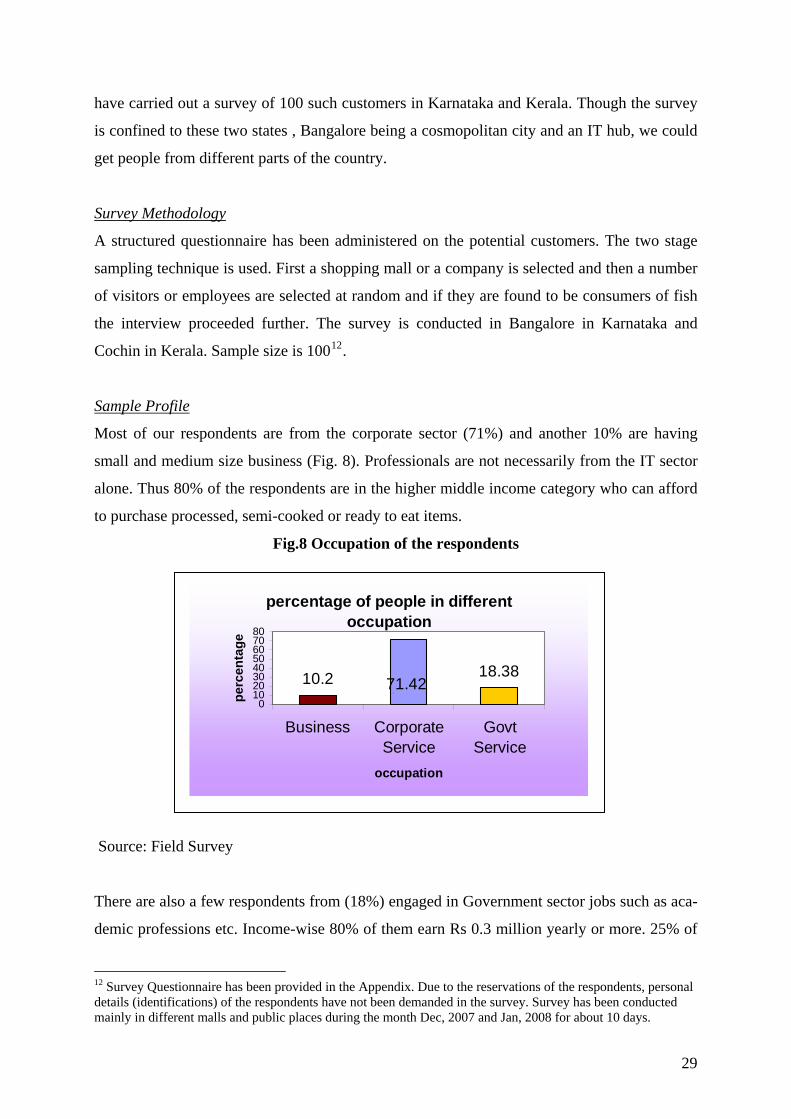
Fig.8 Occupation of the respondents
percentage of people in different occupation
10.2 18.3871.42
01020304050607080
Business CorporateService
GovtService
occupation
perc
enta
ge
.
Source: Field Survey
There are also a few respondents from (18%) engaged in Government sector jobs such as aca-
demic professions etc. Income-wise 80% of them earn Rs 0.3 million yearly or more. 25% of
12 Survey Questionnaire has been provided in the Appendix. Due to the reservations of the respondents, personal details (identifications) of the respondents have not been demanded in the survey. Survey has been conducted mainly in different malls and public places during the month Dec, 2007 and Jan, 2008 for about 10 days.
29

the respondents take fish almost every day while 53% take at least once a week. Thus in the
respondent group we have are regular fish eaters.
Age profile-wise (Fig 9) most of our respondents are young professionals who are as-
sumed to be more open to experimenting with new food items.
Out of these respondents 60% are mar-
ried and 40% are unmarried; though
the unmarried ones, usually from an-
other state like Kerala or Bengal , too
prepare their food on their own.
Fig. 9 Age profile of the respondents
Percentage of people in different Age group
50-above4%40-50
17%
30-4038%
Below 30 yrs41%
Below 30 yrs30-4040-5050-above
Source: Field Survey
Findings
Though this sample is statistically not a representation of the population as the sample size is
not considerably large, nonetheless some of the findings from the survey do provide indica-
tions about the market potentials.
If we look at the current fish consumption habits even amongst this comparatively
richer section, one can find that (Fig.10) only 12 % of the consumers buy fish from big gro-
cery shops which keep packed frozen fish. A large percentage of buyers purchase fish either
from a fish vendor who comes door to door or sits in the road side (Fig 1).
Figure 10: Percentage of people Buying fish from Fish vendor/market and Biggest Grocery shop Source: Survey
30
Fish vendor62%
Both (Fish Vendor & grocery Shop)
18%
Market8%
Biggest grocery shop12%

A close examination of these respondents reveals that the consumers who buy fish items from
big grocery shops are mostly in the highest income category within our sample (that is, yearly
income Rs 0.5 million or more). However, it is also interesting to note that a large percentage
of respondents (62%) within this income group purchase fish from vendor or market.
About 93% of the respondents reveal that they prefer either live or frozen fish that are
caught and locally sold. Only 7% of the respondents show their affinity towards packed fro-
zen fish items (Fig. 11). Most of them however, are seen to be aware of the tinned or ready to
eat type of items. About 93% of our respondents are aware of processed and packed food (fig
2) and 77% are aware of the presence of tinned fish items such as tuna etc.
Fig.11 Percentage of people aware about processed and packed items
91.83
8.17
0102030405060708090
100
Yes No
Aware about processed and packed items
Perc
enta
ge
Source: survey
While they are aware of the presence of such items in the market about 46% have never tasted
them (Fig.12) . Thus their awareness is found to be very limited.
31

Fig.12 Preference for processed fish items (percentage of respondents)
Source: Survey
Amongst another 44% who tasted, 14% do not like the products very much. This may be due
to the fact that Indian packed and ready to eat fish market is not well developed at this stage.
There are not many choices for the consumers. In particular, 10% of the respondents are
averse to the idea and do not like to even taste. Those who consume such items also have
them at most once is a month while they eat fresh fish from vendors at least twice a week.
The reasons for not preferring such items are stated as they are not as tasty as the fresh
fish and often too costly. 67% of the respondents feel that that not easy availability, , taste and
price are the main reason for not preferring to each these items. About 20% of the respondents
specifically talks about price being too high.
Yes, don’t like14%
Not eaten46%
Yes (like)30%
Not eaten, don’t like
10%
When we examined the possibility that if quality of such products is ensured and more
interesting products are brought to the market what should be the price they would be ready to
pay, it is observed that 73 % of the respondents are ready to pay double the price of what they
on an average pay for the Indian fish. Another 15 % can pay only as much as the Indian fish.
(Fig. 13).
32

Fig.13 Price Range for frozen fish and Percentage of people willing to pay
01020
30405060
7080
percentage
15.39
73.08
11.53
Same as Indian
fish priceDouble Triple
Price Range for tinned fish Source: Field Survey
If the price is not exorbitant 62% of the respondents are interested in eating fisheries items
especially marine products from European countries. However it has been felt that there is
lack of information amongst consumers about such quality items. Advertisement is necessary
for making people aware of such products. As high as 80% of the respondents feel that they
do not have much knowledge about such products and through media if information is given
one can make a better choice (Fig.14).
Fig. 14 Need for more information
Advertisement rquired for better desemination of information
82,56
17,14 Advertisement requiredAd not required
Source: Field Survey
33

Summary Observations
During our survey we have observed that the Indian customers currently are somewhat hesi-
tant to purchase processed fish products which may be semi-cooked or ready to eat. Most of
them ascribe it to their likings for fresh fish rather than packed and imported. Some respon-
dents also showed concern about quality. Especially the Muslim respondents are hesitant to
eat non-vegetarian products from the Western countries as they fear it may contain pork.
However, we strongly felt from our interactions that general hesitancy about quality, fresh-
ness etc. are stemming from lack of information. All these respondent consumers eat many
other Indian products that may not be free from all impurities.
With the growth of the services as well as manufacturing sector there is a large profes-
sional group that has sufficient income. With nuclear family structure and both spouses work-
ing, time has become the most valuable commodity. Under such circumstances potentially
there is a big market for fisheries and marine products that are processed, may be ready to eat,
which has remain almost unexplored.
However, demand for such products needs to be developed through proper informa-
tion dissemination showing the utility of the products. Advertisement in popular media there-
fore is a must to capture this market. Another important aspect however, is the price. As our
survey shows if the prices are more than three times higher than the average Indian fish price,
it is not acceptable to the Indian customers. Thus to begin with those products which can be
exported by Norway to India at a reasonable price may be attempted. Efforts to popularize
such products also have to be made side by side- as from our survey we observe that currently
knowledge about processed fisheries products appears to be very limited.
Our survey has covered only individual respondents. There is also demand for fish
from the hotels and restaurants. Hotel business at present is thriving in India and the Gov-
ernment has increased foreign direct investment limit in this segment to 100%. As a result
many foreign-based hotels are already there is in the major metros of India. US-based HVS
International has firmed up plans to enter India, and industry players believe others like Ash-
ford Hospitality Trust and IFA Hotels & Resorts among others are likely to follow suit. The
government forecasts an additional requirement of 200,000 rooms by the turn of the century.
A rapidly growing middle class, the advent of corporate incentive travel and multinational
companies presence in India have boosted prospects for tourism. India’s easy visa rules,
public freedoms and its many attractions as an ancient civilisation makes tourism develop-
ment easier than in many other countries. It is important to note that the luxury hotels will
have demand for any exotic marine products regardless of price. This segment of the market
34

can also be tapped for the export of Norwegian Salmon and other such expensive varieties of
fish.
8. Conclusion
After observing the positive effects of trade India is currently making extensive efforts to en-
hance the trade opportunities to improve it competitiveness in the world trade scenario. Con-
sequently, a comprehensive Foreign Trade Policy (2004–2009) has been developed to im-
prove the trading system. The objective of the new Foreign Trade Policy is the overall devel-
opment of India’s foreign trade.
Two major objectives of the foreign trade policy 2004–2009 are (1) to double India’s
percentage share of global merchandise trade by 2009 and (2) to act as an effective instrument
of economic growth by giving a thrust to employment generation, especially in semi-urban
and rural areas. To enhance growth in trade, India is taking various pro-active measures such
as reduction of controls, bringing in transparency and simplifications in bureaucratic proce-
dures, and reducing duties. Special attention is given to attract foreign direct investment. Sec-
tors with significant export prospects and potential for employment generation in semi-urban
and rural areas have been identified as thrust sectors, and specific sectoral strategies have
been prepared.
In her effort to enhance export India also realizes the need to open up her economy for
imports. Thus unilaterally India has been relaxing several of her earlier import restrictions.
Amongst various sectors opened up agriculture and animal husbandry sector is slow to open
up. This is mainly because still a large proportion of rural poor population (above 60%) de-
pends on this sector. Prices of these essential commodities are also a major concern.
However, the scenario is changing even for these sectors if not as fast as the manufac-
turing and services sectors. Concentrating on the fisheries sector we observe from the above
analysis that in India import of fish is still minimal. Currently Norway is one of the major
exporters to India and import from Norway as well as total imports in fisheries sector is stead-
ily rising from last 5 years or so. .
Since fishing is the occupation of a large number of poor households especially in the
coastal region, import is always considered as a threat to their livelihood. This however, need
not be always true. While a rapid growth may not take place immediately, situation is ex-
pected to change over time. This can be also seen from our field level experiences with the
exporters associations and MPEDA officials who are strongly in favour of certain imports. At
35

this hour therefore, it is necessary to identify products, trade of which are not going to have
detrimental effect on the business of the poor fishermen. Collaboration in technology concern-
ing the fisheries sector can be an area of interest for both Norway and India. Similarly equip-
ments and peripherals for ornamental fish is another area. India in fact has a good demand for
ornamental fish but due to strict restrictions, importers find tremendous difficulty to import
(as revealed by importers during our survey). This is one area which during EU negotiation
one may highlight.
With liberalization and opening up of the market, the economy is undergoing signifi-
cant changes. There is now a large group of population that can afford exotic seafood and
other marine items, which India does not produce. There is substantial demand for these items
from hotel industry as well. Processed semi-cooked product market is also not yet developed
fully in India. These are certain product groups that may be explored initially. As our survey
shows current knowledge of the consumers is very limited. Thus information needs to be en-
hanced. However, to reach a sizeable population, price has to be competitive as the purchas-
ing power of the mass is still not high in India. Thus, though trade in this sector is not ex-
pected to increase manifolds in the near future, there are definite chances of new opportunities
of trade to come up.
36

References
AAI. (2002). Aquaculture Authority News. 1(1), Chennai: Aquaculture Authority of India.
Dehadrai, P V., & Yadava, Y S. (2004). State of the Indian Farmer: A Millennium Stud. 13.
Fisheries Development. Delhi: Academic Foundation.
Deccan Herald. (2008). India, EU FTA float task force, Retrieved January 27, 2008, from web
site, http://www.deccanherald.com/Content/Jan272008/business2008012648809
FAO. (2000). Fishery Country Profile: The Republic of India. Retrieved September 2007,
from website http://www.fao.org/fi/fcp/en/IND/profile.htm.
FAO. (2002). The Impact of World Trade Organization Agreements on Fish Trade. FAO
Fisheries Circular 977. Rome: Food and Agriculture Organization of the United Na-
tions. Retrieved September 2007, from website
www.fao.org/documents/show_cdr.asp?url_file=/DOCREP/005/Y4325E/Y4325E00.ht
m.
GOI. (1996). Handbook on Fisheries Statistics. New Delhi: Government of India, Ministry of
Agriculture Department of Animal Husbandry and Dairying.
GOI. (2000). Handbook on Fisheries Statistics 2000. New Delhi: Government of India, Min-
istry of Agriculture Department of Animal Husbandry and Dairying.
GOI. (2005). Annual report 2004–2005. New Delhi: Department of Animal Husbandry and
Dairying, Ministry of Agriculture, Government of India. Retrieved September 2007,
from the website http://dahd.nic.in/rep/2005/English/Text.pdf.
Kulkarni, P. (2005). The Marine Seafood Export Supply Chain in India: Current State and
Influence of Import Requirements. International Institute for Sustainable Development
(IISD). Retrieved September 2007, from website
www.tradeknowledgenetwork.net/pdf/tkn_marine_export_india.pdf.
37

Kurien, J. (1985). Technical Assistance Projects and Socio-Economic Change: Norwegian
Intervention in Kerala’s Fisheries Development. Review of Agriculture, Economic and
Political Weekly, XX (25 and 26), 22–29.
Mathew, S. (2003). Trade in Fisheries and Human Development: Country Case Study– India.
Asia Pacific Regional Initiative on Trade, Economic Governance and Human Devel-
opment.
MPEDA. (2001). MPEDA: An Overview. The Marine Products Export Development Author-
ity.
MPEDA. (2006). Export Performance, 2004–05. Retrieved on September 2007, from website
http://www.mpeda.com.
Salagrama, V. (2004a). A study of market supply chains in fisheries in the southern districts of
Orissa. Study done for Oxfam (GB), Bhubaneswar. Integrated Coastal Management,
Kakinada. Retrieved September 2007, from website
http://www.onefish.org/id/243733.
38

Appendix Appendix A.1
Table A: India’s Import share of Important Fisheries items: Disaggregated Scenario
Year Product Code Product Name Import share in total trade 1996 230120 Flours, meals and pellets, of fish 49.0 1996 030269 Other fish, excluding livers and ro 41.3 1996 051191 Other :- Egg yolks :-- Products of 4.1 1996 150420 Fats and oils and their fractions, 2.1 1996 150410 Fish-liver oils and their fractions 2.0 1996 030613 Frozen :-- Shrimps and prawns 0.6 1996 030741 Cuttle fish (Sepia officinalis, Ros 0.5 1996 030379 Other 0.1 1996 030110 Ornamental fish 0.1 1996 030322 Other salmonidae, excluding livers 0.1
2000 030269 Other fish, excluding livers and ro 34.5 2000 230120 Flours, meals and pellets, of fish 23.8 2000 051191 Other :- Egg yolks :-- Products of 22.2 2000 150410 Fish-liver oils and their fractions 7.3 2000 030749 Cuttle fish (Sepia officinalis, Ros 3.5 2000 150420 Fats and oils and their fractions, 2.4 2000 030612 Frozen :-- Lobsters (Homarus spp.) 2.3 2000 030613 Frozen :-- Shrimps and prawns 1.8 2000 030379 Other 0.8 2000 030374 Other fish, excluding livers and ro 0.2
2005 230120 Flours, meals and pellets, of fish 54.7 2005 030269 Other fish, excluding livers and ro 13.6 2005 030613 Frozen :-- Shrimps and prawns 10.2 2005 030420 Frozen fillets 6.9 2005 030741 Cuttle fish (Sepia officinalis, Ros 4.2 2005 150420 Fats and oils and their fractions, 2.0 2005 030379 Other 1.9 2005 150410 Fish-liver oils and their fractions 1.2 2005 160590 Other 0.7 2005 030559 Dried fish, whether or not salted b 0.7
Source: Analysis of COMTRADE data
39

Table B: India’s Export share of Important Fisheries items: Disaggregated Scenario Year Product Product Name Export share in total trade 1996 030613 Frozen :-- Shrimps and prawns 64.28 1996 030379 Other 18.18 1996 030749 Cuttle fish (Sepia officinalis, Ros 5.03 1996 030741 Cuttle fish (Sepia officinalis, Ros 4.22 1996 030420 Frozen fillets 1.66 1996 030612 Frozen :-- Lobsters (Homarus spp.) 1.09 1996 030269 Other fish, excluding livers and ro 0.80 1996 030624 Not frozen :-- Crabs 0.65 1996 030374 Other fish, excluding livers and ro 0.51 1996 051191 Other :- Egg yolks :-- Products of 0.51
2000 030613 Frozen :-- Shrimps and prawns 63.25 2000 030379 Other 19.87 2000 030749 Cuttle fish (Sepia officinalis, Ros 3.50 2000 030612 Frozen :-- Lobsters (Homarus spp.) 3.22 2000 030741 Cuttle fish (Sepia officinalis, Ros 3.12 2000 051191 Other :- Egg yolks :-- Products of 0.84 2000 030624 Not frozen :-- Crabs 0.78 2000 030420 Frozen fillets 0.58 2000 030614 Frozen :-- Crabs 0.53 2000 030490 Other 0.45
2005 030613 Frozen :-- Shrimps and prawns 53.51 2005 030379 Other 13.95 2005 160520 Shrimps and prawns 7.70 2005 030741 Cuttle fish (Sepia officinalis, Ros 7.01 2005 030749 Cuttle fish (Sepia officinalis, Ros 5.29 2005 160420 Other prepared or preserved fish 1.71 2005 030614 Frozen :-- Crabs 1.37 2005 030420 Frozen fillets 1.26 2005 030269 Other fish, excluding livers and ro 1.10 2005 030624 Not frozen :-- Crabs 0.78
Source: Analysis of COMTRADE data
40

Table C :Selected Fisheries Products (especially that are Imported from Norway) and the Import Tariff Structure, 2005
Product Code Product Description Name AdValorem Measure Name
03032200 Atlantic salmon (Salmo salar) and
Danube salmon (Hucho hucho) 0.00 Preferential tariff for Bangkok agreement
03032200 Atlantic salmon (Salmo salar) and
Danube salmon (Hucho hucho) World 30.00 Basic customs duty (MFN rate)
03032200 Atlantic salmon (Salmo salar) and
Danube salmon (Hucho hucho) Sri Lanka 0.00 Preferential tariff for Sri Lanka
03032200 Atlantic salmon (Salmo salar) and
Danube salmon (Hucho hucho) 15.00 Preferential tariff for SAPTA (LDC) countries15041010 Cod liver oil World 30.00 Basic customs duty (MFN rate) 15041010 Cod liver oil Sri Lanka 0.00 Preferential tariff for Sri Lanka 15041010 Cod liver oil 15.00 Preferential tariff for SAPTA (LDC) countries15042010 Fish body oil Sri Lanka 0.00 Preferential tariff for Sri Lanka 15042010 Fish body oil 15.00 Preferential tariff for SAPTA (LDC) countries15042010 Fish body oil World 30.00 Basic customs duty (MFN rate) 15042020 Fish lipid oil World 30.00 Basic customs duty (MFN rate) 15042020 Fish lipid oil Sri Lanka 0.00 Preferential tariff for Sri Lanka 15042020 Fish lipid oil 15.00 Preferential tariff for SAPTA (LDC) countries16042000 Other prepared or preserved fish World 30.00 Basic customs duty (MFN rate) 16042000 Other prepared or preserved fish Sri Lanka 0.00 Preferential tariff for Sri Lanka 16042000 Other prepared or preserved fish 15.00 Preferential tariff for SAPTA (LDC) countries03042030 Seer World 30.00 Basic customs duty (MFN rate) 03042030 Seer Sri Lanka 0.00 Preferential tariff for Sri Lanka 03042030 Seer 15.00 Preferential tariff for SAPTA (LDC) countries03042040 Tuna Sri Lanka 0.00 Preferential tariff for Sri Lanka 03042040 Tuna 0.00 Preferential tariff for Bangkok agreement 03042040 Tuna 15.00 Preferential tariff for SAPTA (LDC) countries03042040 Tuna World 30.00 Basic customs duty (MFN rate) 03042050 Cuttlefish World 30.00 Basic customs duty (MFN rate) 03042050 Cuttlefish 15.00 Preferential tariff for SAPTA (LDC) countries03042050 Cuttlefish Sri Lanka 0.00 Preferential tariff for Sri Lanka 03042050 Cuttlefish 0.00 Preferential tariff for Bangkok agreement
Source: Analysis of TRAINS data
41

Table D: Trade agreements
42

Table E: Import Tariff of Few Additional Fisheries Items, 2005
Tariff 2005 of 03 code items Code Item Country Tariff Rate 03011000 Ornamental Fish 0.00 Preferential tariff for Bangkok agreement 03011000 Ornamental Fish Sri Lanka 0.00 Preferential tariff for Sri Lanka 03011000 Ornamental Fish 15.00 Preferential tariff for SAPTA (LDC) countries03011000 Ornamental Fish World 30.00 Basic customs duty (MFN rate)
03019100 Trout (Salmo trutta, Oncorhynchus mykiss, Oncorhynchus clarki, Oncorh Sri Lanka 0.00 Preferential tariff for Sri Lanka
03019100 Trout (Salmo trutta, Oncorhynchus mykiss, Oncorhynchus clarki, Oncorh 15.00 Preferential tariff for SAPTA (LDC) countries
03019100 Trout (Salmo trutta, Oncorhynchus mykiss, Oncorhynchus clarki, Oncorh 0.00 Preferential tariff for Bangkok agreement
03019100 Trout (Salmo trutta, Oncorhynchus mykiss, Oncorhynchus clarki, Oncorh World 30.00 Basic customs duty (MFN rate)
03021100 Trout (Salmo trutta, Oncorhynchus mykiss,Oncorhynchus clarki, Oncorhy Sri Lanka 0.00 Preferential tariff for Sri Lanka
03021200 Pacific salmon (Oncorhynchus nerka, Oncorhynchus gorbuscha, Oncorhync World 30.00 Basic customs duty (MFN rate)
03021200 Pacific salmon (Oncorhynchus nerka, Oncorhynchus gorbuscha, Oncorhync Sri Lanka 0.00 Preferential tariff for Sri Lanka
03021200 Pacific salmon (Oncorhynchus nerka, Oncorhynchus gorbuscha, Oncorhync 15.00 Preferential tariff for SAPTA (LDC) countries
03021200 Pacific salmon (Oncorhynchus nerka, Oncorhynchus gorbuscha, Oncorhync 0.00 Preferential tariff for Bangkok agreement
03023200 Yellowfin tunas (Thunnus albacares) World 30.00 Basic customs duty (MFN rate) 03023200 Yellowfin tunas (Thunnus albacares) 7.50 Preferential tariff for SAPTA (LDC) countries03023200 Yellowfin tunas (Thunnus albacares) Sri Lanka 0.00 Preferential tariff for Sri Lanka 03023200 Yellowfin tunas (Thunnus albacares) 0.00 Preferential tariff for Bangkok agreement 03023400 Bigeye tunas (Thunnus obesus) 0.00 Preferential tariff for Bangkok agreement 03023400 Bigeye tunas (Thunnus obesus) World 30.00 Basic customs duty (MFN rate) 03023400 Bigeye tunas (Thunnus obesus) Sri Lanka 0.00 Preferential tariff for Sri Lanka 03023400 Bigeye tunas (Thunnus obesus) 15.00 Preferential tariff for SAPTA (LDC) countries03023500 Bluefin tunas (Thunnus thynnus) World 30.00 Basic customs duty (MFN rate)
03026100 Sardines (Sardina pilchardus, Sardinops spp.), Sardinella (Sardinella 0.00 Preferential tariff for Bangkok agreement
03026100 Sardines (Sardina pilchardus, Sardinops spp.), Sardinella (Sardinella World 30.00 Basic customs duty (MFN rate)
03026100 Sardines (Sardina pilchardus, Sardinops spp.), Sardinella (Sardinella Sri Lanka 0.00 Preferential tariff for Sri Lanka
03026100 Sardines (Sardina pilchardus, Sardinops spp.), Sardinella (Sardinella 15.00 Preferential tariff for SAPTA (LDC) countries
03032200 Atlantic salmon (Salmo salar) and Danube salmon (Hucho hucho) 0.00 Preferential tariff for Bangkok agreement
03032200 Atlantic salmon (Salmo salar) and Danube salmon (Hucho hucho) World 30.00 Basic customs duty (MFN rate)
03032200 Atlantic salmon (Salmo salar) and Danube salmon (Hucho hucho) Sri Lanka 0.00 Preferential tariff for Sri Lanka
03032200 Atlantic salmon (Salmo salar) and Danube salmon (Hucho hucho) 15.00 Preferential tariff for SAPTA (LDC) countries
Source: Compiled using TRAINS data
43

Appendix A.2
Survey Questionnaire
Survey of the Potential Customers for Fish Related Products
1. Name : (optional) 2. Male/Female 3. Married: yes, No 4. Age: below 30 yrs, 30—40, 40—50, 50 and above. 5. Occupation 6. Family Income (husband + wife) Annual : a) Below 2 lakhs b) 2-3.5 lakh c) 3.5-5 lakhs d) 5 lakhs and above 7. Original state 8. Apart from fish what other non-veg item you consume? 9. What item you eat most frequently ?
10. How frequently you eat this item?
11. How frequently you eat fish
12. Are you buying fish from a fish vendor or bigger grocery shop like food world?
13. If both what are the frequencies : vendor: super market/Store:
14. What kind of fish item you like (indicate preferences): fresh water live: frozen: Proc-
essed Items:
15. Are you aware that there are tinned fish item (like tinned tuna): Yes/No
16. Are you aware that there are processed and packed fish items(like fish cutlets):
Yes/No
If you are aware 17. Have you eaten and Do you like tinned fish? (specify variety)
18. Do you have demand for frozen/processed fish items (cutlets etc.) (specify item-wise
details)
44

45
19. What price range of processed fish would be within your budget (double of the fresh
fish, triple….)
20. How frequently you take processed/packed fish item: more than once in a month ,
once in a month or once in a while (once in six months).
21. What is the reason for not eating such items regularly: price, not tasty, unhealthy, any
other.
22. If the quality of such items are fully ensured and brought from say European countries
will you be consuming? Yes/ No
23. If you are not aware of such items are you interested to get some information (say through TV ads). (details)
23. If you get to know that such items exist and one can make Indian dishes out of them
then will you be interested?
24. Do you think such items in general should be advertised to spread more knowledge
amongst the consumers? Which medium?
25. What price range is needed to make you buy such products :same as Indian fish price,
you are ready to pay more if it is exotic marine /sea food item. (specify range for
prices)
26. Do you think you would like to eat salmon/ herring / or other such marine items
which are currently not available?
27. If yes what should be the approximate price per kg of frozen item (item-wise details).


