Last Name 1
First Name Last Name
Professor
English
Date
Corporate finance
Corporate finance encompasses all the undertakings of a business. It looks into how
businesses finance their transactions and business events, invest their resources and finally,
evaluate the results. Corporate finance is relevant to both large and small businesses. Three
fundamental principles that underline corporate finance include investment, financing and the
relevant dividend principles (Castle, 2008). Incorporating corporate finance principle into
business model, the companies aim to achieve their objectives and value maximization.
Corporate finance deals with the businesses investing in assets and projects. Choosing
investment assets and projects, the company aims at yielding investment returns over and above
the minimum hurdle rate. The investment decisions are based on the hurdle rates, the evaluation
of advantages and disadvantages of the projects and finally, the cash flows, which are generated
in the result of project implementation. The cash flows are also necessary for calculating the net
present value of the project (NPV), which is one of most important indicators for investment
decision – making.
In addition, the financing mix (debt and equity) also requires informed choosing. The
chosen financing mix aims at maximizing the value of the investments made (Jones, 2011; Castle
2008).The financed assets should match the financing mix.
Last Name 2
This applies if there are not enough investments that merit hurdle rate, the cash goes back
to owners of the business in the form of dividends. Some stockholders, however, prefer stock
buybacks.
Consideration of the capital structure, the combination of equity and debt, is important
for the smooth management of the firm. Evaluating capital structure is the most basic step for the
valuation of assets and identification of risks. The firm has to consider its capital structure before
any major decision; this includes valuation of inventories, debt to equity ratio and debt to value
ratio. The essence of corporate finance is its internal consistency. Therefore, corporate finance
has to be considered an integrated whole instead of a collection of choices and decisions.
Hypothesis:
In this paper we will test the hypothesis: No relationship exist between companies' capital
structure and the shareholders' value maximization.
Petrochemical Industries:
Petrochemical industries primarily include manufacturing companies that produces
chemicals using oil and natural gas as the major raw materials (Petrochemical Industry, 2012).
Considering that the oil is one of the major resources in Saudi Arabia, the petrochemical
industries count 45% of total GDP of the country (The World Factbook. Middle East: Saudi
Arabia, 2012). In addition, approximately 6 million foreign workers are employed by
petrochemical companies. Therefore, considering the importance of petrochemical industry in
the Kingdom of Saudi Arabia, it is reasonable to study the petrochemical companies.
Companies selected:
SABIC:
Last Name 3
SABIC was founded in September 1976 with the initial goal to expert the production of
by-products of oil extraction. The company produces value added commodities, such as
chemicals, polymers and fertilizers. Today, SABIC is ranked as the world largest petrochemicals
manufacturer, and it is part of the listed public companies based in Riyadh, Saudi Arabia with
70% of its shares owned by the Saudi Government and the rest are held by private investors from
the GCC region.
Petro Rabigh Company:
Petro Rabigh is a Saudi Arabia-based refining company that produces and sells
petrochemicals. Jones (2011) explained that it was initially a joint venture between Sumimoto
Chemical and Saudi Aramco. The company went public in 2008. The public owns twenty-five
percent of the company, and the founding owners share the remaining percentage the company
now trades on the Saudi Stock Exchange.
SAFCO:
SAFCO was established in 1965 with a beginning capital of 100 million Saudi Riyals. In
March, 1970, the company started the commercial production. The capital of the company was
increased in several times and its current capital is S.R 2500 million.
The company produces, processes, manufactures and markets all kinds of fertilizers, as
well as ammonia, sulfur and their derivatives and by-products for the local and international
market. The company also establishes, acquires and operates both chemical and non-chemical
products.
Sahara Petrochemicals:
“SAHARA Petrochemicals” was formed in 2004 in Riyadh, the capital of KSA. The
company performs participation, supervises foundation and establishes several limited liability
Last Name 4
companies in Al Jubail Industrial City with the participation of Saudi and foreign companies to
produce and market its chemical and petrochemical products, such as propylene, polypropylene,
ethylene and polyethylene.
“SAHARA Petrochemicals” was founded to be one of the pioneer industrial pillars in
Saudi Arabia, especially petrochemical and chemical industry, which evolved in the late
seventies and finally, had developed into one of the leading manufacturing and exporting sectors
in Saudi Arabia. “SAHARA Petrochemicals” has a chain of businesses, affiliates and
subsidiaries with high manufacturing technologies. Moreover, the strategic partnerships with
international and local industrial conglomerates provided allowed company to improve the
quality of its products. The high quality of the products ensures “SAHARA Petrochemicals” a
high reliability and reputation in the competitive arena of manufacturing petrochemicals and
chemicals.
Tasnee:
Tasnee was established as the National Industrialization Co. in 1985. It was the first
Saudi joint-stock company wholly owned by the private sector. The paid capital of the company
was SAR 6,689,141,660.
TASNEE major activities include the following: erecting, managing, and operating of
petrochemical, chemical, plastic, engineering, and metal projects, and finally, providing of
industrial services. The company’s business segments include petrochemical, chemical, metals,
diversified and services sectors. Chemicals Sector , Metals Sector, Diversified Sector, Services
Sector. The major company’s affiliated include Al-Rowad National Plastic Co, National
Worldwide Ind. Advancement Co., Battaryat, Rassas, CRYSTAL, National Operation & Ind.
Last Name 5
Services Co., Fahss, R. W. T. U. V. - Middle East, Arabian Company for Axles, Foundries &
Spare Parts, National Petrochemical Industrialization Co. (Business Sectors, 2012).
The National Industrialization Co is one of the largest industrial companies in Saudi
Arabia and the Middle East. The major company’s competitive advantages include high
managerial and technological skills, positive indicators and a strong financial position.
Considering TASNEE’s advantages and strong financial performance, the company is to expand
through investments and strategic alliances in order to strengthen its position in both local and
international markets (National Industrialization Co. – NIC, 2012).
Chapter one: corporate financing decision:
Corporate finance theories:
Since 1950, the major modern theories of financial economics have been formulating and
developing. The major theories include the following:
Efficient Market Theory—analysis of equilibrium behavior of price changes through time
in speculative markets.
Portfolio Theory—analysis of optimal security selection procedures for an investor’s
entire portfolio of securities.
Capital Asset Pricing Theory—analysis of the determinants of asset prices under
conditions of uncertainty. Treynor (1961), Sharpe (1964), and Lintner (1965) apply the
normative analysis of Markowitz to create a positive theory of the determination of asset
prices. Given investor demands for securities implied by the Markowitz mean-variance
portfolio selection model and assuming fixed supplies of assets, they solve for
equilibrium security prices in a single-period world with no taxes.
Last Name 6
Option Pricing Theory—analysis of the determinants of the prices of contingent claims
such as call options and corporate bonds. Many important corporate policy problems
require knowledge of the valuation of assets which, like call options, have payoffs that
are contingent on the value of another asset. Black and Scholes (1973) provide a key to
this problem in their solution to the call option valuation problem. An American call
option gives the holder the right to buy a stock at a specific exercise price at any time
prior to a specified exercise date. They note that a risk-free position can be maintained by
a hedge between an option and its stock when the hedge can be adjusted continuously
through time. To avoid opportunities for riskless arbitrage profits, the return to the hedge
must equal the market risk-free rate; this condition yields an expression for the
equilibrium call price. (Jensen & Smith . 1984)
Capital Structure Policy
The Irrelevance Proposition
The capital structure irrelevance proposition demonstrates that the firm’s choice of financing
policy cannot affect the value of the firm so long as it does not affect the probability distribution
of the total cash flows to the firm. (Jensen & Smith . 1984)
Toward an Optimal Financing Policy
The cash flow distribution can be affected by the choice of financing policy because there are tax
consequences, or agency costs, or because there are other interdependencies between the choice
of financing policy and the choice of investment policy. (Jensen & Smith . 1984)
Taxes : The theory stated that since the corporate profits tax allow the deduction of
interest payments in calculating taxable income, the more debt in the capital structure, the
Last Name 7
lower the corporate tax liability, the higher after-tax cash flows, and the greater the
market value of the firm. (Jensen & Smith . 1984)
Bankruptcy Costs (trade-off theory): It states that there is an advantage to financing with
debt (namely, the tax benefits of debt) and that there is a cost of financing with debt (the
bankruptcy costs and the financial distress costs of debt).(
http://en.wikipedia.org/wiki/Capital_structure)
Agency Costs: There are three types of agency costs which can help explain the relevance of
capital structure.
Asset substitution effect: As D/E increases, management has an increased incentive to
undertake risky (even negative NPV) projects. This is because if the project is successful,
shareholders get all the upside, whereas if it is unsuccessful, debt holders get all the
downside. If the projects are undertaken, there is a chance of firm value decreasing and a
wealth transfer from debt holders to shareholders.(
http://en.wikipedia.org/wiki/Capital_structure)
Underinvestment problem (or Debt overhang problem): If debt is risky (e.g., in a growth
company), the gain from the project will accrue to debt holders rather than shareholders.
Thus, management has an incentive to reject positive NPV projects, even though they
have the potential to increase firm value.( http://en.wikipedia.org/wiki/Capital_structure)
Free cash flow: unless free cash flow is given back to investors, management has an
incentive to destroy firm value through empire building and perks etc. Increasing
leverage imposes financial discipline on management.
Refernces
Last Name 8
Comparison between the selected companies financing decision:
To compare the financing decisions of the sample companies we will use the debt/equity
ratio, leverage ratio, and borrowing ratio where each ratio will be as following:
Debt/Equity ratio measures the company's financial leverage in proportion of the equity
to finance the assets and its computed as follow: 𝑡𝑜𝑡𝑎𝑙 𝑑𝑒𝑏𝑡
𝑡𝑜𝑡𝑎𝑙 𝑒𝑞𝑢𝑖𝑡𝑦.
Leverage ratio measures the percentage of debts to shareholders' equity where higher
ratios indicate high dept use in the capital and it is computed as follows: Total Liabilities
Shareholder′s equity ×
100
Borrowing ratio measures long term loans in proportion of assets, where high ratio
indicates expansion in the business and it's commuted as follows: Long− term loans
Total assets × 100.
SABIC:
As we can see from figure 1, debt to equity ratio increased from 2007 to 2009 and finally,
reached its maximum. However, during 2010 – 2011, debt to equity ratio started to decrease, but
in average the proportion of debt is more than equity, thus the company relies on debts to finance
its project rather than equity. The reliable on debt financing in SABIC is also evidenced from the
leverage ratio, which exceeded 100% during 2007 – 2009.
The borrowing ratio of SABIC is quite low, which indicates that no huge expansion in
projects is taking place. However, the borrowing ratio is moving in same pattern, as the debt to
equity ratio, which explains why there were high debts.
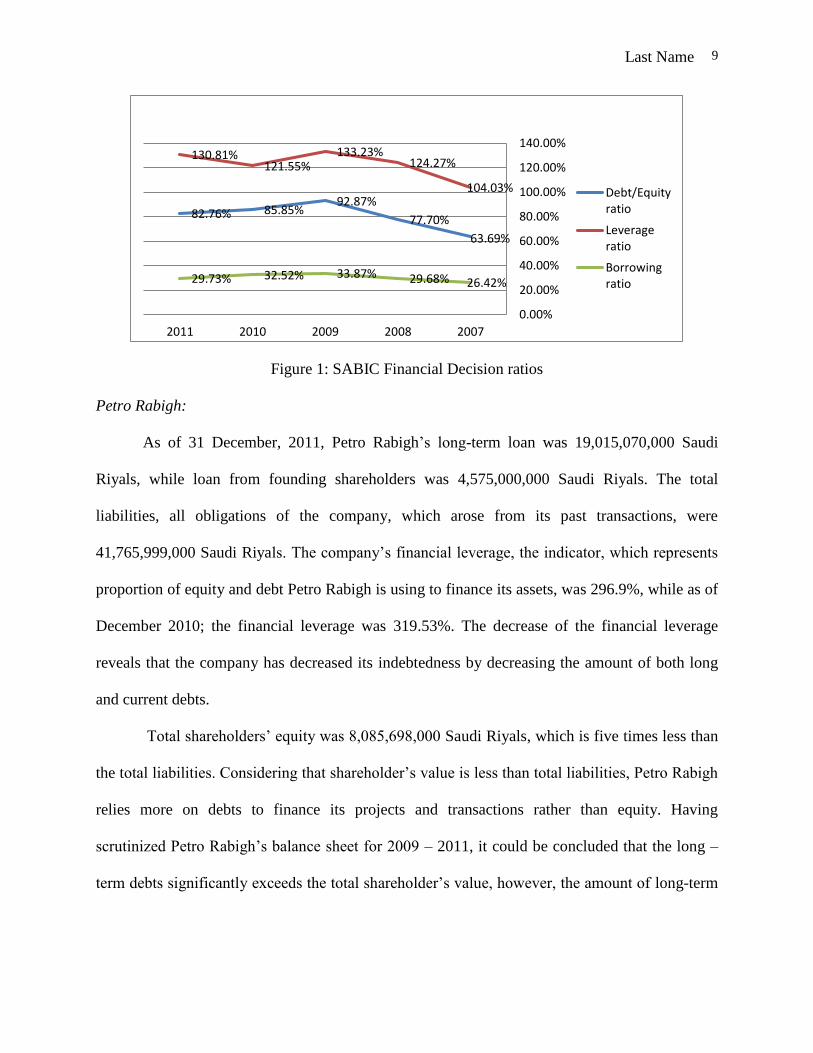
Last Name 9
Figure 1: SABIC Financial Decision ratios
Petro Rabigh:
As of 31 December, 2011, Petro Rabigh’s long-term loan was 19,015,070,000 Saudi
Riyals, while loan from founding shareholders was 4,575,000,000 Saudi Riyals. The total
liabilities, all obligations of the company, which arose from its past transactions, were
41,765,999,000 Saudi Riyals. The company’s financial leverage, the indicator, which represents
proportion of equity and debt Petro Rabigh is using to finance its assets, was 296.9%, while as of
December 2010; the financial leverage was 319.53%. The decrease of the financial leverage
reveals that the company has decreased its indebtedness by decreasing the amount of both long
and current debts.
Total shareholders’ equity was 8,085,698,000 Saudi Riyals, which is five times less than
the total liabilities. Considering that shareholder’s value is less than total liabilities, Petro Rabigh
relies more on debts to finance its projects and transactions rather than equity. Having
scrutinized Petro Rabigh’s balance sheet for 2009 – 2011, it could be concluded that the long –
term debts significantly exceeds the total shareholder’s value, however, the amount of long-term
63.69%
77.70%
92.87%85.85%82.76%
104.03%
124.27%133.23%
121.55%130.81%
26.42%29.68%33.87%32.52%29.73%
0.00%
20.00%
40.00%
60.00%
80.00%
100.00%
120.00%
140.00%
20072008200920102011
Debt/Equityratio
Leverageratio
Borrowingratio
Last Name 10
debt began to decrease through the following years, which reveals the improvement of
company’s capital structure and overall financial position. This pattern is shown in figure 2.
Figure 2: Petro Rabigh Financial Decision ratios
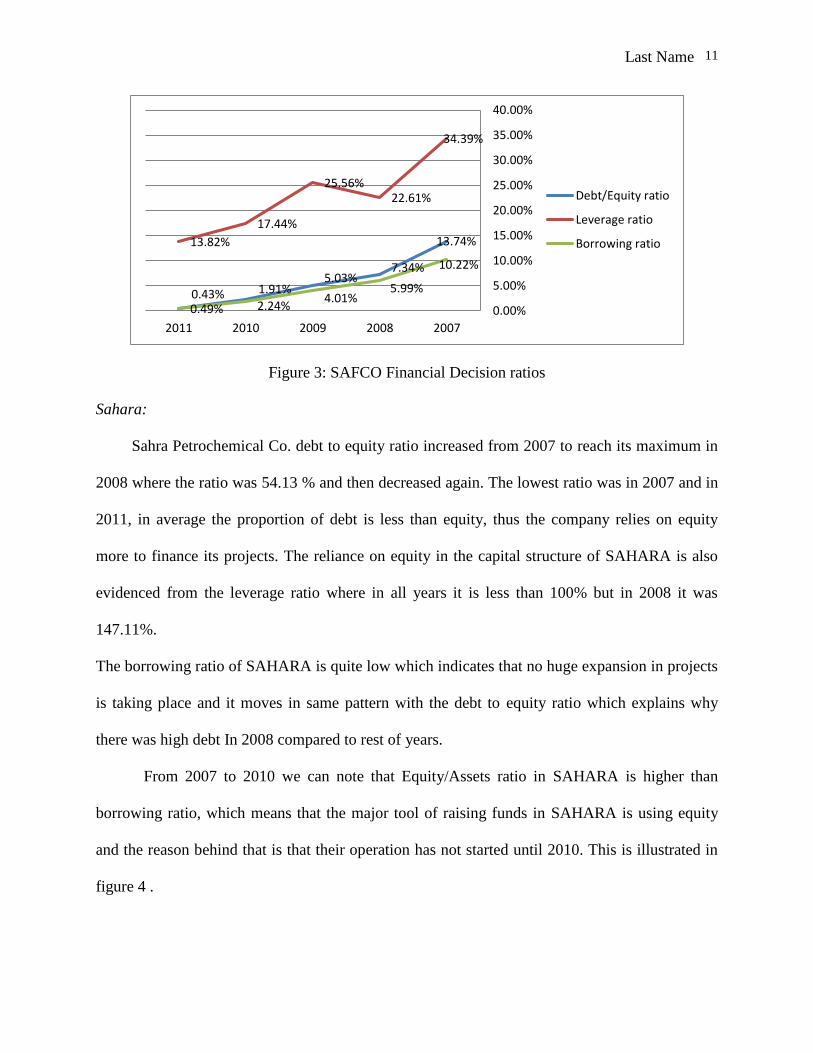
SAFCO:
Debt to equity ratio has reached its maximum - 13.74 - in 2007 and then started to
decrease in 2008, 2009, 2010. The minimum was reached in 2011, but in average the proportion
of equity is more than debt, thus the company relies on equity rather than debt. The low
percentages in the leverage ratio also indicated that the company's capital structure is more
toward equity rather than debt.
The borrowing ratio of SAFCO is quite low which indicates that no huge expansion in
projects is taking place. However, the borrowing ratio is moving in same pattern, as the debt to
equity ratio, which explains why there were high debts. In 2007, the ratio started to decrease to
reach the minimum in 2011. This is illustrated in figure 3.
326.64%
236.40%
279.66%257.45%
235.17%
352.92%
417.18%
565.91%
489.82%516.54%
72.12%45.71%42%43.65%38.14%
0.00%
100.00%
200.00%
300.00%
400.00%
500.00%
600.00%
20072008200920102011
Debt/Equity ratio
Leverage ratio
Borrowing ratio
Last Name 11
Figure 3: SAFCO Financial Decision ratios
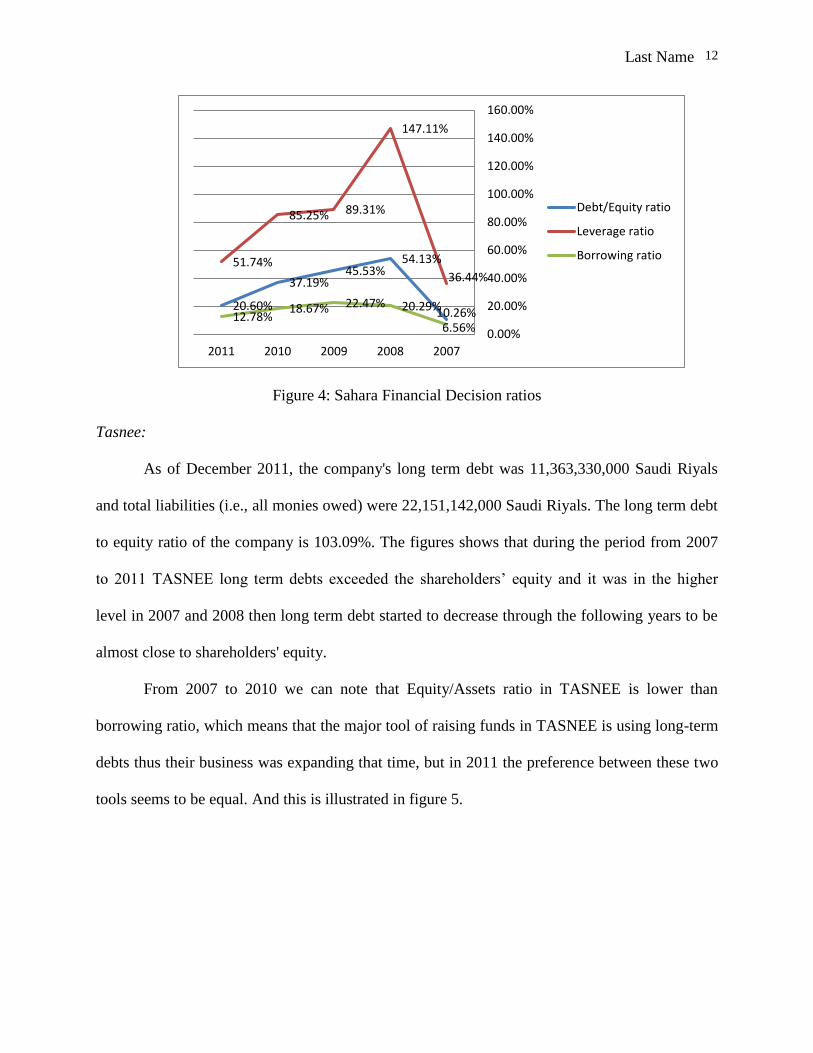
Sahara:
Sahra Petrochemical Co. debt to equity ratio increased from 2007 to reach its maximum in
2008 where the ratio was 54.13 % and then decreased again. The lowest ratio was in 2007 and in
2011, in average the proportion of debt is less than equity, thus the company relies on equity
more to finance its projects. The reliance on equity in the capital structure of SAHARA is also
evidenced from the leverage ratio where in all years it is less than 100% but in 2008 it was
147.11%.
The borrowing ratio of SAHARA is quite low which indicates that no huge expansion in projects
is taking place and it moves in same pattern with the debt to equity ratio which explains why
there was high debt In 2008 compared to rest of years.
From 2007 to 2010 we can note that Equity/Assets ratio in SAHARA is higher than
borrowing ratio, which means that the major tool of raising funds in SAHARA is using equity
and the reason behind that is that their operation has not started until 2010. This is illustrated in
figure 4 .
13.74%
7.34%5.03%
2.24%0.49%
34.39%
22.61%25.56%
17.44%
13.82%
10.22%
5.99%4.01%
1.91%0.43%0.00%
5.00%
10.00%
15.00%
20.00%
25.00%
30.00%
35.00%
40.00%
20072008200920102011
Debt/Equity ratio
Leverage ratio
Borrowing ratio
Last Name 12
Figure 4: Sahara Financial Decision ratios
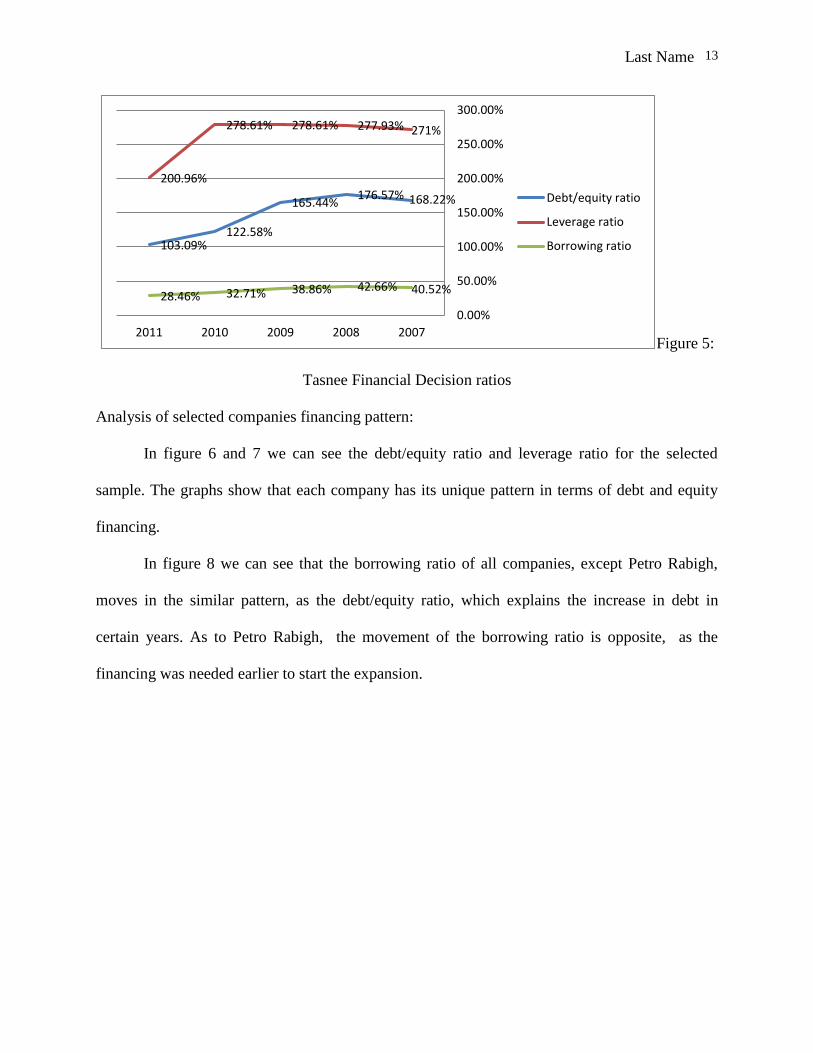
Tasnee:
As of December 2011, the company's long term debt was 11,363,330,000 Saudi Riyals
and total liabilities (i.e., all monies owed) were 22,151,142,000 Saudi Riyals. The long term debt
to equity ratio of the company is 103.09%. The figures shows that during the period from 2007
to 2011 TASNEE long term debts exceeded the shareholders’ equity and it was in the higher
level in 2007 and 2008 then long term debt started to decrease through the following years to be
almost close to shareholders' equity.
From 2007 to 2010 we can note that Equity/Assets ratio in TASNEE is lower than
borrowing ratio, which means that the major tool of raising funds in TASNEE is using long-term
debts thus their business was expanding that time, but in 2011 the preference between these two
tools seems to be equal. And this is illustrated in figure 5.
10.26%
54.13%45.53%
37.19%
20.60%
36.44%
147.11%
89.31%85.25%
51.74%
6.56%
20.29%22.47%18.67%12.78%
0.00%
20.00%
40.00%
60.00%
80.00%
100.00%
120.00%
140.00%
160.00%
20072008200920102011
Debt/Equity ratio
Leverage ratio
Borrowing ratio
Last Name 13
Figure 5:
Tasnee Financial Decision ratios
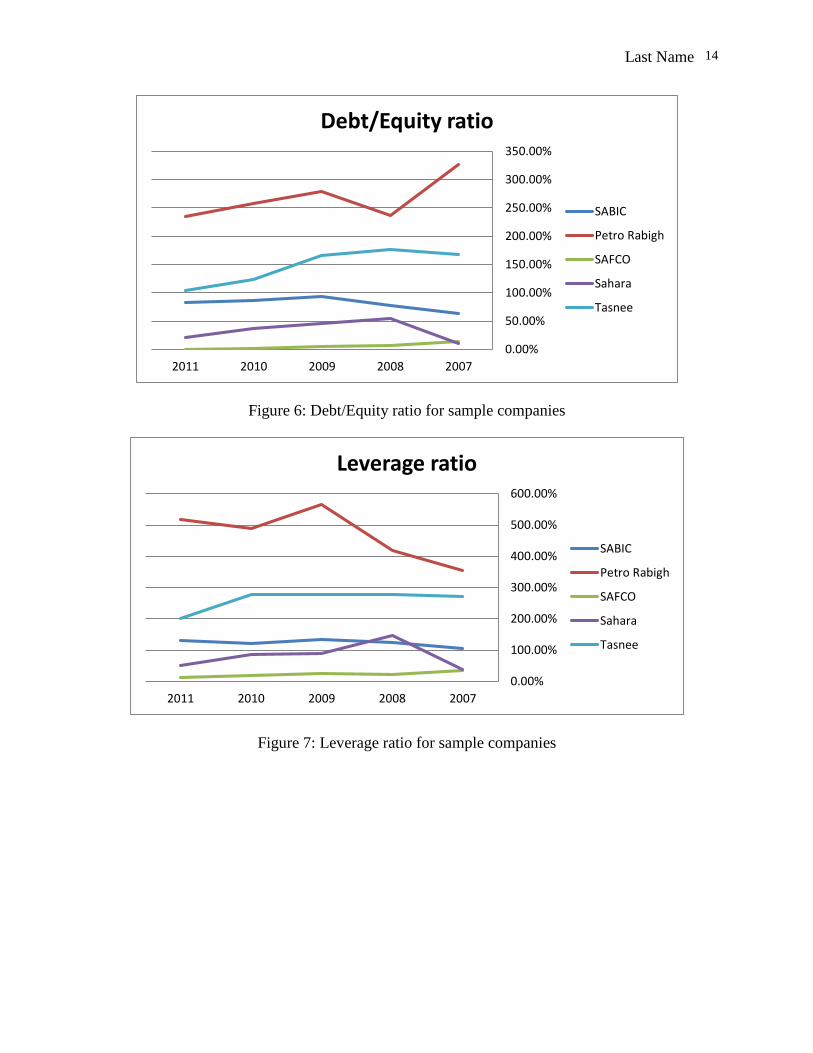
Analysis of selected companies financing pattern:
In figure 6 and 7 we can see the debt/equity ratio and leverage ratio for the selected
sample. The graphs show that each company has its unique pattern in terms of debt and equity
financing.
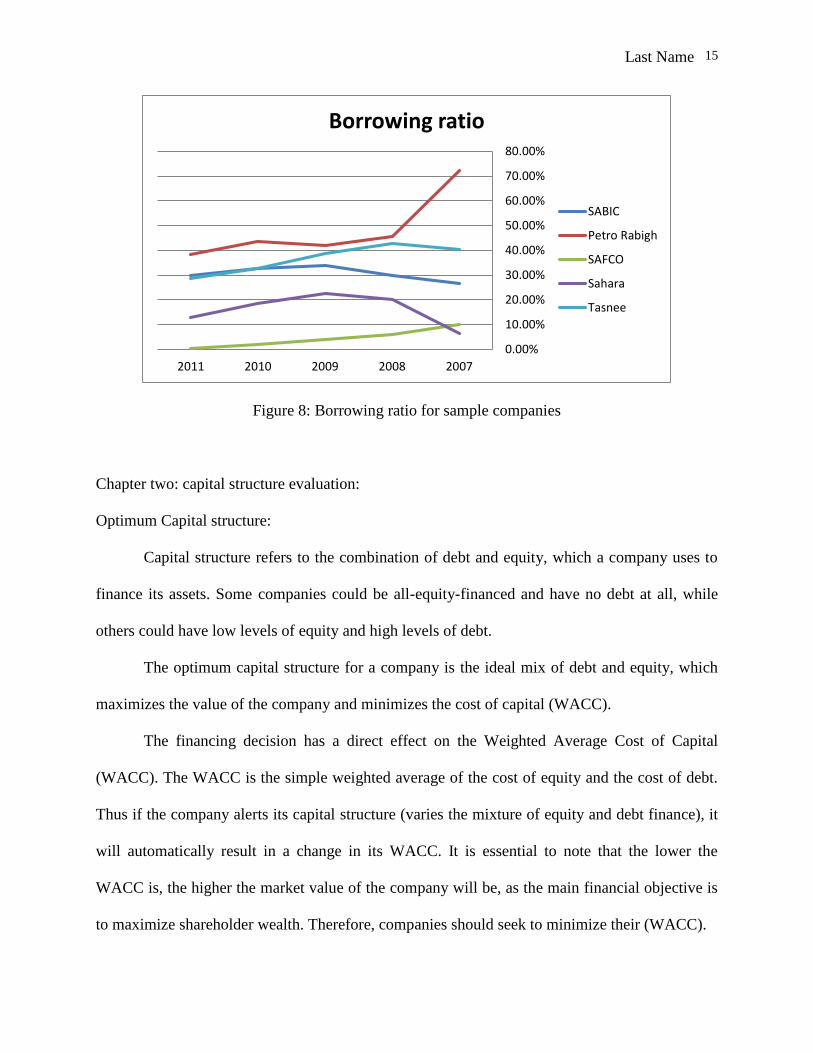
In figure 8 we can see that the borrowing ratio of all companies, except Petro Rabigh,
moves in the similar pattern, as the debt/equity ratio, which explains the increase in debt in
certain years. As to Petro Rabigh, the movement of the borrowing ratio is opposite, as the
financing was needed earlier to start the expansion.
168.22%176.57%165.44%
122.58%103.09%
271%277.93%278.61%278.61%
200.96%
40.52%42.66%38.86%32.71%28.46%
0.00%
50.00%
100.00%
150.00%
200.00%
250.00%
300.00%
20072008200920102011
Debt/equity ratio
Leverage ratio
Borrowing ratio
Last Name 14
Figure 6: Debt/Equity ratio for sample companies
Figure 7: Leverage ratio for sample companies
0.00%
50.00%
100.00%
150.00%
200.00%
250.00%
300.00%
350.00%
20072008200920102011
Debt/Equity ratio
SABIC
Petro Rabigh
SAFCO
Sahara
Tasnee
0.00%
100.00%
200.00%
300.00%
400.00%
500.00%
600.00%
20072008200920102011
Leverage ratio
SABIC
Petro Rabigh
SAFCO
Sahara
Tasnee
Last Name 15
Figure 8: Borrowing ratio for sample companies
Chapter two: capital structure evaluation:
Optimum Capital structure:
Capital structure refers to the combination of debt and equity, which a company uses to
finance its assets. Some companies could be all-equity-financed and have no debt at all, while
others could have low levels of equity and high levels of debt.
The optimum capital structure for a company is the ideal mix of debt and equity, which
maximizes the value of the company and minimizes the cost of capital (WACC).
The financing decision has a direct effect on the Weighted Average Cost of Capital
(WACC). The WACC is the simple weighted average of the cost of equity and the cost of debt.
Thus if the company alerts its capital structure (varies the mixture of equity and debt finance), it
will automatically result in a change in its WACC. It is essential to note that the lower the
WACC is, the higher the market value of the company will be, as the main financial objective is
to maximize shareholder wealth. Therefore, companies should seek to minimize their (WACC).
0.00%
10.00%
20.00%
30.00%
40.00%
50.00%
60.00%
70.00%
80.00%
20072008200920102011
Borrowing ratio
SABIC
Petro Rabigh
SAFCO
Sahara
Tasnee
Last Name 16
The Theories of Capital Structure
(1) Modigliani and Miller theory
(2) Trade-off Theory
(3) Pecking Order Theory
(1) Modigliani and Miller theory
Modigliani and Miller conducted two studies on capital structure in (1958) and (1963).
Modigliani and Miller (1958) stated that “firm value is not affected by choice of capital structure,
assuming a perfect capital market and ignoring taxation, the WACC remains constant at all
levels of gearing and the management of firm should only be concerned with attracting the
amount of capital needed of the business” (No optimal capital structure exists) (Ejdeling,
Sandstrom, 2011).
Benefits of cheaper debt = Increase in geared cost of equity due to increasing financial risk
Modigliani and Miller (1963) conducted a second study because a perfect market is not
exist in practice this study considered corporate taxes it concluded, the debt could reduce
corporate taxes paid by the firm through the deductibility of interest payments (Ejdeling,
Sandstrom, 2011). The decrease in the WACC (due to the cheaper debt) is now greater than the
increase in the WACC (due to the increase in the financial risk). Thus, WACC falls as gearing
increases (Theory of Capital Structure, 2012).
Therefore, if a company wishes to reduce its WACC, it should borrow as much as
possible. (Optimal capital structure is 99.99% debt finance) (Theory of Capital Structure, 2012).
Benefits of cheaper debt > Increase in geared cost of equity due to increasing financial risk
(2) Trade-off Theory
Last Name 17
The trade-off between using leverage thus gaining advantages through tax shields, and
using excessive leverage leads to disadvantages through financial distress costs (Ejdeling,
Sandstrom, 2011). The firm that is optimizing its overall value will focus on this trade-off when
choosing how much debt and equity to use for financing (Theory of Capital Structure, 2012).
(3) Pecking Order Theory
The pecking order theory is in sharp contrast with the theories that attempt to find an
optimal capital structure by studying the trade-off between the advantages and disadvantages of
debt finance. In this approach, the search for optimal capital structure is ignored. Companies
simply follow an established pecking order, which enables them to raise finance in the simplest
and most efficient manner. The order is as follows: first internally generated funds, then debt and
finally new issue of equity (Optimum Capital. Relevant to ACCA Qualification Paper F9, 2009).
Capital structure and industries:
The relationship between industry market and capital structure has received significant
attention in the literature. Thus, for instance, Harris and Raviv (1991) noted that it is generally
accepted that firms in a given industry will have similar leverage ratios, while leverage ratios
vary across industries (Hatfield, Cheng, Davidson, 1994).
Schwartz and Aronson (1967) document a relationship between market industry and
capital structure in five industries. Harris investigated leverage ratios for selected industries. All
of above studies l found that specific industries must have a common leverage ratio, which is
relatively stable (Hatfield, Cheng, Davidson, 1994).
Hamada (1972), using industry membership as a representation for risk, found that there
was a relationship between the cost of equity and financial leverage. DeAngelo-Masulis (1980)
Last Name 18
and Masulis (1983) use the documentation of this industry effect as one argument for the
presence of an industry-related optimal capital structure and imply that it is the tax code and tax
rate differences across industries that cause the inter-industry similarities in leverage ratios
(Hatfield, Cheng, Davidson, 1994).
The correlation of capital structure to industry market and difference tax arguments have
received practical support. However, not all of the evidence is agreed in its support. Boquist and
Moore's (1984) findings did not support the tax protection hypothesis at the firm level. However,
they did find weak evidence in support of the theory at the industry level. They like other
researchers found that total leverage varies across industry groupings (Atkeson, 2008).
In addition to the tax shield hypothesis that explains the large empirical evidence relevant
to industry and leverage, other arguments may relate to industry membership to capital structure
decisions. Lev (1974) compared operating leverage to industry and to systematic risk and found
a positive relationship. Based on Lev's study, Mandelker and Rhee (1984) derived the
relationship between beta and both operating leverage and financial leverage (Atkeson, 2008).
As industry influences production processes and operating leverage, a firm's industry
may have some influence on its capital structure decisions. Specifically, if firms attempt to keep
combined leverage at a manageable level, and, if DOL is impacted by industry membership, then
firms in an industry with a high DOL may carry less debt while firms in an industry with low
DOL may carry more debt (Hatfield, Cheng, Davidson, 1994).
Jarrell and Kim (1984) find that the unpredictability of earnings is a strong opposite
factor of debt. To the extent that earnings may be industry related, this may also affect the
relationship between industry and capital structure decisions (Hatfield, Cheng, Davidson, 1994).
Last Name 19
Individual firms and industries can be described by their growth rates. Rapidly growing
firms (and industries) have a positive net present value of projects, while slow-growth firms may
have the excess of cash. Jensen and Meckling (1976) suggest that a particular capital structure
can result from using debt as a monitoring and controlling device for managers. Further
developing the "free cash flow" argument, Jensen (1986) points out that slow-growth firm will
have large amounts of excess cash that managers may decide to use for personal privileges and
other non-positive net present value projects. If the firm issues debt, then the manager will own
an increasing percentage of the firm's stock. Further excess cash will be reduced, and the debt
covenant and bondholders will act as monitoring and controlling agents over the manager's
behavior. Following JM's and Jensen's arguments, low growth firms (and their industries) should
demonstrate increasing debt levels in their capital structure (Hatfield, Cheng, Davidson, 1994)
Capital structure and Dividend distribution factors:
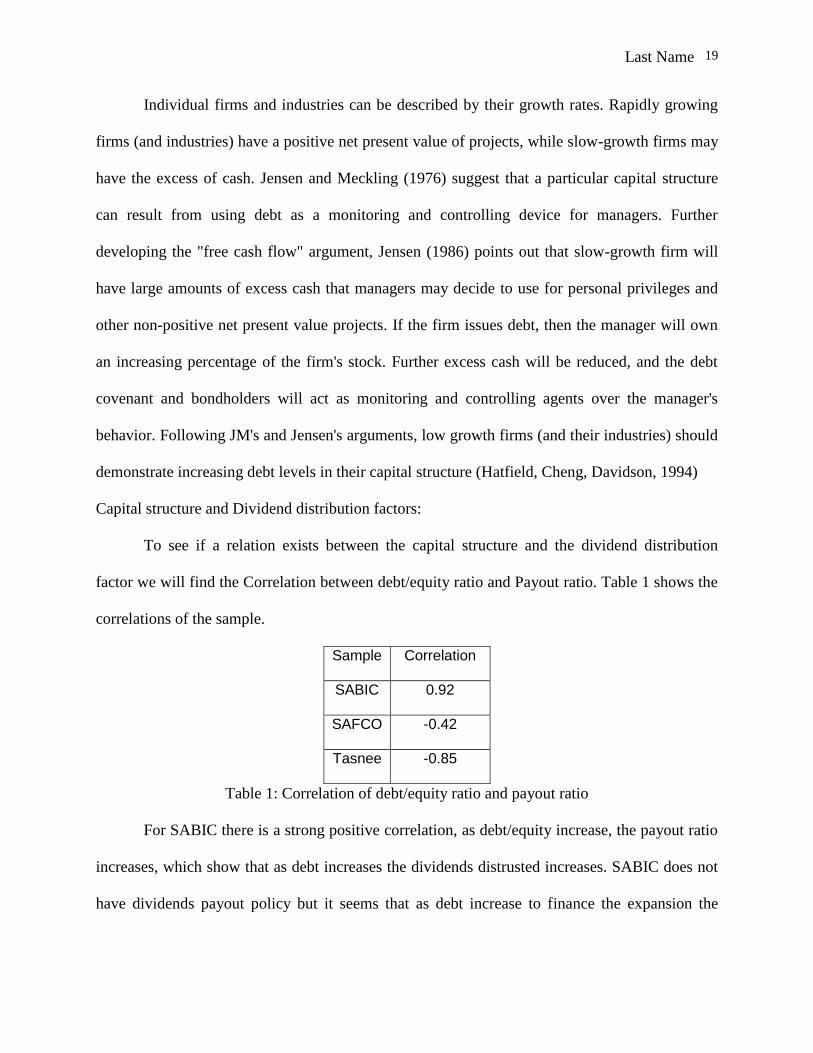
To see if a relation exists between the capital structure and the dividend distribution
factor we will find the Correlation between debt/equity ratio and Payout ratio. Table 1 shows the
correlations of the sample.
Sample Correlation
SABIC 0.92
SAFCO -0.42
Tasnee -0.85
Table 1: Correlation of debt/equity ratio and payout ratio
For SABIC there is a strong positive correlation, as debt/equity increase, the payout ratio
increases, which show that as debt increases the dividends distrusted increases. SABIC does not
have dividends payout policy but it seems that as debt increase to finance the expansion the
Last Name 20
dividend increase because of those expansions while keeping the same ratio of outstanding
shares.
SAFCO policy is that the dividend distribution are not less than 5 % of the paid capital if
the company had a profitable year , if not the company is allowed to use the saved earnings from
previous years to pay dividend to shareholders. Due to that policy we can see a negative relation
between debt increase and dividend payout. As they are required to pay dividend even though no
profit is made thus, the correlation in this situation is not effective.
We have excluded Petro Rabigh and Sahara because both of them are recently established and where Petro
Rabigh was established in 2005 and the operation cost was huge with the decrease in prices due to the financial
crises thus, no dividends were distributed. Sahara has also dividends policy, but no dividends have been paid during
these 5 years because the company was in the startup phase and operations have not been started until April 201
Capital structure and investors:
Managers and investors have a tendency to find indicative measures of their company's
performance. In many countries around the world, the professional accounting bodies and stock
exchange authorities require companies to disclose summary performance measures, such as
return on Equity (ROE), Cash Flow (CF) and Earning per Share (EPS) (Eljelly, Alghurair, 2001).
Shareholders’ considerations of capital structure are effected by corporate and personal
tax rate. In the case of Kingdom of Saudi Arabia, the tax rate is equal to the Alzakah rate, which
is 2.5% of the income and there is no personal tax rates, thus the capital structure decision does
not matter.
Chapter 3: capital structure optimization:
Testing of hypothesis:
To test the hypothesis we will examine if a relation exists between ROE and EPS, and
then analyze the EBIT of each company, finally we will link our findings with the capital
Last Name 21
structure and dividend factors to see if shareholders value maximization is affected by the capital
structure.
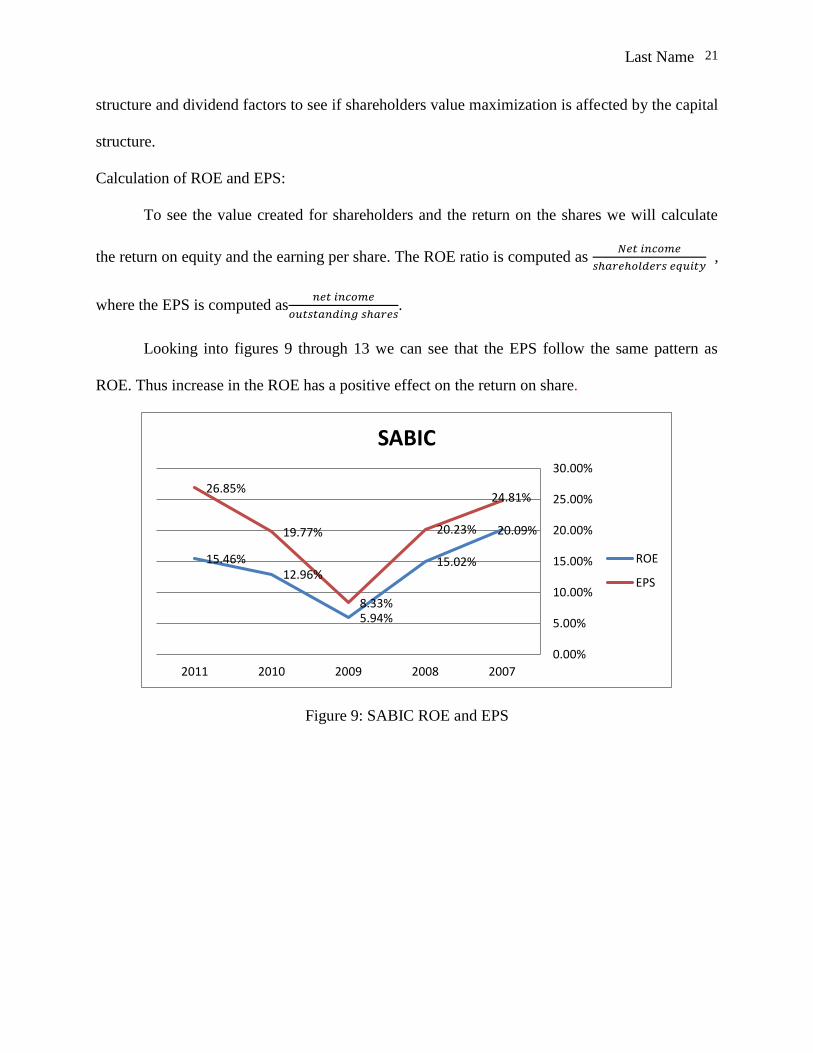
Calculation of ROE and EPS:
To see the value created for shareholders and the return on the shares we will calculate
the return on equity and the earning per share. The ROE ratio is computed as 𝑁𝑒𝑡 𝑖𝑛𝑐𝑜𝑚𝑒
𝑠ℎ𝑎𝑟𝑒ℎ𝑜𝑙𝑑𝑒𝑟𝑠 𝑒𝑞𝑢𝑖𝑡𝑦 ,
where the EPS is computed as𝑛𝑒𝑡 𝑖𝑛𝑐𝑜𝑚𝑒
𝑜𝑢𝑡𝑠𝑡𝑎𝑛𝑑𝑖𝑛𝑔 𝑠ℎ𝑎𝑟𝑒𝑠.
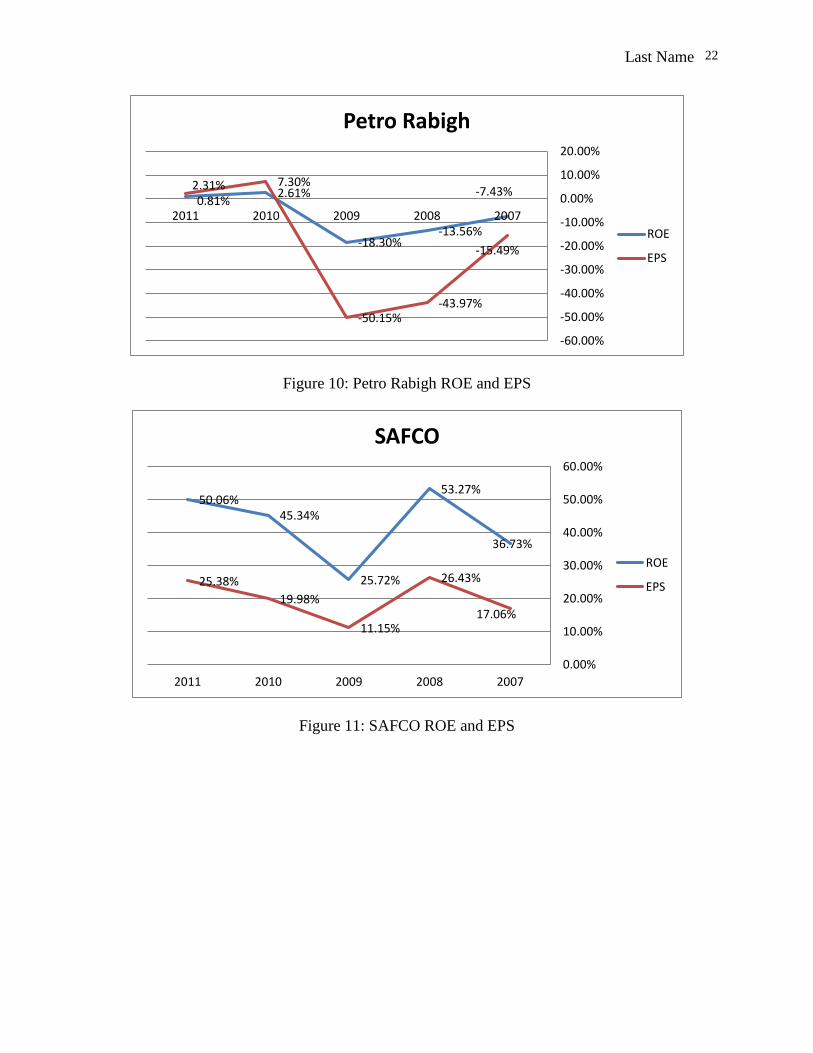
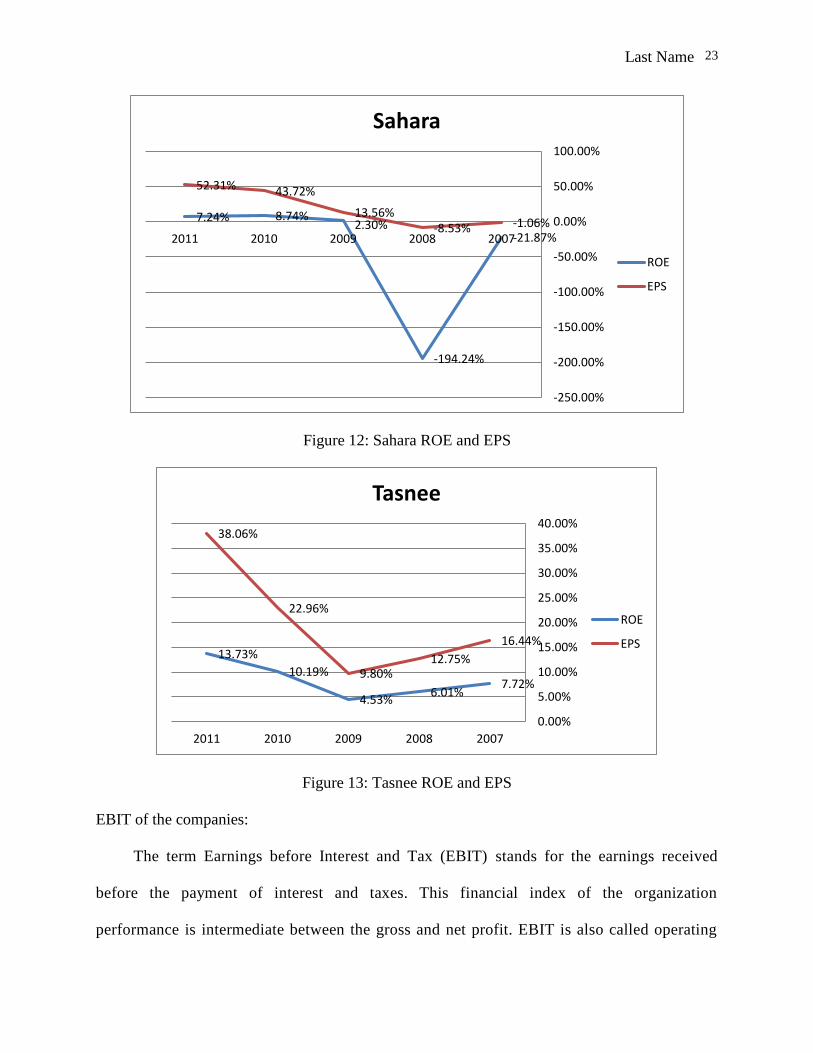
Looking into figures 9 through 13 we can see that the EPS follow the same pattern as
ROE. Thus increase in the ROE has a positive effect on the return on share.
Figure 9: SABIC ROE and EPS
20.09%
15.02%
5.94%
12.96%15.46%
24.81%
20.23%
8.33%
19.77%
26.85%
0.00%
5.00%
10.00%
15.00%
20.00%
25.00%
30.00%
20072008200920102011
SABIC
ROE
EPS
Last Name 22
Figure 10: Petro Rabigh ROE and EPS
Figure 11: SAFCO ROE and EPS
-7.43%
-13.56%-18.30%
2.61%0.81%
-15.49%
-43.97%-50.15%
7.30%2.31%
-60.00%
-50.00%
-40.00%
-30.00%
-20.00%
-10.00%
0.00%
10.00%
20.00%
20072008200920102011
Petro Rabigh
ROE
EPS
36.73%
53.27%
25.72%
45.34%50.06%
17.06%
26.43%
11.15%
19.98%
25.38%
0.00%
10.00%
20.00%
30.00%
40.00%
50.00%
60.00%
20072008200920102011
SAFCO
ROE
EPS
Last Name 23
Figure 12: Sahara ROE and EPS
Figure 13: Tasnee ROE and EPS
EBIT of the companies:
The term Earnings before Interest and Tax (EBIT) stands for the earnings received
before the payment of interest and taxes. This financial index of the organization
performance is intermediate between the gross and net profit. EBIT is also called operating
-21.87%
-194.24%
2.30%8.74%7.24% -1.06%-8.53%
13.56%
43.72%52.31%
-250.00%
-200.00%
-150.00%
-100.00%
-50.00%
0.00%
50.00%
100.00%
20072008200920102011
Sahara
ROE
EPS
7.72%6.01%
4.53%
10.19%
13.73%16.44%
12.75%9.80%
22.96%
38.06%
0.00%
5.00%
10.00%
15.00%
20.00%
25.00%
30.00%
35.00%
40.00%
20072008200920102011
Tasnee
ROE
EPS

Last Name 24
profit and is used in the calculation of a number of cost-effective ratios (for example,
operating margin). The taxes for Rabigh Refining and Petrochemical Company are paid in
accordance with Saudi Arabian fiscal regulations. Zakat is debited to the Saudi founding
shareholders and the general public, while income tax is debited to the foreign founding
shareholders’ equity account.
The normal level of EBIT is considered as the positive index. However, it does not
guarantee the total income as after the subtracting of interest (especially if the organization
has a large debt burden) it can turn into a loss. Let us look closer at our sample EBIT by
using the EBIT margin ratio, which is 𝐸𝐵𝐼𝑇
𝑆𝑎𝑙𝑒𝑠 for each year.
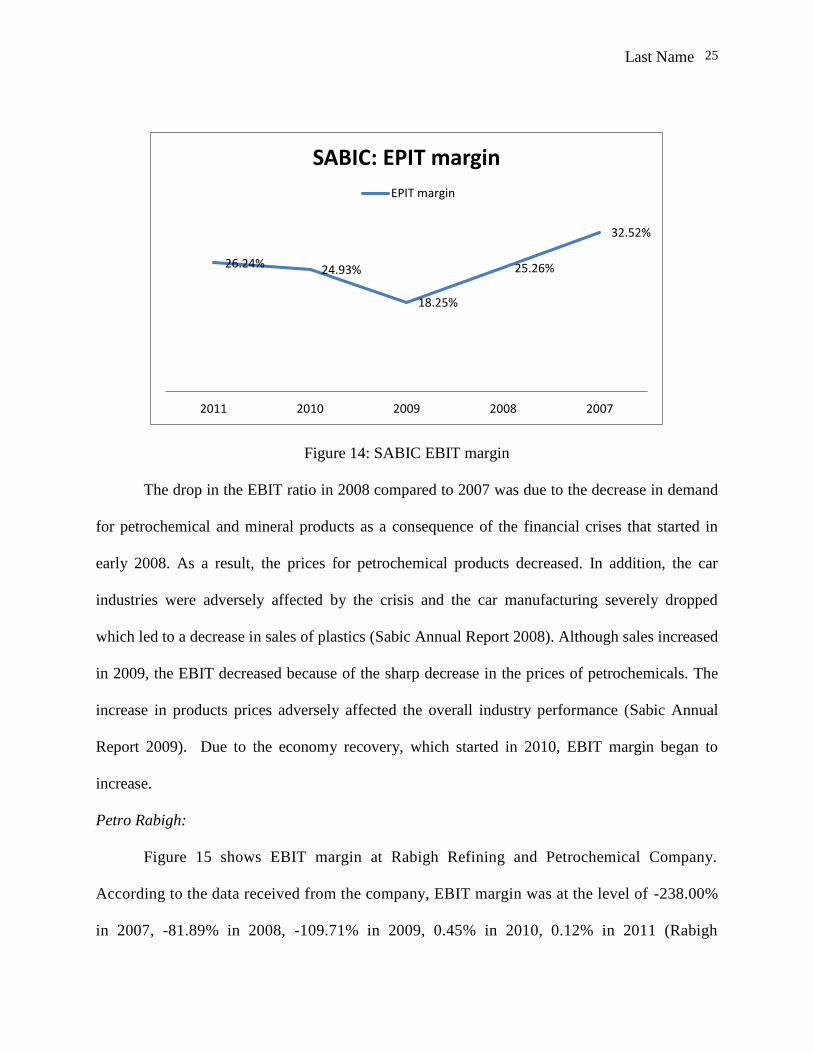
SABIC:
The EBIT margin showed a huge drop in income and a recovery again. The highest EBIT
achieved by SABIC during 2007 - 2011 was in 2007, where the EBIT margin hit 32.6% of sales.
After that the EBIT margin started to drop reaching its lowest rate of 18.25% in 2009. Afterward,
the EBIT margin started to increase in 2010 and 2011, where it reached 26.29%. The EBIT
margin and the EBITDA margin are almost equal due to the fact of low values of the
depreciation and amortization expenses, these changes are illustrated in figure 14.
Last Name 25
Figure 14: SABIC EBIT margin
The drop in the EBIT ratio in 2008 compared to 2007 was due to the decrease in demand
for petrochemical and mineral products as a consequence of the financial crises that started in
early 2008. As a result, the prices for petrochemical products decreased. In addition, the car
industries were adversely affected by the crisis and the car manufacturing severely dropped
which led to a decrease in sales of plastics (Sabic Annual Report 2008). Although sales increased
in 2009, the EBIT decreased because of the sharp decrease in the prices of petrochemicals. The
increase in products prices adversely affected the overall industry performance (Sabic Annual
Report 2009). Due to the economy recovery, which started in 2010, EBIT margin began to
increase.
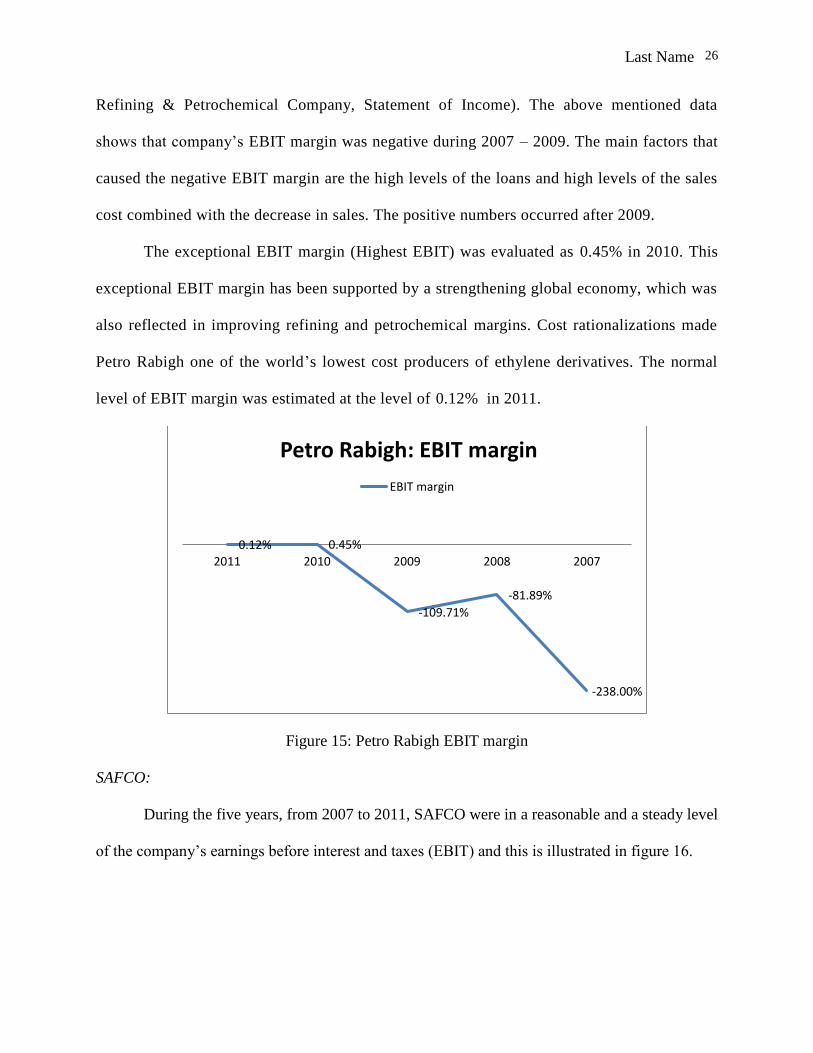
Petro Rabigh:
Figure 15 shows EBIT margin at Rabigh Refining and Petrochemical Company.
According to the data received from the company, EBIT margin was at the level of -238.00%
in 2007, -81.89% in 2008, -109.71% in 2009, 0.45% in 2010, 0.12% in 2011 (Rabigh
32.52%
25.26%
18.25%
24.93%26.24%
20072008200920102011
SABIC: EPIT margin
EPIT margin
Last Name 26
Refining & Petrochemical Company, Statement of Income). The above mentioned data
shows that company’s EBIT margin was negative during 2007 – 2009. The main factors that
caused the negative EBIT margin are the high levels of the loans and high levels of the sales
cost combined with the decrease in sales. The positive numbers occurred after 2009.
The exceptional EBIT margin (Highest EBIT) was evaluated as 0.45% in 2010. This
exceptional EBIT margin has been supported by a strengthening global economy, which was
also reflected in improving refining and petrochemical margins. Cost rationalizations made
Petro Rabigh one of the world’s lowest cost producers of ethylene derivatives. The normal
level of EBIT margin was estimated at the level of 0.12% in 2011.
Figure 15: Petro Rabigh EBIT margin
SAFCO:
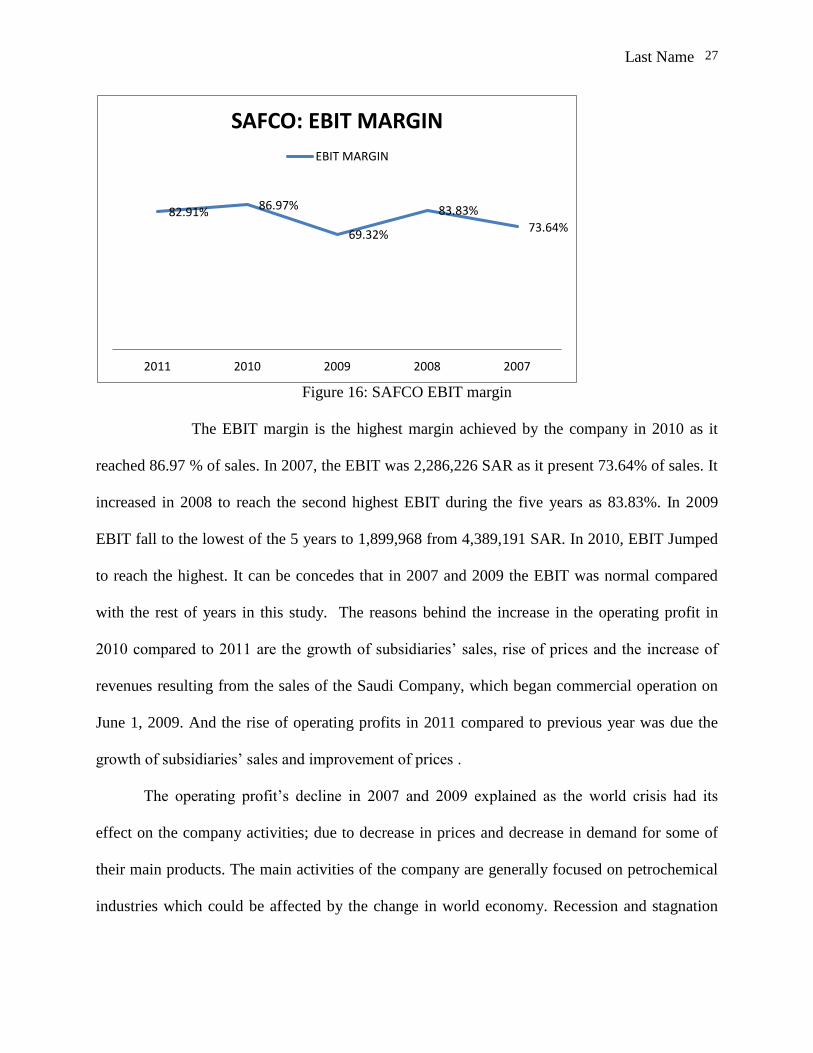
During the five years, from 2007 to 2011, SAFCO were in a reasonable and a steady level
of the company’s earnings before interest and taxes (EBIT) and this is illustrated in figure 16.
-238.00%
-81.89%
-109.71%
0.45%0.12%
20072008200920102011
Petro Rabigh: EBIT margin
EBIT margin
Last Name 27
Figure 16: SAFCO EBIT margin
The EBIT margin is the highest margin achieved by the company in 2010 as it
reached 86.97 % of sales. In 2007, the EBIT was 2,286,226 SAR as it present 73.64% of sales. It
increased in 2008 to reach the second highest EBIT during the five years as 83.83%. In 2009
EBIT fall to the lowest of the 5 years to 1,899,968 from 4,389,191 SAR. In 2010, EBIT Jumped
to reach the highest. It can be concedes that in 2007 and 2009 the EBIT was normal compared
with the rest of years in this study. The reasons behind the increase in the operating profit in
2010 compared to 2011 are the growth of subsidiaries’ sales, rise of prices and the increase of
revenues resulting from the sales of the Saudi Company, which began commercial operation on
June 1, 2009. And the rise of operating profits in 2011 compared to previous year was due the
growth of subsidiaries’ sales and improvement of prices .
The operating profit’s decline in 2007 and 2009 explained as the world crisis had its
effect on the company activities; due to decrease in prices and decrease in demand for some of
their main products. The main activities of the company are generally focused on petrochemical
industries which could be affected by the change in world economy. Recession and stagnation
73.64%
83.83%
69.32%
86.97%82.91%
20072008200920102011
SAFCO: EBIT MARGIN
EBIT MARGIN

Last Name 28
are affecting in reducing the demand for the company’s products of petrochemicals, thus the
reducing of prices of these products.
Sahara:
The company EBIT during the period from 2007 to 2011 is quite good since the EBIT is
increasing which is illustrated in figure 17.
Figure 17: Sahara EBIT margin
The company's record shows a loss in 2007 and in 2008. The EBIT in 2007 was SR
(6,040,000) and SR (40,556,000) in 2008 which is the lowest EBIT during those 5 years and it is
(3.60%) and (1197.05%) of the total revenue respectively. The company's EBIT by 2009 reached
SR 77,600,000 and that is 50.54% of the total revenue which is better than the past two years and
then the performance of the company has been improved and the result is a raise in its EBIT
which is SR 330,359,000 in 2010 and SR 438,359,000 in 2011 with a percentage of revenue of
96.79% and 68.57% respectively. This is the highest earning for the company during this period.
It can be conceded that the lowest EBIT was in 2008, the highest was in 2011 and the EBIT of
2009 and 2010 is normal. Although the company is affected by many macroeconomic factors
-3.60%
-1197.05%
50.54%96.79%68.57%
20072008200920102011
Sahara: EBIT margin
EBIT margin
Last Name 29
such as inflation rate, wages rate, exchange rate or firm specific risk such as environmental fines
according to its type of activities or the risk associated with Suez Canal according to the political
issues however the main reason behind the loss that the company faced in 2007 and 2008 is that
it had not started its operations yet so there was no operating income. Although the company
started its main chemical project in the first quarter of 2009 and began its operations, it was not
able to generate operating income until 2011 and that explains the highest EBIT it could
generated that year. However during 2009 and 2010 the company could enhance its performance
by other revenue it made through its subsidiaries and the other investments.
Tasnee:
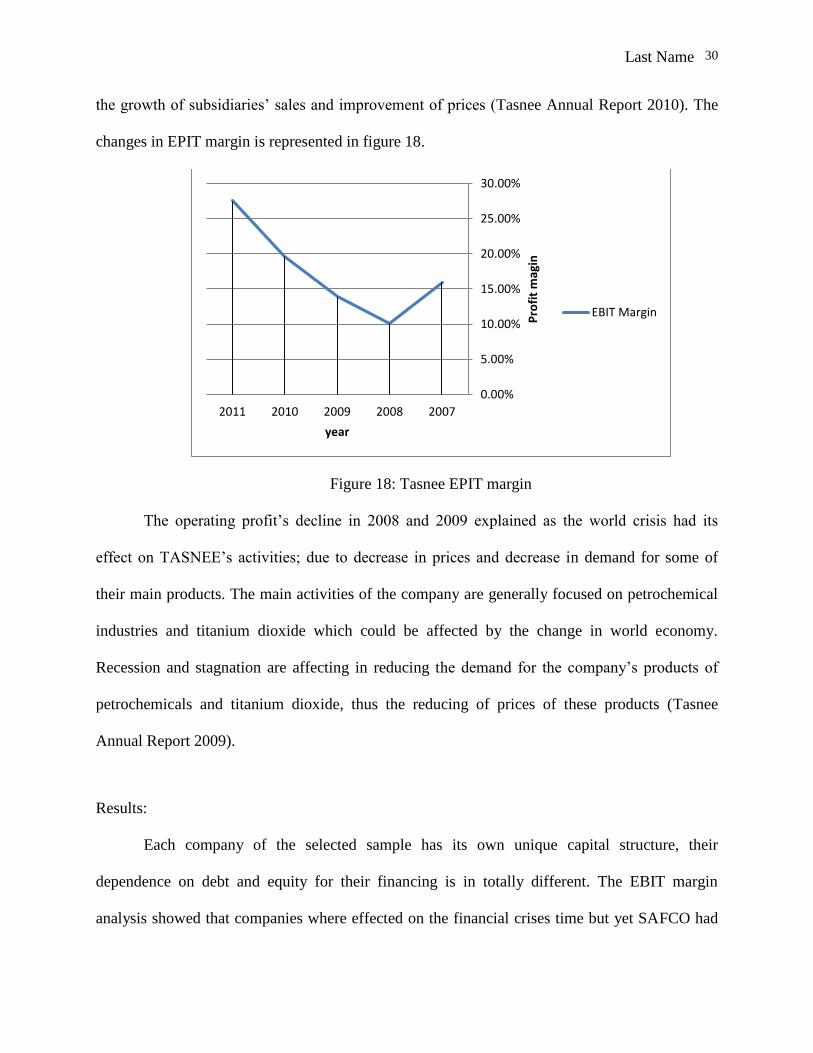
While the change of COGS and expenses during the five years, from 2007 to 2011, were
in a reasonable and a steady level; the National Industrialization Company's earnings before
interest and taxes (EBIT) in 2011 were 5,406,968,000 SAR, or 27.5% of sales. This EBIT
margin is the highest margin achieved by the company from 2007 until 2011. In 2007, the EBIT
was 1,148,943,000 SAR or 15.9% of sales. It declined in 2008 to be 10.1% of sales and this was
the lowest EBIT during the five years. In 2009 EBIT raised from 1,009,541,000 SAR by 3.3% to
reach 1,515,878,000 SAR, or 14% of sales. In 2010, EBIT was better than the company achieved
in 2009, when the EBIT margin was equal to 19.6% of sales. . It can be concedes that in 2007
and 2010 the EBIT was normal compared with the rest of years in this study. The reasons behind
the increase in the operating profit in 2010 compared to 2009 are the growth of subsidiaries
‘sales, rise of prices and the increase of revenues resulting from the sales of the Saudi Company
for Ethylene and Polyethylene, which began commercial operation on June 1, 2009 (Tasnee
Annual Report 2011). The rise of operating profits in 2011 compared to previous year was due to
Last Name 30
the growth of subsidiaries’ sales and improvement of prices (Tasnee Annual Report 2010). The
changes in EPIT margin is represented in figure 18.
Figure 18: Tasnee EPIT margin
The operating profit’s decline in 2008 and 2009 explained as the world crisis had its
effect on TASNEE’s activities; due to decrease in prices and decrease in demand for some of
their main products. The main activities of the company are generally focused on petrochemical
industries and titanium dioxide which could be affected by the change in world economy.
Recession and stagnation are affecting in reducing the demand for the company’s products of
petrochemicals and titanium dioxide, thus the reducing of prices of these products (Tasnee
Annual Report 2009).
Results:
Each company of the selected sample has its own unique capital structure, their
dependence on debt and equity for their financing is in totally different. The EBIT margin
analysis showed that companies where effected on the financial crises time but yet SAFCO had
0.00%
5.00%
10.00%
15.00%
20.00%
25.00%
30.00%
20072008200920102011
Pro
fit
mag
in
year
EBIT Margin
Last Name 31
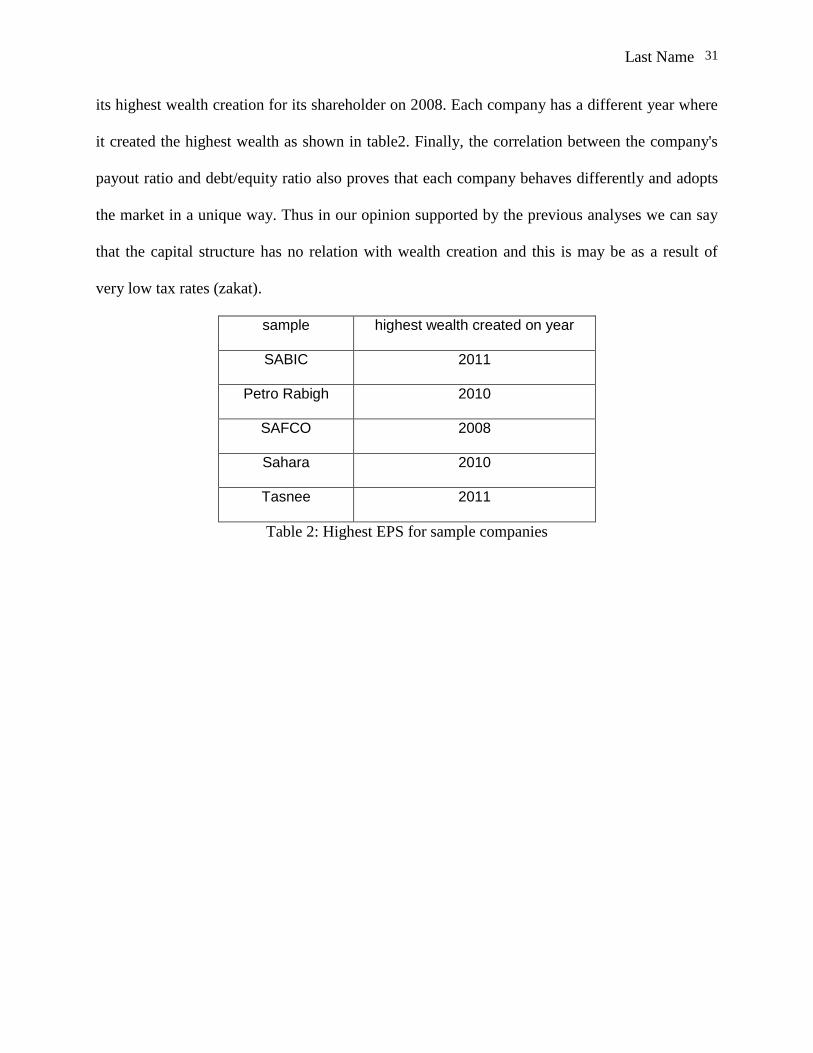
its highest wealth creation for its shareholder on 2008. Each company has a different year where
it created the highest wealth as shown in table2. Finally, the correlation between the company's
payout ratio and debt/equity ratio also proves that each company behaves differently and adopts
the market in a unique way. Thus in our opinion supported by the previous analyses we can say
that the capital structure has no relation with wealth creation and this is may be as a result of
very low tax rates (zakat).
sample highest wealth created on year
SABIC 2011
Petro Rabigh 2010
SAFCO 2008
Sahara 2010
Tasnee 2011
Table 2: Highest EPS for sample companies
Last Name 32
References
Accounting Debt (Petro Rabigh). (2012). Interim Statements and Cash Flows. Retrieved from:
http://www.petrorabigh.com/en/Financial_Statements/FS_Q3_2012-
English.pdf
Atkeson, A. (2008). A Dynamic Theory of Optimal Capital Structure and Executive
Compensation. University of Pennsylvania and NBER .
Business Sectors (2012). Tasnee Official Website. Retrieved from:
http://www.tasnee.com/getdoc/bd64ae16-e5c3-44d0-aec7
3abd3b1ce6eb/BusinessSectors.aspx
Castle, B. (2008). Prospectus: Rabigh Refining & Petroleum. Retrieved from:
http://www.petrorabigh.com/en/petrorabigh_e_prospectus.pdf
Ejdeling, A.E., Sandstrom, J. (2011). What Factors Affect Capital Structure Choices in
Partnership Companies. School of Business, Economics and Law, University of
Gothenburg. Retrieved from:
Eljelly, A.M.A., Alghurair, K.S. (2001). Performance Measures and Wealth Creation in an
Emerging Market: The Case of Saudi Arabia. International Journal of Commerce and
Management, 11( 3/4): 54 – 71.
Hatfield, G.B., Cheng, L.T.W., Davidson, W.N. (1994). The Determination of Optimal Capital
Structure: the Effect of Firm and Industry Debt Ratios on Market Value. Journal of
Financial and Strategic Decisions, 7 (3).
Theory of Capital Structure (2012). Finance: Maps of World. Retrieved from:
http://finance.mapsofworld.com/corporate-finance/hybrid-financing/trade-off-theory-
capital-structure.html
Last Name 33
Jensen, M.C., Clifford, W. S. Jr. (1984). The Modern Theory of Corporate Finance. New York:
McGraw-Hill Inc.
Jones, G. (2011). Rabigh Refining & Petroleum Co.:Annual Report 2010. Retrieved from:
http://www.petrorabigh.com/Annual_Report_2010_EN.pdf
National Industrialization Co. – NIC. (2012). Gulf Base. Retrieved from:
http://www.gulfbase.com/profile-summary-national-industrialization-
co-nic-407?pageid=39
Optimum Capital. Relevant to ACCA Qualification Paper F9. (2009). Student Accountant.
Retrieved from:
http://www.accaglobal.com/content/dam/acca/global/PDF-
students/2012s/sa_junjul09_lynch.pdf
Petrochemical Industry. (2012). The Canadian Encyclopedia. Historica-Dominion. Retrieved
from: http://www.thecanadianencyclopedia.com/articles/petrochemical-
industry
Rabigh Refining & Petrochemical Company Annual Report 2010. Retrieved from
http://www.petrorabigh.com/Annual_Report_2010_EN.pdf
Rabigh Refining & Petrochemical Company Annual Report 2011. Retrieved from
http://www.petrorabigh.com/Annual_Report_2011_EN.pdf
Rabigh Refining & Petrochemical Company Official web-site. Statement of Income.
Retrieved from
http://www.petrorabigh.com/en/Income_Statement.aspx
Last Name 34
Sabic Annual Report 2008 (2008). Sabic Official Website. Retrieved from:
www.sabic.com/me/en/binaries/EnglishAnnualReport2008_tcm15-
4458.pdf
Sabic Annual Report 2009 (2009). Sabic Official Website. Retrieved from:
http://www.sabic.com/corporate/en/binaries/SABIC%20Report%2020
09%20English_tcm4-5203.pdf
Tasnee Annul Report 2011. (2011). Tasnee Company. Retrieved from:
http://www.tasnee.com/getdoc/280481e8-9e2f-4d47-a01d-
cf26178c26d9/Tasnee-Annual-Report-2011-Eng-Layout.aspx
Tasnee Annul Report 2010. (2010). Tasnee Company. Retrieved from:
http://www.tasnee.com/getdoc/d6644c92-e220-400d-a750-
6f2e43161cd8/Tasnee-EngRprt-3.aspx
Tasnee Annul Report 2009. (2009). Tasnee Company. Retrieved from:
The World Factbook. Middle East: Saudi Arabia. (2012). Central Intelligence Agency. Retrieved
from: https://www.cia.gov/library/publications/the-world-
factbook/geos/sa.html\)


