
Copyright © 2011 Mitsui Chemicals, Inc.
Mitsui Chemicals, Inc.Mitsui Chemicals, Inc.
Financial SummaryFinancial Summary
<Remarks>
FY2010 indicates the fiscal year starting on April 1 of 2010 and ending on March 31 of 2011
MayMay 1111, 20, 201111
Results of FY20Results of FY20110 & Outlook for FY200 & Outlook for FY201111

Copyright © 2011 Mitsui Chemicals, Inc.
ContentsContents1.Results of FY201.Results of FY201010 (April 1, 20(April 1, 201010 –– MarchMarch 3311, 201, 20111))
1) Operation Topics in FY201) Operation Topics in FY2011002) Number of Subsidiaries and Affiliates2) Number of Subsidiaries and Affiliates3) Consolidated Financial Highlights3) Consolidated Financial Highlights4)4) Change Change inin Business Segments (Sales FY2009)Business Segments (Sales FY2009)5) Change 5) Change inin Business Segments (Operating IncomeBusiness Segments (Operating Income/loss/loss FY2009FY2009))66) Sales (by Business Segment)) Sales (by Business Segment)77) Operating Income/loss ) Operating Income/loss ((by Business Segment)by Business Segment)88) Operating Income/loss (by Business Segment)) Operating Income/loss (by Business Segment)99) Non) Non--Operating Income and ExpensesOperating Income and Expenses
10)10) Special Gains and LossesSpecial Gains and Losses11) C11) Comprehensiveomprehensive IncomeIncome1122) Consolidated Balance Sheet) Consolidated Balance Sheet1313) Consolidated Statement of Cash Flow) Consolidated Statement of Cash Flow
2. Outlook for FY2012. Outlook for FY20111 (April 1, 201(April 1, 20111 –– March 31, 201March 31, 20122))1) Operation Topics in FY2011) Operation Topics in FY20111 ((AprilApril 20120111 through March 201through March 20122))2) Consolidated Financial Highlights2) Consolidated Financial Highlights3) Sales (by Business Segment)3) Sales (by Business Segment)4) Operating Income/loss (by Business Segment)4) Operating Income/loss (by Business Segment)55) Non) Non--Operating Income and ExpensesOperating Income and Expenses66) Special Gains and Losses) Special Gains and Losses7) Consolidated Statement of Cash Flow7) Consolidated Statement of Cash Flow88) ) ConsolidatedConsolidated Accounting FundamentalsAccounting Fundamentals
3. Appendix3. Appendix1) History of Main Product Prices1) History of Main Product Prices2) History of Consolidated D/E Ratio2) History of Consolidated D/E Ratio3) Main Subsidiaries and Affiliates 3) Main Subsidiaries and Affiliates 4) Capital Expenditure and R&D4) Capital Expenditure and R&D5) Oversea Sales5) Oversea Sales
・・・・・・ 1,21,2・・・・・・ 33・・・・・・ 44・・・・・・ 55・・・・・・ 66・・・・・・ 77・・・・・・ 88・・・・・・ 99・・・・・・ 1100・・・・・・ 1111・・・・・・ 1122・・・・・・ 1313・・・・・・ 1414
・・・・・・ 15,1615,16・・・・・・ 1717・・・・・・ 1818・・・・・・ 1919・・・・・・ 2020・・・・・・ 2121・・・・・・ 2222・・・・・・ 2323
・・・・・・ 2424・・・・・・ 2525・・・・・・ 2626・・・・・・ 2727・・・・・・ 2828
Copyright © 2011 Mitsui Chemicals, Inc.
1.1. Results of FY20Results of FY20110 0 (April 1, 20(April 1, 20110 0 –– March 3March 311, 20, 20111)1)
Copyright © 2011 Mitsui Chemicals, Inc.
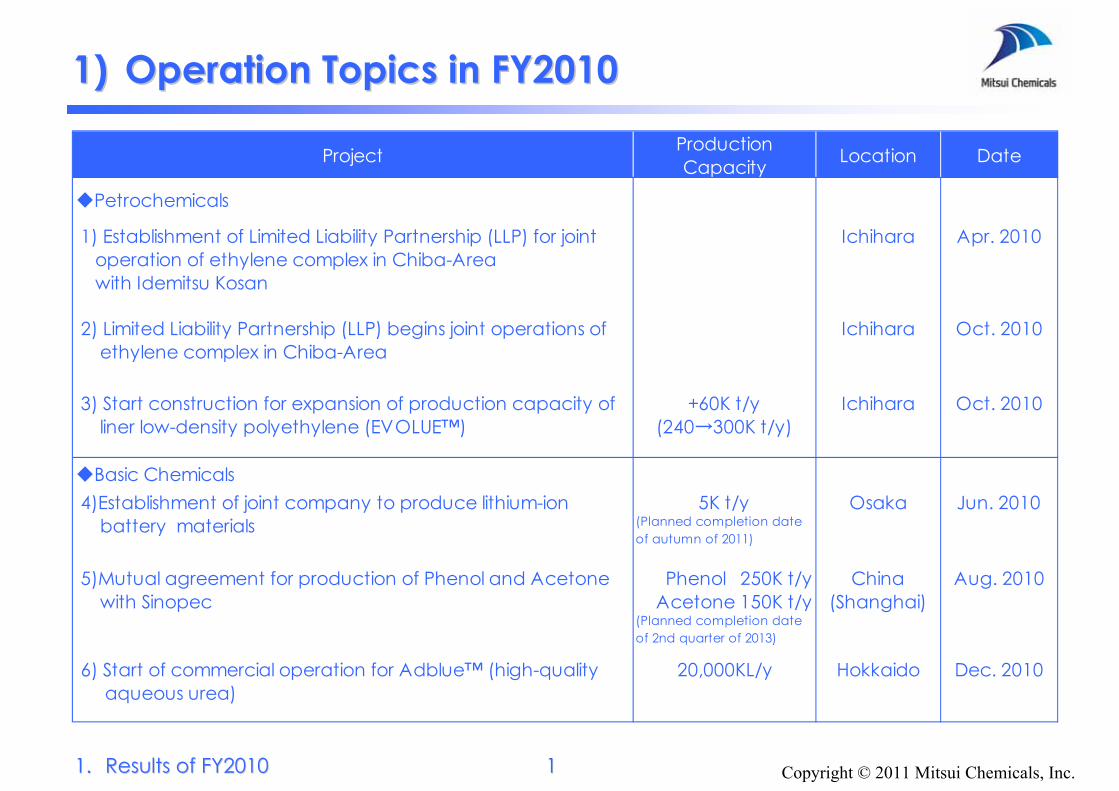
Project ProductionCapacity Location Date
◆Petrochemicals
1) Establishment of Limited Liability Partnership (LLP) for joint operation of ethylene complex in Chiba-Area with Idemitsu Kosan
Ichihara Apr. 2010
2) Limited Liability Partnership (LLP) begins joint operations of ethylene complex in Chiba-Area
Ichihara Oct. 2010
3) Start construction for expansion of production capacity of liner low-density polyethylene (EVOLUE™)
+60K t/y(240→300K t/y)
Ichihara Oct. 2010
◆Basic Chemicals5K t/y
(Planned completion dateof autumn of 2011)
Phenol 250K t/yAcetone 150K t/y
(Planned completion dateof 2nd quarter of 2013)
6) Start of commercial operation for Adblue™ (high-quality aqueous urea)
20,000KL/y Hokkaido Dec. 2010
4)Establishment of joint company to produce lithium-ion battery materials
Osaka Jun. 2010
China(Shanghai)
Aug. 2010 5)Mutual agreement for production of Phenol and Acetone with Sinopec
1)1) Operation Topics Operation Topics inin FY20FY201010
1.1. Results of FY20Results of FY201010 11

Copyright © 2011 Mitsui Chemicals, Inc.
Project ProductionCapacity Location Date
◆Functional Polymeric Materials
EPT 75K t/y(Planned completion dateof 1st quarter of 2014)
◆Fabricated Products
8) Transfer of OPULENT™ business to TOHCELLO CO.,LTD. Apr. 2010
9) Merge film/sheet operations to form Mitsui Chemicals Tohcello,Inc.
Oct. 2010
◆Functional Chemicals
10)Establishment of new "PP catarist" joint venture company in Korea with Honam petrochemicals Kores
(Yeosu) Jan.2011
◆Others
11) Establishment of Brazilian subsidiary, Mitsui Chemicals Brasil Sociedade Limitada
Brazil(Sao Paulo)
Jun. 2010
7)Establishment of new EPT joint venture company and production plant in China with Sinopec
China(Shanghai)
Aug. 2010
1)1) Operation Topics Operation Topics inin FY20FY201010
221.1. Results of FY20Results of FY201010
Copyright © 2011 Mitsui Chemicals, Inc.
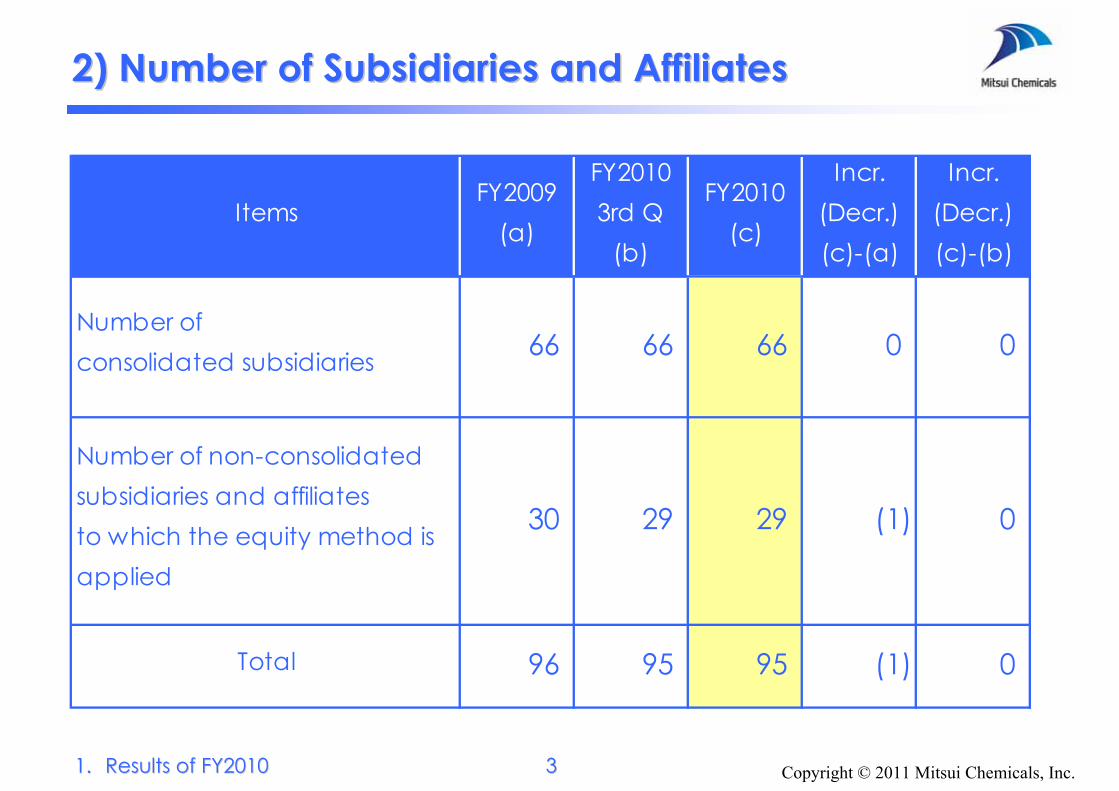
ItemsFY2009
(a)
FY20103rd Q
(b)
FY2010(c)
Incr.(Decr.)(c)-(a)
Incr.(Decr.)(c)-(b)
Number ofconsolidated subsidiaries 66 66 66 0 0
Number of non-consolidatedsubsidiaries and affiliatesto which the equity method isapplied
30 29 29 (1) 0
Total 96 95 95 (1) 0
22) Number of Subsidiaries and Affiliates) Number of Subsidiaries and Affiliates
331.1. Results of FY20Results of FY201010
Copyright © 2011 Mitsui Chemicals, Inc.
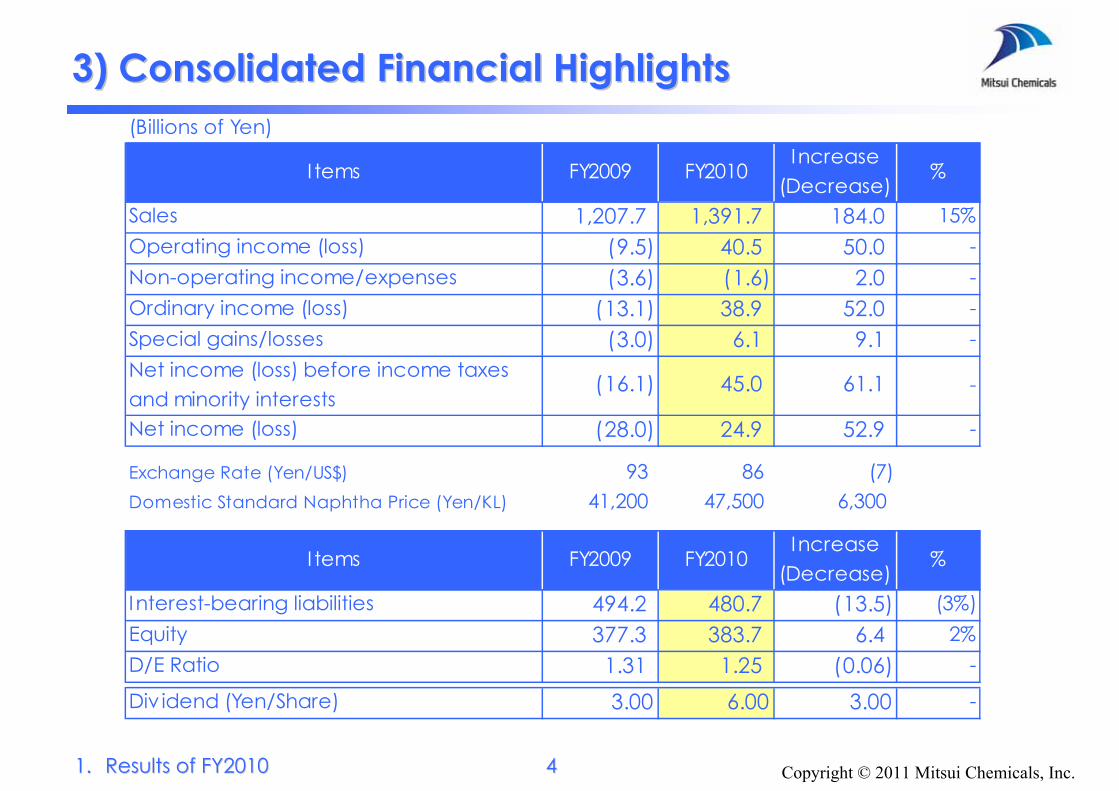
3) Consolidated Financial Highlights3) Consolidated Financial Highlights(Billions of Yen)
I tems FY2009 FY2010Increase
(Decrease)%
Sales 1,207.7 1,391.7 184.0 15%Operating income (loss) (9.5) 40.5 50.0 -Non-operating income/expenses (3.6) (1.6) 2.0 -Ordinary income (loss) (13.1) 38.9 52.0 -Special gains/losses (3.0) 6.1 9.1 -Net income (loss) before income taxesand minority interests
(16.1) 45.0 61.1 -
Net income (loss) (28.0) 24.9 52.9 -
Exchange Rate (Yen/US$) 93 86 (7)Domestic Standard Naphtha Price (Yen/KL) 41,200 47,500 6,300
I tems FY2009 FY2010Increase
(Decrease)%
Interest-bearing liabilities 494.2 480.7 (13.5) (3%)Equity 377.3 383.7 6.4 2%D/E Ratio 1.31 1.25 (0.06) -
Div idend (Yen/Share) 3.00 6.00 3.00 -
441.1. Results of FY20Results of FY201010

Copyright © 2011 Mitsui Chemicals, Inc.
(Billions of Yen)Former Business
SegmentFY2009
New BusinessSegment
FY2009 TotalIncr.
(Decr.)
Petrochemicals 364.5
Basic Chemicals 348.8
Polyurethane 145.6Functional Polymeric
Materials86.0
FabricatedProducts
125.0
Advanced Chemicals 105.9 FunctionalChemicals
118.6 118.6 12.7
Others 19.1 Others 19.2 19.2 0.1
Total 1,207.7 Total 1,207.7 1,207.7 0.0
Basic Chemicals
PerformanceMaterials
3.5
(16.3)
709.8
372.9
713.3
356.6
44) ) Change inChange in Business Segments Business Segments (Sales FY2009)(Sales FY2009)
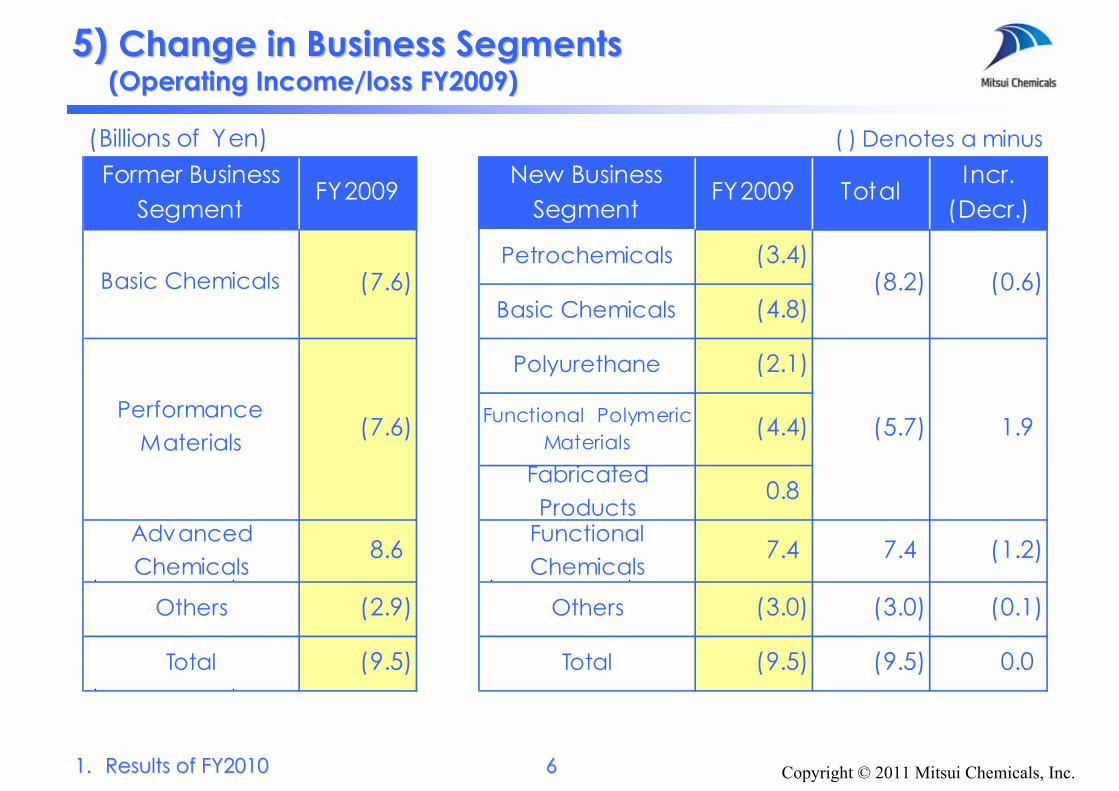
On April 1, 2010, Mitsui Chemicals implemented organizational restructuring to strengthen its response to rapid changes in the business environment. The previous three business sectors were reorganized into six business sectors, in a shift from a system consisting of large sectors to a system consisting of small sectors that can respond to changes more quickly and flexibly.
551.1. Results of FY20Results of FY201010
Copyright © 2011 Mitsui Chemicals, Inc.
(Billions of Yen) ( ) Denotes a minusFormer Business
SegmentFY2009
New BusinessSegment
FY2009 TotalIncr.
(Decr.)
Petrochemicals (3.4)
Basic Chemicals (4.8)
Polyurethane (2.1)
Functional PolymericMaterials
(4.4)
FabricatedProducts
0.8
AdvancedChemicals
8.6FunctionalChemicals
7.4 7.4 (1.2)
Others (2.9) Others (3.0) (3.0) (0.1)
Total (9.5) Total (9.5) (9.5) 0.0
Basic Chemicals
PerformanceMaterials
(0.6)
1.9
(7.6)
(7.6)
(8.2)
(5.7)
5) 5) Change in Business SegmentsChange in Business Segments(Operating Income/loss FY2009)(Operating Income/loss FY2009)
661.1. Results of FY20Results of FY201010
Copyright © 2011 Mitsui Chemicals, Inc.
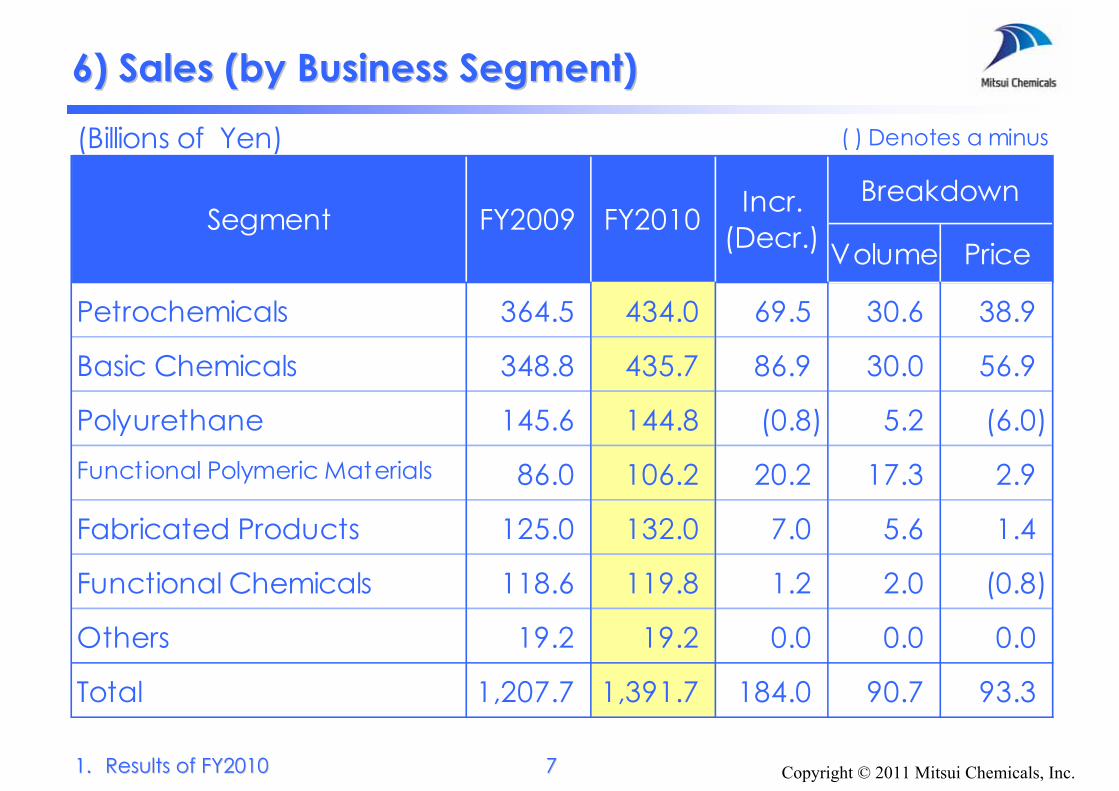
6) Sales (by Business Segment)6) Sales (by Business Segment)(Billions of Yen) ( ) Denotes a minus
Breakdown
Volume Price
Petrochemicals 364.5 434.0 69.5 30.6 38.9
Basic Chemicals 348.8 435.7 86.9 30.0 56.9
Polyurethane 145.6 144.8 (0.8) 5.2 (6.0)Functional Polymeric Materials 86.0 106.2 20.2 17.3 2.9
Fabricated Products 125.0 132.0 7.0 5.6 1.4
Functional Chemicals 118.6 119.8 1.2 2.0 (0.8)
Others 19.2 19.2 0.0 0.0 0.0
Total 1,207.7 1,391.7 184.0 90.7 93.3
Segment FY2009 Incr.(Decr.)FY2010
( ) Denotes a minus
771.1. Results of FY20Results of FY201010

Copyright © 2011 Mitsui Chemicals, Inc.
7) Operating Income/Loss 7) Operating Income/Loss (by Business Segment)(by Business Segment)
(Billions of Yen) ( ) Denotes a minus
Breakdown
Volume *Price Costs
Petrochemicals (3.4) 12.8 16.2 5.3 3.0 7.9
Basic Chemicals (4.8) 20.4 25.2 3.9 16.4 4.9
Polyurethane (2.1) (9.0) (6.9) 2.2 (10.3) 1.2
Functional Polymeric Materials (4.4) 7.2 11.6 6.4 0.1 5.1
Fabricated Products 0.8 1.4 0.6 1.9 (1.2) (0.1)
Functional Chemicals 7.4 10.0 2.6 1.0 0.8 0.8
Others (3.0) (2.3) 0.7 0.0 0.0 0.7
Total (9.5) 40.5 50.0 20.7 8.8 20.5*Price:including both sale and purchase price variances
Segment FY2009 FY2010 Incr.(Decr.)
881.1. Results of FY20Results of FY201010
Copyright © 2011 Mitsui Chemicals, Inc.
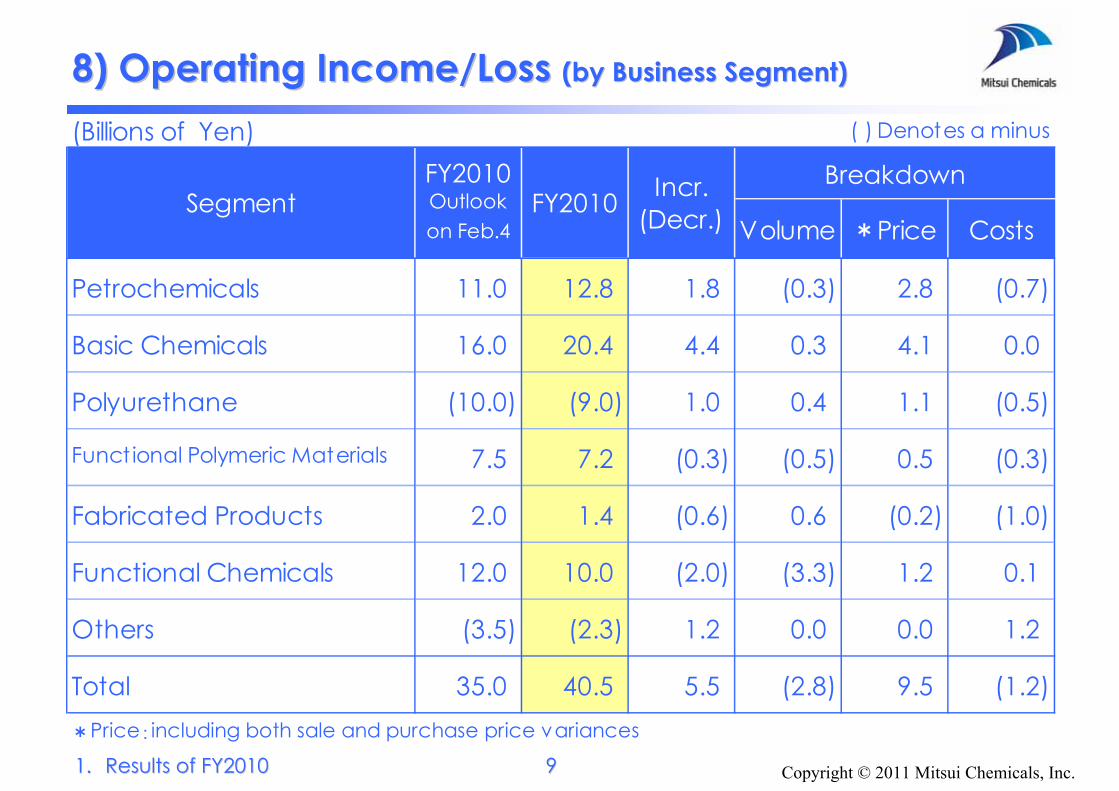
8) Operating Income/Loss 8) Operating Income/Loss (by Business Segment)(by Business Segment)
(Billions of Yen) ( ) Denotes a minus
Breakdown
Volume *Price Costs
Petrochemicals 11.0 12.8 1.8 (0.3) 2.8 (0.7)
Basic Chemicals 16.0 20.4 4.4 0.3 4.1 0.0
Polyurethane (10.0) (9.0) 1.0 0.4 1.1 (0.5)
Functional Polymeric Materials 7.5 7.2 (0.3) (0.5) 0.5 (0.3)
Fabricated Products 2.0 1.4 (0.6) 0.6 (0.2) (1.0)
Functional Chemicals 12.0 10.0 (2.0) (3.3) 1.2 0.1
Others (3.5) (2.3) 1.2 0.0 0.0 1.2
Total 35.0 40.5 5.5 (2.8) 9.5 (1.2)*Price:including both sale and purchase price variances
SegmentFY2010Outlookon Feb.4
FY2010 Incr.(Decr.)
991.1. Results of FY20Results of FY201010
Copyright © 2011 Mitsui Chemicals, Inc.
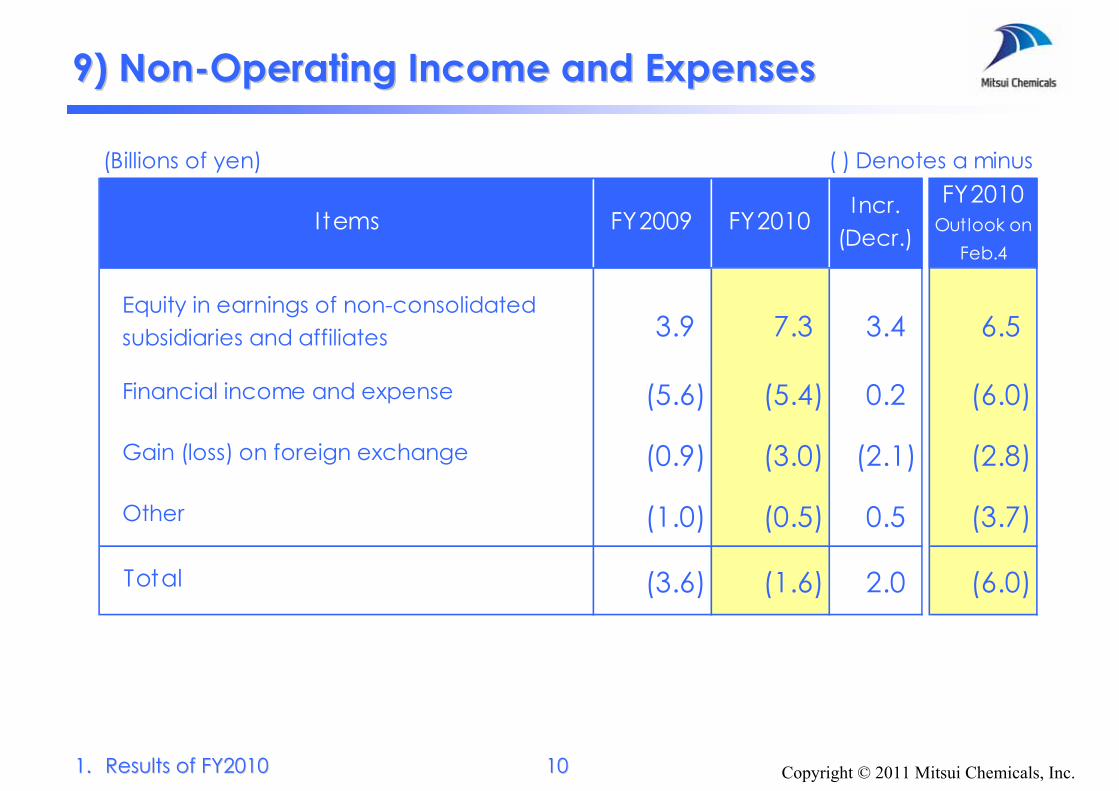
9) Non9) Non--Operating Income and ExpensesOperating Income and Expenses
(Billions of yen) ( ) Denotes a minus
FY2009 FY2010Incr.
(Decr.)
FY2010Outlook on
Feb.4
3.9 7.3 3.4 6.5
(5.6) (5.4) 0.2 (6.0)
(0.9) (3.0) (2.1) (2.8)
Other (1.0) (0.5) 0.5 (3.7)
Total (3.6) (1.6) 2.0 (6.0)
Gain (loss) on foreign exchange
Items
Financial income and expense
Equity in earnings of non-consolidatedsubsidiaries and affiliates
10101.1. Results of FY20Results of FY201010
Copyright © 2011 Mitsui Chemicals, Inc.
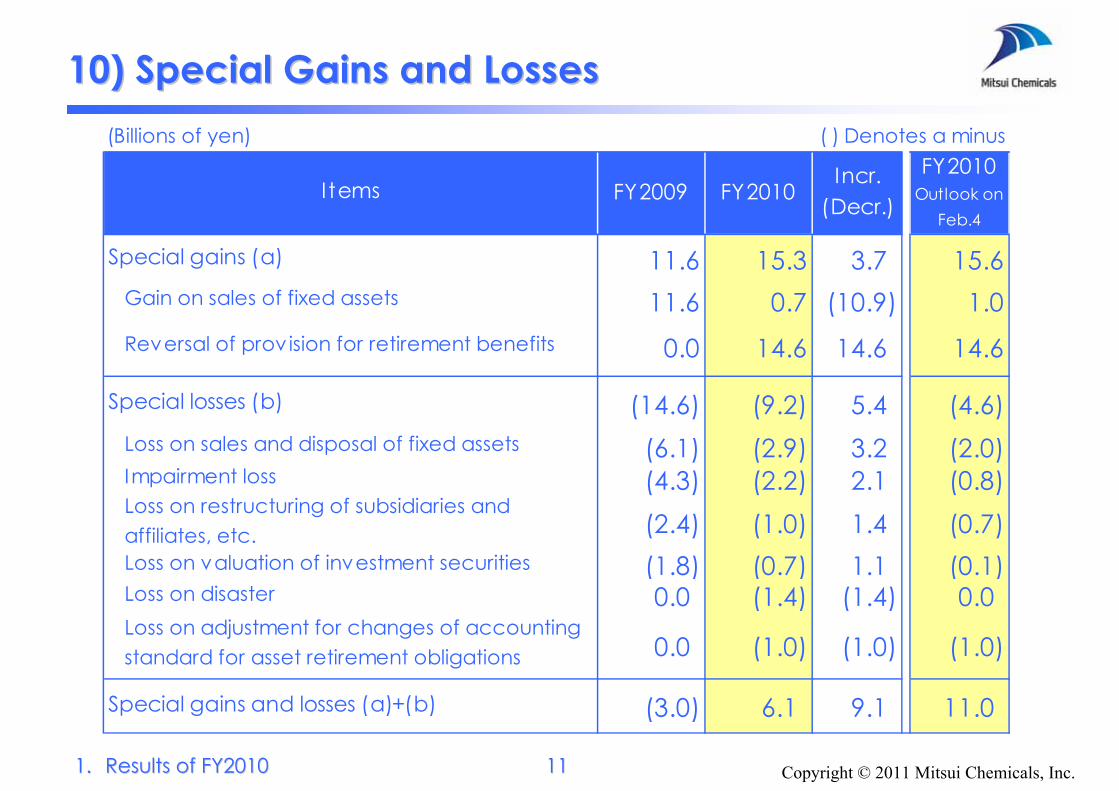
10) Special Gains and Losses10) Special Gains and Losses(Billions of yen) ( ) Denotes a minus
FY2009 FY2010Incr.
(Decr.)
FY2010Outlook on
Feb.4
11.6 15.3 3.7 15.611.6 0.7 (10.9) 1.0
0.0 14.6 14.6 14.6
(14.6) (9.2) 5.4 (4.6)(6.1) (2.9) 3.2 (2.0)(4.3) (2.2) 2.1 (0.8)(2.4) (1.0) 1.4 (0.7)(1.8) (0.7) 1.1 (0.1)0.0 (1.4) (1.4) 0.0
0.0 (1.0) (1.0) (1.0)
Special gains and losses (a)+(b) (3.0) 6.1 9.1 11.0
Items
Special gains (a)
Reversal of prov ision for retirement benefits
Gain on sales of fixed assets
Special losses (b)
Loss on restructuring of subsidiaries andaffiliates, etc.
Loss on sales and disposal of fixed assetsImpairment loss
Loss on valuation of investment securities
Loss on adjustment for changes of accountingstandard for asset retirement obligations
Loss on disaster
11111.1. Results of FY20Results of FY201010
Copyright © 2011 Mitsui Chemicals, Inc.
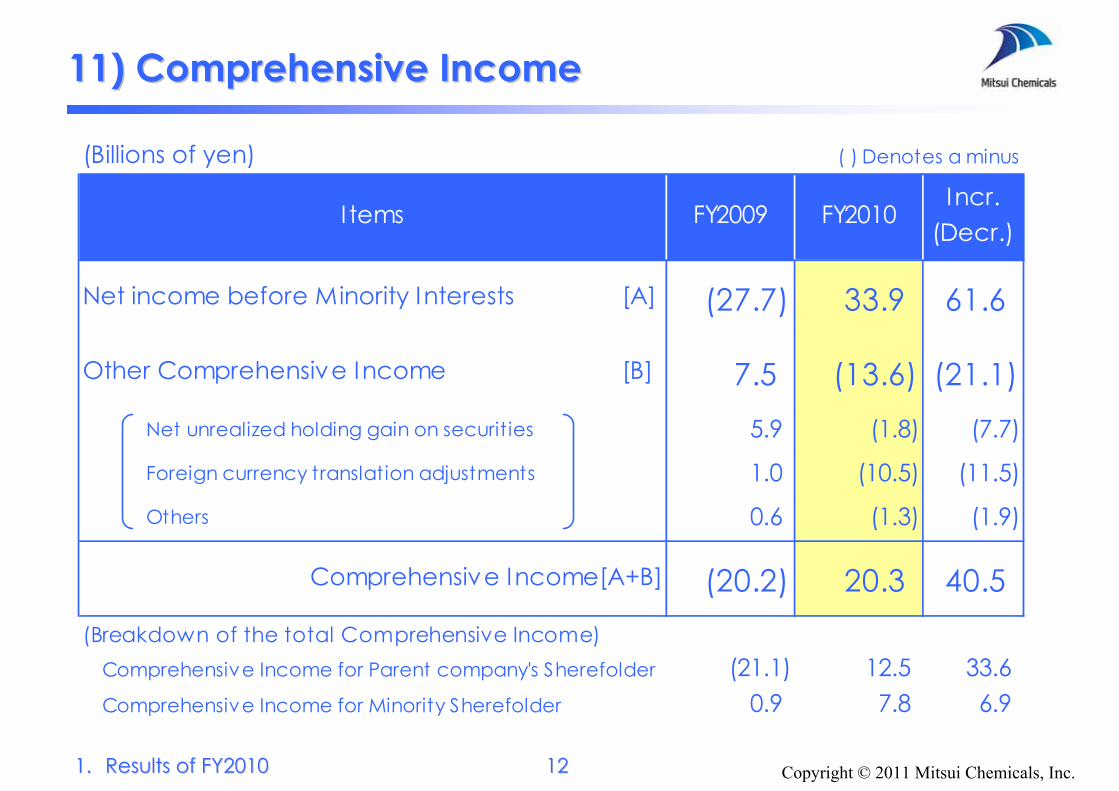
11) Comprehensive Income11) Comprehensive Income
(Billions of yen) ( ) Denotes a minus
I tems FY2009 FY2010Incr.
(Decr.)
Net income before Minority Interests [A] (27.7) 33.9 61.6
Other Comprehensive Income [B] 7.5 (13.6) (21.1) Net unrealized holding gain on securities 5.9 (1.8) (7.7)
Foreign currency translation adjustments 1.0 (10.5) (11.5)
Others 0.6 (1.3) (1.9)
Comprehensive Income[A+B] (20.2) 20.3 40.5(Breakdown of the total Comprehensive Income) Comprehensive Income for Parent company's Sherefolder (21.1) 12.5 33.6 Comprehensive Income for Minority Sherefolder 0.9 7.8 6.9
1.1. Results of FY20Results of FY201010 1212
Copyright © 2011 Mitsui Chemicals, Inc.
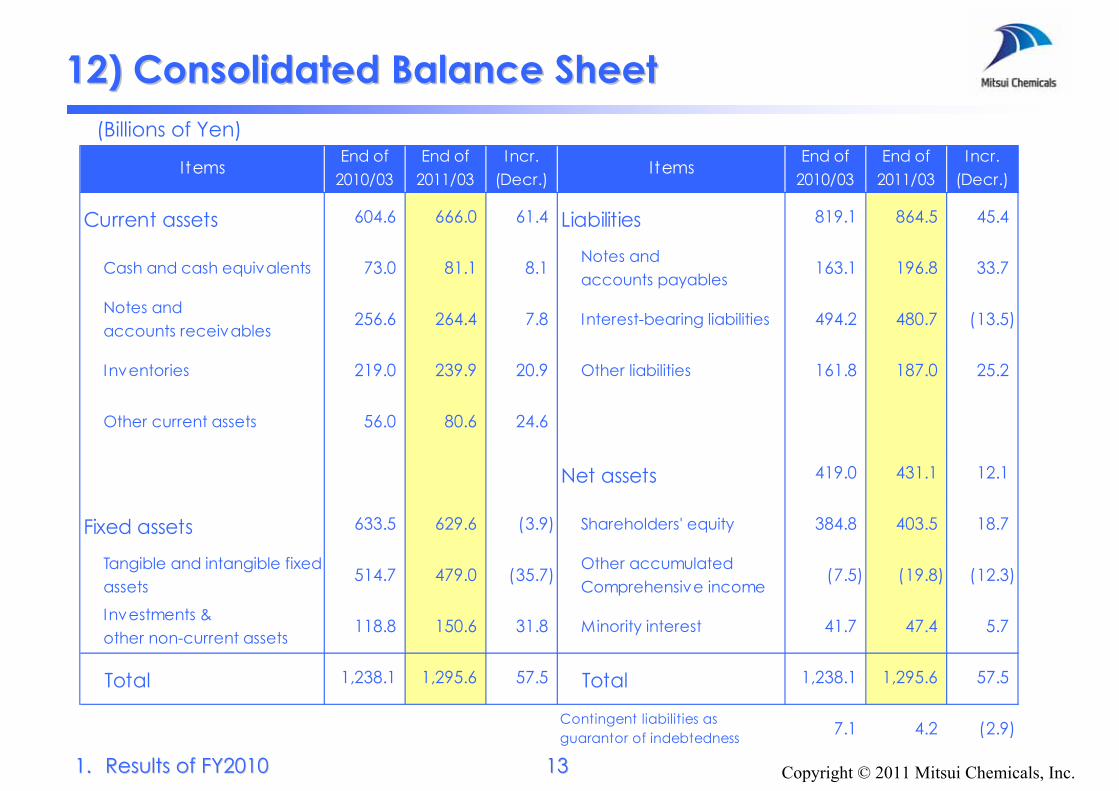
12) Consolidated Balance Sheet12) Consolidated Balance Sheet
ItemsEnd of
2010/03End of
2011/03Incr.
(Decr.)Items
End of2010/03
End of2011/03
Incr.(Decr.)
Current assets 604.6 666.0 61.4 Liabilities 819.1 864.5 45.4
Cash and cash equivalents 73.0 81.1 8.1Notes andaccounts payables
163.1 196.8 33.7
Notes andaccounts receivables
256.6 264.4 7.8 Interest-bearing liabilities 494.2 480.7 (13.5)
Inventories 219.0 239.9 20.9 Other liabilities 161.8 187.0 25.2
Other current assets 56.0 80.6 24.6
Net assets 419.0 431.1 12.1
Fixed assets 633.5 629.6 (3.9) Shareholders' equity 384.8 403.5 18.7
Tangible and intangible fixedassets
514.7 479.0 (35.7)Other accumulatedComprehensive income
(7.5) (19.8) (12.3)
Investments &other non-current assets
118.8 150.6 31.8 Minority interest 41.7 47.4 5.7
Total 1,238.1 1,295.6 57.5 Total 1,238.1 1,295.6 57.5
7.1 4.2 (2.9)Contingent liabilities asguarantor of indebtedness
(Billions of Yen)
13131.1. Results of FY20Results of FY201010
Copyright © 2011 Mitsui Chemicals, Inc.
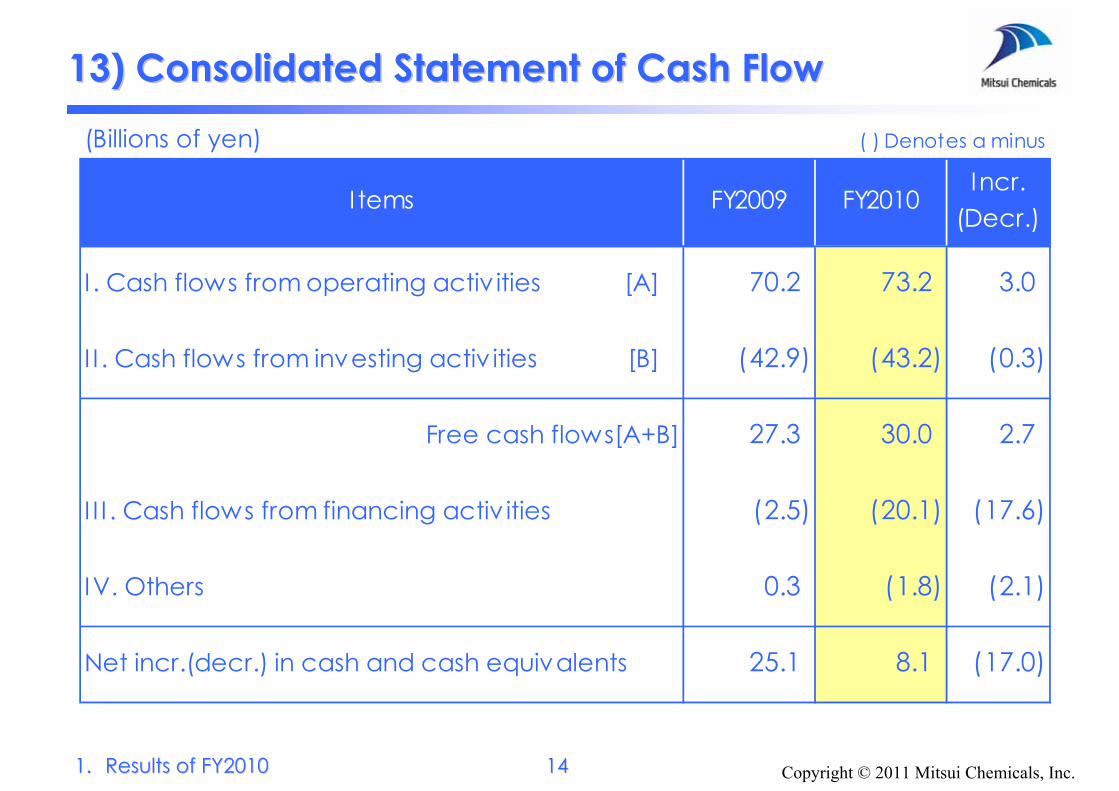
13) Consolidated Statement of Cash Flow13) Consolidated Statement of Cash Flow(Billions of yen) ( ) Denotes a minus
I tems FY2009 FY2010Incr.
(Decr.)
I . Cash flows from operating activ ities [A] 70.2 73.2 3.0
I I . Cash flows from investing activ ities [B] (42.9) (43.2) (0.3)
Free cash flows[A+B] 27.3 30.0 2.7
I I I . Cash flows from financing activ ities (2.5) (20.1) (17.6)
IV. Others 0.3 (1.8) (2.1)
Net incr.(decr.) in cash and cash equivalents 25.1 8.1 (17.0)
14141.1. Results of FY20Results of FY201010

Copyright © 2011 Mitsui Chemicals, Inc.
Copyright © 2011 Mitsui Chemicals, Inc.
2. Outlook for FY20112. Outlook for FY2011(April 1, 2011 (April 1, 2011 –– March 31, 2012)March 31, 2012)
This summary contains forward-looking statements about the future plans, strategies, belief and performance of the Mitsui Chemicals Group as a whole and its individual consolidated companies. These forward-looking statements are not historical facts. They are expectations, estimates, forecasts and projections based on information currently available to the Mitsui Chemicals Group and are subject to a number of risks, uncertainties and assumptions, which, without limitation, include economic trends, fluctuations in foreign currency exchange rates, fluctuations in the price of raw materials, competition in markets where the Company is active, personal consumption, market demand, the tax system and other legislation. As such, actual results may differ materially from those projected and the Mitsui Chemicals Group cannot guarantee that these forward-looking statements are accurate or will be achieved.
Copyright © 2011 Mitsui Chemicals, Inc.
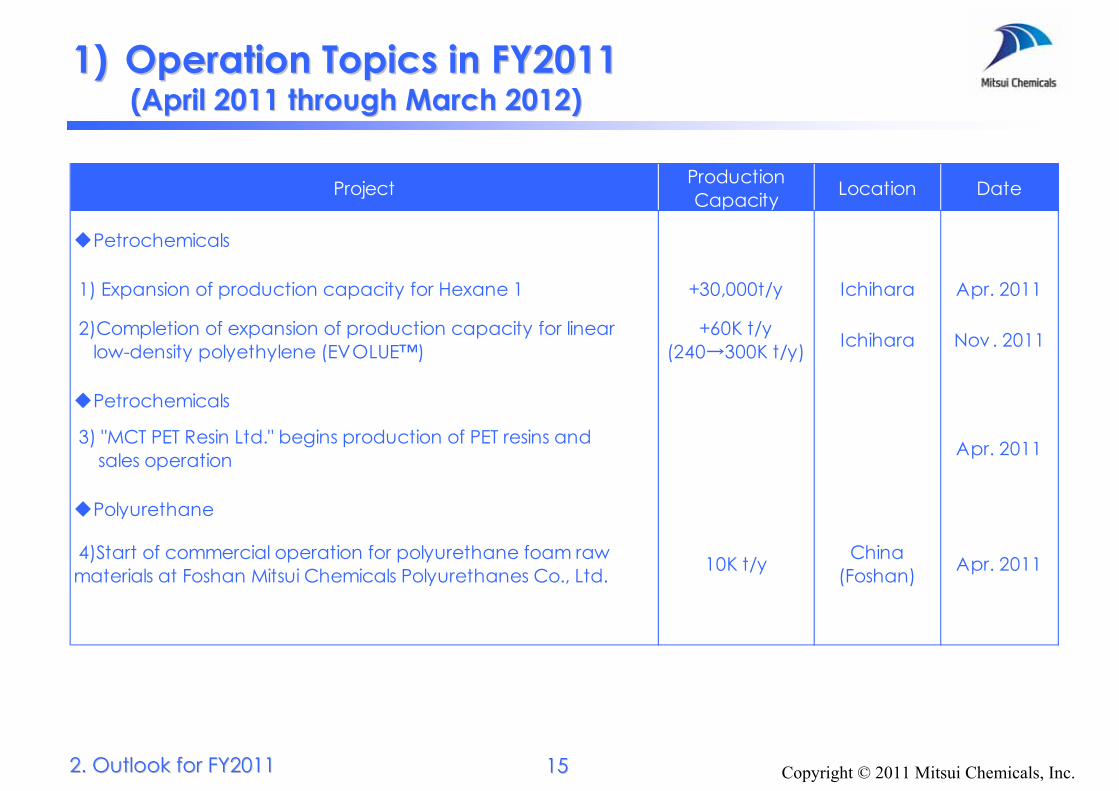
1)1) Operation Topics in FY201Operation Topics in FY20111((AprilApril 2011 through March 2012011 through March 20122))
2. Outlook for FY20112. Outlook for FY2011
Project ProductionCapacity Location Date
◆Petrochemicals
1) Expansion of production capacity for Hexane 1 +30,000t/y Ichihara Apr. 2011
2)Completion of expansion of production capacity for linear low-density polyethylene (EVOLUE™)
+60K t/y(240→300K t/y) Ichihara Nov. 2011
◆Petrochemicals
3) "MCT PET Resin Ltd." begins production of PET resins and sales operation Apr. 2011
◆Polyurethane
4)Start of commercial operation for polyurethane foam rawmaterials at Foshan Mitsui Chemicals Polyurethanes Co., Ltd. 10K t/y China
(Foshan) Apr. 2011
1515

Copyright © 2011 Mitsui Chemicals, Inc.
1)1) Operation Topics in FY201Operation Topics in FY20111((AprilApril 2011 through March 2012011 through March 20122))
2. Outlook for FY20112. Outlook for FY2011
Project ProductionCapacity Location Date
◆Functional polymeric materials
5) Completion of expansion of production capacity of ultra high molecular weight polyethylene (HI-ZEX MILLION™)
+2,500 t/y(5,000→7,500t/y) Iwakuni Jun. 2011
6) Establishment for joint company of EPT in China China(Shanghai)
2nd Half2011
◆Fabricated Products
7) Transfer of ICROS TAPE™ business to Mitsui Chemicals Tohcello ,Inc. Apr.2011
8)Establishment of Joint Venture Company for Solar Cell Encapsulants (SOLAR EVA™)
Malaysia(Malacca) Apr.2011
◆Functional Chemicals
9)Acquisition of all ACOMON AG (ACOMON) shares (manufacturer and distributor of monomers for optical lenses)
Switzerland(Zug)
Apr. 2011
1166

Copyright © 2011 Mitsui Chemicals, Inc.
2) Consolidated Financial Highlights 2) Consolidated Financial Highlights (Billions of yen) ( ) Denotes a minus
1st Half Full Year 1st Half Full Year 1st Half Full Year
Sales 672.8 1,391.7 740.0 1,550.0 67.2 158.3
Operating income (loss) 17.4 40.5 19.0 45.0 1.6 4.5
Non-operating income (expenses) (2.8) (1.6) (2.0) (2.0) 0.8 (0.4)
Ordinary income (loss) 14.6 38.9 17.0 43.0 2.4 4.1
Special gains/losses 11.0 6.1 (2.0) (2.0) (13.0) (8.1)
Net income (loss) before income taxesand minority interests 25.6 45.0 15.0 41.0 (10.6) (4.0)
Net income (loss) 17.1 24.9 6.0 21.0 (11.1) (3.9)
Exchange Rate (Yen/US$) 89 86 85 85 △4 △1Domestic Standard Naphtha Price (Yen/KL)
46,200 47,500 62,000 62,000 15,800 14,500
Items FY2010 FY2011 OutlookIncrease
(Decrease)
1st Half Full Year 1st Half Full Year 1st Half Full Year
Dividend (Yen /Share) 3.0 6.0 3.0 6.0 - -
FY2011 OutlookItems
FY2010 Incr.(Decr.)
2. Outlook for FY2012. Outlook for FY20111 1717
Copyright © 2011 Mitsui Chemicals, Inc.
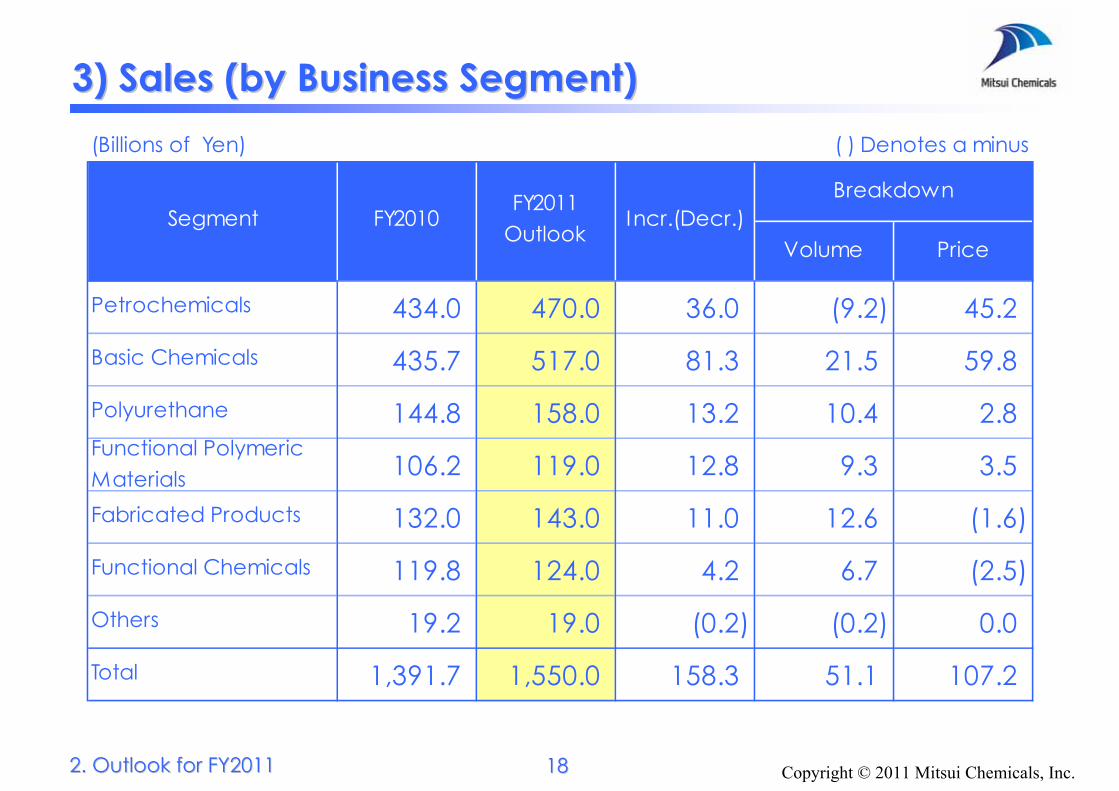
3) Sales (by Business Segment)3) Sales (by Business Segment)(Billions of Yen) ( ) Denotes a minus
Breakdown
Volume Price
Petrochemicals 434.0 470.0 36.0 (9.2) 45.2
Basic Chemicals 435.7 517.0 81.3 21.5 59.8
Polyurethane 144.8 158.0 13.2 10.4 2.8Functional PolymericMaterials 106.2 119.0 12.8 9.3 3.5
Fabricated Products 132.0 143.0 11.0 12.6 (1.6)
Functional Chemicals 119.8 124.0 4.2 6.7 (2.5)
Others 19.2 19.0 (0.2) (0.2) 0.0
Total 1,391.7 1,550.0 158.3 51.1 107.2
Segment FY2010FY2011
OutlookIncr.(Decr.)
2. Outlook for FY2012. Outlook for FY20111 1818
Copyright © 2011 Mitsui Chemicals, Inc.
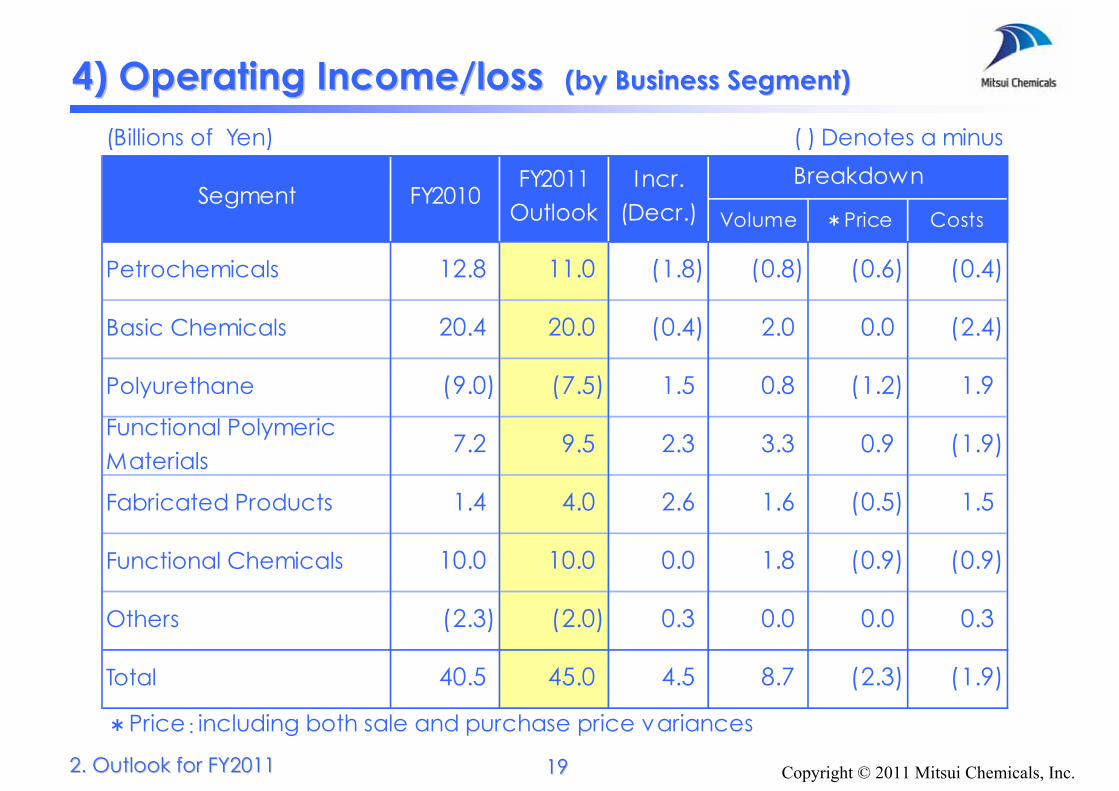
4) Operating Income/loss 4) Operating Income/loss (by Business Segment)(by Business Segment)
(Billions of Yen) ( ) Denotes a minusBreakdown
Volume *Price Costs
Petrochemicals 12.8 11.0 (1.8) (0.8) (0.6) (0.4)
Basic Chemicals 20.4 20.0 (0.4) 2.0 0.0 (2.4)
Polyurethane (9.0) (7.5) 1.5 0.8 (1.2) 1.9Functional PolymericMaterials
7.2 9.5 2.3 3.3 0.9 (1.9)
Fabricated Products 1.4 4.0 2.6 1.6 (0.5) 1.5
Functional Chemicals 10.0 10.0 0.0 1.8 (0.9) (0.9)
Others (2.3) (2.0) 0.3 0.0 0.0 0.3
Total 40.5 45.0 4.5 8.7 (2.3) (1.9)
*Price:including both sale and purchase price variances
SegmentIncr.
(Decr.)FY2010
FY2011Outlook
19192. Outlook for FY20112. Outlook for FY2011

Copyright © 2011 Mitsui Chemicals, Inc.
5) Non5) Non--Operating Income and ExpensesOperating Income and Expenses
(Billions of yen) ( ) Denotes a minus
FY2010 FY2011Outlook
Incr.(Decr.)
7.3 7.0 (0.3)
(5.4) (6.0) (0.6)
(3.0) 0.0 3.0
Other (0.5) (3.0) (2.5)
Total (1.6) (2.0) (0.4)
Items
Gain (loss) on foreign exchange
Financial income and expense
Equity in earnings of non-consolidatedsubsidiaries and affiliates
22002. Outlook for FY20112. Outlook for FY2011
Copyright © 2011 Mitsui Chemicals, Inc.
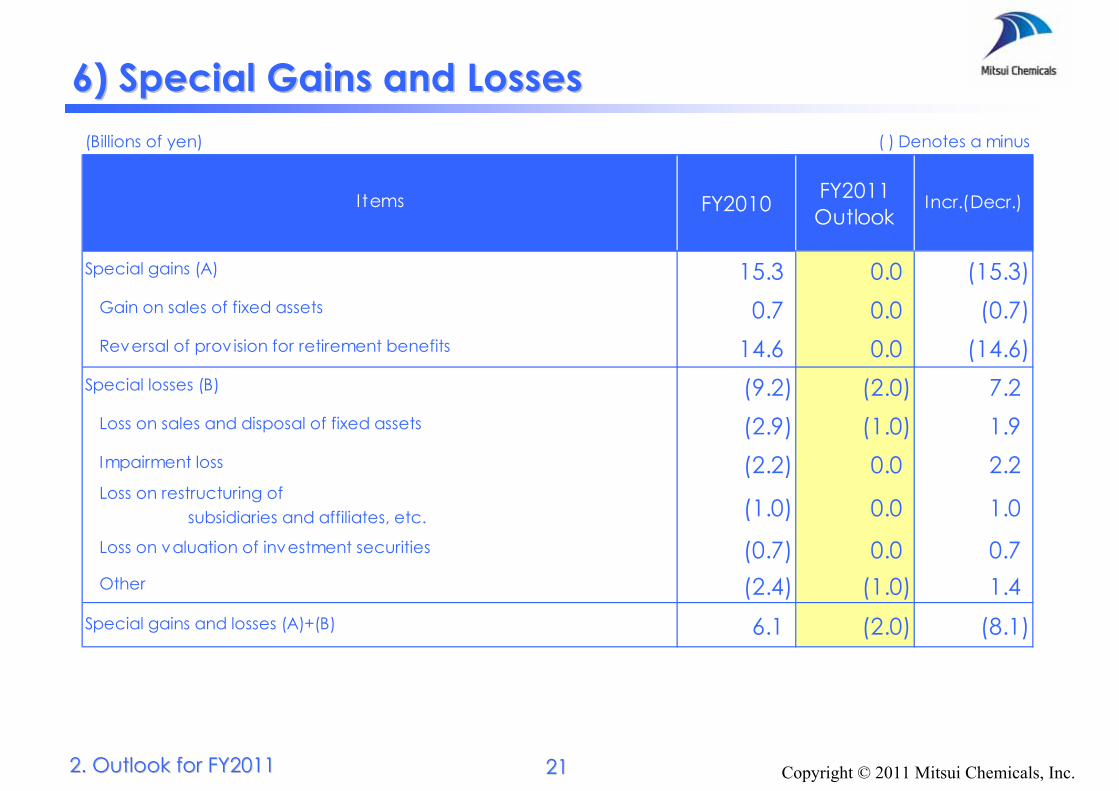
6) Special Gains and Losses6) Special Gains and Losses(Billions of yen) ( ) Denotes a minus
FY2010 FY2011Outlook
Incr.(Decr.)
15.3 0.0 (15.3)0.7 0.0 (0.7)
14.6 0.0 (14.6)(9.2) (2.0) 7.2(2.9) (1.0) 1.9(2.2) 0.0 2.2
(1.0) 0.0 1.0
(0.7) 0.0 0.7Other (2.4) (1.0) 1.4
Special gains and losses (A)+(B) 6.1 (2.0) (8.1)
Special losses (B)
Loss on restructuring of subsidiaries and affiliates, etc.
Loss on sales and disposal of fixed assets
Impairment loss
Loss on valuation of investment securities
Gain on sales of fixed assets
Items
Special gains (A)
Reversal of prov ision for retirement benefits
22112. Outlook for FY20112. Outlook for FY2011
Copyright © 2011 Mitsui Chemicals, Inc.
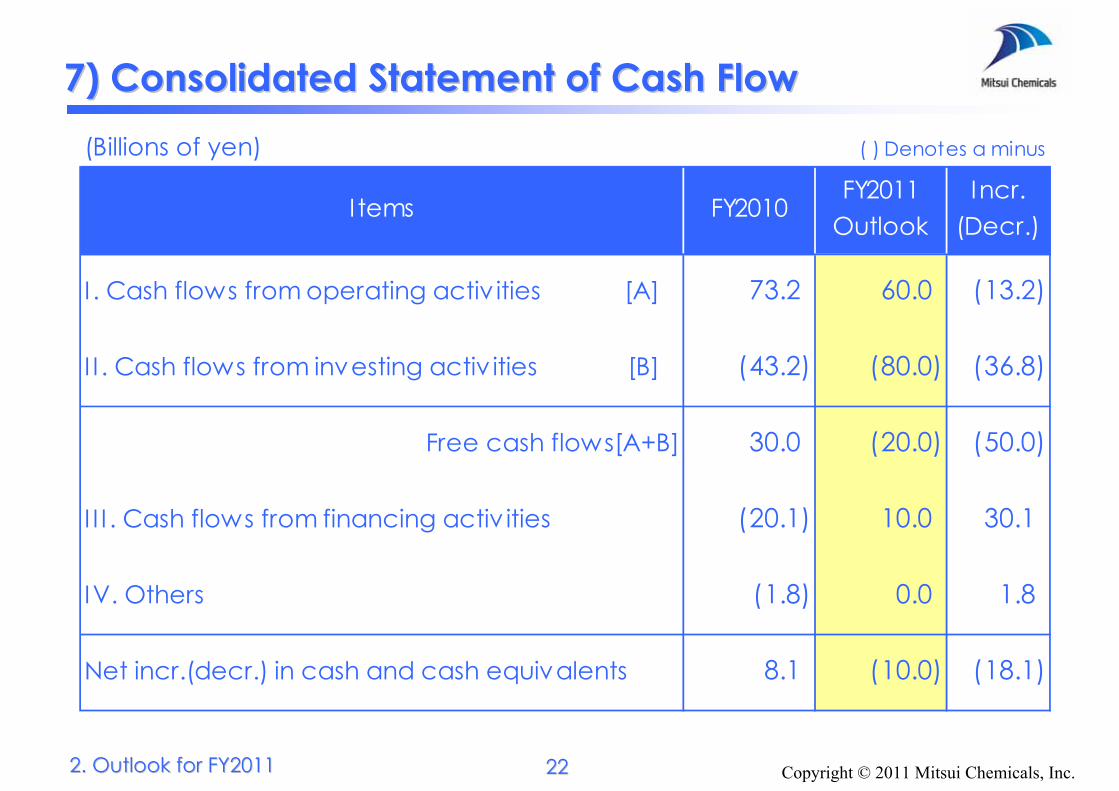
7) Consolidated Statement of Cash Flow7) Consolidated Statement of Cash Flow
2222
(Billions of yen) ( ) Denotes a minus
I tems FY2010FY2011
OutlookIncr.
(Decr.)
I . Cash flows from operating activ ities [A] 73.2 60.0 (13.2)
I I . Cash flows from investing activ ities [B] (43.2) (80.0) (36.8)
Free cash flows[A+B] 30.0 (20.0) (50.0)
I I I . Cash flows from financing activ ities (20.1) 10.0 30.1
IV. Others (1.8) 0.0 1.8
Net incr.(decr.) in cash and cash equivalents 8.1 (10.0) (18.1)
2. Outlook for FY20112. Outlook for FY2011
Copyright © 2011 Mitsui Chemicals, Inc.
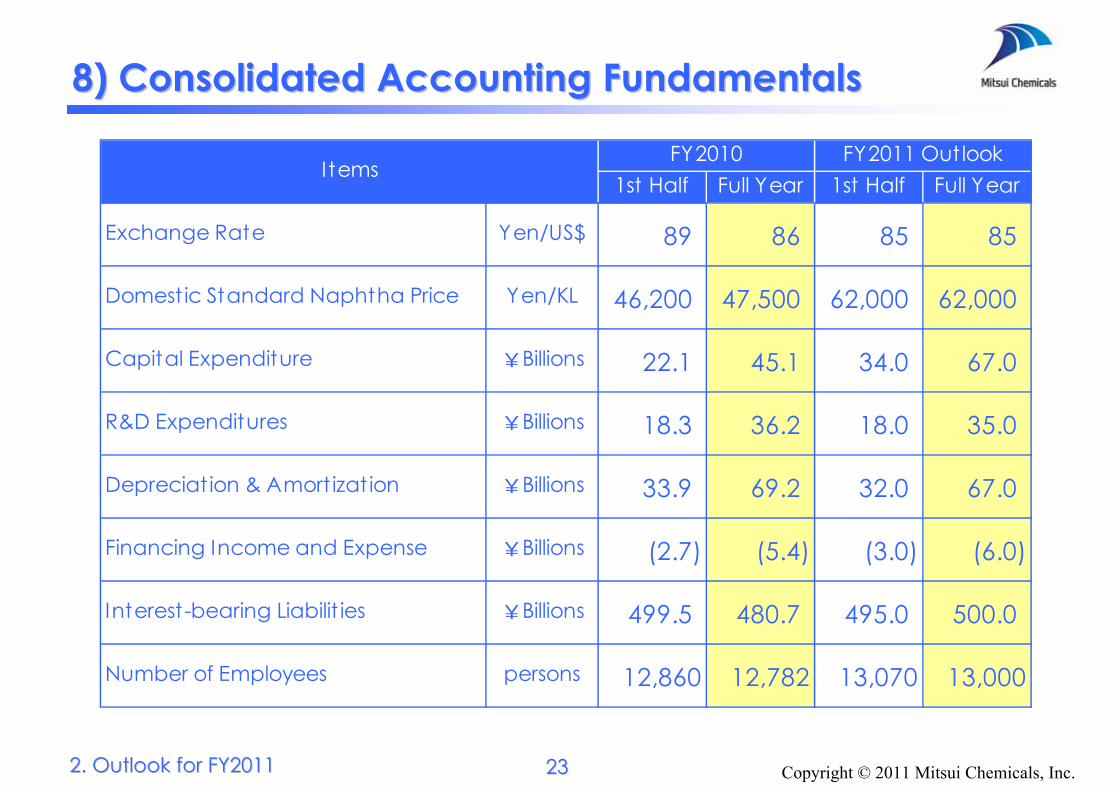
8) Consolidated Accounting Fundamentals8) Consolidated Accounting Fundamentals
1st Half Full Year 1st Half Full Year
Exchange Rate Yen/US$ 89 86 85 85
Domest ic Standard Naphtha Price Yen/KL 46,200 47,500 62,000 62,000
¥Billions 22.1 45.1 34.0 67.0
R&D Expenditures ¥Billions 18.3 36.2 18.0 35.0
Depreciat ion & Amort izat ion ¥Billions 33.9 69.2 32.0 67.0
Financing Income and Expense ¥Billions (2.7) (5.4) (3.0) (6.0)
Interest-bearing Liabilit ies ¥Billions 499.5 480.7 495.0 500.0
Number of Employees persons 12,860 12,782 13,070 13,000
Capital Expenditure
FY2011 OutlookItems
FY2010
23232. Outlook for FY20112. Outlook for FY2011
Copyright © 2011 Mitsui Chemicals, Inc.
3. Appendix3. Appendix
Copyright © 2011 Mitsui Chemicals, Inc.
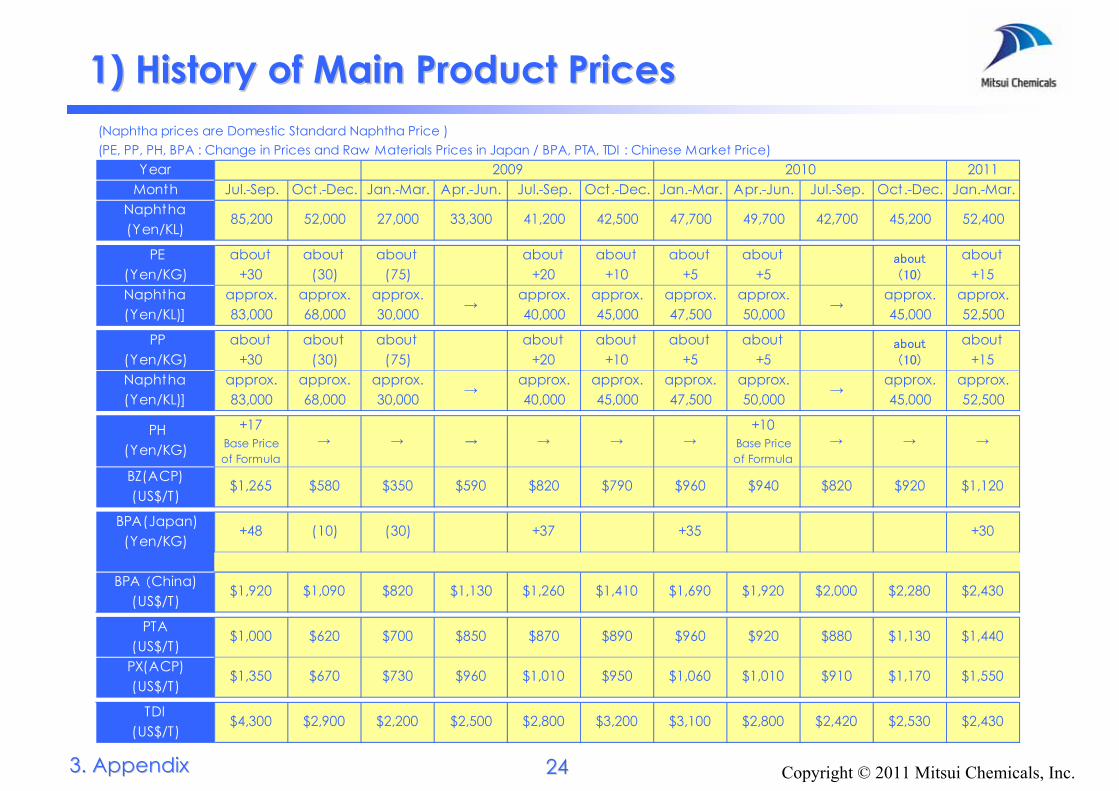
1) History of Main Product Prices1) History of Main Product Prices(Naphtha prices are Domestic Standard Naphtha Price )(PE, PP, PH, BPA : Change in Prices and Raw Materials Prices in Japan / BPA, PTA, TDI : Chinese Market Price)
Year 2009 2010 2011Month Jul.-Sep. Oct.-Dec. Jan.-Mar. Apr.-Jun. Jul.-Sep. Oct.-Dec. Jan.-Mar. Apr.-Jun. Jul.-Sep. Oct.-Dec. Jan.-Mar.
Naphtha(Yen/KL)
85,200 52,000 27,000 33,300 41,200 42,500 47,700 49,700 42,700 45,200 52,400
PE(Yen/KG)
about+30
about(30)
about(75)
about+20
about+10
about+5
about+5
about(10)
about+15
Naphtha(Yen/KL)]
approx.83,000
approx.68,000
approx.30,000
→approx.40,000
approx.45,000
approx.47,500
approx.50,000
→approx.45,000
approx.52,500
PP(Yen/KG)
about+30
about(30)
about(75)
about+20
about+10
about+5
about+5
about(10)
about+15
Naphtha(Yen/KL)]
approx.83,000
approx.68,000
approx.30,000
→approx.40,000
approx.45,000
approx.47,500
approx.50,000
→approx.45,000
approx.52,500
PH(Yen/KG)
+17Base Priceof Formula
→ → → → → →+10
Base Priceof Formula
→ → →
BZ(ACP)(US$/T)
$1,265 $580 $350 $590 $820 $790 $960 $940 $820 $920 $1,120
BPA(Japan)(Yen/KG)
+48 (10) (30) +37 +35 +30
BPA (China)(US$/T)
$1,920 $1,090 $820 $1,130 $1,260 $1,410 $1,690 $1,920 $2,000 $2,280 $2,430
PTA(US$/T)
$1,000 $620 $700 $850 $870 $890 $960 $920 $880 $1,130 $1,440
PX(ACP)(US$/T)
$1,350 $670 $730 $960 $1,010 $950 $1,060 $1,010 $910 $1,170 $1,550
TDI(US$/T)
$4,300 $2,900 $2,200 $2,500 $2,800 $3,200 $3,100 $2,800 $2,420 $2,530 $2,430
3. Appendix3. Appendix 2424
Copyright © 2011 Mitsui Chemicals, Inc.
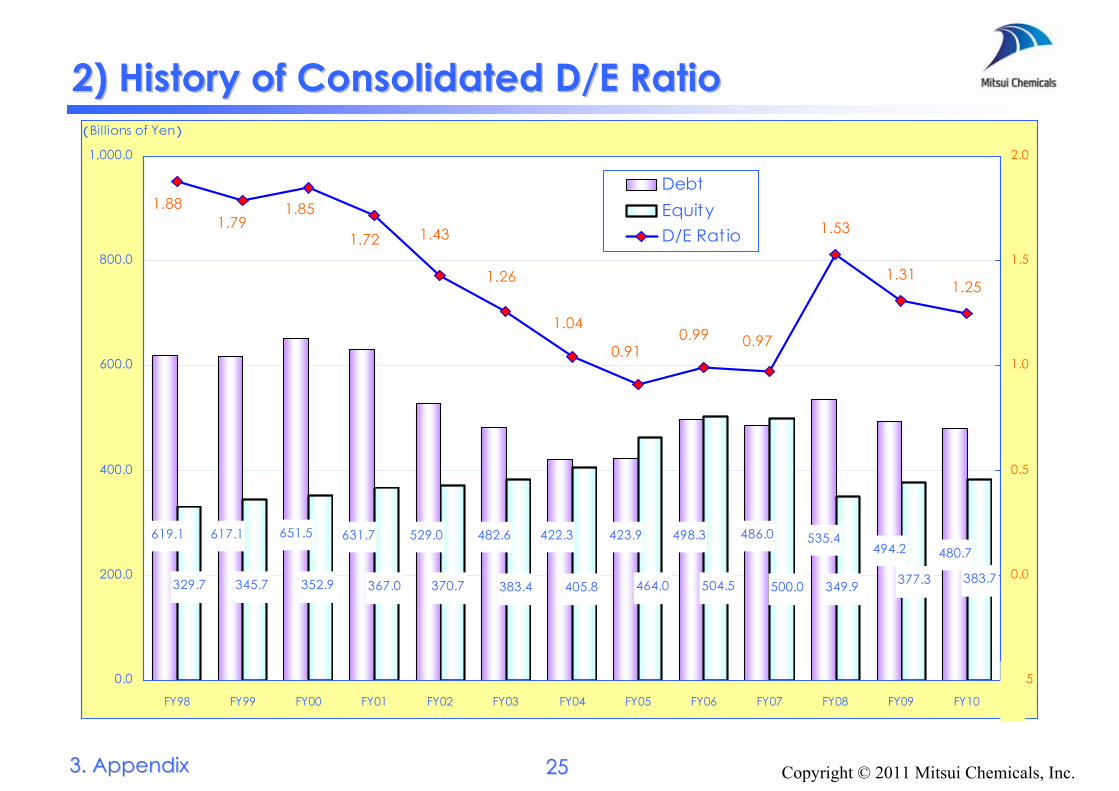
535.4494.2
377.3
480.7617.1 529.0631.7651.5 486.0498.3482.6 422.3 423.9619.1
383.7349.9352.9345.7329.7 367.0 370.7 383.4 500.0504.5405.8 464.0
1.53
1.311.25
0.970.99
1.26
1.04
0.91
1.72
1.881.79
1.85
1.43
0.0
200.0
400.0
600.0
800.0
1,000.0
FY98 FY99 FY00 FY01 FY02 FY03 FY04 FY05 FY06 FY07 FY08 FY09 FY10
(Billions of Yen)
-0.5
0.0
0.5
1.0
1.5
2.0
DebtEquityD/E Rat io
2) History of Consolidated D/E Ratio2) History of Consolidated D/E Ratio
3. Appendix3. Appendix 2525

Copyright © 2011 Mitsui Chemicals, Inc.
3) Main Subsidiaries and Affiliates3) Main Subsidiaries and Affiliates
3. Appendix3. Appendix 2626
Operating Income
FY2010FY2011
Outlook Subsidiaries % Billions of Yen
Prime Polymer Billions of Yen 20 65.0 280 gain
Osaka Petrochemical Industries Billions of Yen 5 100.0 120 gain
Mitsui Chemicals America Millions of USD 156 100.0 70 gain
Siam Mitsui PTA Millions of BAHT 4,800 50.02 120 gain
Mitsui Phenols Singapore Millions of USD 120 95.0 60 gain
Mitsui Elastomers Singapore Millions of USD 96 100.0 40 gain
Mitsui Chemicals Agro, Inc. Billions of Yen 0.35 100.0 40 gain
Mitsui Chemicals Tohcello, Inc. * Billions of Yen 3.45 100.0 70 gain
(formerly TOHCELLO CO., LTD. )
AffiliatesDU PONT-Mitsui Polychemicals Billions of Yen 6.48 50.0 40 gainAmoco Mitsui PTA Indonesia Millions of USD 160 45.0 40 gain
Operating Income:
"→" represents "no change", or a gain/loss under 500 million yen compared to FY2010.
I temOur
share
Salesamount(FY2010)
Common stock
*transfer of film/sheet business from "Mitsui Chemical Fabro, Inc." in 2nd half FY2010
Copyright © 2011 Mitsui Chemicals, Inc.
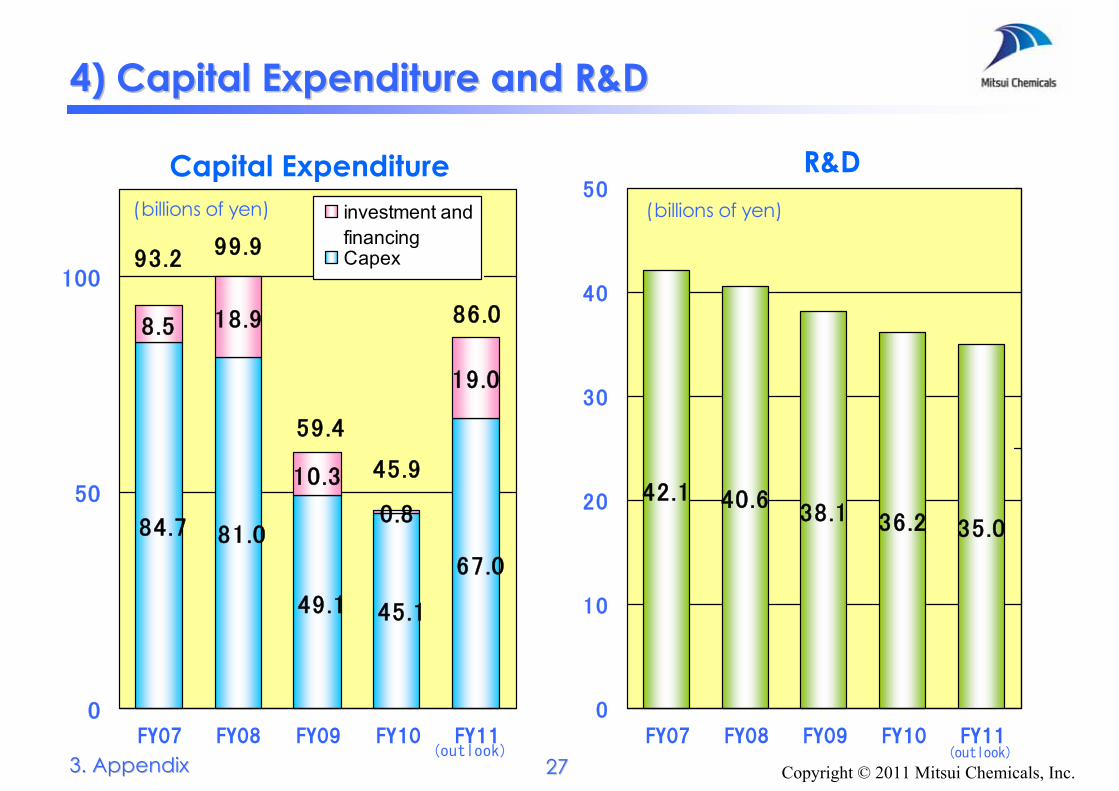
8.5 18.9
0.8
19.0
84.7 81.0
49.1 45.1
67.0
10.3
0
50
100
FY07 FY08 FY09 FY10 FY11
investment andfinancingCapex
(billions of yen)
99.993.2
59.4
45.9
86.0
(outlook)
R&DCapital Expenditure
42.1 40.638.1 36.2 35.0
0
10
20
30
40
50
FY07 FY08 FY09 FY10 FY11
(billions of yen)
(outlook)
4) Capital Expenditure and R&D4) Capital Expenditure and R&D
3. Appendix3. Appendix 2277
Copyright © 2011 Mitsui Chemicals, Inc.
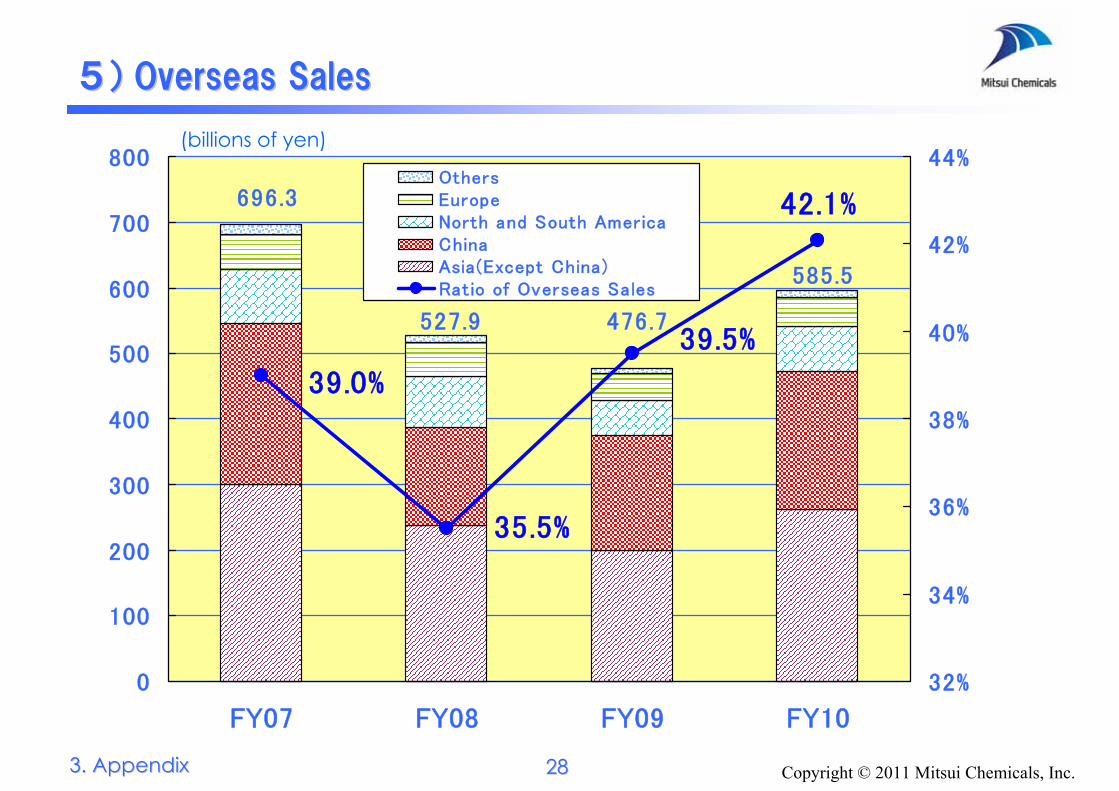
39.0%
35.5%
39.5%
42.1%
0
100
200
300
400
500
600
700
800
FY07 FY08 FY09 FY10
32%
34%
36%
38%
40%
42%
44%OthersEuropeNorth and South AmericaChinaAsia(Except China)Ratio of Overseas Sales
696.3
527.9 476.7
585.5
55)) Overseas SalesOverseas Sales
(billions of yen)
3. Appendix3. Appendix 2288


