Download - FINANCIAL HIGHLIGHTS - LCEC

NATURAL GAS
COAL
RENEWABLE
OIL
2009 2010 2011
US COOPERATIVES FL COOPERATIVES LARGE COOPERATIVES LCEC
WE DELIVER
2012 SUSTAINABILITY REPORT
RISK MANAGEMENTAn important aspect of governance, shared by the Board of Trustees and LCEC’s leadership team, is preparing for and mitigating business risk. LCEC regularly assess-es enterprise risk within its Integrated Business Planning process to identify potential events that may affect the organization, manage risk within tolerance levels, and provide reasonable assurance regarding the achievement of corporate objectives. This continual exercise ensures resources are allocated to the most important initia-tives from stakeholders’ perspectives. Overall, the process is designed to improve per-formance, ensure reliability and competitive rates, and maximize value to customers.
ENTERPRISE RISK MANAGEMENT CYCLE
With a focus on reliability, an ongoing network maintenance plan results in some of the highest reliability results to date.
•••1,228
miles proactively trimmed vegetation
••• 9,594
distribution circuit maintenance tasks
••• 472
transmission circuit tasks
••• 48
North American ElectricReliability Corporationindividual transmission reliability requirements
met with zerofindings of non-
compliance and noareas of concern
0
20
40
60
80
100
120
140
160
180
200
2009 2010 2011
Average Minutes of System Interruptions (Excluding Major Storms and Power Supplier Outages)
US Cooperatives FL Cooperatives Large Cooperatives LCEC
Average Minutes of System Interruptions (SAIDI)(excluding major storms and source outages)
GOVERNANCE, ETHICS & COMPLIANCE LCEC is committed to conducting business with a high level of integrity and in an ethi-cal and responsible manner. Board members, elected by customers, demonstrate veracity and principles in their professional and personal lives and contribute to the organization’s diversity in terms of background and business experience. The Board takes great responsibility in setting policy and procedures and maintaining financial strength while supporting employees who run the day-to-day operations of the utility. The 10-member Board represents all walks of life and resides in communities and neighborhoods throughout our service territory. Since 1940, LCEC employees, guided by the Board of Trustees, have made a supreme effort to balance fiscal responsibility with the goal of improving the lives of those whom they serve.
Monitoring InternalEnvironment
ObjectiveSetting
Event Identification
RiskAssessment
Risk Response
ControlActivities
Information andCommunication
NATURAL GAS
COAL
PURCHASED POWER
NUCLEAR
OIL
SOLAR
SEMINOLE’S 2012 ENERGY FUEL MIX
FPL FUEL MIX & PURCHASED POWER
Sources of electricity genera-tion for the 12 months that ended on Nov. 30, 2011
0.06%
47%
46%
6%1%
63.83%
20.12%
9.95%
5.10%
0.94%
POWER SUPPLYLCEC purchases most of its power supply from Seminole Electric Cooperative.In 2010, LCEC began purchasing a portion of its power supply from Florida Power and Light (FPL) and, beginning in 2014, will purchase all of its power from FPL. FPL uses a diverse mix of fuels and is recognized as a clean-energy company, with one of the lowest emissions profiles among U.S. utilities.
http://www.fpl.com/environment/plant/power_plant_projects.shtml
ELECTRIC SYSTEM RISK MITIGATION
STRATEGY
VISION
MISSION
LCEC VALUES…
Delivering the power that energizes our community.
We provide efficient, reliable, cost-competitive electric and emerging energy solutions and quality service to our customers.
… safety as everyone’s responsibility.
… providing quality external and internal customer service.
… commitment to integrity, diversity, and respect.
… employees working together to make success happen.
… accountability for results.
… our responsibility to energize the community.
2012 information will not be available until the following year due to benchmarking timeline.
200
180
160
140
120
100
80
60
40
20
0
http://www.seminole-electric.com
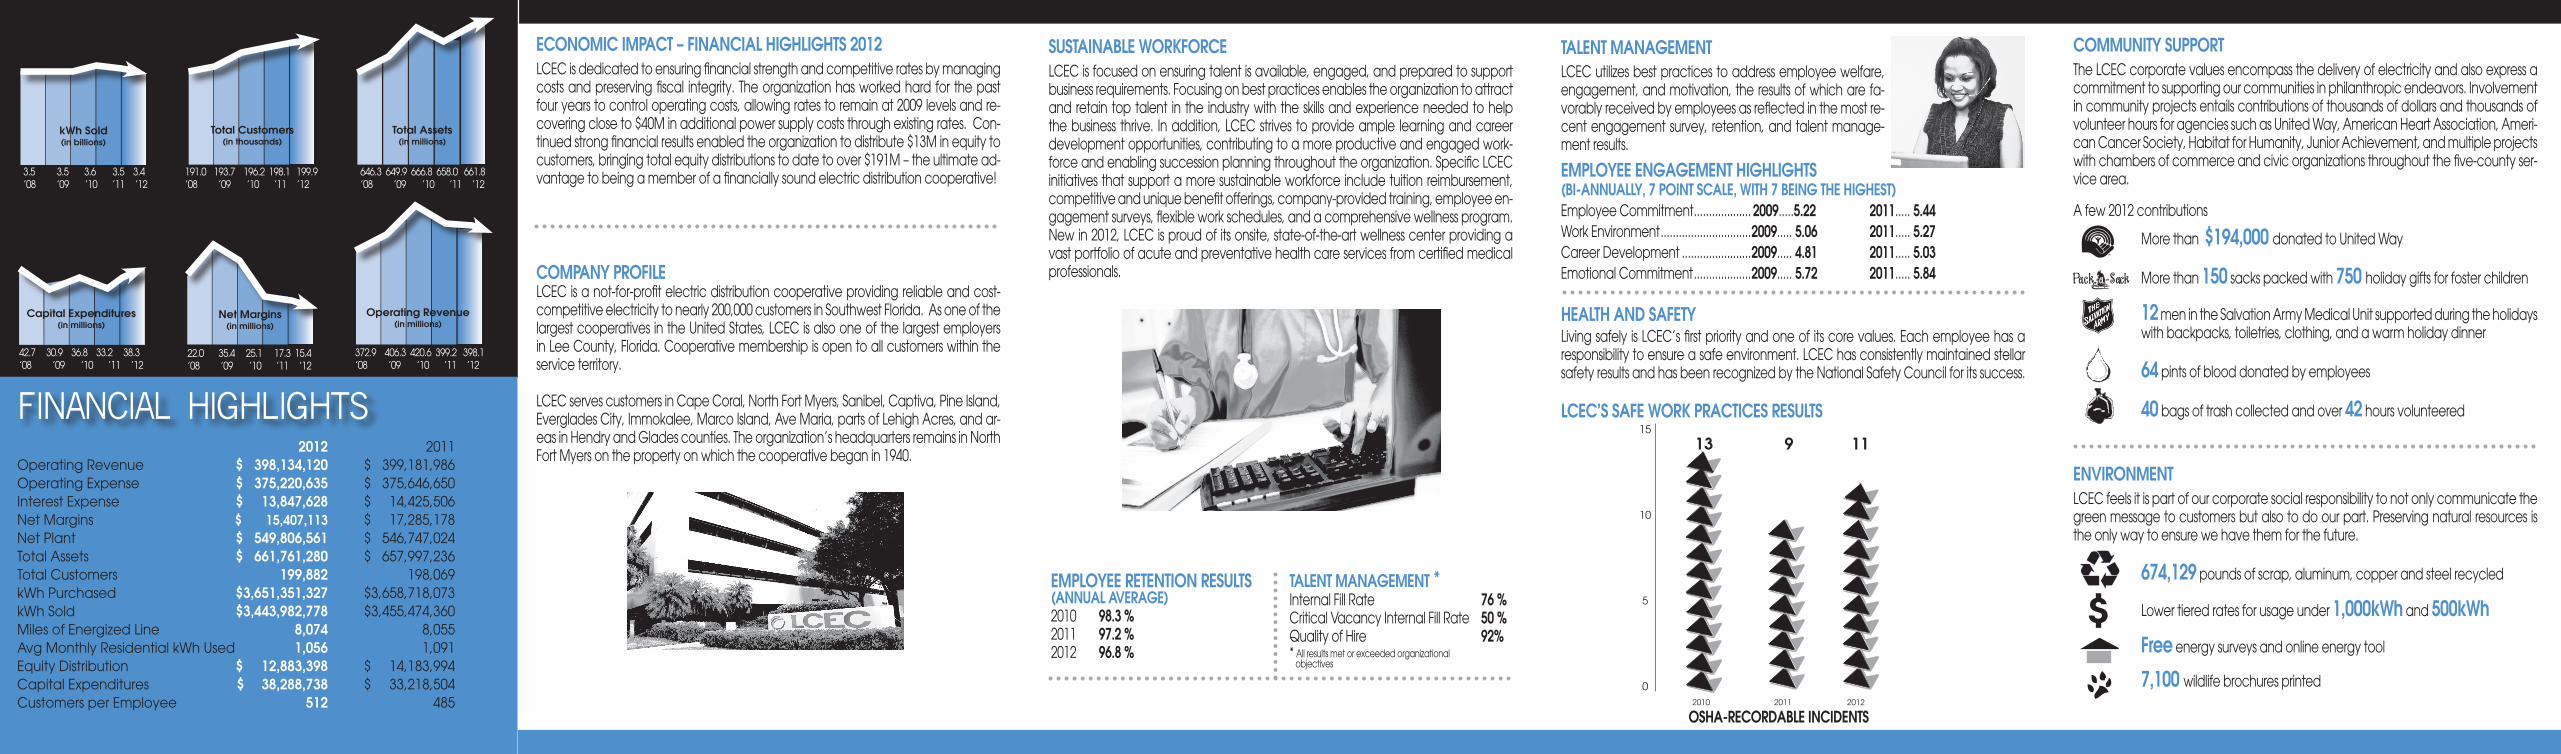
191.0 193.7 196.2 198.1 199.9’08 ’09 ’10 ’11 ’12
22.0 35.4 25.1 17.3 15.4’08 ’09 ’10 ’11 ’12
646.3 649.9 666.8 658.0 661.8’08 ’09 ’10 ’11 ’12
372.9 406.3 420.6 399.2 398.1’08 ’09 ’10 ’11 ’12
3.5 3.5 3.6 3.5 3.4’08 ’09 ’10 ’11 ’12
42.7 30.9 36.8 33.2 38.3’08 ’09 ’10 ’11 ’12
Total Customers(in thousands)
Total Assets(in millions)
kWh Sold(in billions)
Net Margins(in millions)
Operating Revenue(in millions)
Capital Expenditures(in millions)
FINANCIAL HIGHLIGHTS 2012 2011 Operating Revenue $ 398,134,120 $ 399,181,986 Operating Expense $ 375,220,635 $ 375,646,650 Interest Expense $ 13,847,628 $ 14,425,506 Net Margins $ 15,407,113 $ 17,285,178 Net Plant $ 549,806,561 $ 546,747,024 Total Assets $ 661,761,280 $ 657,997,236 Total Customers 199,882 198,069 kWh Purchased $3,651,351,327 $3,658,718,073 kWh Sold $3,443,982,778 $3,455,474,360 Miles of Energized Line 8,074 8,055 Avg Monthly Residential kWh Used 1,056 1,091 Equity Distribution $ 12,883,398 $ 14,183,994 Capital Expenditures $ 38,288,738 $ 33,218,504 Customers per Employee 512 485
COMMUNITY SUPPORTThe LCEC corporate values encompass the delivery of electricity and also express a commitment to supporting our communities in philanthropic endeavors. Involvement in community projects entails contributions of thousands of dollars and thousands of volunteer hours for agencies such as United Way, American Heart Association, Ameri-can Cancer Society, Habitat for Humanity, Junior Achievement, and multiple projects with chambers of commerce and civic organizations throughout the five-county ser-vice area.
A few 2012 contributions
More than $194,000 donated to United Way
More than 150 sacks packed with 750 holiday gifts for foster children
12 men in the Salvation Army Medical Unit supported during the holidayswith backpacks, toiletries, clothing, and a warm holiday dinner
64 pints of blood donated by employees
40 bags of trash collected and over 42 hours volunteered
Pack - a - Sack
ENVIRONMENTLCEC feels it is part of our corporate social responsibility to not only communicate the green message to customers but also to do our part. Preserving natural resources is the only way to ensure we have them for the future.
674,129 pounds of scrap, aluminum, copper and steel recycled
Lower tiered rates for usage under 1,000kWh and 500kWh
Free energy surveys and online energy tool
7,100 wildlife brochures printed2010 2011 2012
13 9 11
OSHA-RECORDABLE INCIDENTS
TALENT MANAGEMENT LCEC utilizes best practices to address employee welfare, engagement, and motivation, the results of which are fa-vorably received by employees as reflected in the most re-cent engagement survey, retention, and talent manage-ment results.
EMPLOYEE ENGAGEMENT HIGHLIGHTS (BI-ANNUALLY, 7 POINT SCALE, WITH 7 BEING THE HIGHEST)Employee Commitment ...................2009.....5.22 2011..... 5.44Work Environment ..............................2009..... 5.06 2011..... 5.27Career Development .......................2009..... 4.81 2011..... 5.03Emotional Commitment ...................2009..... 5.72 2011..... 5.84
HEALTH AND SAFETYLiving safely is LCEC’s first priority and one of its core values. Each employee has a responsibility to ensure a safe environment. LCEC has consistently maintained stellar safety results and has been recognized by the National Safety Council for its success.
LCEC’S SAFE WORK PRACTICES RESULTS
SUSTAINABLE WORKFORCELCEC is focused on ensuring talent is available, engaged, and prepared to support business requirements. Focusing on best practices enables the organization to attract and retain top talent in the industry with the skills and experience needed to help the business thrive. In addition, LCEC strives to provide ample learning and career development opportunities, contributing to a more productive and engaged work-force and enabling succession planning throughout the organization. Specific LCEC initiatives that support a more sustainable workforce include tuition reimbursement, competitive and unique benefit offerings, company-provided training, employee en-gagement surveys, flexible work schedules, and a comprehensive wellness program. New in 2012, LCEC is proud of its onsite, state-of-the-art wellness center providing a vast portfolio of acute and preventative health care services from certified medical professionals.
EMPLOYEE RETENTION RESULTS (ANNUAL AVERAGE)2010 98.3 %2011 97.2 %2012 96.8 %
$
ECONOMIC IMPACT – FINANCIAL HIGHLIGHTS 2012LCEC is dedicated to ensuring financial strength and competitive rates by managing costs and preserving fiscal integrity. The organization has worked hard for the past four years to control operating costs, allowing rates to remain at 2009 levels and re-covering close to $40M in additional power supply costs through existing rates. Con-tinued strong financial results enabled the organization to distribute $13M in equity to customers, bringing total equity distributions to date to over $191M – the ultimate ad-vantage to being a member of a financially sound electric distribution cooperative!
COMPANY PROFILELCEC is a not-for-profit electric distribution cooperative providing reliable and cost-competitive electricity to nearly 200,000 customers in Southwest Florida. As one of the largest cooperatives in the United States, LCEC is also one of the largest employers in Lee County, Florida. Cooperative membership is open to all customers within the service territory. LCEC serves customers in Cape Coral, North Fort Myers, Sanibel, Captiva, Pine Island, Everglades City, Immokalee, Marco Island, Ave Maria, parts of Lehigh Acres, and ar-eas in Hendry and Glades counties. The organization’s headquarters remains in North Fort Myers on the property on which the cooperative began in 1940.
TALENT MANAGEMENT *Internal Fill Rate 76 %Critical Vacancy Internal Fill Rate 50 %Quality of Hire 92%* All results met or exceeded organizational objectives
15
10
5
0


