Download - Feasibility study of the anaerobic digestion of dewatered pig slurry by means of polyacrylamide

Available online at www.sciencedirect.com
Bioresource Technology 99 (2008) 387–395
Feasibility study of the anaerobic digestion of dewatered pig slurryby means of polyacrylamide
E. Campos a, M. Almirall a, J. Mtnez-Almela b, J. Palatsi c, X. Flotats c,*
a Laboratory of Environmental Engineering, Centre UdL-IRTA, Rovira Roure 191, E-25198 Lleida, Spainb SELCO MC SL, Pza. Tetuan 16, E-12001 Castellon, Spain
c GIRO Technological Centre, Rambla Pompeu Fabra 1, E-08100 Mollet del Valles, Barcelona, Spain
Received 15 January 2004; received in revised form 20 September 2006; accepted 6 December 2006Available online 5 February 2007
Abstract
Liquid livestock waste can be managed by separating liquid and solid fractions then treating each separately by applying best avail-able technology, such as anaerobic digestion for the solid fraction. There is an increasing use of polyacrylamide (PAM) as a flocculantagent to improve solid–liquid separation. In the present work, the anaerobic toxicity of PAM residues and the optimal range of totalsolids concentration for maximum methane production were studied as a function of PAM dosage. Results showed that dry matterand its volatile solids content increased significantly with increasing PAM dosage. Batch anaerobic tests showed that methane yielddecreased linearly with increasing total solids, while the methane production per unit of raw substrate reached a maximum at 16.4% totalsolids. No PAM toxicity was measured for PAM concentrations below 415 g/kg total solids, but some indirect inhibitory phenomenawere observed, such as a limited hydrolysis rate due to particle aggregation, and inhibition of methanogenesis by high ammoniaconcentration.� 2007 Elsevier Ltd. All rights reserved.
Keywords: Anaerobic digestion; Pig slurry; PAM; Polyacrylamide; Solid–liquid phase separation
1. Introduction
Modern pig production, which has a very intensive andconcentrated character, generates a large pig slurry surplusthat often cannot be used as an agricultural fertiliser in thesame geographical area, thus making its transport a limit-ing factor. One management strategy consists of separatingthe solid and liquid fractions, then treating the liquid frac-tion prior to using it for irrigation on nearby land, whiletreating the solid fraction in order to stabilise it and toreduce volume before transporting it to areas with nutrientand/or organic matter demand. Stabilisation of the solidfraction, prior to land application, can be achieved by aer-obic composting and/or anaerobic digestion. The secondoption provides a better energy balance and can be comple-
0960-8524/$ - see front matter � 2007 Elsevier Ltd. All rights reserved.
doi:10.1016/j.biortech.2006.12.008
* Corresponding author. Fax: +34 935796785.E-mail address: [email protected] (X. Flotats).
mented by further aerobic composting in order to producea higher quality end product. The efficiency of anaerobicdigestion of this solid fraction can be negatively affectedby high total solids concentration (Itodo and Awulu,1999; Bujoczek et al., 2000).
The main fraction of organic matter found in pig slurrytakes the form of small suspended particles, mainly in col-loidal form, which are not easily separated by applying asimple mechanical system (Hill and Tollner, 1980). The effi-ciency of suspended solids separation using filters andpresses is limited, and for colloids agglutination a chemicalcoagulation process is required (Sievers et al., 1994). Treat-ment with polyacrylamide (PAM) polymers, prior tomechanical removal or gravity settling, has the potentialto enhance solid–liquid separation, thus concentratingnitrogen, phosphorous and organic carbon (Vanotti andHunt, 1999). Since most suspended particles in wastewatersand aqueous solutions, such as livestock and poultry
388 E. Campos et al. / Bioresource Technology 99 (2008) 387–395
manure, have a negative charge at pH values higher than 4,the addition of cationic coagulants to these wastewaterswould be more effective than the addition of anionic ones(Sievers et al., 1994).
Polyacrylamide (PAM) is widely used in sewage sludgetreatment to enhance dewatering. The polyelectrolyte con-centration in mechanically dewatered cakes is relativelyhigh and typically in the range 2.5–5.0 g/kg dry matter(TS), and it can be degraded by abiotic processes in culti-vated soils without toxicity problems (ICON, 2001). There-fore, it has been suggested that it presents low toxicity, withLD50 value greater than 5 g/kg TS, but this potential toxic-ity has not been studied yet for anaerobic digestion.
PAM can degrade to acrylamide monomer, which ishighly toxic (IPCS, 1985), followed by a rapid degradationto ammonia and acrylic acid, which is not toxic and in turndegrades to CO2 and water (ICON, 2001). El-Mamouniet al. (2002) demonstrated that PAM is highly recalcitrantto aerobic or anaerobic microbial degradation, suggestingthat this recalcitrance is linked to the high molecularweight, thus making it inaccessible to microbial attack.These authors found that PAM is very susceptible to UVphotolysis, enhancing a further microbial degradation pro-cess, but without intermediate production of acrylamide.Studies on PAM degradation in cultivated soils (Kay-Shoe-make et al., 1998) demonstrated that indigenous bacteriacould use PAM as a source of nitrogen, biotransformingthe polymer to long chain polyacrylate, which may be fur-ther degraded by biological processes without toxicityproblems. In an extended review, Caulfield et al. (2002)concluded that there is no evidence to suggest that PAMcan undergo biodegradation to form free acrylamidemonomer units. Caulfield et al. (2002) also concluded thatPAM can act as a carbon source for microbial growth onlywhen some other physical or chemical process lowers themolecular weight of the polymer beforehand. These resultssuggest that toxicity by acrylamide is not probable duringanaerobic digestion processes without previous physicalor chemical pre-treatment to enhance PAM degradation.
Chu et al. (2003) studied the anaerobic digestion ofPAM flocculated activated sludge, comparing the effect ofcationic, non-ionic and anionic polyacrylamide. Theyfound that anionic and non-ionic PAM had no effect onmethane yield at doses below 15 g/kg TS. For cationicPAM, methane yield decreased with increasing dosage,showing a small variation in relation to the control assayfor 1 and 5 g/kg TS, and a significant decrease for 15 and40 g/kg TS. Since dosed polymers had no apparent toxicityto the inoculum, although an anaerobic toxicity test wasnot performed, Chu et al. (2003) suggested that the muchgreater floc size obtained with cationic PAM increasedthe mass transfer resistance. No methane production fromPAM degradation was measured in these experiments.Chang et al. (2001) found that the methane productionobtained from anaerobic batch digestion of a commercialPAM, consisting of a copolymer of acrylamide and acry-loyloxyethyltrimethylammonium chloride, was consistent
with a complete degradation of the second monomer, butnot with the degradation of PAM or acrylamide. No inhi-bition phenomena were reported in this study.
The optimum cationic PAM dose varies with the type ofmanure and the amount of total suspended solids (TSS) inthe liquid manure, the dose increasing with TSS concentra-tion (Vanotti and Hunt, 1999; Chastain et al., 2001). In astudy of the separation of different types of pig slurry,Walker and Kelley (2003) found that optimal PAM dosagewas in the range 0.9–1.8 g/kg TS for efficient separation ofSS, TSS and COD, and in the range 4.2–10.9 g/kg TS forefficient separation of nitrogen (N) and phosphorous (P).In general, the TSS removal efficiencies achieved rangefrom 76% to 99%. These values contrast with the efficien-cies of the screening process alone (without using PAM),which range from 5% to 14%.
The objectives of the present work were to study theanaerobic digestion of the solid fraction of pig slurry sepa-rated using PAM at different dosages, to characterize thissolid fraction and to study the anaerobic biodegradabilityand toxicity of PAM, in order to determine whether thepolymer or its possible degradation products can affectanaerobic microorganisms during the pig slurry digestionprocess.
2. Methods
2.1. Materials
The pig slurry and its associated solid fraction camefrom a treatment plant in Modena, Italy. This plant usedthe SELCO-EcopurinTM solid/liquid separation system(Martınez-Almela and Barrera, 2005), using cationicPAM as the coagulant agent. The four different materialsidentified in Table 1 were used: raw pig slurry (PS), solidfraction of pig slurry using a PAM dose of 120 mg/l(SFPS), which is the usual dose in the plant, solid fractionof pig slurry using a PAM dose of 140 mg/l (SFPS-1) andsolid fraction of pig slurry without using PAM (SFPS-0).Anaerobically digested sewage sludge from a mesophilicdigester was used as inoculum for batch tests.
2.2. Analytical methods
Analytical methods for the determination of total andvolatile solids (TS and VS), total and volatile suspendedsolids (TSS and VSS), total and soluble chemical oxygendemand (CODt and CODs), total Kjeldahl nitrogen(NTK), ammonia nitrogen ðNHþ4 –NÞ and pH were adaptedfrom Standard Methods for the Examination of Water andWastewater (APHA, 1995). Total and partial alkalinity(TA, PA) were analysed according to the method proposedby Hill and Jenkins (1989).
Methane and carbon dioxide concentration in the biogaswere measured with a GC 8000 Top Series gas chromato-graph (CE Instruments, Italy), fitted with PORAPAK-N(80/100 mesh) packed column (2 m · 2 mm) and a Thermal

Table 1Identification and basic characterisation, average of three replicates, of inoculum and substrates used (g/kg of substrate or inoculum)
PAMa dose (mg/l) TS (g/kg) VS (g/kg) COD (g/kg) NTK (g/kg) N–NHþ4 (g/kg)
mg/l g/kg TS
SFPS-1 140 14.27 313.60 ± 41.41 233.58 ± 29.98 271.99 ± 36.17 18.81 ± 0.78 3.06 ± 0.00SFPS 120 12.23 136.12 ± 6.06 100.36 ± 3.79 96.30 ± 24.37 7.79 ± 3.45 1.89 ± 0.43SFPS-0 0 0 13.57 ± 0.24 7.38 ± 0.51 17.07 ± 6.15 2.03 ± 0.20 1.51 ± 0.07PS – – 9.81 ± 0.36 5.53 ± 0.70 6.17 ± 3.78 0.90 ± 0.58 0.83 ± 0.00Inoculum – – 39.45 ± 0.16 22.65 ± 0.93 28.22 ± 4.24 – –
a PAM dose applied to raw pig slurry to obtain the corresponding solid fraction used as substrate.
E. Campos et al. / Bioresource Technology 99 (2008) 387–395 389
Conductivity Detector (TCD). Helium (He) was used as acarrier gas (20 ml/min), and temperatures of the injectorport (J70), column and TCD were 130, 30 and 120 �Crespectively.
Volatile fatty acids (VFA) – acetate (Ac), propionate(Pro), iso-butyrate (Iso-But), n-butyrate (n-But), iso-valer-ate (Iso-Val) and n-valerate (n-Val) – were determined fromsamples after centrifugation (2790g for 20 min), filtration(0.45 lm) and acidification/extraction (with HCl anddiethyl-ether 1/1) with a Trace 2000 gas chromatograph(Thermo Instruments, Italy), fitted with a FFAP capillarycolumn (30 m · 0.250 mm · 0.25 lm), with flame ioniza-tion detector (FID) and equipped with auto sampler (Auto-sampler AS2000, Italy). The FID was supplied with H2 andsynthetic air, while He was used as make-up gas with a flowrate of 30 ml/min. Samples of 1 ll were injected in split-splitless mode, with a constant carrier gas flow rate of1 ml/min, a split ratio of 20/1 and a septum purge ratioof 5/1. The initial oven temperature was 90 �C for 4 min,after which it was increased to 155 �C at 6 �C/min thento 255 �C at 12.5 �C/min, with a final isotherm of 2 min.The injector and detector temperatures were set constantat 240 �C.
NH3–N concentration was calculated by using Eq. (1),
½NH3–N� ¼ ½NHþ4 –N�t1
10ðpK�pHÞ þ 1
� �; ð1Þ
with a pK value of 8.938 at 35 �C (Bonmatı and Flotats,2003).
2.3. Polyacrylamide toxicity and biodegradability test
The PAM toxicity test was carried out according to Sotoet al. (1993). The culture medium consisted of 223 g/l ofdigested sewage sludge as inoculum, macro and micro-nutrient solutions, a mixture of volatile fatty acids (2.95 gacetate/l, 0.59 g propionate/l and 0.25 g butyrate/l) as sub-strate (Soto et al., 1993) and the corresponding PAM con-centration (from 0 – control – to 2775 mg/kg sludge TS).Batch reactors were 120 ml glass vials filled with 50 ml ofculture medium. After displacement of air from the head-space with N2/CO2 gas (80/20 v/v) for 3 min, the vials weretightly closed with rubber stoppers. Finally, a reducingsolution (0.1 ml of 50 g Na2S/l) was injected into every vialto achieve a reduced medium. The vials were incubated at
35 �C in a closed and dark incubator for 21 days and theamount of gas accumulated in the headspace was measuredtwice a week.
Six treatments were carried out (Table 2), with five dif-ferent PAM concentrations between 0 and 126 mg/l andone additional treatment with a much higher concentra-tion, about 2775 mg/l. These concentrations correspondto 0–18.7 g PAM/kg TS of sludge, and the sixth concen-trated treatment corresponds to 415 g/kg TS, which is anunusual and extremely high value.
An anaerobic biodegradability test, following Soto et al.(1993), was also carried out in order to study the biode-gradability of PAM in an anaerobic environment. The120-ml vials were filled with 50 ml of medium, containingmacronutrient and micronutrient solutions, alkalinity solu-tion and anaerobically digested sewage sludge (222 g/l),giving a solids concentration of 6.7 g TS/l and 5.1 g VS/l.The initial concentration of PAM was 259.8 ± 4.4 mg/l inthe culture liquid, corresponding to 38.5 ± 0.6 g/kg TS.pH was adjusted to neutrality. After displacement of airfrom the headspace with N2/CO2 gas (80/20 v/v), the vialswere tightly closed with rubber stoppers. Finally, a reduc-ing solution (0.1 ml of 50 g Na2S/l) was injected into everyvial to achieve a reduced medium. The vials were incubatedat 35 �C in a closed and dark incubator for 33 days. Theaccumulated methane production was determined by peri-odic headspace analysis.
2.4. Batch anaerobic tests
Four substrate mixtures (Table 1) were prepared andmixed in various ratios to produce five different combina-tions of TS and PAM concentrations, corresponding to fivedifferent treatments for batch anaerobic tests (Table 3). Anadditional ‘‘blank’’ treatment – water plus inoculum – wasalso prepared to evaluate the methane production frominoculum. The methodology of batch tests was adaptedfrom Campos et al. (2000): 120 ml glass vials were filledwith 30 g of mixture (90% substrate and 10% inoculum,digested sewage sludge). After displacement of air fromthe headspace with N2/CO2 gas (80/20 v/v) for 3 min thevials were tightly closed with rubber stoppers. Finally, areducing solution (0.1 ml of 50 g Na2S/l) was injected intoevery vial to achieve a reduced medium. The vials wereincubated at 35 �C in a closed and dark incubator, and

Table 2Results from the PAM toxicity test
Treatment PAM dose (mg/l) PAM dose (g/kg TS) ACm, 7 daya (g COD/g VS day) Final methane yield (ml CH4/vial)
T1 0.00 0.00 0.118 ± 0.025 A 76.30 ± 12.53 aT2 33.29 4.96 0.114 ± 0.025 A 75.24 ± 9.06 aT3 66.89 10.07 0.116 ± 0.018 A 76.94 ± 3.51 aT4 99.27 14.99 0.117 ± 0.007 A 75.59 ± 6.42 aT5 125.55 18.67 0.111 ± 0.012 A 78.42 ± 5.87 aT6 2775.19 414.80 0.107 ± 0.026 A 86.96 ± 6.55 b
Letters: results of Duncan test at 5% significance; different letters indicate statistically significant differences.a ACm, maximum methanogenic activity, observed at seventh day.
Table 3Characterisation of treatments used in the anaerobic digestion test (three replications per treatment)
Treatment PAM dose Substrate composition (% w/w) Substrate characterisation (g/kg)
g/kg TS mg/l SFPS-1 SFPS SFPS-0 TS VS COD
T1 14.27 140 100 0 0 313.60 ± 41.41 233.58 ± 29.98 271.99 ± 36.17T2 13.25 ffi130 50 50 0 210.04 ± 17.34 155.85 ± 15.47 200.65 ± 4.97T3 12.23 120 0 100 0 136.12 ± 6.06 100.36 ± 3.79 96.30 ± 24.37T4 10.40 ffi100 0 85 15 98.74 ± 3.03 71.41 ± 1.83 85.00 ± 7.34T5 0 0 0 0 100 13.56 ± 0.24 7.52 ± 0.51 14.84 ± 6.15T6 (blank) 0 – 0 0 0 – – –
390 E. Campos et al. / Bioresource Technology 99 (2008) 387–395
monitored for 82 days. Vials were shaken by hand once aday. A complete analytical characterisation was performedat both the beginning and the end of the experiment: TSand VS, TSS and VSS, CODt and CODs, NTK, NHþ4 –N,pH, TA, PA and VFA. The accumulated methane produc-tion was determined by periodic headspace analysis.
2.5. Calculations
2.5.1. Separation efficiency
The separation efficiency (Et) is defined as the total massrecovery of nutrients in the solid fraction as a proportion(%) of the total input of solids or nutrients (Møller et al.,2002),
Et ¼U �M c
Q � Sc
� 100; ð2Þ
where U (kg) is the quantity of solid fraction, Mc (g/kg) isthe concentration of TS or NTK in the solid fraction; Q (kg)is the amount of manure treated; and Sc (g/kg) is the con-centration of TS or NTK in the manure.
2.5.2. Methanogenic activity
The methanogenic activity, ACm (g COD/g VS Æ day), inthe toxicity test was calculated as methane production dur-ing the maximum growth period, by using the followingexpression adapted from Soto et al. (1993):
ACm ¼R
f � V � ½SSV� ð3Þ
where R is the methane production rate (ml CH4/day), f isa factor to transform methane volume to grams of COD
(350 ml of CH4/g COD for Normal Conditions), and[SSV] is the concentration of SSV in the culture mediumwith a volume V.
2.6. Statistical methods
The confidence limits of average values of experimentaldata were calculated using Eq. (4),
�x� tðs=ffiffiffinpÞ; ð4Þ
where �x is the average value, s is the standard deviation, n isthe number of replicates and t is the corresponding t-statis-tical distribution value, depending on the number of sam-ples and on the degree of confidence (95% in the presentstudy).
Mean separation tests were performed using statisticalanalysis software (SAS Institute, 1989) and by applying aDuncan test with a significance level of 5%. Significant dif-ferences have been indicated with different letters. Regres-sion analyses were done using the Levemberg–Marquardtalgorithm.
3. Results and discussion
3.1. Effect of polyacrylamide on substrate characteristics
The basic characterisation of the different original mate-rials – shown in Table 1 – was carried out prior to the anaer-obic tests. The solid fraction of pig slurry obtained from theusual dose of PAM (120 mg/kg) – SFPS – showed a TSconcentration higher than 13% (136.1 g TS/kg). A slightincrease in the PAM dose, from 120 to 140 mg/kg (SFPS-

E. Campos et al. / Bioresource Technology 99 (2008) 387–395 391
1), led to a very significant increase in the total solids con-centration of the solid fraction, which surpassed 30% ofthe total weight (313.6 g TS/kg). The solid fraction of pigslurry obtained when PAM was not used (SFPS-0) showeda very low TS and NTK content and it was slightly higherthan raw pig slurry (PS). This fact shows that the separationprocess was not effective without PAM dosage, which isconsistent with results from Vanotti and Hunt (1999).
The separation efficiency for 120 and 140 mg PAM/kgraw slurry was higher than the usual values reported forother mechanical separation methods (Møller et al., 2000,2002), as shown in Table 4. The differences were especiallyimportant for the separation efficiency of total nitrogen,with values obtained exceeding 50%. Similar or higherremoval efficiencies have been obtained by other authorsusing PAM as an additive in the separation process (Vano-tti and Hunt, 1999; Walker and Kelley, 2003). As can beobserved in Table 1, the organic fraction (VS) of totalsolids, the COD/NTK ratio and the NTK=N–NHþ4 ratioincreased with PAM dose, indicating an increasing separa-tion efficiency for organic materials.
3.2. Polyacrylamide toxicity and biodegradability study
The maximum concentration of PAM that could befound in the solid fraction of pig slurry, assuming that allPAM was associated with the separated solids, was14.27 g PAM/kg TS for 140 mg PAM/l dose (Table 1).With treatments T2–T5 (Table 2) the toxicity study coveredusual PAM concentrations. The study was contrasted bothwith an extremely high PAM concentration (T6) and with acontrol assay without PAM dosage (T1). Table 2 shows theresults from the toxicity test.
Table 4Separation efficiencies obtained compared with literature values
Technology Substrate Reference U/Q (%) PS
TS
PAM 120 mg/l PS Present study 6.09 9PAM 140 mg/l PS Present study 2.59 9Centrifuge PS Møller et al. (2002) 13.10 53Centrifuge PS Møller et al. (2002) 8.28 47Centrifuge PS Møller et al. (2002) 5.67 17Centrifuge PS Møller et al. (2002) 4.69 25Centrifuge ADPS Møller et al. (2002) 13.72 56Centrifuge ADPS Møller et al. (2002) 14.11 65Centrifuge ADPS Møller et al. (2002) 8.82 35Centrifuge ADPS Møller et al. (2002) 9.91 37Screw press PS Møller et al. (2002) 5.23 53Screw press ADPS Møller et al. (2002) 3.85 56Screw press ADPS Møller et al. (2002) 2.88 37Tilted plane screen PS Møller et al. (2000) 30.00 56Pressing screw PS Møller et al. (2000) 5.00 56Pressing screw PS Møller et al. (2000) 7.30 56Two-stage separator PS Møller et al. (2000) 24.00 56Belt press separator PS Møller et al. (2000) 17.50 56
PS, pig slurry; SFPS, separated solid fraction of pig slurry; ADPS, anaerobicaa Concentration ratio Mc/Sc (see Eq. (2)).
Evolution of accumulated methane production (ml) pervial is shown in Fig. 1. Treatments T1–T5 showed a verysimilar evolution, without statistically significant differ-ences between treatments. However, treatment T6 (corre-sponding to 415 g PAM/kg TS) showed higher andstatistically significant accumulated methane productionat the end of the experiment. The difference in methaneproduction for this treatment was 112.8 ± 38.0 ml CH4/gPAM added, an average 23% of the maximum theoreticalmethane yield predicted based on molecular composition.Chang et al. (2001) found that low methane productionfrom PAM was due to the degradation of acryloyloxyeth-yltrimethylammonium chloride, a second monomer con-tained in the PAM used for their work. However, PAMused in the work described here did not contain this mono-mer. Therefore, findings from Chang et al. (2001) cannotexplain the measured methane production. Taking intoaccount the high dose used in treatment T6, this low butsignificant production could have been caused by the pres-ence of impurities and additives.
Maximum methanogenic activity for the six treatmentswas found on the seventh day of digestion, and showedno statistically significant differences when applying theDuncan test (Table 2 and Fig. 2). These results indicatethat the polymer compound used cannot be consideredtoxic for anaerobic microorganisms at the concentrationsstudied. If PAM is degraded in some way, products are alsonon-inhibitors even at the high concentration used in T6.
No statistically significant differences were found in thebiodegradability test (Fig. 3) between the treatment withPAM as substrate and the control treatment. This fact indi-cates that the polymer is not significantly biodegradable byanaerobic microorganisms. The low and non-statistically
SFPS Et Mc/Sca
NTK TS NTK TS (%) NTK (%) TS NTK
.81 0.90 136.12 7.79 84.6 53.0 13.9 8.7
.81 0.90 313.60 18.81 82.9 54.4 32.0 21.0
.20 4.20 245.60 9.4 60.5 29.3 4.6 2.2
.90 4.40 279.30 9.88 48.3 18.6 5.8 2.2
.10 2.20 187.30 7.79 62.1 20.1 11.0 3.5
.50 3.90 178.20 10.91 32.8 13.1 7.0 2.8
.20 4.20 280.80 7.41 68.6 24.2 5.0 1.8
.30 5.00 252.70 10.99 54.6 31.0 3.9 2.2
.50 3.80 299.90 10.89 74.5 25.3 8.4 2.9
.40 3.30 201.90 7.89 53.5 23.7 5.4 2.4
.20 4.20 364.70 6.61 35.9 8.2 6.9 1.6
.20 4.20 268.40 6.31 18.4 5.8 4.8 1.5
.40 3.30 298.40 6.89 23.0 6.0 8.0 2.1
.60 4.10 117.00 4.6 62.0 33.7 2.1 1.1
.60 4.10 317.00 4.8 28.0 5.9 5.6 1.2
.60 4.10 219.00 4 28.2 7.1 3.9 1.0
.60 4.10 167.00 5.3 70.8 31.0 3.0 1.3
.60 4.10 192.00 6.4 59.4 27.3 3.4 1.6
lly digested pig slurry.

0
20
40
60
80
100
0 2 4 6 8 10 12 14 16 18 20 22 24
Time (days)
T1-0 g/kgTS
T2-5 g/kgTS
T3-10 g/kgTS
T4-15 g/kgTS
T5-19 g/kgTS
T6- 415 g/kgTS
Accumulated CH4 (mL)
Fig. 1. Accumulated methane production in toxicity test. Confidenceintervals calculated for 95% confidence level.
0.00
0.02
0.04
0.06
0.08
0.10
0.12
0.14
0.16
0 2 4 6 8 10 12 14 16 18 20
PAM concentration (g/kg TS)
Methanogenic activity 7d(g COD/g VS·d)
Fig. 2. Maximum methanogenic activity index, found at day 7, as afunction of PAM dose expressed as g of PAM/kg of total dried solids.
0
5
10
15
20
25
30
35
0 5 10 15 20 25 30 35
Days of incubation
PAM-250 mg/l
Control
Accumulated CH4 (ml)
Fig. 3. Accumulated methane generation in the anaerobic biodegradabil-ity test.
392 E. Campos et al. / Bioresource Technology 99 (2008) 387–395
significant difference in methane production has the sameorder of magnitude as that obtained for the T6 treatmentin the toxicity test, low enough to be disregarded at usualPAM dosages.
The NTK and NH4–N measurements in the biodegrad-ability and toxicity experiments showed an ammonia
release ranging from 17% to 69% of PAM organic N (datanot shown), with high deviation within and between treat-ments and without a defined tendency. Since no anaerobicbiodegradability was measured and no polymer chainbreak took place, this ammonia release suggests that deam-ination of PAM occurred to some extent, as described byKay-Shoemake et al. (1998) and Caulfield et al. (2002).
It can be concluded from the toxicity and biodegradabil-ity tests that the polymer or its degradation products didnot produce toxicity to anaerobic digestion, suggesting thatacrylamide was not produced, in agreement with Kay-Shoemake et al. (1998); Caulfield et al. (2002) and El-Mamouni et al. (2002).
3.3. Study of the initial total solid concentration effect toanaerobic batch tests
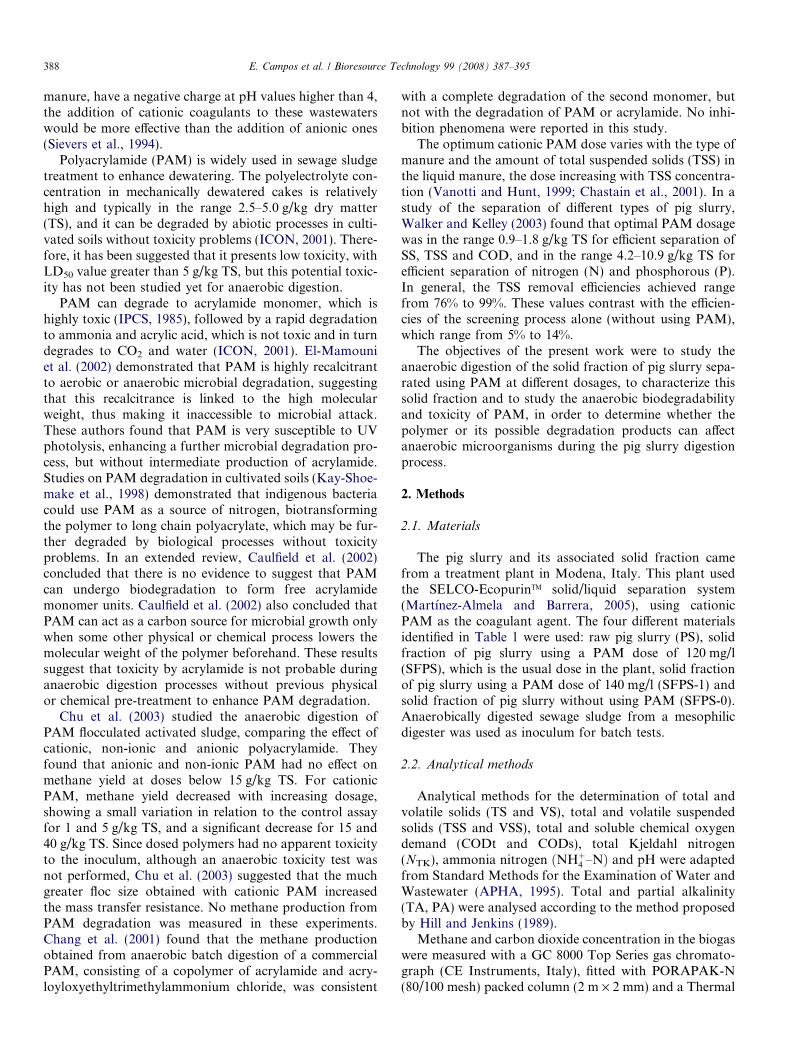
Methane production results from the batch anaerobictests are shown in Table 5 and Figs. 4–6. Methane produc-tion related to substrate weight (M), Table 5 and Fig. 4,increased with TS concentration or PAM dose until treat-ment T3, decreasing with higher PAM doses with a mini-mum methane production value for treatment T1 (14.27 gPAM/kg TS). Treatments T2 and T3 showed no statisti-cally significant differences, but treatment T2 showed anincreasing methane production during the last days of theincubation period (Fig. 4), suggesting that methane valueswere not the maximum obtainable in spite of the extendedincubation period.
Different behaviour was detected when methane yield(B) was measured. Yield is expressed as ml CH4 producedrelated to initial added VS or related to initial added COD(Table 5). When related to initial VS concentration, accu-mulated methane showed statistically significant differencesfor the five treatments of the test, with methane yieldincreasing with decreasing TS concentration or PAM doseand a maximum value for the control treatment (T5).When related to initial COD concentrations, the globalresponse was very similar but without statistically signifi-cant differences between treatments T3 and T4. TreatmentT2 showed a clear increasing yield value at the end of theexperiment (Fig. 5), suggesting that the final value couldhave been higher if incubation time were longer. Althoughwith a lower slope, treatment T1 also showed a slightincrease at the end of the experiment (Figs. 4 and 5), sug-gesting that the digestion process rate was decreased signif-icantly by the increase in TS or PAM dose, but notstopped.
Studying the relationship between methane yield (B) andinitial TS (Fig. 6), a clear linear decrease associated withthe increase in TS content of the substrate can be observed.Other authors have pointed out this tendency; Bujoczeket al. (2000) found that for total solids concentrationsabove 4%, maximum methane production rate decreasedwith total solids content, following a linear tendency; Itodoand Awulu (1999) observed that methane yield from differ-ent types of animal waste tended to decrease when total
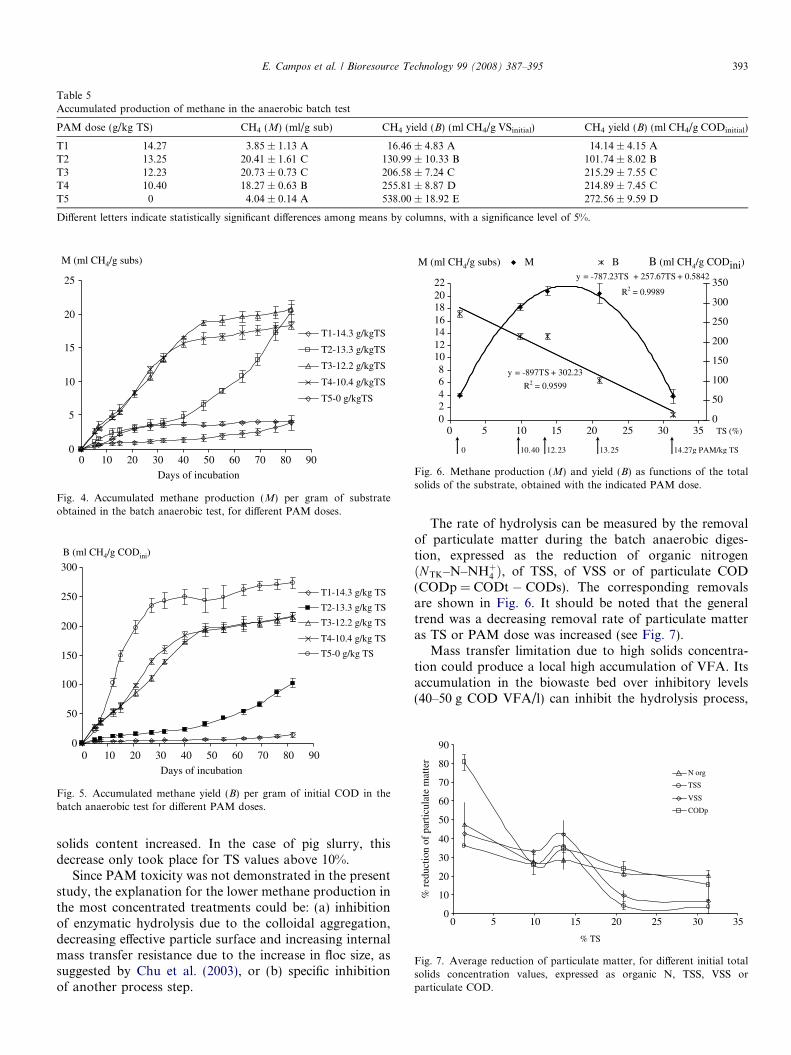
Table 5Accumulated production of methane in the anaerobic batch test
PAM dose (g/kg TS) CH4 (M) (ml/g sub) CH4 yield (B) (ml CH4/g VSinitial) CH4 yield (B) (ml CH4/g CODinitial)
T1 14.27 3.85 ± 1.13 A 16.46 ± 4.83 A 14.14 ± 4.15 AT2 13.25 20.41 ± 1.61 C 130.99 ± 10.33 B 101.74 ± 8.02 BT3 12.23 20.73 ± 0.73 C 206.58 ± 7.24 C 215.29 ± 7.55 CT4 10.40 18.27 ± 0.63 B 255.81 ± 8.87 D 214.89 ± 7.45 CT5 0 4.04 ± 0.14 A 538.00 ± 18.92 E 272.56 ± 9.59 D
Different letters indicate statistically significant differences among means by columns, with a significance level of 5%.
0
5
10
15
20
25
0 10 20 30 40 50 60 70 80 90
Days of incubation
T1-14.3 g/kgTS
T2-13.3 g/kgTS
T3-12.2 g/kgTS
T4-10.4 g/kgTS
T5-0 g/kgTS
M (ml CH4/g subs)
Fig. 4. Accumulated methane production (M) per gram of substrateobtained in the batch anaerobic test, for different PAM doses.
0
50
100
150
200
250
300
T1-14.3 g/kg TS
T2-13.3 g/kg TS
T3-12.2 g/kg TS
T4-10.4 g/kg TS
T5-0 g/kg TS
B (ml CH4/g CODini)
0 10 20 30 40 50 60 70 80 90
Days of incubation
Fig. 5. Accumulated methane yield (B) per gram of initial COD in thebatch anaerobic test for different PAM doses.
y = -787.23TS + 257.67TS + 0.5842
R2 = 0.9989
y = -897TS + 302.23
R2 = 0.9599
02468
10121416182022
0 5 10 15 20 25 30 35 TS (%)0
50
100
150
200
250
300
350
M B B (ml CH4/g CODini)M (ml CH4/g subs)
0 10.40 12.23 13.25 14.27g PAM/kg TS
Fig. 6. Methane production (M) and yield (B) as functions of the totalsolids of the substrate, obtained with the indicated PAM dose.
0
10
20
30
40
50
60
70
80
90
0 5 10 15 20 25 30 35
% TS
% r
educ
tion
of p
artic
ulat
e m
atte
r
N org
TSS
VSS
CODp
Fig. 7. Average reduction of particulate matter, for different initial totalsolids concentration values, expressed as organic N, TSS, VSS orparticulate COD.
E. Campos et al. / Bioresource Technology 99 (2008) 387–395 393
solids content increased. In the case of pig slurry, thisdecrease only took place for TS values above 10%.
Since PAM toxicity was not demonstrated in the presentstudy, the explanation for the lower methane production inthe most concentrated treatments could be: (a) inhibitionof enzymatic hydrolysis due to the colloidal aggregation,decreasing effective particle surface and increasing internalmass transfer resistance due to the increase in floc size, assuggested by Chu et al. (2003), or (b) specific inhibitionof another process step.
The rate of hydrolysis can be measured by the removalof particulate matter during the batch anaerobic diges-tion, expressed as the reduction of organic nitrogenðNTK–N–NHþ4 Þ, of TSS, of VSS or of particulate COD(CODp = CODt � CODs). The corresponding removalsare shown in Fig. 6. It should be noted that the generaltrend was a decreasing removal rate of particulate matteras TS or PAM dose was increased (see Fig. 7).
Mass transfer limitation due to high solids concentra-tion could produce a local high accumulation of VFA. Itsaccumulation in the biowaste bed over inhibitory levels(40–50 g COD VFA/l) can inhibit the hydrolysis process,

394 E. Campos et al. / Bioresource Technology 99 (2008) 387–395
as has been reported previously (Veeken and Hamelers,2000). The volatile fatty acid concentration at the end ofthe experiment for T1 (highest solid concentration treat-ment) was very high, close to 40 g COD VFA/kg, a levelat which hydrolysis is completely inhibited by VFA (Veekenand Hamelers, 2000). Validated models describing VFAinhibition of hydrolysis of particulate matter have beendeveloped with satisfactory results (Angelidaki et al.,1999; Vavilin and Angelidaki, 2005).
The high concentration of acetate at the end of the pro-cess in T1 (Table 7) together with the ammonia concentra-tion (Table 6), above 6 g N–NHþ4 =l, could also explain aninhibition of acetoclastic methanogenic microorganismsby free ammonia. Other VFA were also accumulated, butat lower levels than acetate. Accumulation of acetate couldalso have caused an accumulation of other longer chainacids, since a high concentration of acetate can inhibitthe acetogenic process (Ahring and Westermann, 1988).
In most of the treatments, ammonia nitrogen concentra-tion increased towards the end of the process (Table 6). Intreatments T1–T4, ammonia nitrogen concentration practi-cally doubled and reached extremely high levels, above 6 gN/kg. This increase in ammonia nitrogen and of pHthroughout the process caused a significant increase in freeammonia at the end of the process (Table 6). The measuredvalues were higher than the values described as inhibitoryfor a methanogenic population by some authors (Hashim-
Table 6Nitrogen measurements at the beginning and at the end of the anaerobic batc
PAM dose (mg/kg TS) NTK (g N/kg) NHþ4 –N ðg N=kgÞInitial
T1 14.27 15.68 ± 0.67 3.07 ± 0.28T2 13.25 11.73 ± 0.59 2.19 ± 0.12T3 12.23 7.87 ± 0.66 2.46 ± 0.09T4 10.40 6.45 ± 0.25 1.78 ± 0.10T5 0 2.01 ± 0.09 1.37 ± 0.08T6 – 0.35 ± 0.06 0.25 ± 0.21
Average of three replicates.
Table 7Volatile fatty acid concentrations at the beginning and at the end of batch ex
PAM (mg/kg TS) Individual volatile fatty acid concentration (mM
Ac Pro Iso-But n-But
InitialT1 14.27 75.48 5.84 6.99 3.44T2 13.25 59.33 10.51 6.92 5.90T3 12.23 50.23 22.90 2.63 6.27T4 10.40 48.00 19.64 2.30 5.60T5 0 42.34 9.56 1.38 4.42T6 – 0.52 0.33 0.08 0.01
FinalT1 14.27 206.23 54.71 27.00 39.53T2 13.25 8.14 77.59 12.55 0.16T3 12.23 1.44 0.10 0.06 0.00T4 10.40 1.03 0.00 0.01 0.00T5 0 0.13 0.00 0.00 0.00T6 – 0.13 0.00 0.00 0.00
oto, 1986; Gallert et al., 1998), although below the inhibi-tion threshold value for adapted acetate-utilizing bacteria(Angelidaki and Ahring, 1993; Hansen et al., 1998).
The high concentration of propionate and the high valueof the propionate/acetate (P/A) ratio (Table 7) at the endof treatment T2 (corresponding to 130 mg/kg PAM dose)showed that the process had been strongly inhibited. Thisalso explains the shape of the accumulated methane curve,with a longer lag phase than in the most diluted treatments(Figs. 3 and 4), probably indicating an overloading of themethanogenic population due to the high ratio of organicmatter/inoculum.
The other treatments (T3–T6) showed much lower levelsof VFA at the end of the experiment (Table 7), and in manycases only acetate was detectable, showing that themethanogenic phase was not inhibited, as can also bededuced from the shape of accumulated methane produc-tion curves.
Summing up, the decrease in solids removal rate andmethane yield of the solid fraction of pig slurry separatedby PAM as PAM dose increased, with consequentincreased TS concentration, can be explained by a combi-nation of two phenomena: resistance to enzymatic hydroly-sis due to organic matter aggregation and transportlimitations, and inhibition of the methanogenic step dueto high NH4–N concentration, which increased in the solidfraction separated as PAM dose increased.
h tests (mixture of substrate and inoculum)
pH NH3 (mg N/kg)
Final Initial Final Initial Final
6.47 ± 1.10 7.42 7.60 90.52 286.234.96 ± 0.12 7.29 7.87 48.10 387.893.57 ± 0.27 7.99 7.96 248.91 337.703.29 ± 0.27 7.26 7.98 36.23 328.971.62 ± 0.08 7.58 8.19 57.68 246.310.20 ± 0.05 7.00 7.65 2.86 9.93
periments (average of three replicates)
) Total VFA (mM) Total VFA (g COD/kg)
Iso-Val n-Val
10.96 0.35 103.05 ± 13.73 9.50 ± 1.1410.19 0.84 93.69 ± 35.72 9.32 ± 3.253.99 1.57 87.60 ± 2.60 8.35 ± 0.373.51 1.37 80.43 ± 4.74 7.55 ± 0.431.88 1.04 60.61 ± 4.55 5.31 ± 0.480.10 0.02 1.06 ± 1.09 0.07 ± 0.07
39.49 2.11 369.08 ± 31.34 38.61 ± 4.8718.98 0.19 117.61 ± 13.26 15.21 ± 1.210.08 0.00 1.68 ± 1.03 0.13 ± 0.080.33 0.00 1.37 ± 0.98 0.14 ± 0.240.00 0.00 0.13 ± 0.21 0.01 ± 0.010.00 0.00 0.13 ± 0.12 0.01 ± 0.01

E. Campos et al. / Bioresource Technology 99 (2008) 387–395 395
The maximum of curve M (Fig. 6) provides an estimateof the total solids concentration value (16.4%) which wouldhave produced maximum methane volume per unit of rawsubstrate. This maximum was obtained with a low methaneyield per unit of COD (155.39 ml CH4/g CODinitial), and itposes the question of the elucidation of the optimal level oftotal solids for the anaerobic digestion of the solid fractionof pig slurry separated by PAM. An approximation of thelevel of total solids for optimal methane production couldbe made by assuming that this must provide the maximumof the product M Æ B. Adjusting M experimental values to asecond degree polynomial model and B to a linear model(Fig. 6), the total solids level that maximises the M Æ B
product is 10.9%. It is interesting to note here that the cor-relations used have no physical or biological meaning, butthey are useful in obtaining a value which could be consid-ered as indicative evidence for a first estimation in a furtherdesign stage.
4. Conclusions
The solid–liquid phase separation process applied to pigslurry is very sensitive to the dose of PAM used as coagu-lant agent. An increase from 12 to 14 g PAM/kg TS iscapable of almost tripling the total solids content of thesolid fraction, reaching a total solids concentration as highas 31% w/w.
The use of a PAM concentration higher than 12 g/kg TSis not recommended for further anaerobic treatment, sincesymptoms of inhibition of the hydrolysis step, probablydue to the strong colloidal aggregation, and of inhibitionof the methanogenic step by free ammonia nitrogen, wereobserved in the most concentrated treatments.
Anaerobic toxicity by PAM, or by its degradation prod-ucts, was not observed for concentrations lower than 415 gPAM/kg TS.
References
Ahring, B.K., Westermann, P., 1988. Product inhibition of butyratemetabolism by acetate and hydrogen in a thermophilic coculture.Appl. Environ. Microbiol. 54 (10), 2393–2397.
Angelidaki, I., Ahring, B., 1993. Thermophilic anaerobic digestion oflivestock waste: the effect of ammonia. Appl. Microbiol. Biotechnol.38, 560–564.
Angelidaki, I., Ellegaard, L., Ahring, B.K., 1999. A comprehensive modelof anaerobic bioconversion of complex substrates to biogas. Biotech-nol. Bioeng. 63 (3), 363–372.
APHA, 1995. Standard Methods for the Examination of Water andWastewater, 19th ed. American Public Health Association, AmericanWater Works Association and Water Environment Federation,Washington DC, USA.
Bonmatı, A., Flotats, X., 2003. Air stripping of ammonia from pig slurry:characterisation and feasibility as a pre- or post-treatment to meso-philic anaerobic digestion. Waste Manage. 23, 261–272.
Bujoczek, G., Oleszkiewicz, J., Sparling, R., Cenkowski, S., 2000. Highsolid anaerobic digestion of chicken manure. J. Agric. Eng. Res. 76,51–56.
Campos, E., Flotats, X., Casane, A., Palatsi, J., Bonmatı, A., 2000.Anaerobic codigestion of pig slurry with olive bleaching earth. IV
Seminario Latinoamericano de digestion anaerobia, Editora Univer-sitaria da UFPE, Recife (Brasil). pp. 57–60.
Caulfield, M.J., Qiao, G.G., Solomon, D.H., 2002. Some aspects of theproperties and degradation of polyacrylamides. Chem. Rev. 102, 3067–3083.
Chang, L.L., Raudenbush, D.L., Dentel, S.K., 2001. Aerobic andanaerobic biodegradability of a flocculant polymer. Water Sci.Technol. 44 (2–3), 461–468.
Chastain, J.P., Vanotti, M.B., Wingfield, M.M., 2001. Effectiveness ofliquid–solid separation for treatment of flushed dairy manure: a casestudy. Appl. Eng. Agric. 17 (3), 343–354.
Chu, C.P., Lee, D.J., Chang, V.B., You, C.H., Liao, C.S., Tay, J.H., 2003.Anaerobic digestion of polyelectrolyte flocculated waste activatedsludge. Chemosphere 53, 757–764.
El-Mamouni, R., Frigon, J.C., Hawari, J., Marroni, D., 2002. Combiningphotolysis and bioprocesses for mineralization of high molecularweight polyacrylamides. Biodegradation 13, 221–227.
Gallert, C., Bauer, S., Winter, J., 1998. Effect of ammonia on theanaerobic degradation of protein by a mesophilic and thermophilicbiowaste population. Appl. Microbiol. Biotechnol. 50, 495–501.
Hansen, K., Angelidaki, I., Ahring, B., 1998. Anaerobic digestion of swinemanure: inhibition by ammonia. Water Res. 32 (1), 5–12.
Hashimoto, A.G., 1986. Ammonia inhibition of methanogenesis fromcattle wastes. Agric. Waste 17, 241–261.
Hill, D.T., Jenkins, S.R., 1989. Measuring alkalinity accurately in aqueoussystems containing high organic acid concentrations. Trans. ASAE 32(6), 2175–2178.
Hill, D.T., Tollner, E.W., 1980. Chemical and physical properties offlushed swine waste after screening. ASAE Paper 80-4056, AmericanSociety of Agricultural Engineers, USA.
ICON, 2001. Pollutants in urban waste water and sewage sludge. Finalreport. Office for Official Publications of the European Communities,Luxembourg.
IPCS, 1985. Acrylamide. Environmental Health Criteria 49. Publicationsof the World Health Organization, Geneva, Switzerland.
Itodo, I.N., Awulu, J.O., 1999. Effects of total solids concentrations ofpoultry, cattle and piggery waste slurries on biogas yield. Trans. ASAE42 (6), 1853–1855.
Kay-Shoemake, J.L., Watwood, M.E., Lentz, R.D., Sojka, R.E., 1998.Polyacrylamide as an organic nitrogen source for soil microorganismswith potential effects on inorganic soil nitrogen in agricultural soil. SoilBiol. Biochem. 30 (8/9), 1045–1052.
Martınez-Almela, J., Barrera, J.M., 2005. SELCO-Ecopurin� pig slurrytreatment system. Bioresource Technol. 96, 223–228.
Møller, H.B., Lund, I., Sommer, S.G., 2000. Solid–liquid separation oflivestock slurry: efficiency and cost. Bioresource Technol. 74, 223–229.
Møller, H.B., Sommer, S.G., Ahring, B.K., 2002. Separation efficiencyand particle size distribution in relation to manure type and storageconditions. Bioresource Technol. 85, 189–196.
SAS Institute, 1989. SAS/STAT User’s guide. Version 6, fourth ed. SASInstitute, Cary, USA.
Sievers, D.M., Jenner, M.W., Hanna, M., 1994. Treatment of dilute manurewastewater by chemical coagulation. Trans. ASAE 37, 597–601.
Soto, M., Mendez, R., Lema, J.M., 1993. Methanogenic and non-methanogenic activity tests. Theoretical basis and experimental set up.Water Res. 27 (8), 1361–1376.
Vanotti, M.B., Hunt, P.G., 1999. Solids and nutrient removal from flushedswine manure using polyacrylamides. Trans. ASAE 42 (6), 1833–1840.
Vavilin, V.A., Angelidaki, I., 2005. Anaerobic degradation of solidmaterial: importance of initiation centers for methanogenesis, mixingintensity, and 2D distributed model. Biotechnol. Bioeng. 9 (1), 113–122.
Veeken, A.H.M., Hamelers, B.V.M., 2000. Effect of substrate-seed mixingand leachate recirculation on solid state digestion of biowaste. WaterSci. Technol. 41 (3), 255–262.
Walker, P., Kelley, T., 2003. Solids, organic load and nutrient concen-tration reductions in swine waste slurry using a polyacrylamide(PAM)-aided solids flocculation treatment. Bioresource Technol. 90,151–158.


