
FeasibilityStudyforPropertyMicroinsuranceExploringtheMarketOpportunityforHousing
andPropertyInsuranceinKenya
June2015
publicversion

i
TableofContentsList of Tables ................................................................................................................................................ iii
List of Figures ............................................................................................................................................... iii
Abbreviations and Acronyms ....................................................................................................................... iv
Foreword ....................................................................................................................................................... v
Executive Summary ...................................................................................................................................... vi
Study Methodology ....................................................................................................................................... x
Organization of the Report ........................................................................................................................... x
1 Kenyan Market Characteristics ............................................................................................................. 1
1.1 Financial inclusion in Kenya .......................................................................................................... 1
1.2 Insurance market .......................................................................................................................... 1
1.2.1 Overview ............................................................................................................................... 1
1.2.2 Insurance penetration ........................................................................................................... 2
1.2.3 Microinsurance market ......................................................................................................... 4
1.3 Property microinsurance .............................................................................................................. 7
1.3.1 Global picture ........................................................................................................................ 7
1.3.2 Kenya picture ........................................................................................................................ 9
1.4 Regulation ................................................................................................................................... 11
1.5 Housing market ........................................................................................................................... 12
1.5.1 Housing segmentation ........................................................................................................ 12
1.5.2 Housing finance market ...................................................................................................... 16
1.5.3 Security of tenure ............................................................................................................... 17
2 Demand‐side insights .......................................................................................................................... 18
2.1 Demand‐side research approach ................................................................................................ 18
2.2 Value and features of homes ...................................................................................................... 18
2.3 Property risk experience and perceptions .................................................................................. 19
2.4 Current risk mitigation strategies and damage recovery mechanisms ...................................... 25
2.5 Insurance perception .................................................................................................................. 27
2.6 Indicative insights on willingness to pay for property cover ...................................................... 29
3 Distributor/aggregator analysis .......................................................................................................... 30
3.1 Banks ........................................................................................................................................... 31
3.2 Microfinance institutions ............................................................................................................ 32
3.3 Savings and credit co‐operatives (SACCOs) ................................................................................ 33
3.4 Mobile network operators .......................................................................................................... 33
3.5 NGOs and civil society organizations .......................................................................................... 34

ii
3.6 Developers .................................................................................................................................. 35
4 Product concepts and potential innovations ...................................................................................... 36
4.1 Property insurance Access Frontier ............................................................................................ 36
4.2 Emerging product concepts ........................................................................................................ 37
4.2.1 Fire insurance linked to housing microfinance ................................................................... 40
4.2.2 “Enhanced credit insurance”: Protecting business and income‐generating property ....... 40
4.2.3 Title insurance ..................................................................................................................... 41
4.2.4 “Home Save‐Improve‐Protect” ........................................................................................... 42
4.2.5 Home business .................................................................................................................... 43
4.2.6 Room cover ......................................................................................................................... 44
4.2.7 Standalone buildings for renters ......................................................................................... 44
4.2.8 Disaster risk ......................................................................................................................... 44
4.2.9 Construction warranty ........................................................................................................ 45
4.2.10 Low cost claims assessor concept ....................................................................................... 45
4.2.11 Portfolio cover..................................................................................................................... 45
4.3 Marketing considerations ........................................................................................................... 46
Conclusions ................................................................................................................................................. 47
References .................................................................................................................................................. 49
Annex 1: Global Standalone Property Products ......................................................................................... 51
Annex 2. Global Credit‐Linked Property Products ...................................................................................... 55
Annex 3. Kenya Standalone Property Products .......................................................................................... 57
Annex 4. Kenya Credit‐Linked Products ...................................................................................................... 59
Annex 5. Stakeholders Interviewed ............................................................................................................ 60
Annex 6. Breakdown of Household Survey Respondents ........................................................................... 61
iii
ListofTablesTable 1: Kenya Insurance Market Key Statistics ........................................................................................... 2 Table 2: Registered Insurance Companies, Brokers/Agents in Kenya .......................................................... 2 Table 3: Insurance Penetration Compared to Other Financial Services, across Demographic Segments .... 3 Table 4: Common Distribution Channels by Product .................................................................................... 6 Table 5: Insurance Penetration amongst Adults per Aggregator ................................................................. 6 Table 6: Insurance Company Challenges around Microinsurance .............................................................. 11 Table 7: Stylized Housing Segmentation for Kenya .................................................................................... 14 Table 8: Profile of Surveyed Owners Living in Urban Permanent Homes .................................................. 19 Table 9: Risks Identified from FinAccess 2013 ............................................................................................ 20 Table 10: Major Coping Strategies for Risky Events ................................................................................... 27 Table 11: Illustrative Loss Economics .......................................................................................................... 29 Table 12: Financial Service Provider Challenges in Housing Lending ......................................................... 31 Table 13: M‐Insurance Challenges .............................................................................................................. 34 Table 14: Summary Overview of Product Concepts ................................................................................... 39 Table 15: Examples of Standalone Property Microinsurance Products (Excluding Kenya) ........................ 51 Table 16: Examples of Credit‐linked Property Microinsurance Products (excluding Kenya)...................... 55 Table 17: Examples of Kenya Standalone Property Microinsurance Products ........................................... 57 Table 18: Examples of Kenya Credit‐Linked Property Microinsurance Products ....................................... 59
ListofFiguresFigure 1: Insurance vs. Other Products (as of 2013) ..................................................................................... 1 Figure 2: Percentage of Adults Covered by Insurance .................................................................................. 3 Figure 3: Percentage Change of Insurance Cover, 2006‐2013 ...................................................................... 4 Figure 4: Microinsurance Value Chain in Kenya ........................................................................................... 5 Figure 5: Types of Housing Structures in Kenya .......................................................................................... 13 Figure 6: Permanent Structures by Income ................................................................................................ 13 Figure 7: Low Income Home Construction Map ......................................................................................... 15 Figure 8: Distribution of (Self‐Reported) House Values from the Survey ................................................... 19 Figure 9: Impact of Risk on Household Income .......................................................................................... 20 Figure 10: Incidence of Property Damage, across Various Properties, from Survey .................................. 21 Figure 11: Cause of Property Damage Actually Experienced ...................................................................... 21 Figure 12: Perceived Biggest Risks to Home ............................................................................................... 22 Figure 13: Differences in Property Loss Experience (Urban/Rural and Structure Quality) ......................... 23 Figure 14: Comparing Cause of Property Loss Experience across Urban/Rural ......................................... 23 Figure 15: Current Coping Mechanisms for Large Household Shocks ........................................................ 26 Figure 16: Property Insurance Access Frontier for Kenya ........................................................................... 37 Figure 17: Property Insurance Proposed Linkages for Kenya ..................................................................... 38

iv
AbbreviationsandAcronyms BFA: Bankable Frontier Associates Catnat: Natural catastrophes cover CIC: Cooperative Insurance Company of Kenya CISF: Center for Innovation in Shelter and Finance CSO: Civil Society Organization FGD: Focus Group Discussion FLEXA: Fire, Lightning, Explosion, Aircraft damage cover FSDK: Kenya Financial Sector Deepening Programme HFHI: Habitat for Humanity International HH: Household HMF: Housing Microfinance IRA: Insurance Regulatory Authority of Kenya KCB: Kenya Commercial Bank MFI: Microfinance Institution MNO: Mobile Network Operators NACHU: National Cooperative Housing Union NGO: Non‐Governmental Organizations SACCOs: Savings and Credit Cooperatives SCBF: Swiss Capacity Building Facility SMME: Small, Micro and Medium Enterprises NHIF: National Hospital Insurance Fund NSSF: National Social Security Fund Exchange rate used: 1.0 USD = 91.4 Ksh. (as of 5 April 2015) Citation: Leach, J., Abrams, J., Yoder, S. (2015). “Feasibility Study for Property Microinsurance: Exploring the Market Opportunity for Housing and Property Insurance in Kenya.” Prepared for the Swiss Capacity Building Facility.

v
Foreword The Kenya Property Microinsurance Feasibility Study is research commissioned by Habitat for Humanity International's Center for Innovation in Shelter and Finance to determine the market opportunity for property microinsurance in Kenya and explore product concepts and distribution opportunities through Kenya Commercial Bank. The study was supported by Swiss Re and implemented by Bankable Frontier Associates (BFA), with funding from the Swiss Capacity Building Facility (SCBF). As a stand‐alone policy, property microinsurance is uncommon in Africa, numbering roughly 0.9 million primary and secondary policies as of 2013.The primary impetus for this feasibility study is assessing the feasibility of insurance strategies that could fill this gap and improve low‐income populations’ access in Kenya to formal risk mitigation solutions for housing and property loss. Ultimately, the goal of the feasibility study is two‐fold – a comprehensive report, employing desk‐based and field research, that:
1. Provides recommendations to Kenya Commercial Bank and other financial service providers
that will lead to developing, pilot testing, and up‐scaling innovative property microinsurance
products that meet the financial needs of low‐income households on a commercially
sustainable basis.
2. Serves as a resource for other development and industry actors who are interested in increasing
property microinsurance penetration in Kenya, offering recommendations to facilitators, such
as Habitat for Humanity International (HFHI), on how best to support Kenya Commercial Bank
and other distribution partners.
Since 1976, Habitat for Humanity International has helped more than 5 million people construct, rehabilitate or preserve homes. In recent years, HFHI has begun exploring ways to catalyze the housing market and improve access to shelter for low‐income households using market‐based approaches. To that end, Habitat launched the Center for Innovation in Shelter and Finance as an initiative to collaboratively work with a wide variety of actors in the private and public sectors. The Center is currently working in Kenya by advising Kenya Commercial Bank and other financial service providers in the design, piloting, and up‐scaling of housing microfinance products.

vi
ExecutiveSummary Financial Inclusion has been growing significantly in Kenya, driven to a large extent by the growth of mobile money subscriptions that grew by 27% in 2013 (Communications Commission of Kenya, 2013). At the same time, the use of informal groups has decreased from 39% in 2006 to 28% in 2013 (FinAccess, 2013). Whilst South Africa has proven that an increase in formal product usage does not displace informal products (FinScope, 2014), this is one indicator that people may be shifting to formal products. Insurance penetration amongst the previously uninsured is increasing as well. However, only 0.5% of Kenya’s adult population has property insurance cover, making it a laggard of financial inclusion. Only the National Hospital Insurance Fund (NHIF) has significant penetration rates, at 16%, followed by life at 1.4%, whilst general insurance products have low levels of penetration with car insurance at 2.7% and private medical insurance at 1.5% respectively (FinAccess, 2013). Overall, property microinsurance is an overlooked component of the microinsurance market (in Kenya and globally) and previous efforts looking at growing the microinsurance sector ignored its potential as a market making product line, rather focusing on life and health. Ex ante, there are solid justifications for focusing on access to property insurance, especially for the poor:
35% of Kenyans reported having lost homes, businesses or property due to fire, flood, theft or
eviction in the last two years, indicating a need that property insurance could address
(FinAccess, 2013).
Lenders lack of willingness to lend in this sector without insurance cover.
Insurers’ unwillingness or inability to expand cover beyond formal, up‐market housing (class 1,
in insurance parlance). In Kenya, some insurers have experimented with more basic formal
housing (class 2), but almost none have experimented with informal housing (class 3), which
comprises the majority (66%) of housing in Kenya.
Banks are already marketing property insurance as part of their primarily up‐market mortgage
lending business, and as a new source of income (commissions).
From the supply side, significant challenges present themselves in shifting the risk appetite of insurers and educating the aggregators and potential clients. In interviews, there was little awareness or evidence of interest in formal property insurance from several of the formal aggregators outside of the main mortgage providers. Existing property insurance and microinsurance products in Kenya include “mortgage insurance” and some standalone or “domestic packages” appealing to a relatively higher income group and credit‐linked products that cover the loan for risk to property. Products between these two ends are mostly non‐existent in Kenya, though there has been some innovative thinking around a “room cover policy” whose underwriting would be based on the number of rooms in a home. Very few of the property microinsurance products have met with any real success in Kenya, although there are some successful examples globally (in South Africa, Philippines and Brazil). Some of the key challenges have been underwriting, claims assessment, lack of data, and a general negative perception of insurance. However, a principal challenge appears to be the lack of effective aggregators/channels to drive growth.

vii
From the demand‐side, Kenyans face significant property risk, real and perceived. However, like most countries, respondents typically underestimate the impact of risk to their property or believe that it won’t happen to them. This is exacerbated by low trust and limited experience with insurance because of the lack of available products. At the same time, we found that, based on the coverage currently offered by insurance companies in Kenya, four out of the five housing risks identified during our research (fire, wind, flood/rain, poor construction, eviction) are insurable. If one includes a “builders’ warranty,” available in other markets, all five of these top risks are insurable. Notwithstanding the sizeable and widespread loss experience, a significant finding from the research is that in most regions, respondents were not expressly clamoring for protection of the primary residence. Most respondents felt that they could mitigate the risk to their housing assets without the need of insurance, instead expressing more concern for protecting income‐generating assets, which may sometimes relate to housing (rental property or home‐based businesses) but more often refers to distinct business assets, such as business premises, inventory, and/or equipment. Many also feel a lack of tenure security (risk of eviction) because of the lack of title deeds. Current coping mechanisms – namely savings and social network support – appear inadequate, especially in the case of large shocks. For savings, the amount may be inadequate to finance a full recovery from the loss, and depleting savings may expose the household to harsher shock if other emergencies arise. The social network can be a powerful coping mechanism but it can also act slowly; not everyone is covered by a giving network; “net givers” are penalized and could descend into poverty; and the size of the risk pool may be too small for extreme shocks (requiring bigger contributions than can be provided). There is potential to grow the market from its low level of 0.5% penetration by just focusing on the currently insurable properties (permanent housing structures), which comprises 34% of all housing stock. If one also extends property insurance coverage to middle‐ and upper‐income segments who live in semi‐permanent properties, property insurance could reach 40% of Kenyans, a huge increase from the current base of 0.5%. Section 4 sets forth ten product concepts, four of which we mention here as concepts most compelling to develop, pilot and hopefully upscale with lenders given the findings presented here. Fire insurance linked to housing microfinance (HMF); Enhanced credit insurance linked to micro business loans; Title insurance; “Home Save‐Improve‐Protect.”
Overall, enhanced credit insurance is the lowest hanging fruit for reaching scale. The other concepts, whilst valid, have potential but are more likely to be complicated as they will challenge existing orthodoxy (e.g. renters’ insuring their landlord’s property) or require significant effort to build out last mile capabilities (low cost claims assessor model). Distribution is a key challenge. Of all potential distribution channels, banks, MFIs, and SACCOs are at the forefront, with banks offering the most potential at the moment. Formal borrowers (those with loans from banks, SACCOs or MFIs) are much more likely to have insurance than the general Kenyan population. Much of this dynamic may reflect the nature of compulsory credit insurance associated

viii
with many loans. Nevertheless, it represents an opportunity for lenders to either cross‐sell additional optional covers or to increase the covers included on a compulsory basis. However, our research indicated that borrower experience with compulsory insurance is not fully appreciated, and it is seen primarily as a cost, not a benefit, in part signifying that it requires better explanation before anyone intentionally seeks more optional coverage. Thus, it is important for insurers and lenders to work together to improve the customer education and product marketing associated with current policies. For lenders who are well integrated in the housing market, property microinsurance represents an opportunity to expand their (housing) bancassurance portfolio and position themselves as a leader in an, until now, overlooked part of the housing and insurance markets. Key to successfully expanding the microinsurance market is awareness and understanding of the benefits. To accomplish this, tangible benefits for the policy holder and marketing and consumer education are important. This is particularly true for property microinsurance because it is not seen as the “anchor” risks that health and life insurance are. An example of making the product tangible comes from MicroEnsure, who offers cash payouts to borrowers who experience property damage, in addition to paying off the loan. Adding fire coverage to other primary policies is another example. Fire was cited as a prominent risk in the demand‐side research, even though fire incidence is relatively low. The knowledge that the borrower is covered in the event of a fire can be a solace, and small enhancements like this can increase awareness of the benefits of property insurance. This is demonstrated by MicroEnsure’s healthy claims ratios for its products, solid evidence of utilization. Consumer education and marketing are also essential to raising awareness among potential consumers. Marketing considerations include:
Bundling: desire for combining savings with insurance as well as broader, multi‐risk, composite products.
Social network dynamics: this is a key informal loss recovery mechanism, which makes one consider designing insurance products around this social dynamic.
Partner with local trusted stakeholders.
Give something tangible back even when there is no loss (to make it more like a savings mechanism or a reward for good performance).
Include fire in all offerings, as that is the largest perceived risk. Conclusions
• Globally, property microinsurance has not received significant attention and yet there is growing evidence that the property that people have is worth insuring – a risk event can destroy not only one’s shelter and contents but also one’s livelihood given the number of small businesses that are run from home.
• Kenya has the conditions in place to test the potential for property insurance – a growing market, increasing wealth, significant demand for affordable housing, some evidence of innovation around enhanced credit insurance, and the world’s leading market for mobile financial services.
• However, there remain significant challenges to growth in this sector: the insurance market remains profitable in the upper income segments, but awareness of insurance appears generally

ix
low in general and specifically for property microinsurance. Even the aggregators are not focused on this product line.
• The demand‐side research offers some mixed signals. Households report significant property loss experience, from a range of risks (fire, flood, theft, eviction) to both housing and business property; and they rely on some existing coping mechanisms, such as personal savings or social networks, which help but fall short of optimal mitigation. Despite this risk and coping gap, most respondents were not clamouring for housing protection, but rather tended to voice greater concern (demand) for protection of income‐generating assets, such as business property or rental property.
• Some viable property microinsurance concepts and products surfaced in the course of research, including credit insurance enhancements for property risk, title insurance, and bundling property cover with savings products and other services. These offer potential to increase outreach, although the challenge of marketing a more complex product remains.
• Formal lenders, in particular banks, are important distributors for the affordable housing market and have significant scope for achieving scale with property microinsurance products.

x
StudyMethodology The findings and recommendations were developed based on the following methodology:
1) Supply‐side research into property microinsurance in Kenya, characterizing the existing regulatory environment, actors, and support services and infrastructure. This included desk‐based research and interviews with various actors, including insurance companies, regulators, intermediaries, developers, and mobile network operators.1 We also analyzed the data from an unpublished survey of the microinsurance market, commissioned by the Kenya Financial Sector Deepening Programme (FSDK). This was supplemented by a global review of property microinsurance products consisting of secondary research and an online survey of insurance stakeholders.
2) Demand‐side research with households to explore the property risks these families face, how they cope with shocks, and their demand and willingness to pay for property microinsurance. As part of this, researchers conducted qualitative research with potential customers through 18 focus group discussions with 123 respondents in eleven areas across five former provinces. Additionally, researchers conducted a purposive, household survey with 197 respondents in the same areas to complement the findings from the focus group discussions. We were also given access to and analyzed the nationally representative 2013 Kenya FinAccess survey for relevant housing, finance, and insurance findings. Finally, authors reviewed and incorporated conclusions from the Financial Diaries research, commissioned by FSDK and carried out by BFA, looking into the risks low‐income households face and their coping strategies. The findings from the primary research were complemented with secondary sources.
3) Concept formulation based on the findings from the supply‐ and demand‐side research. A menu of potential property concepts were submitted for feedback from stakeholders and one of the most promising concepts was tested through further focus group discussions with Kenya Commercial Bank clients to explore its acceptance with potential clients.
OrganizationoftheReport The feasibility study report is structured as follows. First, the Kenyan market characteristics are outlined, including a detailed look at the current insurance market and an overview of the housing market. Next, the report presents key findings and insights from our demand‐side research. Then the report covers potential aggregators and distribution channels, which is a key element for a scalable and sustainable business case for any insurance product rollout. Finally it introduces emerging product concepts and potential innovations. The annexes provide supplemental information.
1 Annex 5 includes a list of all stakeholders interviewed.

1
1 KenyanMarketCharacteristics
1.1 FinancialinclusioninKenya For previously excluded households in Kenya, financial inclusion—or the state of having access to a full suite of quality financial services—has expanded in a short time. The FinAccess 2013 survey shows that 67% of adults use some form of formal financial services, compared to 41% in 2009. The use of combinations of formal prudential, non‐formal prudential and informal products has risen from 16% in 2006 to 25% in 2009 to 29% in 2013. Growth in insurance access has been a contributor to this growth. Figure 1: Insurance vs. Other Products (as of 2013)
Source: FinAccess 2013
Financial inclusion has been driven to a large extent by the growth of mobile money subscriptions, which grew by 27% in 2013 alone (Communications Commission of Kenya). At the same time, the use of informal groups has decreased from 39% in 2006 to 28% in 2013 (FinAccess, 2013). While South Africa has proven that an increase in formal product usage does not necessarily displace informal products, this is one indicator that people’s financial appetites may be shifting to more formal products.
1.2 Insurancemarket
1.2.1 Overview
The insurance market in Kenya is one of the largest in Africa, mainly focused on corporate and asset markets (Swiss Re, 2014). But though Kenya has a sophisticated insurance market, insurers have very little incentive to go down market, as the current market is relatively uncontested and profitable despite evidence of “cannibalistic competition.”2 In terms of total insurance premiums, the market for both
2 Cannibalistic competition can refer to a situation in which firms fight for their share of the existing market by undercutting each other, as opposed to expanding the market to new segments. As Smith et al. (2010) notes, in the Kenya insurance market, the reason for this could be due to both a lack of familiarity with the retail market and distribution challenges and the fact that there are still profits to be made in the corporate and high end market.
17.2 19.7
61.6
9.8 10.63.1
21.4
3.6 4.0 1.6 3.8 1.8 2.7 0.5 1.5 1.4
15.69.6%
of Adults

2
general and life insurance3 is widely distributed with no dominant market leader. Within the existing market, Equity Insurance Agency and MicroEnsure have acted as disruptive innovators as they have made considerable inroads in a short period of time, with Equity becoming the country’s second largest broker and MicroEnsure successfully scaling up its microinsurance products within a few years of launching.
Table 1: Kenya Insurance Market Key Statistics
2006 2009 2013 CAGR
Insurance penetration (% of adults) 5.9 6.8 17.3 14%
Gross premiums (Kshs Billion) 41.7 64.5 130.7 15%
Ratio of general to long term gross premiums
70 to 30 67 to 33 66 to 34 Slight growth in Long Term vs General
Net claims (Kshs Billion) 21 31 63 15%
Total assets (Kshs Billion) 110 165 359 16%
Total liabilities (Kshs Billion) 83 131 279 16%
Profitability before tax (Kshs Billion) 6 6 18 15%
General business claims ratio 61% 62% 59% ‐0.42%
Source: Association of Kenya Insurance, Insurance Industry Reports (2006, 2009 and 2013)
From 2006 to 2013 there has been significant growth in premiums and profitability (both showing a compound annual growth rate of 15%, see Table 1) despite the presence of a contested market with over 48 insurers (Table 2). However, while there were significant new entrants in long term insurers (18), there has been a decline in general (‐9) and composite (‐4) insurers.
Table 2: Registered Insurance Companies, Brokers/Agents in Kenya
2006 2009 2013 Change
Registered insurers 43 44 48 5
Long term business 7 10 25 18
General business 21 20 12 ‐7
Composite insurers 15 14 11 ‐4
Registered reinsurance companies 2 2 5 12
Registered brokers 197 156 187 ‐1
Registered agents 2633 3644 4631 7 Source: Association of Kenya Insurance, Insurance Industry Reports (2006, 2009 and 2013)
1.2.2 InsurancepenetrationDespite high levels of innovation, insurance take‐up significantly lags the use of other financial services –
such as savings, payments and credit – as shown in Table 3 below – especially outside the typical target markets of the wealthy, employed, and well educated.
3 General insurance, such as property and casualty insurance, is generally defined as any policy not determined to be life insurance. Long-term or life insurance is a contract between the insurer and insured whereby payment is made upon the death of the insured.

3
Table 3: Insurance Penetration Compared to Other Financial Services, across Demographic Segments
Gender/Rural/Urban Transactions Savings Credit Insurance
Male 68% 56% 28% 21%
Female 60% 60% 29% 14%
Rural 57% 55% 26% 11%
Education level
None 23% 31% 13% 2%
Primary 61% 58% 27% 9%
Secondary 81% 68% 33% 24%
Tertiary 96% 77% 50% 64%
Livelihood
Agriculture 62% 61% 31% 14%
Employed 86% 70% 36% 42%
Own business 74% 61% 29% 17%
Dependent 45% 35% 13% 11%
Other 54% 40% 17% 9%
Wealth
Wealthiest 90% 73% 40% 45%
Second wealthiest 82% 69% 35% 23%
Middle 63% 63% 27% 11%
Second poorest 54% 54% 26% 5%
Poorest 30% 32% 15% 3% Source: FinAccess 2013
Low levels of insurance coverage notwithstanding, the number of adults with insurance has increased
significantly since 2009 (blue line in Figure 2 below), although there may be some underreporting of NHIF in FinAccess 2006 and FinAccess 2009. It is notable that premiums as a percentage of GDP have not kept up that pace (see red line in Figure 2 below).
Figure 2: Percentage of Adults Covered by Insurance
This dramatic increase of insurance penetration in the past 5 years is driven by the National Hospital Insurance Fund (NHIF) – the primary provider of health insurance in Kenya. Property insurance remains
negligible and relatively constant at 0.5% in both 2006 and 2013 (Figure 3). Credit life insurance is typically underreported in surveys but is likely to be higher as it is a typical requirement of most lenders.
5.9% 6.8%
17.3%
2.5% 2.8% 3.5%
2006 2009 2013
% of adults
premiums as% of GDP
Source: FinAccess (blue line data); extrapolation of data from Table 2 above (red line data)

4
Figure 3: Percentage Change of Insurance Cover, 2006‐2013
Source: FinAccess 2013
1.2.3 MicroinsurancemarketFor the purposes of this study, microinsurance has been broadly defined as insurance that offers protection against specific perils to under and uninsured individuals and businesses. There have been innovations in the microinsurance space in Kenya, but it still remains largely under‐developed. Outside of Equity Insurance Agency and MicroEnsure, a few novel products have been introduced, such as agricultural index insurance, Safaricom’s Linda Jamii (a mobile insurance product), some experimentation by Yu Mobile (with MicroEnsure before Yu Mobile exited the market) and Cooperative Insurance Company of Kenya, but there have been no notable successes. A conservative estimate in 2010 for the Kenyan voluntary microinsurance market was 150,000‐200,000 policyholders. Adding in the users of formal credit life insurance policies increases the number to 700,000 (Smith et al, 2010). While there is some penetration into the low‐income market, insurance usage mostly picks up at income levels of US$ 530 and higher (ibid). The National Hospital Insurance Fund (NHIF) has been the main driver of growth for microinsurance in Kenya. A survey commissioned by the Kenya Financial Sector Deepening Programme highlighted that microinsurance gross premiums make up only approximately 1% of the insurance industry gross premiums in the country. NHIF, which is government‐sponsored, makes up approximately 70% of those microinsurance gross premiums (Garand, 2013). The Garand survey also demonstrates the challenges in addressing willingness to pay and affordability for microinsurance clients. The average annual premium per policy is Kshs. 1,817 (USD 20), with a range of between Kshs. 65 to Kshs. 8,012 (USD 0.7 to USD 89). While willingness to pay is difficult to estimate, the Garand survey calculated it as 2% of income, with health insurance taking up the bulk of this. Garand also noted that claims ratios were concerning. Garand reports that NHIF claims ratios were relatively high (reportedly, exceeding 100%, although certain NHIF data suggests it was closer to 60%) while the remaining ratios were reportedly very low (less than 20%). These low claims ratios could be
1.1%1.9%
0.5% 1.0% 1.4%2.8%
1.4% 1.5%
15.6%
2.7%0.5% 1.2%
2.6%
9.6%
0.0%2.0%4.0%6.0%8.0%
10.0%12.0%14.0%16.0%18.0%
2006
2013

5
indicative of low awareness of the product on compulsory credit life products, cumbersome exclusions and claims processes, or poor client value.
Sources: Adapted from CENFRI 2009, Garand 2013
Mapping the microinsurance value chain for Kenya reveals a range of stakeholders at each level (Figure 4). Distribution of microinsurance products is perhaps the single most important challenge in taking any product to scale. Garand notes a variety of distribution channels currently being used (Table 4), but there is no pattern or one method proven to be most effective in Kenya at the moment. Banks, SACCOs, and microfinance institutions offer the most potential and have already proven successful in distributing insurance products (Table 5). Individuals with bank accounts present the biggest immediate opportunity for microinsurance, because they are more easily accessible for debit order deduction through bank accounts, providing an easy premium collection mechanism (Smith et al, 2010). See section 3 for more discussion of potential distributors/aggregators.
Reinsurers Insurers Administrators Transaction platforms
Aggregator Clients
Technology
Intermediation channel
Kenya Reinsurance, Continental Re, Africa Re, East Africa Re, ZEP Re (PTA
Re)
NHIF, Apollo Life, CIC, BRITAM, ICEA Lion, Kenya
Orient, UAP, APA,
Madison
Micro Ensure
Mpesa, Payroll
Deductions, Cash
Premium Financing & Aggregators
Clients
MFI’s, SACCO’s, NGO’s, Local Retailers, Bus companies, MNOs, Agents, Brokers & Banks
Examples
Figure 4: Microinsurance Value Chain in Kenya

6
On a related note, the promise of highly developed transaction platforms, such as M‐Pesa, has not been converted into any notable insurance progress. These transaction platforms have for some time offered bill payment functionality to facilitate collections and claims payouts, but the lack of clear marketing initiatives or strategic ownership by the mobile network operators (MNOs) have often limited their impact in the microinsurance space. Table 4: Common Distribution Channels by Product
Product type Common distribution channels by product
Accident and Disability Penetration is reasonably high for voluntary products but likely understates credit life penetration
Credit Life High penetration likely unregulated
Health (non NHIF) High penetration likely unregulated
NHIF Organized groups, foundations, religious organizations, MNOs, charitable organizations. Etc.
Bundled products Brokers, welfare groups registered by Ministry of Gender
Last Expense Welfare groups
Source: Garand 2013 Table 5: Insurance Penetration amongst Adults per Aggregator
Aggregators Membership Insurance penetration Comments
Banks 29% 15% Penetration is reasonably high for voluntary products but likely understates credit life penetration
SACCOs 9.6% 19% High penetration likely unregulated
MFIs 3.5% 10% High penetration likely unregulated
Total 27% 44%
Source: Adapted from FinAccess 2013
A few relevant issues not noted above include:
1. Definition: Previously, there was no consistent industry or regulatory definition of
microinsurance, though this has changed with the 2014 microinsurance policy framework paper
from the Insurance Regulatory Authority (IRA) of Kenya. In this paper, microinsurance products
are defined by their features, though not yet by premium or coverage amount.
2. Case‐by‐case exemption for bancassurance: Previously, a case‐by‐case exemption approach
was used for banks wanting to offer insurance products, because the Banking Act placed
significant restrictions on bancassurance. 4 This has been addressed with recent legislation,
4 Bancassurance refers to an arrangement in which a bank and an insurance company form a partnership so that the insurance company can sell its products to the bank's client base. Bank staff are the point of contact for insurance customers and are supported by the insurance company through product information, marketing campaigns and sales training.

7
allowing financial institutions (including banks and deposit‐taking microfinance institutions) to
offer insurance.5
3. Price and expenditure controls: The regulatory environment has capped management expenses
and commission caps. This has been flagged as a potential deterrent to innovation and research
and development.
4. Annual premiums reduce affordability: Premiums are typically pre‐paid on an annual basis. This
may be suitable for low‐income individuals with seasonal income but it is not ideal for the
working‐poor who rely on small sums of money on a periodic basis. However, we are seeing
insurers offer monthly premium payment options, which addresses this challenge.
For continued discussion on the potential to expand the current property insurance market, see section 4.1.
1.3 Propertymicroinsurance
1.3.1 GlobalpictureGlobally, property microinsurance has not had significant success, although a range of products have been experimented with. These products include enhanced credit insurance6 that offers property protection as a secondary cover, first loss or agreed sum cover,7 and parametric (index‐based) insurance that covers homes from large‐scale natural disasters. Property microinsurance products in the market offer an assortment of protection, including from FLEXA (fire, lightning, explosion, aircraft), theft, natural disasters, and general liability. Personal accident and death covers are often bundled with these. Property microinsurance in Africa is modest in absolute terms, though it has grown significantly since 2008. As a standalone policy, it remains small: 280,000 as a primary cover, and as a primary and secondary cover it is 870,000,8 mostly protecting against fire and natural disasters. Nearly 70 percent of all property products are offered as an add‐on to other products, namely enhanced credit life policies. The majority of property products are group products.9 Distribution of these property products was mainly through brokers, which may be due to the complexity of the product or lack of experimentation with alternative distribution channels (McCord et al., 2012). Outside of Africa, property microinsurance remains a small portion of total lives covered by microinsurance policies.
5 For the updated policy on bancassurance, see the Kenyan Insurance Regulatory Authority publication, “Guideline to the Insurance Industry on Bancassurance” available at www.ira.go.ke/. 6 Traditional credit life/insurance products pay off the loan balance in the case of the borrower’s death, disability and in some cases unemployment, while enhanced products may offer additional protection such as funeral expenses and property destruction. 7 First loss or agreed sum insurance is a type of property policy that provides partial insurance. In the event of a claim, the policyholder receives an agreed amount that is typically less than the full value of the damaged or lost property. 8 The primary cover is the main protection offered by an insurance policy (protection against loan default in the case of death of borrower). Secondary covers refer to add-ons or riders to the main insurance policy (example, optional fire coverage). 9 Group policies are when insurers assess the profile of groups rather than of individual policyholders. Underwriting is less costly in time and money as a result, but the policies are short term by default.

8
In Asia and Oceania, there were 1.1 million property policies, covering 7.7 million lives, in 2013,
representing 1.5% of all policies in force. Rather than insuring for a particular type of risk such as
fire, theft, or natural disaster, the focus is typically on insurance of possessions, regardless of
what caused the damage (Mukherjee, 2013).
In Latin America and the Caribbean, property is the smallest overall cover as well, with 2.9
million lives covered. Seventy percent of this is from two products in Brazil that offer household
insurance as a secondary cover (McCord et al., 2013).
Standalone property microinsurance products10 are available globally (see Annex 1) but most are niche products, with the exception of a few in South Africa and Brazil that have achieved some scale (i.e. more than 10,000 policies per year). These products are recent experiments, having debuted since 2008. Many of these products exclusively protect small business property. Distribution of these products is split between agents/brokers and retailers, with retailers the chosen scheme for the successful products in South Africa. Most of the products cover both building and contents and the sum assured generally ranges between 800‐10,000 USD. Premiums are between 2 to 15 USD monthly and terms are typically annual. The most frequent rider attached is funeral insurance/last expense. Enhanced credit life or credit‐linked products that offer property protection as a secondary cover are much more widely available than standalone products and have achieved greater. This is likely due to the technical simplicity of rolling it out and the fact that is already widely available from most insurers. Many lending institutions also find it easy to implement because it fits within their existing loan cycle and uses the client data that they collect on their loan application—although the “enhanced” portion of credit life products often place additional administrative requirements on the institution, such as notifying the insurer of the property’s location and names and ages of a borrower’s spouse and children. Annex 2 presents a small sample of some of these products, with the oldest one dated to 2004, a Philippines product that reached a million policies in the first year (see Box 1).
10 Standalone products are voluntary insurance policies whose primary cover is for the house or property. Unlike credit life, they are not linked to a loan product.
Box 1: CLIS Philippines
As an example of a successful microinsurance product offering property protection, CLIS partnered with Malayan Insurance Co. in 2004 to offer personal accident coverage in the Philippines with a product called Alagang Cebuana. It was distributed through Cebuana Lhuiller Pawnshop, a well‐regarded national chain. In 2008, the product was redesigned and renamed Alagang Cebuana Plus, offering additional house cover against fire. The change was made to accommodate clients who were living in shanty towns and had limited access to property insurance. Policy holders purchase the coverage in the form of certificates, paying 25 pesos ($0.62 dollars) for each, and receive up to 20,000 pesos ($500 dollars) in personal protection and 5,000 pesos ($125) in fire assistance. Clients may buy up to five certificates at a given time to increase the claims pay‐out. Policy‐holders also have access to Doc Cebuana, a rider that allows them free telephone consultations with doctors. The product is not compulsory, and while many of the policyholders are pawnshop customers, non‐clients of the pawnshop can also opt to buy it independently, from any other financial service provider. In the first year, a million policies were sold. By 2013, CLIS was selling 12 million policies per year. Since certificates last for four months, CLIS has three to four million active policies running during any given month.

9
As with the standalone policies, there is an emphasis on microenterprise cover, but there are examples focused solely on domestic/household protection. MicroEnsure, a specialist insurance intermediary and underwriter, has rolled out an innovative eviction cover in Ghana (and Kenya) that protects market traders in the case of government eviction. Parametric or index‐based disaster covers are also offered, with some scale achieved in the case of Haiti before it ultimately proved financially unsustainable. Because these products are credit‐linked, they are distributed almost exclusively by banks and MFIs, though the Philippines example is distributed by pawn shops. The sum assured is typically the loan balance, though Guatemala potentially offers an example of a product whose sum assured varies based on the quality of construction (potentially, because it is unclear whether this is also a standalone policy). Underwriting relies on a combination of client self‐assessments, area based market studies, randomized inspections, visits to similar properties or geographies, and brief visual inspections and sign offs by the insurer. Claims assessment uses ownership documents, pictures taken by insurer, and self‐assessment by the client. Many insurers will ask for a death certificate or police report, but these requirements can frustrate policyholders, as they are often expensive and take significant time and effort to obtain.
1.3.2 KenyapictureThe property insurance picture in Kenya generally tracks the global picture. Credit life policies with property covers as riders are more widely available and, in some instances, have achieved scale, as MicroEnsure has done with its enhanced credit insurance product. (See Annexes 3 and 4 for tables summarizing a sample of these products). Insurance cover for FLEXA (fire, lightning, explosion, aircraft) and burglary are available, along with damage resulting from political violence, a cover that has risen to some prominence following the wide‐spread violence of the contested 2007 presidential election. These are usually secondary to death and disability covers in the case of credit insurance products, and in the case of standalone can be bundled with other protections. Standalone products are more expensive than credit linked or bundled products and have not experienced significant take up. Garand (2013) notes that the average annual premium for standalone products was Kshs. 16,087 (US 170), which compared with Kshs. 811 (US 8.70) for credit linked products and Kshs. 954 (US 10.25) for bundled products (life, health, accidental death and property). A feature of most of the standalone insurance products is that the policyholder is required to pay the entire premium in one installment for the year. As noted before, this is an issue due to the high cost, particularly for the informal sector, where cash flow is often erratic. Overall, we identified the following categories of property insurance:
Credit linked products: Nearly every insurer we interviewed indicated they offered credit linked
products that did or could cover death and disability.
“Enhanced” credit linked products: Accident, retrenchment, burglary, political violence, and fire
can be added to credit insurance policies. There are also examples of products offering cash
payout for property destruction or covering spouse and children, as was demonstrated by CLIS
Philippines in Box 1. Uptake seems to be highest in the microbusiness/market trader market.
The claims process has also been simplified to a remarkable degree, with all claims initiated at the pawn shop where the policy was purchased. Source: Tyler Tappendorf et al. (2014). “Scale: Thinking Big ‐ Case Studies.” MicroInsurance Centre. Available at http://www.microinsurancecentre.org/.

10
Distribution is mainly through banks, MFIs and SACCOs, with some also distributing through
welfare groups.
Standalone property and “domestic packages”: Policies mostly cover business buildings and
contents (in one instance, focused specifically on Safaricom M‐Pesa agents) and domestic
packages that cover household contents. Some of these are bundled with death and disability
protection for the policy holder and family members. The sum assured typically ranges between
10,000‐50,000 Kshs. (100‐550 USD) for each cover. Uptake appears to be limited, and while
insurers indicate that these products could be taken down market, there are no real examples of
this occurring. Agents and brokers of the insurance agency or bank are the main distribution
channels.
Compulsory mortgage insurance products: Approximately 20,000 policies are in force. KCB and
Housing Finance dominate this market but the premiums are significant and focused on the
upper end market.
There are also some examples of innovative products—some with property covers—currently available or proposed for the future:
“Decongestion” product: Covers losses due to the government bulldozing structures deemed
illegally built (MicroEnsure)
Linda Jamii: m(obile)‐insurance, health cover distributed through Safaricom
An Airtel (MNO) microasset product (in development at time of interviews)
Bus/Matatu insurance: passengers covered for medical expenses in case of accident, included
in the price of a ticket
“Bedroom cover” concept: Underwriting based on the number of rooms in the house,
simplifying the process (previously discussed at APA)
Embedded product in bank account, covering life, accident, medical (also still a concept)
During stakeholder interviews undertaken as part of the study, a few respondents indicated that property insurance claims ratios are low. However, Garand (2013) found that the claims ratio for property microinsurance products had increased from a low of 16% to 40% demonstrating increasing utilization, which is a promising trend, mostly driven by the success of MicroEnsure’s products. It compares to 32% for all credit life products with a slightly worrying 82% for all bundled products, which may not be sustainable. Insurers are becoming more innovative in determining the value of the property to be insured as they try to avoid the expense of an assessor. For example, one insurer had plans to estimate cover based on the number of rooms in the house, agents take photos of the structure or even make random assessments and brief visual inspections. Claims assessment for many of the products can require a police report, claim form, passport/identification card, and invoice, potentially making it difficult for policy holders to receive a benefit in the case of loss or damage. Stakeholder interviews for this study found that Kenyan insurers faced a range of constraints and risks in offering microinsurance generally and property microinsurance specifically.

11
Table 6: Insurance Company Challenges around Microinsurance
Source: Stakeholder interviews
1.4 RegulationThe Insurance Regulatory Authority (IRA) is the regulator with responsibility for the insurance sector in Kenya. It is somewhat unique as a regulator due to its developmental focus, where it has a mandate to grow the market. Supported by the global focus on increasing access to insurance by the IAIS (the insurance standard setting body) and its microinsurance implementing arm, the Access to Insurance Initiative (A2ii), it creates a very open agenda for engagement and a model for other regulators and supervisors.
Constraint/ risk Details
Distribution ‐ Outside of lenders, distribution is a challenge
Cost of intermediaries
‐ Intermediaries, while improving efficiency of distribution and administration, add costs to the product
Affordability of premium
‐ Premiums are typically pre‐paid on an annual basis, not ideal for the working‐poor who rely on small sums of money on daily, weekly or monthly basis. As of yet, it is difficult to bring down premiums to a point that is affordable to the broader populace while still offering benefits.
Administration ‐ Manual process often used ‐ Rigorous Know Your Customer rules ‐ Processes/systems used for traditional insurance products don’t accommodate microinsurance well (for example, photos can’t be stored in main system, composite products not easily accommodated)
Small risk pools ‐ Limited take off has lessened the potential viability
Internal analysis capability
‐ No evidence of “mining” internal data to go down market/target other potential clients
Data ‐ None of the stakeholders claimed data was a problem but there is reason for scepticism on this point
House affordability ‐ Lack of supply of housing below 5 million Kshs. is a challenge
Housing segmentation
‐ Existing insurance practice in the Kenyan market is to limit coverage to permanent structures (“class 1” and “class 2” structures made of stone, concrete and/or brick walls, with roof of iron, tin or tile). This leaves the majority of housing in Kenya “uninsurable” (see Figure 5).
Underwriting/claims assessment
‐ Traditional property underwriting procedures are too costly for a microinsurance product. Kshs. 35,000 to 45,000 is the cost of typical property assessment.
Rental property ‐ Rental property occupies a big grey area. There are many renters in Kenya, potentially with insurable interest in the (primarily uninsured) buildings, but most insurers said they wouldn’t cover rental property except for contents
Documentation ‐ Especially for contents, no record of household goods or business inventories when claim is submitted ‐ Police not reliable “verifiers”
12
During interviews, regulations were not cited as a pressing constraint in the microinsurance market, although Know Your Client rules11 and the lack of clarity around bancassurance were mentioned as a cause for concern. For example, the Central Bank had previously limited bancassurance although, pending the release of new legislation, they had issued case by case exemptions to banks and deposit taking MFIs to support insurance. The new Kenya Microinsurance Policy Paper and revised Insurance Act potentially support the development of an enabling environment with some work already being undertaken on consumer recourse. Property insurance was not identified by the IRA as a priority; they have focused on the “anchor products” of life and health as identified by Cenfri in their 2010 study (Smith et al., 2010). Furthermore, the IRA released a circular to enact key parts of the new microinsurance policy framework without requiring new legislation. This circular covers 1) the definition of a microinsurance product, 2) the product application process, 3) information and communications technology, 4) microinsurance agent licensing, and 5) use of aggregators and relation to underwriters. Clearly the regulatory framework is still evolving, which creates risk around how it may be implemented, as the following examples demonstrate:
• Caps on commission will act as an inhibitor to the development of the market. • Know Your Client rules still appear to be implemented in insurance even though microinsurance
products should be below the threshold. • Requirements that the premiums need to be received by the underwriter for insurance to be in
force undermine the potential for alternative distribution. • Lack of focus on in‐kind funeral benefits (funeral parlors) both creates risk of abuse as well as
undermines potential to grow the market – in many countries, funeral parlors are a large provider of (illegal) insurance.
• Questions remain around regulatory coordination between IRA, Central Bank (critical for bancassurance and mobile money) and the telecoms regulator (for mobile‐insurance). As new m‐insurance models12 roll out, joint supervision or sharing of information will be required to manage the risk of fall‐out should they collapse, as happened in Zimbabwe where 20% of the adult population lost their cover overnight due to a court dispute.
1.5 HousingmarketKenya, like many other African countries, combines a large demand for housing with chronic undersupply of formal housing. According to the Housing Strategic Plan 2008‐2013, the housing sector is characterized by inadequate affordable housing and expansive slums and informal settlements. It is estimated that out of a total 150,000 housing units required annually in urban areas, only 35,000 units are produced. The shortage of housing for low income households is particularly acute in urban areas, with only 20% of houses constructed for this group.
1.5.1 HousingsegmentationFor purposes of the study, the housing market was segmented by:
Type of structure (permanent, semi‐permanent, traditional or temporary);
11 Know Your Client refers to the process of a business verifying the identity of its clients. These policies are put in place to prevent identity theft, financial fraud, money laundering and terrorist financing but present obstacles to the poor who often cannot easily obtain the required documentation. 12 M-insurance is any insurance policy offered through and/or by mobile network operators to its customers. It is widely seen as having potential to greatly scale up access to insurance.

13
Monthly household income of the resident; and
Location (urban, rural). Figure 5 below provides an overview of the Kenyan housing market, highlighting that 34% of Kenyans live in permanent structures, with 47% in semi‐permanent. 13 This is a significant data point because existing insurance practice in the Kenyan market is to limit coverage to permanent structures (class 1 and 2 in insurance parlance), which means that at least 34% of properties are insurable despite the fact that only 0.5% are currently covered. Figure 6 applies a household income filter to the 34% of Kenyans who live in permanent structures, showing that most of these residents have a household income below Ksh. 15,000 (“lower income”). So, despite the fact that they reside in permanent structures, there remain some challenges—such as affordability—to extending cover to this segment. Understandably, most (around two thirds, according to FinAccess 2013) of the 0.5% of the population who have cover are in the upper income segment (above Ksh. 25,000 monthly household income). Figure 5: Types of Housing Structures in Kenya
For this feasibility study, researchers developed a simple segmentation that covered the different types of properties in the market.
13 Here, a permanent structure is roughly defined as stone, concrete and/or brick walls, with roof of iron, tin or tile; a semi-permanent structure has timber or mud wall with an iron roof; a temporary or traditional structure typically has timber, mud and/or dung walls, with roof of grass thatch, leaves, branches, or sticks.
Figure 6: Permanent Structures by Income
14
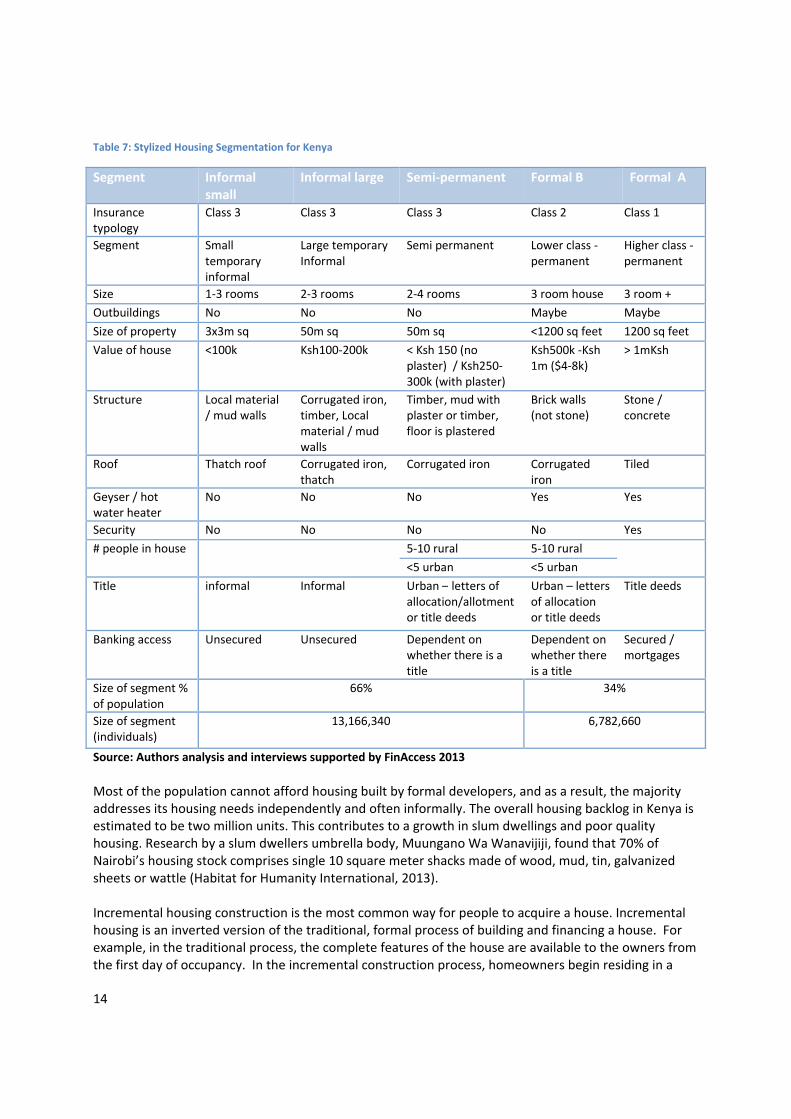
Table 7: Stylized Housing Segmentation for Kenya
Segment Informal small
Informal large Semi‐permanent Formal B Formal A
Insurance typology
Class 3 Class 3 Class 3 Class 2 Class 1
Segment Small temporary informal
Large temporary Informal
Semi permanent Lower class ‐ permanent
Higher class ‐permanent
Size 1‐3 rooms 2‐3 rooms 2‐4 rooms 3 room house 3 room +
Outbuildings No No No Maybe Maybe
Size of property 3x3m sq 50m sq 50m sq <1200 sq feet 1200 sq feet
Value of house <100k Ksh100‐200k < Ksh 150 (no plaster) / Ksh250‐300k (with plaster)
Ksh500k ‐Ksh 1m ($4‐8k)
> 1mKsh
Structure Local material / mud walls
Corrugated iron, timber, Local material / mud walls
Timber, mud with plaster or timber, floor is plastered
Brick walls (not stone)
Stone / concrete
Roof Thatch roof Corrugated iron, thatch
Corrugated iron Corrugated iron
Tiled
Geyser / hot water heater
No No No Yes Yes
Security No No No No Yes
# people in house 5‐10 rural 5‐10 rural
<5 urban <5 urban
Title informal Informal Urban – letters of allocation/allotment or title deeds
Urban – letters of allocation or title deeds
Title deeds
Banking access Unsecured Unsecured Dependent on whether there is a title
Dependent on whether there is a title
Secured / mortgages
Size of segment % of population
66% 34%
Size of segment (individuals)
13,166,340
6,782,660
Source: Authors analysis and interviews supported by FinAccess 2013
Most of the population cannot afford housing built by formal developers, and as a result, the majority addresses its housing needs independently and often informally. The overall housing backlog in Kenya is estimated to be two million units. This contributes to a growth in slum dwellings and poor quality housing. Research by a slum dwellers umbrella body, Muungano Wa Wanavijiji, found that 70% of Nairobi’s housing stock comprises single 10 square meter shacks made of wood, mud, tin, galvanized sheets or wattle (Habitat for Humanity International, 2013). Incremental housing construction is the most common way for people to acquire a house. Incremental housing is an inverted version of the traditional, formal process of building and financing a house. For example, in the traditional process, the complete features of the house are available to the owners from the first day of occupancy. In the incremental construction process, homeowners begin residing in a

15
home with the most basic features and build at the pace their financing capacities allow. But this can be costly in the long run: constructing and selling homes piece by piece may avoid the need for large amounts of capital up front, but this prevents economies of scale and raises costs. (Figure 7 provides an overview of the low‐income housing value chain). Figure 7: Low Income Home Construction Map
Source: Habitat for Humanity International 2013
Yannis (2013) found that the typical cost structure for a single unit across housing typologies in Kenya is roughly as follows: 60% of a unit’s cost in construction (70% in materials and 30% in labor), 10% in infrastructure, 10% in professional fees (architects, engineers, required public permits), 5% in financing and 5% contingency.
“Relative to average monthly income of $65 to $78, these construction costs represent five months total income for the mud construction and 14 months total income for the stone structure.”
A one‐room stone structure with a corrugated iron roof currently costs about $900 to $1,100, whereas a

16
mud and wood‐frame construction of the same size costs approximately $350 to $400 to build. Relative to average monthly income of $65 to $78, these construction costs represent five months total income for the mud construction and 14 months total income for the stone structure (Habitat for Humanity International, 2013. For additional information, refer to Table 7 above). The cost of land is a particular challenge for low‐income households. Kenya’s cities and towns host close to 40% of the national population, and this is likely to increase to 54% in 2030. This high population density in the urban areas has put pressure on the land sizes and land prices. Informal systems of land delivery are the main channels of housing land supply (Habitat for Humanity International, 2013). The government has been proactive in exploring a variety of strategies for addressing the need for formal housing. Initiatives under way include the Appropriate Building Technology Programme, the Kenya Slum Upgrading Programme (KENSUP), Civil Servants’ Housing Scheme, Housing Infrastructure and Government Estate Management (Centre for Affordable Housing Finance, 2013). It is unclear whether insurance is offered within these schemes.
1.5.2 HousingfinancemarketKenya’s financial sector is highly developed, with a strong commercial banking sector, non‐bank financial institutions, MFIs and building societies, all regulated by the Central Bank of Kenya. Savings and credit cooperatives are regulated by the Commissioner of Cooperatives. Formal housing finance remains small as a percentage of GDP, with mortgage lending as a percentage of GDP standing at 3.7% in December 2012 (Centre for Affordable Housing Finance, 2013). While relatively high for East Africa, it is still small in comparison to other African countries such as South Africa and Namibia, with outstanding mortgages to GDP of 26.4% and 19.6% respectively (Yannis, 2013). Lack of affordability is a major constraint in the Kenyan housing market, influenced by the following key factors:
85% of households earn less than Ksh. 25,000 per month (BFA extrapolation of FinAccess, 2013);
Titled land in locations convenient to urban jobs is scarce at affordable prices;
Loans carry high interest rates, with rates on long‐term mortgage loans exceeding 15%, and less secured and/or shorter‐term loans significantly higher.
This combination makes funding the acquisition of urban permanent housing essentially inaccessible for this 85%, whether from mortgage financing or otherwise. In turn, this reduces the demand for compulsory property insurance linked to housing finance. A 2014 Kenya Bankers Association survey on urban home ownership found that savings is by far the largest source of financing for home building or purchase, used by 54% of homeowners. Inheritance or gifts account for 18% of homeowners, and less than a third borrowed (from both formal and non‐formal credit sources) to acquire their homes. 49% of potential homeowners, in the next two years, plan to acquire houses without borrowing from banks. All have cited high interest rates as the reason for not borrowing. The supply of formal housing finance is primarily geared toward upper‐income households. There were 19,879 mortgage loans in the market in December 2013 up from 18,587 in December 2012 (Central Bank of Kenya, 2013). On the upper end of the housing finance market, 33 financial institutions offer mortgage loans, yet 71% of the mortgage lending comes from five institutions (although Equity Bank will

17
enter the market directly since its recent sale of Housing Finance Kenya) (Centre for Affordable Housing Finance, 2013). The World Bank estimates that only 11% of Kenyan’s can afford a mortgage and the Mortgage Company, an independent mortgage brokerage firm in East Africa, finds that only 2 million out of the 9 million households in Kenya can afford a mortgage over Kshs. 1 million (US$11,100). The Kenya National Bureau of Statistics classifies middle income households as those whose monthly incomes fall between Kshs. 23,671 (US$260) and Kshs. 112,717 (US$1,330), but average mortgage loan sizes require a monthly payment of about US$1,067 and a monthly salary of at least US$3,200 (Centre for Affordable Housing Finance, 2013).
For low‐income households, the most common credit sources are shopkeepers, suppliers of household items, friends and relatives. SACCOs and personal bank loans (for those who have access to salary loans) are the next in line as the most popular sources of credit for home construction. Nevertheless, personal savings from own sources remain by far the largest source of funds for households to commence housing construction, driven to a large extent by the high cost of formal lending and lack of access to loans.
Providing more affordable homes and housing finance in Kenya is not impossible, and there are a growing number of groups who are making strides in this direction. Increasingly, banks, MFIs and SACCOs are providing this capital in the form of housing microfinance loans, credit designed to provide short‐term loans and allow families to improve their homes progressively.
Habitat for Humanity Kenya, part of a project headed and implemented by the Center for Innovation in Shelter and Finance (the consulting arm of Habitat for Humanity International), is supporting financial institutions in developing housing microfinance products for low‐income households. They are currently providing institutional technical assistance to Kenya Commercial Bank, Kenya Women Microfinance Bank, Letshego Kenya, and Stima SACCO to develop or refine housing microfinance products. Commercial non‐deposit taking MFIs such as Select Africa have also entered the housing microfinance lending space, offering a home improvement incremental construction product as well as one for new building with amounts ranging from US$600‐US$6,000. A number of SACCOs and NGOs provide housing finance for the poor, such as Jamii Bora Bank and the National Cooperative Housing Union (NACHU).
1.5.3 SecurityoftenureA key issue for the housing market in Kenya is land security – the degree of confidence one has in their rights of ownership over a piece of property and their ability to enforce those rights. Households that have land security are more likely to take on debt to improve the value of their property. Land security also affects the supply of credit as credit institutions need to be confident that a borrower will not be evicted, abandon the property, or default on the loan. In Kenya, no property rights are absolute. The government has the authority to infringe on those rights in support of national and public interests. Even land under freehold tenure is held on terms that are subordinate to powers of the state.
Security of tenure does not necessarily mean possession of a land title. In Kenya, the process of acquiring title has always been unclear to low income households. In Kenya, as in other developing countries, land security is determined by the legal documentation that a land‐owner possesses. There are multiple levels of documentation, each providing differing levels of land security. The least secure is a sales agreement and the most secure is a freehold title, followed by a leasehold title (Habitat for Humanity International, 2013).
However, the level of security provided by these different rights varies from city to city and on rural/urban lines. In rural areas, where there have been fewer evictions and demolitions, lower levels of

18
documentation seem to provide sufficient security. In these areas, sales agreements are an acceptable form of land security. In urban areas however, residents with stronger forms of legal documentation, such as letters of allotment, are still reluctant to invest in their properties due to real fears of demolition or eviction (Habitat for Humanity International, 2013). In examining these issues, there appears to be an opportunity to use insurance instruments to overcome concerns around title. This will be explored in section 4, product concepts.
2 Demand‐sideinsights
2.1 Demand‐sideresearchapproachThe demand‐side assessment included the following research elements:
Analysis of the FSDK FinAccess 2013 dataset;
Review of the Kenya Financial Diaries research carried out by BFA;
Focus group discussions (18 FGDs, 123 respondents)
Purposive individual HH survey/interviews (197 respondents)
Following consultation with Habitat for Humanity Kenya and examining FinAccess, the FGDs and household surveys mainly focused on the segment living with a monthly household income of Ksh. 10,000‐40,000, covering owners and renters living in permanent structures, in addition to some semi‐permanent properties. (See Annex 6 for further details on areas surveyed). This appeared to be the lowest hanging fruit in the target access frontier market. The inclusion of the Financial Diaries research permitted us to include findings from a lower‐income segment than was interviewed during the FGDs and household surveys, while FinAccess allowed us to examine a nationally representative sample.
2.2 Valueandfeaturesofhomes Self‐reported house values among owners in our survey varied widely, ranging from Ksh. 60,000 to Ksh. 6 million with the median being about Ksh. 1 million (see Figure 8). For most Kenyans, including the middle‐income segment, these values represent half or more of total household assets. According to the Kenya Financial Diaries, although low‐income segment homes are valued at about Ksh.160,000, significantly lower than the Ksh. 1 million median, home values still make up about two‐thirds of total household assets. Thus, the loss of homes would be a major life‐altering setback for most middle and low income Kenyans.
Eldoret home owner living in a permanent structure: “The house is not complete yet because I want to add tiles to it, but I can value it at 5.5 million (Kenya Shillings) to 6 million based on all the 12 windows. I had to put grills, the doors also around 3 of them I had to put grills, the garage door I had to put a steel one. Isiolo home owner living in a permanent structure: “According to what you have asked and the current economic status of our country, and the work I have done in constructing my house apart from the 40, 000 shillings I can now sell mine at 100,000 shillings that is the value”

19
Figure 8: Distribution of (Self‐Reported) House Values from the Survey
Source: Household survey
In considering the typical profile of a permanent house from our household survey (Table 8), 14 we find that many of the features are eminently insurable, as the properties are mostly brick, have electricity (demonstrating a level of formality) and have title deeds. Rather than the features, the main challenge appears to be access. The fact that only 1 in 5 home owners borrow to acquire a home limits the opportunity for a lender to embed the insurance into the sale process. In addition, the value of the property, although significant to the households, is relatively low for the current conventional mortgage insurance market, which typically targets properties valued over Ksh. 5 million. Table 8: Profile of Surveyed Owners Living in Urban Permanent Homes
No. of people in HH 5.0
No. of rooms in the house 5.0
Lighting source Most (57/67) have electricity
House quality attributes Most are brick or stone walls, cement or tile floor; mix of in/ outdoor water connection
Kitchen (cooking area) Cooking area is part of main house for most (65/67)
Title deeds Approximately half (30/67) have title deeds; half (34/67) have “allotment letters” or similar; a few (3/67) said “no” for documents
Loan from formal lender (incl. SACCO) to buy/build house
20% (14/67) have loans and of these, half (7/67) have title deeds
Self‐reported property value Average = Ksh. 1.9 million; Ksh. Median = 1.2 million Source: Household survey
2.3 Propertyriskexperienceandperceptions The perception of risk is an obvious factor influencing demand for insurance. FinAccess 2013 data indicates that 35% of Kenyans experienced some property loss in the past two years (see Table 9). While the existing data does not distinguish between very small and very large losses (i.e. loss of a single shirt up to someone who had an entire home burn down), the data nonetheless suggests high incidence of property loss with commensurate impact on the households.
14 The profile focused on owners of urban permanent homes that had a monthly household income of Ksh. 10,000-25,000 (35% of respondents)
0%
10%
20%
30%
Distribution of house values(among owners in survey)

20
Table 9: Risks Identified from FinAccess 2013
Note: The color coding is a ‘heat map’ for each column, with green the lowest and red the highest in that column.
Among all of life’s risks, property loss ranks 4th for impact on household income as stated in Figure 9 below, according to FinAccess 2013. This suggests a strong actual need to protect against this loss. Figure 9: Impact of Risk on Household Income
Source: FinAccess 2013
Complementing this, the household survey indicates that almost 20% of owners have experienced significant damage to their current house. This is a notable percentage, although the survey does not provide good data on the size and significance of the reported damage incidents.
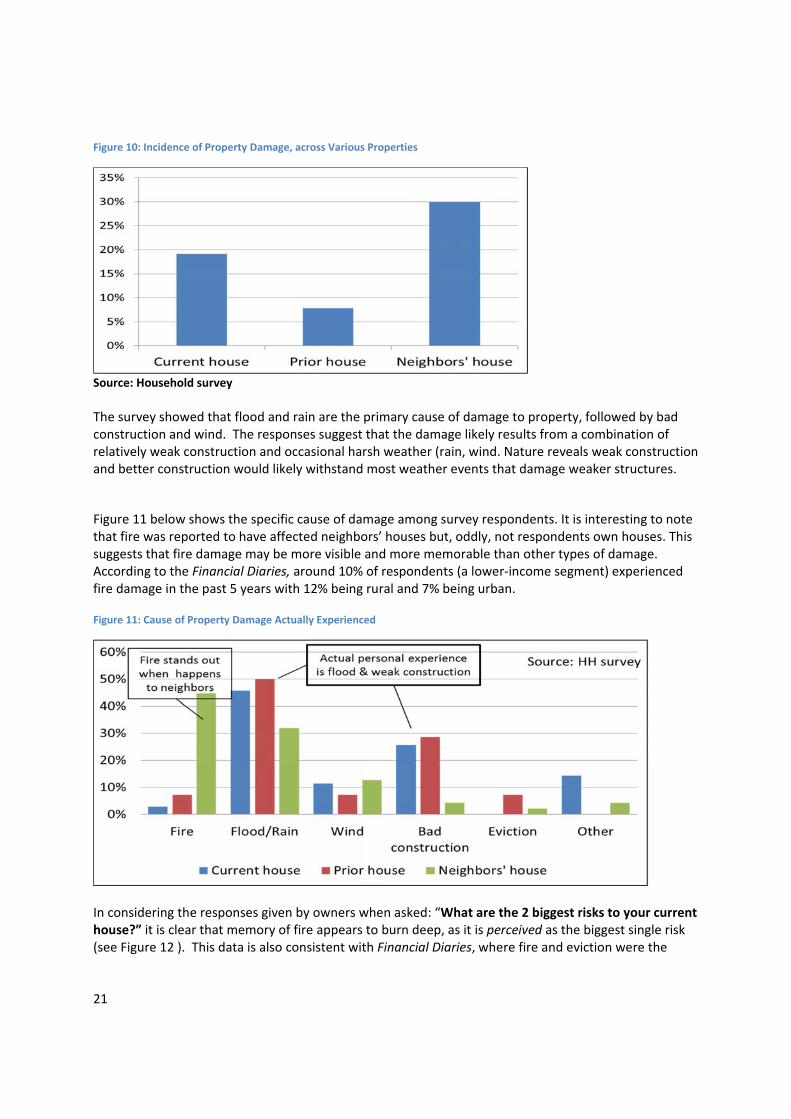
21
Figure 10: Incidence of Property Damage, across Various Properties
Source: Household survey
The survey showed that flood and rain are the primary cause of damage to property, followed by bad construction and wind. The responses suggest that the damage likely results from a combination of relatively weak construction and occasional harsh weather (rain, wind. Nature reveals weak construction and better construction would likely withstand most weather events that damage weaker structures.
Figure 11 below shows the specific cause of damage among survey respondents. It is interesting to note that fire was reported to have affected neighbors’ houses but, oddly, not respondents own houses. This suggests that fire damage may be more visible and more memorable than other types of damage. According to the Financial Diaries, around 10% of respondents (a lower‐income segment) experienced fire damage in the past 5 years with 12% being rural and 7% being urban.
Figure 11: Cause of Property Damage Actually Experienced
In considering the responses given by owners when asked: “What are the 2 biggest risks to your current house?” it is clear that memory of fire appears to burn deep, as it is perceived as the biggest single risk (see Figure 12 ). This data is also consistent with Financial Diaries, where fire and eviction were the

22
second and third “biggest worry” (“death of main income earner” was ranked first). These risks were also ranked second and third in terms of perceived “unpreparedness” for a risk event. Furthermore, even though respondents reported relatively high incidence of flood related damage, most still considered the risk of fire as a bigger risk than flood damage. While we do not have precise numbers on this, this suggests that a fire incident could be more of a total loss, whereas flood damage is typically a partial loss and thus more manageable. “Eviction,” including title dispute or government removals for infrastructure development, is perceived as the second biggest risk after fire (see Figure 12). Figure 12: Perceived Biggest Risks to Home
Source: Household Survey
Based on the coverage currently offered by insurance companies in Kenya, four out of the five risks identified above are insurable. If a “builders’ warranty” is included, all of these risks are insurable. With regards to the losses in urban versus rural areas, the proportion of households that experienced risk is the same (20%). While there is no dramatic difference in damage rates in urban areas for the two structure types, there is a significant difference in the rural region between permanent (5%) and semi‐permanent (42%), as Figure 13 shows.

23
Figure 13: Differences in Property Loss Experience (Urban/Rural and Structure Quality)
Source: Household survey
Flooding (rains) is the primary cause of loss across regions, but even more dominant in rural areas (Figure 14). Figure 14: Comparing Cause of Property Loss Experience across Urban/Rural
Source: Household Survey
The Financial Diaries reports that urban fires are infrequent, but they are among the top 2 economically devastating risks alongside death of the main income earner. As suggested by Zollmann (2015), the diversity of loss experience indicates that there may be demand for a multi‐risk, composite product to protect against various life and property risks. Notwithstanding this sizeable and widespread loss experience, a significant finding from the FGDs is that in most regions, respondents were not expressly clamoring for protection of the primary residence. (However, some regions such as Mombasa in Coast and Isiolo in Eastern, did express desire to protect the primary residence). The implications of this are an apparent gap between actual need for additional

24
property protection and perceived need, which points to the necessity of effective consumer education and marketing. While the limited desire for insurance may be due to lack of education around insurance, or lack of positive experience and availability, the FGDs conveyed the following themes:
• Permanent structures are deemed relatively low risk for property damage (fire, flood, wind). • When the owner occupies the property, the owner takes care of the property and this is
perceived to reduce risk, especially that of fire. • In the event of damage, the social network will help absorb the loss. This sentiment is
particularly strong for a primary residence, as opposed to other property such as business property, which is less likely to draw social support to repair or replace.
• The house is typically not used as loan collateral (either because the owners choose not to pledge it or lack of a title deems it deficient collateral) and therefore there is no push from the lending financial institutions for (compulsory) house/property insurance.
However, loss of productive assets was an important concern coming out of the FGDs. Demand was expressed for protecting income‐generating property and this highlights a possible insurance innovation opportunity, discussed further in the product concepts in section 4 below. There are instances when respondents felt helpless in dealing with pending risks that their social circles are reluctant to assist with. Current informal mechanisms are inadequate for mitigating business premises risk, as expressed in the following excerpt from a FGD dialogue among residents of a NACHU housing program:
Moderator: You said that the business to you is everything?… Does your organization help someone, especially if their business is shut down? Respondent: We only contribute like 100 shillings for someone to begin, even with a little stock. Moderator: So it’s like an emergency, it does not put someone where they were? Respondent: It is just a small contribution.
Box 2: Profile of one respondent experiencing multiple losses related to income‐generating property
“Joseph”, a man in his late 40s, is married and runs a grocery shop. He currently has a micro‐loan from a bank. In 2007 he had a successful retail shop in Kisumu, but a day after the results of the contested elections were announced, his shop was looted and the rental building where the shop was located was vandalized. He lost the entire stock and moved back to his home county where he was employed at a restaurant for a few weeks. Meanwhile, friends and family mobilized Ksh. 30,000 as a gift which they gave him. Using this money, he moved to Migori county where he started a successful roadside food kiosk. But in 2012, county officials informed him that the kiosk would be destroyed to make way for road expansion, and about 6 months later the bulldozers moved in. He therefore packed up, moved to Thika and, using his savings, rented a shop and he lives in a room behind the shop. His family lives at his ancestral home, far away. His current business is the most valuable asset and he wishes to ensure its growth and continuity. He is worried about the risk of theft, especially with the disturbing stories about businesses being totally wiped out by such occurrences. Since his family lives in the village, risk of losing household property through theft is not a concern, as they live amongst “their own people.” Destruction of household durables through fire is secondary; fire might destroy the household goods but he feels the four walls of the stone house that he struggled to build will remain standing.
25
2.4 CurrentriskmitigationstrategiesanddamagerecoverymechanismsHouseholds identified a variety of preventive measures. Some had implemented while others had not because of hesitation to invest or inability to raise funds to do so. The following is a list of property risk mitigating practices that were identified by FGD and survey owners of permanent structures:
• Fire: Because many fires are caused by electrical problems, ensuring electrical wiring is good and safe and that electrical appliances (‘gadgets’) are properly wired is an important prevention technique. Second one can separate the cooking function from the main house structure, where space affords. Other measures include having a fire extinguisher, preventing tenants from selling petrol, and ensuring careful use of kerosene and charcoal for cooking in the house.
• Eviction: To avoid eviction from ownership disputes, one should possess title deeds, use a surveyor when purchasing, and authenticate the title deed when purchasing.
• Floods: To prevent water damage, improve roof construction and/or coordinate with neighbors on area drainage.
• Wind: To minimize wind damage, reinforce the roof, use strong supports, and plant trees to block wind.
• Poor construction: Improve construction methods by using proper technicians and durable and appropriate building materials.
• Theft: Install fencing and/or employ a watchman. However, whilst these practices are eminently sensible, it was not clear that they were widely implemented. In general, low income people face a large number of risks yet existing coping mechanisms appear inadequate (Zollmann, 2015). When damage occurs, repairs are typically financed from available savings. However, it is unlikely that large shocks can be covered by savings alone. As indicated in the Financial Diaries sample (FSDK‐BFA), most (90%) of their already limited savings (around Ksh. 8,700) are relatively illiquid yet savings remain the main coping strategy for small shocks (e.g. $5 outpatient health care). Bigger shocks exceed savings and hence require action from the social network. For instance, of the 20% of owners that experienced significant damage to their current home (from Figure 13 above), 87% were able to repair/replace the damage. These repairs/replacements were financed as follows:
Savings is by far the most common financing source;
Other sources (relatively uncommon) include “well‐wishers”; loans from friends, family or savings groups; selling other assets;
Only one mentioned insurance. Savings as a loss recovery mechanism has limitations. On the one hand, tapping savings is a logical means to recover from loss. In theory, there is no cost of this (compared to an insurance premium or interest on a loan) and in many instances, “saving for a rainy day” is just for this sort of risk. However, there are two main drawbacks. First, the amount of savings may be inadequate to finance a full recovery from the loss; second, depleting savings may expose the household to harsher shock if other emergencies (e.g. health care) arise and cannot be met or opportunities (e.g. investments in business or education) are lost because funds are depleted.

26
The following indicates the inadequacy of savings to cover significant property loss. Financial Diaries data reports that household savings is less than 5% of the value of physical assets.15 Property (land/homes) constitutes 65% (median around Ksh. 150,000) of this total physical asset value. A separate demand‐side survey, with a slightly higher income segment16 than the Financial Diaries showed an average of Ksh. 38,300 in savings (the median would be much less) (GAFIS, 2011). As previously indicated, the social network fills some of the gap in coping with risk especially when the risk is larger than savings. Figure 15: Current Coping Mechanisms for Large Household Shocks
Source: Financial Diaries Kenya
Although, social network can be a powerful coping mechanism, it also has its drawbacks: the network can act slowly; not everyone is covered by a giving network; “net givers” are penalized and may descend into poverty; and the size of the risk pool may be too small for extreme shocks (requiring bigger contributions than can be provided).
15 The sample median household income in the Financial Diaries is Ksh.7,120, with median “financial assets”, including savings, of < Ksh. 8,700 compared with the value of physical assets at a median of Ksh. 228,000. 16 The GAFIS survey focused on average household income of Ksh. 28,000
Box 3: Social networks help, but coping gaps remain “Collins”, a man from Umoja in his early 30s, is married and runs various businesses, including a small car spare parts shop. He currently lives in his own plot of land, which he bought and built in Ruai (Nairobi), but his business is in Umoja. He is worried about the legality of the land tenure title, especially because there were recently major demolitions along Kangundo road (Nairobi), yet these individuals claimed to have had legal titles. He says he has a legal title to the plot where he has built, but to safe guard his investment he has now started investing in his home county in Western Kenya, as he feels that the legal documents for property ownership there are more legitimate.
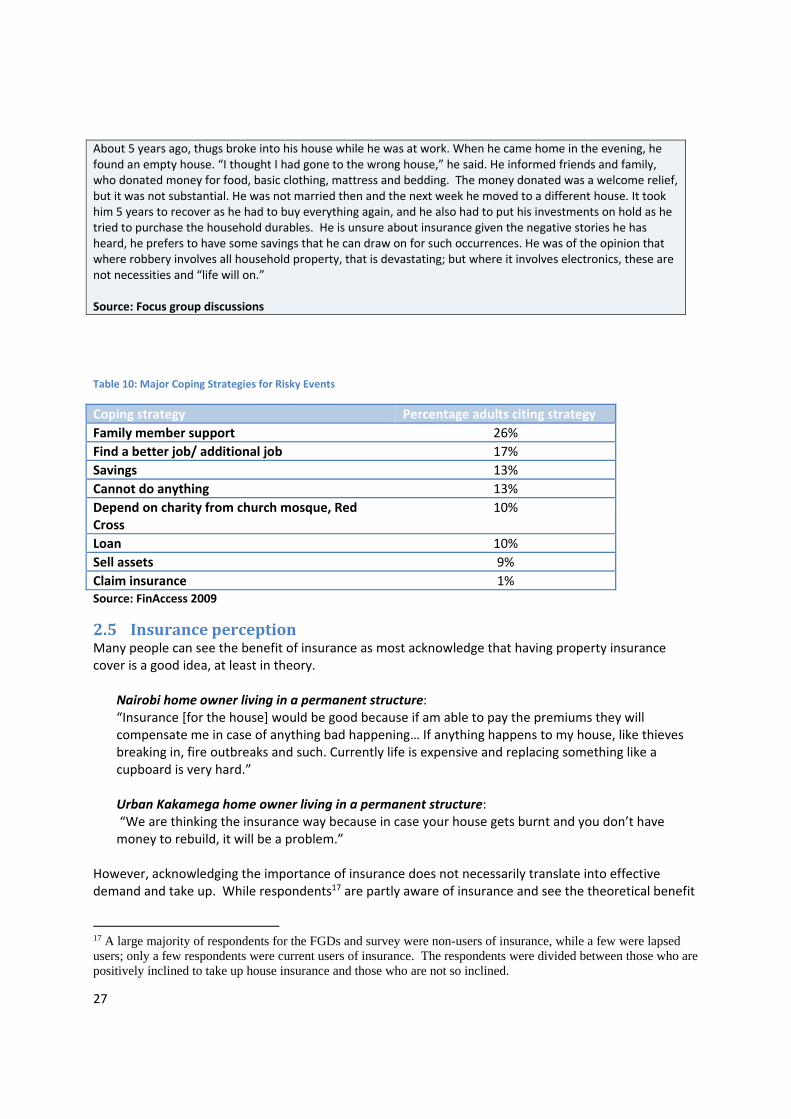
27
Table 10: Major Coping Strategies for Risky Events
Coping strategy Percentage adults citing strategy
Family member support 26%
Find a better job/ additional job 17%
Savings 13%
Cannot do anything 13%
Depend on charity from church mosque, Red Cross
10%
Loan 10%
Sell assets 9%
Claim insurance 1% Source: FinAccess 2009
2.5 InsuranceperceptionMany people can see the benefit of insurance as most acknowledge that having property insurance cover is a good idea, at least in theory.
Nairobi home owner living in a permanent structure: “Insurance [for the house] would be good because if am able to pay the premiums they will compensate me in case of anything bad happening… If anything happens to my house, like thieves breaking in, fire outbreaks and such. Currently life is expensive and replacing something like a cupboard is very hard.” Urban Kakamega home owner living in a permanent structure: “We are thinking the insurance way because in case your house gets burnt and you don’t have money to rebuild, it will be a problem.”
However, acknowledging the importance of insurance does not necessarily translate into effective demand and take up. While respondents17 are partly aware of insurance and see the theoretical benefit
17 A large majority of respondents for the FGDs and survey were non-users of insurance, while a few were lapsed users; only a few respondents were current users of insurance. The respondents were divided between those who are positively inclined to take up house insurance and those who are not so inclined.
About 5 years ago, thugs broke into his house while he was at work. When he came home in the evening, he found an empty house. “I thought I had gone to the wrong house,” he said. He informed friends and family, who donated money for food, basic clothing, mattress and bedding. The money donated was a welcome relief, but it was not substantial. He was not married then and the next week he moved to a different house. It took him 5 years to recover as he had to buy everything again, and he also had to put his investments on hold as he tried to purchase the household durables. He is unsure about insurance given the negative stories he has heard, he prefers to have some savings that he can draw on for such occurrences. He was of the opinion that where robbery involves all household property, that is devastating; but where it involves electronics, these are not necessities and “life will on.” Source: Focus group discussions

28
of it, the prevailing sentiment is that insurers are not trustworthy. Furthermore, respondents largely consider the concept of insurance an ideal mechanism to manage risks but there is lack of knowledge about how it works and very negative perception and attitude towards insurance, all of which hinders its uptake. Also, many perceive existing community risk coping structures as sufficient and assume property insurance would be very expensive, without having real pricing knowledge or experience. With regards to insurers not being deemed trustworthy, below are some widespread sentiments:
Insurers will not pay claims, or at best they will pay very slowly and less than expected;
The industry is clouded by bankrupt companies or fraud schemes
Premiums are expensive
Premiums lack transparency
Terms and conditions are confusing and non‐transparent, designed to trick the uninformed
Agents (sales) are not sufficiently knowledgeable or transparent. The following are some representative quotes from the FGDs:
Urban Kawangware home owner living in semi‐permanent structure: “Most of us, we fear because some insurance companies are not genuine, when a risk happens you follow it up, but they keep on dodging you until you are tired you leave it. So if they can be more genuine to the people...”
Rural Chavakali home owner living in permanent structure: “And when the risk occurs, one finds out that there are terms and conditions placed in other papers below that you are not aware of. And they tell you to sign the policy quickly without giving you enough time to go through the policy document.”
Urban Kakamega home owner living in permanent structure: “When the teachers see them coming, they lock themselves in the staffroom and I think the reason why the teachers run away is because experience is the best teacher. So if one person has been affected, one hundred others will fear taking the cover. So the experience of one person scares away others who would have taken. So if there were many success stories, then many people would take the insurance cover.”
The researchers conducted a round of follow‐up FGDs in March 2015 that focused exclusively on small business owners with business loans that carried a compulsory insurance cover such that the outstanding loan would be paid off in the event that key business assets were lost during the loan term. Even in this tightly targeted group, awareness of the insurance cover of business assets was weak. While most were aware that there was “some cover,” many had no understanding of the workings of coverage. When explained as part of the FGD, many expressed appreciation for the cover and a desire for the lender to better communicate the benefits at the outset. However, most simply saw the insurance as a cost to be endured as part of getting the loan, without seeing any real benefits. Some expressed interest in a cash payout because in the face of a total loss of business assets, while helpful to have the loan paid off, the customer is still “left to start over with nothing,” as explained in Box 4 below.

29
Box 4: Perception of existing “credit enhanced” business assets cover
“Charles” is a man in his late 30s from Kiserian around Nairobi. He runs a carpentry shop and also trades in wood. His business premises are rented. In 2014, he took a business micro loan for Ksh. 50,000, as part of a micro‐finance group. The financial institution that gave him the loan visited his business premises and also his home and took pictures. Charles paid some amount for the loan to be processed, which was deducted from his savings account, but he was not sure what was included in the payment. He could not remember whether insurance was included in the payment and – if it was – he did not know how it worked; all he knew was that banks need some processing fee to give a loan. Later, when it was explained in the FGDs that the compulsory insurance for loan covers fire, death and disability, he was appreciative, more so of the latter two risks as this ensured that dependents are not harassed by bank officials. He felt that the bank should emphasize this as there are potential customers who the thought of formal loans conjure up imagery of widows being harassed by bank officials. He was of the opinion that banks covering fire for his type of business is good, but even though the “loan stops” in the case of a fire, he still has the mammoth task of starting up all over without financial support, which almost trivializes the fire cover. He wished there was a way he could get a lump sum in that case, be it from saving or an insurance product at such occurrence. Source: Focus group discussions
2.6 IndicativeinsightsonwillingnesstopayforpropertycoverSurvey figures demonstrate that respondents realize that risk events could affect a considerable part of the value of the property, and their willingness to pay for insurance is reasonable for a simple cover as demonstrated below: Table 11: Illustrative Loss Economics
From all owners (n=167) Average Median
House value (self‐reported) Ksh. 1,872,000 Ksh. 1,000,000
If big risk occurred to home, cost to repair/replace? Ksh. 866,000 Ksh. 450,000
If big risk occurred to most valuable movable asset in/around home (e.g. TV), cost to repair/replace?
Ksh. 231,000 Ksh. 70,000
Hypothetically, if you were to buy property insurance, how much value would you insure?
Ksh. 2,415,000 Ksh. 1,000,000
Hypothetically, how much (annual premium) would you pay for this level of property insurance?
Ksh. 12,500 Ksh. 6,000
Annual premium/ House value 0.7% 0.6%
Annual premium/ Value that would insure 0.5% 0.6%
Illustrative loss economics show that willingness to pay broadly matches up with the cover required. If the 20% actual experience of house damage (including small and large incidents, and spanning the entire history in the current house, averaging 14 years among owners) is combined with the estimated cost to repair “big risks” (median Ksh. 450,000), we can illustrate some loss economics, as follows:
Loss frequency: Annualizing the 20% reported experience loss, which occurred over the course of an average fourteen year history in their current houses, yields a 1.4% annual loss estimate (i.e., each year, 1 in

30
71 homes will experience loss). However, allowing for the fact that some of the 20% may have had multiple losses over the years, this can be rounded up to 2.0% annualized. Loss severity: The estimated cost of the biggest risk was Ksh. 450,000 (median). But actual losses are not always “biggest,” so a reasonably conservative rough estimate of the average loss may be half of the biggest, or Ksh. 225,000 (at the median). Loss analysis: 2.0% (likelihood of loss) multiplied by Ksh. 225,000 (average size of each loss), yields Ksh. 4,500 as the average annual loss per household (Ksh. 375/month). Premium analysis: Using a simple model (excluding sales/operating costs, which of course cannot be ignored in final business case testing), a Ksh. 6,000 annual premium (willingness to pay from the household survey, noted in Table 11 above) could cover this average loss of Ksh. 4,500.
This highlights a gap and that further research could obtain more accurate quantitative estimates on these assumptions.
3 Distributor/aggregatoranalysis Thanks to the success of mobile money in Kenya, the premium collection problem has largely been solved.18 But distribution through the different networks remains a major challenge. Banks, MFIs, and SACCOs provide the clearest opportunities for quick gains, with banks offering the most potential at the moment. FinAccess 2013 data indicates that formal borrowers (those with loans from banks, SACCOs or MFIs) are much more likely to have insurance than the general Kenyan population. Where 16% of all Kenyans have some insurance (including NHIF), for borrowers of SACCOs, banks and MFIs this is 78%, 73% and 37%, respectively. And where only 4.5% of all Kenyans have some insurance other than NHIF, this is 31%, 38% and 11%, respectively. Much of this dynamic may reflect the nature of compulsory credit insurance associated with many formal loans. Nevertheless, it represents an opportunity to work with formal lenders to either cross‐sell additional optional covers or to increase the covers included on a compulsory basis. However, as we discuss in more detail in sections 2.5 and 4.2.2, our final round of FGDs found that borrower experience with compulsory insurance is not fully appreciated, especially for enhanced credit features (covers besides basic credit life or credit disability). Specifically, for the business asset cover (a compulsory feature of certain “MicroBanking” loan products), this was seen primarily as a cost, not a benefit, which indicates that this insurance needs to be better explained before anyone will intentionally seek more optional coverage. Thus, it is important for insurers and lenders to work together to improve the customer education and related product marketing associated with current policies (especially
18 However, M-Pesa does not enable an auto-recurring debit, so the customer still needs to proactively send the payment each time; but this is still very convenient compared to alternatives.

31
compulsory policies linked to credit) as an important opportunity to improve the foundation and receptiveness to future additional cross‐selling. Between MFIs, SACCOS and banks, the banking sector remains the largest client aggregator, reaching 29.2% of adults. Bank use has been rising over time, from 13.5% in 2006 to 29.2% in 2013 (FinAccess, 2013). Because of overlap with bank clients, the number of clients that can only be reached through MFIs and SACCOs is small; this is less true in rural settings where bank reach is spotty. Banks also currently appear to be reaching a younger population than MFIs. As of 2010, 44% of bank clients were younger than 30 compared to 24% for MFI and 21% for SACCO users (Smith et al., 2010). A challenge with relying too heavily on lenders for property/housing insurance, however, is that 49% of potential urban homeowners plan, in the next two years, to acquire houses without borrowing from banks (Kenya Bankers Association, 2014). Corroborating this, only 1 in 5 home owners in our purposive household survey borrow to acquire a home. This reticence to use formal financing for home acquisition and improvement will limit the opportunity for a lender to embed the insurance into the sale process. That said, even if half of those acquiring houses is reached by lenders, this seems the best opportunity to bring property insurance to a wide segment of the market, especially compared to the low starting base (of those with housing insurance) of less than 1% now.
3.1 BanksAs of 2013, some 43 commercial banks and one mortgage finance company were registered with the Central Bank. Of these, 30 are locally owned and 14 are foreign owned. Collectively, banks operate 1,342 branches, an increase of 70 branches from 2012 (Central Bank of Kenya, 2013; Centre for Affordable Housing Finance, 2013). Significant banks, by market share, include Kenya Commercial Bank, Equity Bank, Co‐operative Bank of Kenya, Standard Chartered, Barclays Bank of Kenya, and CFC Stanbic Bank Table 12: Financial Service Provider Challenges in Housing Lending
Constraint/risk Details
Client risk assessment
• Low income housing market presents big unknown to FSPs • FSPs desire insurance on everything principally because they don’t
have data on what is significant and what is not
Land title/legality of land/collateral
• Uncertainty around land title and collateral creates reticence on part of FSPs to develop and scale housing and property products
Irregular borrower income flow
• Loss of income due to death/disability • Focus on salaried workers, neglect of “traders”
• Clients may prioritize paying funeral, education over loan
Building quality • Concern of enabling low‐quality construction
MIS/IT • Manual process often used, need to upgrade Source: Authors’ stakeholder interviews
In terms of housing finance, a total of 33 financial institutions offer mortgage finance, which comprises 22.6% of total credit to the private sector. Credit to building and construction comprised 13.4% of total credit (Centre for Affordable Housing Finance, 2013). Salary loans, offered to workers formally employed, are also a source of housing finance, typically used for home improvement projects.

32
Banks extensive network of branches and agents represents a great opportunity for distribution. Currently, bank insurance penetration for voluntary products is relatively high, at 15% of bank membership, and this number likely understates credit insurance (see Table 5). On the other hand, banks (and MFIs) face a range of challenges in extending lending for housing purposes, as Table 12 indicates. As indicated previously, many banks already have credit insurance with their loan products, but the first step will be to market and educate borrowers on these products. Including fire insurance in financial institutions housing microfinance loan products is a viable next step (section 4.2.1), as is adding an enhanced credit component to microbusiness loans, covering business assets (section 4.2.2). Title insurance and bundled savings and insurance products (sections 4.2.3 and 4.2.4 respectively) geared toward home improvement, though potentially more complicated, offer great potential for piloting and up‐scaling. Cross‐selling home business insurance (section 4.2.5) and standalone building insurance for renters (section 4.2.7) also could make sense for institutions focused on bancassurance.
3.2 MicrofinanceinstitutionsKenya has a strong MFI sector, currently with 9 deposit taking MFIs and more credit‐only MFIs. MFI usage doubled between 2006 and 2009, from 1.4% to 3.4% of the adult population, but remained steady through 2013 at 3.5% (Smith et al., 2010; FinAccess, 2013). As of December 2012, DTMs and credit‐only MFIs had 105 and 164 branches across Kenya (Assoc. of Microfinance Institutions, 2013). In 2013, 41 MFIs reported to the Mix Market, representing 1.4 million active borrowers and a gross loan portfolio of US $4.2 billion. The sector also recorded 8.7 million depositors and US$2.5 billion in deposits (Centre for Affordable Housing Finance, 2013). Kenya Women’s Finance Trust and Faulu Kenya are the two dominant institutions, serving about 80% of all non‐bank MFI customers (Central Bank of Kenya, 2013). Although MFIs are the smallest client aggregators (between banks, SACCOs and MFIs), there is great potential in expanding distribution of microinsurance through them, as 81% of clients are uninsured. Up to this point, voluntary insurance offered through MFIs is focused on health needs (Smith et al., 2010; FinAccess, 2013). Kenya also has an emerging housing microfinance sector. A number of MFIs, such as Jamii Bora Bank (officially a bank now, but until recently an MFI) and Makao Mashinani (with US$412,335 in loans) explicitly offer housing microfinance (Centre for Affordable Housing Finance, 2013). Letshego, Kenya Women’s Finance Trust, Rafiki and KCB’s micro‐banking unit are (or have plans) to offer housing specific products aimed at the lower segment. However, housing loans are still an insignificant amount of the overall MFI sector portfolio (Assoc. of Microfinance Institutions, 2013). Credit life insurance is widely offered by MFIs and is often included in the loan application fees, albeit some of it is essentially unregulated pending new microinsurance regulations which will formalize the sale. At the end of 2012, additional insurance services offered by MFI’s serving as agents of insurance companies include agriculture, life and auto insurance (Association of Microfinance Institutions, 2013). Similar to the discussion at the end of section 3.1, including fire insurance in the housing microfinance loan products is a strong next step, as is adding an enhanced credit component to microbusiness loans, covering business assets. Other product concepts also have potential, yet given MFI’s relatively smaller size and outreach in comparison to banks, these may be of a lesser priority for MFIs.

33
3.3 Savingsandcreditco‐operatives(SACCOs)The Kenyan co‐operative market is the largest in Africa and the seventh largest in the world with more than 12,000 registered co‐operative societies and 7 million members.19 SACCOs are the second largest client aggregator among banks/MFIs/SACCOs but use of SACCOs has decreased from 13.5% in 2009 to 9.1% in 2013 (FinAccess, 2013). The uniqueness of the SACCO movement is its geographical distribution across Kenya, in both urban and rural areas. In all the 47 counties, there are numerous SACCOs providing financial access to financially excluded Kenyans. Many rural and urban Kenyans now own homes and other business enterprises through their SACCOs (Habitat for Humanity International, 2013). 68% of SACCO clients are uninsured, although this is partly due to the legislation which makes it difficult for SACCOS to arrange insurance. Although it appears that SACCOs are losing ground to MFIs and banks, there are indications that when it comes to housing loans, SACCO loans are preferred due to the lower interest rates offered and the ease of accessing the loans. It is also significant to note that SACCOs have gone further in serving low‐income clients than MFIs and banks. 15% of bank clients earn less than KShs. 6,500 (US$ 87) compared to 23% for SACCOs and 16% for MFIs (Smith et al., 2010) The National Cooperative Housing Union (NACHU), a SACCO, is a leading member of the housing microfinance field in Kenya, with 340 member housing cooperatives representing 250,000 individual members, and more than 85% of its portfolio in housing finance. Their services target the low‐income population, with average income levels ranging from Kshs. 10,000 (US$110) per month for starter unit clients to Kshs. 15,000 (US$170) for incremental building clients and average loan sizes of Kshs. 350,000 (US$3,900). Many borrowers are in the informal sector and only 30% of NACHU’s portfolio is backed by formal title, further indicating their focus on the lower income housing market (Shelter Afrique, 2011). When it comes to formal housing finance, there does seem to be a preference for SACCO loans given their lower interest rates, indicating potential for linking these housing finance products with insurance. Additionally, as discussed previously, for truly targeting low‐income households, SACCOs have the greatest penetration in this market and thus would be an important distributor of housing insurance for socially minded insurers and partners. However, the relatively fragmented nature of the SACCO market would present problems for truly scaling up these products. That is where a SACCO like NACHU presents an opportunity, as it is quite sizable and could be a viable partner and distributor for many of the housing concepts discussed in section 4. Additionally, a financial institution such as NACHU whose portfolio is concentrated in housing could be a good candidate for a portfolio cover to manage risks such as fire which could decimate its developments, discussed in section 4.2.8.
3.4 MobilenetworkoperatorsMobile Network Operators (MNOs) in Africa and elsewhere are increasingly engaged in m(obile) insurance, but this has yet to take off in Kenya, despite Kenya’s leadership in mobile payments
19 The important organizations attempting to network and structure the industry are:
The National Apex body (Cooperative Alliance of Kenya) National Co-operative Organizations : These have primary and secondary co-operatives as their members
and/or shareholders, and operate to support co-operatives by providing services such as banking, insurance, savings and credit to the movement
Secondary co-operatives/co-operative unions: These are organizations whose members consist of primary co-operatives—representative bodies that have individuals as members with the aim of promoting a common economic or social interest
Primary co-operative societies: These are restricted to individual members

34
(Safaricom’s M‐PESA). At the end of 2013, Kenya’s four mobile phone operators had a combined subscriber base of 30 million, with the vast majority held by Safaricom. Twice the number of adults use mobile phone financial services (11.5 million) compared with banks (5.4 million). Mobile financial services more than doubled from 28% in 2009 to 62% in 2013 (FinAccess, 2013). In terms of distribution opportunities, mobile payment systems—such as M‐PESA—have created large customer bases and agency networks with potential to sell other financial products, such as insurance. At this time, however, these networks are not yet utilizing their agency forces to sell insurance and stated during stakeholder interviews that their core function remains providing a payment platform. However, the success of other financial services (namely, savings and loans) linked to M‐PESA indicates the enormous potential that may exist. For example, the introduction and very strong uptake of M‐Shwari, a partnership between M‐PESA and Commercial Bank of Africa (CBA), where CBA offers savings and loans, based directly on Safaricom and M‐PESA account activity, may have signaled a shift to an agency rather than pure payments role. KCB also partnered with Safaricom for M‐Benki, a deposit account linked to M‐PESA (which follows the 2010 M‐KESHO product, an Equity Bank account linked to M‐PESA), while the Cooperative Bank of Kenya and Equity Bank have mobile phone accounts serviced through their agents and bank branches. KCB and M‐PESA have also just recently (March 2015) announced a loan product very similar to M‐Shwari. With respect to insurance, M‐PESA has apparently not yet accommodated automatic deductions. Accordingly, insurers looking to use M‐PESA for premium collection are challenged to develop products that will incentivize their clients to voluntarily make premium payments every month, which is a significant challenge. However, Vodacom, a sister company to Safaricom, has life and general insurance licenses in South Africa and the broader Vodafone group has insurance licenses in Malta so it will be interesting to observe Safaricom’s strategy in insurance over the next few years. Table 13: M‐Insurance Challenges
Constraint/risk Details
Business case for m‐insurance
• MNO’s not willing to develop product itself. They see the potential benefit of m‐insurance but haven’t seen a viable product.
• Not a revenue issue (MNOs have very low transaction costs) but an uptake issue
“Know Your Customer”
• For Linda Jamii, many clients don't have the required “birth certificate” • Additionally, steps in the current application process can’t be done online or
via mobile
Business strategy priorities
• MNOs in Kenya, at the moment, see themselves as primarily a payment platform, although this will change with the changing focus internationally
Source: Authors’ stakeholder interviews
3.5 NGOsandcivilsocietyorganizationsLocal and international NGOs and civil society organizations (CSOs) play a role in affordable housing delivery in Kenya, often with the support of international donors. Their outreach to low‐income segments, especially around housing, presents an opportunity for property microinsurance distribution, but there is little data available on insurance penetration.

35
As indicated in section 1.5.2, housing finance market, Habitat for Humanity Kenya is part of a project to support financial institutions in developing housing microfinance products for low‐income households. Habitat for Humanity Kenya also operates a small retail lending program of its own. Homeless International supports NACHU and Pamoja Trust to secure tenure and build appropriate housing. Additionally, Homeless International is partnering with the World Bank to relocate 20,000 railway dwelling families to sustainable accommodation. Rooftop Canada, an international development program of Canada’s cooperative and social housing sector also supports NACHU to purchase land and to provide NACHU members access to finance to build, upgrade or extend their homes (Habitat for Humanity International, 2013).
There are also land and housing rights organizations in Kenya playing an active and important advocacy role and could play a role in property microinsurance product development, particularly around title insurance. They include:
The Economic and Social Rights Centre – Hakijamii
Pamoja Trust
Kituo Cha Sheria
Akiba Mashinani
Shelter Forum NGOs and civil society organizations focused on the provision of affordable housing could benefit from several of the housing insurance concepts. However, perhaps their greatest role in housing insurance would stem from their “trusted” reputation among the general population and low‐income homeowners in particular. Partnering with key NGOs and socially conscious organizations to educate consumers and help with marketing valuable insurance products that offer real protection would be essential for changing the negative perception toward insurance.
3.6 DevelopersWhile the government could potentially be an important enabler of the affordable housing market, many believe that the private sector is likely to be in the driver’s seat of supplying low‐cost homes. Housing developers possess a significant opportunity to meet the growing demand for affordable housing in the market but face significant challenges. The great majority of Kenyan developers are family‐owned businesses that grew from an initial one or two housing unit investment and there are only a handful of private developers in Kenya that can afford to invest in medium to large scale developments of 200 units and above for middle to low income segments (Yannis, 2013). In 2007, the Ministry of Housing developed 30 incentives to encourage greater private sector participants; eight of these incentives were executed. The incentives haven’t yet had an appreciable impact on affordable housing, however, as the drive for profitability has kept the developers in the upper and middle income segment (Habitat for Humanity International, 2013). Key obstacles for growth include:
Lack of know‐how in building and marketing large scale real estate developments
Difficulty in raising adequate finance
Uncertainty and costliness of providing infrastructure (water and sanitation, electricity, etc.) to finished homes.

36
To the extent that developers achieve scale, especially in the affordable housing sector, they could be seen as a viable avenue for marketing and distributing property microinsurance, in particular the construction warranty concept (section 4.2.9) or even the title insurance concept (section 4.2.3). Given their relatively small size and the fragmented nature of the market, however, it is unclear what the magnitude of the distribution opportunity would be. Also, most of the population cannot afford housing built by formal developers, so as a method for distributing to the low‐income population, it is limited at present.
4 Productconceptsandpotentialinnovations
4.1 PropertyinsuranceAccessFrontierIn considering the property microinsurance Access Frontier developed for this study (Figure 16), 20 there is significant potential to grow the market from its low level of 0.5% penetration by just focusing on the currently insurable properties (permanent housing structures). As noted previously (Figure 5), 34% of properties fit within this category. By focusing on the high income segment alone, the market could grow by almost 9%. Expanding this to mid and lower income segments could grow the market by a further 25%– this additional push may require some product innovation, although the main challenge may be appropriate marketing. A bigger challenge is reaching the middle‐ and upper‐income segments that live in semi‐permanent properties (6% of Kenyans). Macro (donor or government subsidised) and meso insurance (such as insuring a bank’s loan portfolio) schemes could be deployed, as well as “enhanced credit” insurance models (likely an important part of expanding into the hardest to reach segments). In aggregate, these segments would comprise 40% of Kenyans, a huge increase from the current base of 0.5%.
20 The “access frontier” methodology (Porteous 2005) is an approach to understanding how markets work over time, and in particular, how they work to increase access by poor people. It segments the market for a particular product into five groups: (i) those who now use it, (ii) those who could have it now but don’t want it, (iii) those who are within reach of the market now or (iv) in the foreseeable future, and finally (v) those outside the reach of the market in the foreseeable future because of their low income or resources. The approach informs how to increase the proportion of the eligible population who can access the product.

37
Figure 16: Property Insurance Access Frontier for Kenya
Source: FinAccess 2013
To achieve take‐up at the frontier, providers must develop innovative marketing to overcome the pervasive negative perception of insurance and build trust by using distribution partners’ existing brand and delivering real value through enhancing insurance with value added benefits.
4.2 EmergingproductconceptsPotential concepts and innovations revolve around the following areas:
• Credit‐linked (tied to lender relationship) • Business property (inventory, equipment, premises) • Rental property (landlord income/asset, tenant interests) • Tenure security (uncertainty, inefficiency) • Informal property (semi‐perm, weak tenure) • Cost of claims assessors (a driver of cost and access) • Limited access to financing for developers (an impediment for growth) • Certainty of supply of materials
These categories are not mutually exclusive, as there may be overlap.

38
Figure 17: Property Insurance Proposed Linkages for Kenya

39
Table 14: Summary Overview of Product Concepts
HMF Fire Enhanced credit
Title Savings‐Insurance
(+) bundleDisaster
Home business
Room cover Standalone for renters
Target market
HMF borrowers
Formal borrowers
Property owners
w/out title deeds
Existing or aspiring property owners
Municipalities with residents
in non‐permanent property
SMMEs operating from
home
Home owners (permanent)
Property renters
(permanent)
Market size (FinAccess
2013 unless noted
otherwise)
<1% of Kenyans
8% of Kenyans (half are LMI, which is “lower or mid income”)
Unknown (but our survey sample ~ 50%)
Most Kenyans aspire for better housing (especially LMI)
15% of urban homes are non‐permanent
(almost all are LMI)
Unknown (23% of Kenyans run a biz, most
likely (?) have home biz activities or
stock)
34% live in permanent (just under half are
owner occupant, & mostly LMI)
19% of Kenyans rent permanent (2/3 of these are LMI)
Status in Kenya
Not yet available
Available Not
available Not available Not available
Biz property cover offered by many, but low scale. Unclear if home biz covered
Not yet available, but one insurer indicated it is considering
this.
Not available
Examples
KCB MicroBanking compulsory biz asset cover;
MicroEnsure in Kenya; CLIS
Philippines (see Box 1)
Common practice in
USA
Nothing in Kenya and no property
examples globally, but several bank savings products offer insurance feature (e.g.,
Bancolombia Ahorro a la Mano), WWB
Ghana.
Jubilee’s M‐Pesa agents biz product; Kenya Orient stock cover. In SA,
Hollard Mzansi covers home biz assets, sold thru large mass
retailer
1 insurer aimed to launch the product but
initiative ended when
responsible person moved.
Hollard Mzansi South
Africa
Potential distributors
HMFIs; building materials suppliers
Formal lenders (banks, MFIs, SACCOs)
Formal lenders as 1st step
Formal deposit‐taking financial institutions
Local government/ municipalities
Banks, SACCOS, retailers, MNOs
Insurers, banks, retailers
Landlords

40
4.2.1 FireinsurancelinkedtohousingmicrofinanceHousing microfinance (HMF) is a growing source of housing finance in Kenya, especially for middle‐income and economically‐active lower‐income segments. HMF models are primarily unsecured lending models but also may require the house to serve as collateral. To the extent a HMF model requires the house as collateral (which could simply be labeled “micro‐mortgage lending” or alternatively “secured housing microfinance”), it is a natural extension of existing conventional mortgage practice to make insurance on the house compulsory. This protects the risk to both the lender and the borrower. This concept is less a new product innovation, per se, and more of an expansion of an existing product into new markets (lower income, lower value property). For unsecured HMF models, HMF lenders should consider bundling insurance cover for the house into the loan product, either as a compulsory requirement or as an opt‐in option for the borrower to consider when taking the loan. Since HMF is often aimed at non‐permanent structures, insurance linked to HMF should look beyond permanent housing, and try to set parameters for at least certain kinds of non‐permanent structures. This could be a fixed first loss cover (perhaps based on the loan size, or the number of rooms) or as a component of a bundled, multi‐loss, compulsory enhanced credit policy. MicroEnsure offers a good example of how this type of enhanced credit insurance would work. In the case of MicroEnsure, many of the policies are linked to income‐generating loans (i.e. loans taken out by market traders) but this policy could (and should) expand to asset building loans such as housing microfinance credit offered by formal lenders. To ensure that clients do not see this insurance as just an extra cost, special care should be taken to educate the borrower on the insurance cover and demonstrate tangible client value (as MicroEnsure does by offering an immediate cash payout to impacted clients, in addition to paying off the loan balance).
4.2.2 “Enhancedcreditinsurance”:Protectingbusinessandincome‐generatingproperty Our qualitative research revealed relatively strong interest in protecting income‐generating assets, such as business property: inventory, equipment, fixtures, and even premises. This sentiment included a landlord’s rental property. Lenders already tend to insist on compulsory credit insurance cover to protect the lender in the event of the borrower’s death and – increasingly – borrower disability and sometimes unemployment. The “enhanced credit” concept would also cover other risks, namely loss of the business assets (e.g., loss of business inventory or equipment due to fire or theft) or business property. The lender requires the cost of this cover to be paid by the borrower, and the loan is paid off in the event the core business assets are lost.
One challenge in covering small business assets, especially inventory, is knowing exactly what inventory was held at the time of the loss. For this reason – risk of fraud – inventory is often not covered by insurance. “Frogtek” is a smart phone app that can be used to track cash flows and inventory of small businesses; however, take up is still small. A concept is to embed an insurance product into the app package so that the inventory is automatically covered for fire, which may act as a pull factor ,encouraging the take up of these apps; or vice versa: marketing the app with the insurance could enhance the attractiveness of the insurance. More than 3 million Kenyans run businesses with inventory (retail/trading or manufacturing).

41
Expanding this sort of enhanced credit insurance is an important opportunity to expand property microinsurance. Moreover, this sort of cover could be extended to also include some additional “cash payout” to the borrower, over and above the outstanding loan amount. In addition, this relationship may create further opportunity to cross‐sell other property insurance, for property that is not the subject of the business loan (e.g., the borrower’s housing assets). In our qualitative research, we conducted four FGDs exclusively with micro borrowers with a loan product that already required a compulsory business asset insurance cover (as part of an enhanced credit insurance feature, including death and disability benefit). In discussing respondents’ experience with the compulsory property insurance, most borrowers did not have a sufficient appreciation of the benefit from such insurance. They generally knew it only as a cost, without full understanding of the benefit, which limits the impact of the cover and further diminishes the perception of insurance. The researchers note that these borrowers will not seriously consider opting in to additional property insurance until they first see the compulsory insurance as a benefit more than just a cost. The emerging sentiment among these FGDs is that there is likely more demand for enhancing the business asset cover to include a cash payout on top of the loan repayment. This reflects the primary importance placed on income generation, but also may reflect the relatively high number of home renters (tenants) in the FGD sample. There was also little demand expressed for house contents cover, as they felt they did not have many valuable assets in the house.
4.2.3 TitleinsuranceAs is typical in much of the developing world, many Kenyan home “owners” do not have title deeds (i.e., ironclad documentation of perfect guaranteed title). While many do have title deeds, especially those with permanent structures, it seems at least as many, perhaps more than half do not.21 To the extent someone “owns” property without a proper title deed, that owner is at a heightened risk of losing the property to some sort of eviction arising from lack of enforceable property rights. Table 9 above indicates that around 6% of Kenyans have “lost family land” in just the past 2 years, presumably from some sort of failed property rights. We propose a “title insurance” product concept, recommending further research into the legal and practical implications of such a concept. In essence, the concept is to insure a property owner (and/or the lender in the event of a loan secured by the property) against the risk of the owner actually losing his right to “possess” (occupy and use) the property, arising from some failure to prevail in a property rights or title ownership dispute. In other words, the insurance would pay in the event the owner is evicted from the property,22 which should aim to provide certainty for the lender that their loan would be repaid and an incentive to invest in the property for the owner. In some countries, evidence indicates that improving property value (akin to improving land productivity) strengthens a family’s “adverse possession” status. In other words, by making home improvements, homeowners essentially increase their claims and/or rights over their property. Therefore, access to housing finance (broadened through
21 Our study did not find nationally representative data on these statistics 22 This theory aligns with the spirit of Hernando de Soto’s theories of “dead capital” in his Mystery of Capital book. De Soto 2005. Briefly, dead capital refers to the inherent value of real assets, which value cannot be fully tapped (from a sale and/or asset-based lending) simply because the ownership rights of such assets are not fully and formally documented in a manner recognized by potential buyers and lenders (et al).

42
a viable title insurance product) could contribute to a de‐facto “lift” in households’ tenure status (Habitat for Humanity International, 2015).23 This concept has potential to not only be a product line unto itself, but also presents the opportunity to expand other financial services related to property. First and foremost, as noted above, it could incentivize lenders to lend against imperfect title, which could crowd in lenders that offered secured loans. These should also be priced more finely than unsecured loans, with larger sums and over a longer term, improving affordability. In turn, this new loan activity would drive new compulsory fire insurance for all property. As with any insurance product, of course, one of the keys to the feasibility of this concept is ascertaining the likelihood of the contingent event (namely eviction, or loss of right to possession). Some properties are at higher risk than others, and the underwriter would need to devise a sufficiently reliable and accurate means for assessing the risk in certain areas and identifying worthwhile risks versus “no go” regions. Other key factors include:
Moral hazard or adverse selection (issues with all insurance), such as where the owner knows
his claim to title may be weak and thus is more likely to buy the cover;
Whether Kenya’s political and legal institutions – laws and court enforcement thereof – are
strong, consistent, and efficient enough to provide sufficient certainty to insurers that risk
assessments would hold true and those with power would not “game” the system. Worth
noting is that “title insurance” is a common practice in the United States, but an important
element of its success is a well‐established, strong, independent, consistent legal system
capable of objectively enforcing title disputes.
As noted above, we recommend more research into this concept.24 If further research supports feasibility, we believe the first step is to start by issuing only “lender’s policies” rather than owner’s policies. This is where the insurance covers only the lender’s interest and pays off some (we recommend something less than 100%) of the outstanding loan amount in the event of actual loss of possession. We further recommend that it should be focused on “home equity loans” where the borrower already owns and lives in the property and is seeking a loan to either upgrade the property or for other purposes (business investment or education or medical needs). A lender’s policy implies no insurance “cash payout” to the owner for any amount over and above the loan. These limitations should decrease the moral hazard, and also increase the available due diligence to assess the risk, because the lender’s own credit risk due diligence should provide important information on the status of the owner and the property (e.g., talking to neighbors and local government about owner’s ownership claims).
4.2.4 “HomeSave‐Improve‐Protect”Currently, the primary source of “housing finance” is household savings. Savings is the primary source of funds for land acquisition, home construction, and home improvement. It is also the primary source of funds to repair damaged property. Credit is also important, especially in new construction for upper‐
23 For example, this was a finding from a study conducted within an informal settlement in Lahore, Pakistan, as documented in “Tenure Security, Home Improvement, and Access to Basic Services: Does Property Titling Matter?” by Fatima Wajahat, Florida State University, July 2012. Available online at http://diginole.lib.fsu.edu/cgi/viewcontent.cgi?article=6773&context=etd. 24 Bankable Frontier Associates has conducted some additional preliminary research into the concept, though it is largely theoretical to date. Nothing is yet published from this.

43
income segments (the relatively few who can qualify for mortgage finance) and increasingly for housing microfinance as noted in section 1.5.2 above. Insurance is not yet a significant factor in funding housing repair/replacement, mainly explained by its limited penetration in the market. As noted in the demand‐side insights, section 2, Kenyans tend to have a negative perception of insurance and are not compelled to take out insurance. There is also a low perception of risk, which leads people to see insurance only as a cost without benefit. They also express a desire to be given something back from the insurance premium investments, a tangible return on investment, and thus express a preference to simply allocate the money they might pay for insurance premiums instead to savings, so they can have some tangible benefit in the end. The high incidence of property loss resulting from rainwater, wind and bad construction indicates a need for better quality construction, and thus construction technical assistance services, as a value‐added service (VAS), has a role to play.25 Yet in other respects, households know how to minimize risk to property (as we covered in section 2.4 above), but affordability of implementation (e.g., electrical upgrades) is often elusive. The “Home Save‐Improve‐Protect” product concept may be more of a marketing concept bringing together multiple products. The concept is broadly envisioned as a bundled financial and value‐add services (VAS) product, around the marketing theme of building, enjoying and protecting a nice house for a long time to come. “We are here for all your housing finance needs, so let us be your partner in realizing your dreams to improve your home…” This would require a partnership between a deposit‐taking financial institution, a VAS provider, and insurer. It would aim to ensure a long‐term relationship with a home owner, whereby the financial institution helps the home owner manage many of the financial and technical aspects of the home improvement process: savings to the extent available; construction technical assistance when desired; access to credit when needed, with insurance cover for major losses. CEMEX’s Patrimonio Hoy initiative illustrates how bundling savings, credit, and VAS could combine to support gradual home improvement cycle, but it makes sense to add an insurance feature to that basic model.
4.2.5 HomebusinessThe home business product concept is a standalone property cover, a “first loss” policy that would cover existing buildings (likely permanent structures), contents and equipment, where the insured’s business is (at least partially) located at the insured’s home. The target market is SMMEs (micro, small, and medium enterprises) that operate from home. Although we do not have precise statistics on this, we know home‐based businesses are common in Kenya. In South Africa, approximately 80% of small businesses are home based (FinScope); and in Kenya we know that 23% of Kenyans (4.5 million adults) run their own small business (either manufacturing, retail/trading, service or room rental) (FinAccess, 2013). We roughly estimate that perhaps 10‐15% of Kenyans conduct significant business activities in their homes. However, home based businesses are typically excluded under home insurance policies, which creates an opportunity to cover the home and the income generating assets. Furthermore, protecting income generating assets was a strong finding from the demand‐side research.
25 Habitat for Humanity often refers to these value added services as housing support services and defines these as non-financial products and services that enable a household to improve their housing on their own. For more information on these services, see the housing support service section of Habitat‘s 2014 Shelter Report, available at http://www.habitat.org/advocate/publications-resources/shelter-report-2014, or the 3rd edition of Habitat’s Handbook for Housing Microfinance (forthcoming, 2015).

44
This product could be distributed through multiple channels, including formal lenders (banks, SACCOs, MFIs), but also retailers and MNOs. In South Africa, Hollard’s “Mzansi” policy is sold through a large low‐income focused retailer and covers home based business assets. In Kenya, Jubilee Insurance’s M‐Pesa agents business product and Kenya Orient’s stock insurance product are examples that could be adapted. A key outstanding question for further research is determining how the current claims assessment process can be enhanced to improve uptake.
4.2.6 RoomcoverThe “room cover” or “modular cover” product concept is a housing insurance product for permanent housing structures, with standardized pricing that could be based on the number of rooms in the house. The rationale for this is that property insurance is typically available for high end property but standardized pricing is not available. We believe the low penetration of property insurance (0.5%, FinAccess 2013) is partly due to cost and availability. The target market for this concept is owners of permanent housing, primarily owner‐occupants (around 15% of Kenyans are owner occupants living in permanent housing), but also landlords. Currently, this product is not available in Kenya, but one insurer had previously considered this concept. Potential channels for this product include insurers, banks, and retailers.
4.2.7 StandalonebuildingsforrentersMost residents of urban Kenya are renters (35% of Kenyans live in urban areas, and approximately two thirds of them are renters), and therefore this segment is an important market. FinAccess 2013 informs us that most urban renters live in permanent housing (i.e., most are not living in informal settlements). More than 40% of all middle‐income and upper‐income Kenyans are urban renters. In other words, many urban Kenyans with relatively high income choose to live in rented permanent housing. A product concept for this segment is a standalone buildings and contents cover targeted at tenants. The concept of contents cover for renters is intuitive and well established globally, and is available in Kenya, though has not reached any scale. Traditional insurance argues that tenants do not have an “insurable interest” in buildings cover, which should be covered by the landlord. However, as insurance is not typically available or even bought by the landlord, especially in the low and mid income market, there is an argument that the tenants do have an insurable interest, as there will be no one to repair it otherwise. Demand‐side research indicated that some renters did want to cover rental property, although this concept was admittedly difficult to understand and appreciate for many. Currently, cover of buildings for tenants are not available in Kenya, but in South Africa, Hollard’s “Mzansi” product was amended to cover this due to repeated requests from the clients.
4.2.8 DisasterriskA disaster risk policy could be developed that would cover the supra market zone and/or the segment that does not live in permanent property. For example the policy could cover a municipality for the informal settlements in its vicinity. In the event of a large fire, flood, or political violence destroying a significant number of properties, the insurer would take responsibility for procurement, repairs and settling the cost of the claim. Informal settlements are typically not covered for disasters. Government may declare an emergency and step in, but this is complicated, there are substantial delays in payouts and it distracts the local government from their core functions of service delivery.

45
A key outstanding question is what index could be used if this is to be an index insurance policy, and – of course – is there demand for this from municipalities.
4.2.9 ConstructionwarrantyThe demand‐side survey suggests the primary cause of property damage is the combination of flooding (heavy rains), wind, and weak construction – weak construction is revealed when Mother Nature unleashes heavy wind and rain. It is very difficult and impractical to underwrite damage caused by random poor construction, especially if that construction is already in place. However, if this is part of an overall scheme where the insurer is able to know the construction contractors and/or building materials (through some kind of certification process), then it becomes more practical to warrant (insure) the construction quality. This could be done through a building material supplier/manufacturer warranty, which applies as long as the building materials were properly used; or could be done through some licensing or certification of builders/contractors (e.g., South Africa has experience with a so‐called “Builder’s Warranty Scheme”). As a concept, this sort of warranty would appear to be in high demand in Kenya, through contractors or building materials suppliers. However, our study has not looked at the practical implications of this concept, in terms of the technical requirements of certification or underwriting same. This is worthy of further research.
4.2.10 LowcostclaimsassessorconceptThe cost of claims assessment is a significant barrier to the roll out of low cost insurance and mobile mechanisms may be a suitable mechanism to address this. This concept entails a mobile app that would support part‐time, “uber‐style” claims assessors and clients to capture details of the claim. By leveraging non‐professional assessors to use a simple rules based app, it should increase availability of assessors and bring down the costs. This should allow insurers more flexibility to deploy assessors to properties ex ante to verify the data on a low cost house as well as ex post to assess the impact of a shock.
4.2.11 PortfoliocoverResearch showed that housing insurance is not common in Kenya. Should an organization, such as NACHU, a housing cooperative that builds and finances property, suffer a widespread fire in one of its developments, the financial impact could be catastrophic, as its clients would no longer be able/willing to pay it back. Therefore it would be worthwhile assessing the cost of insuring the entire portfolio for the impact of such a fire. This could either be covered from its margin or passed on to its clients (although this would increase the transaction cost and complexity in terms of educating the clients) It was also clear that there were a number of other challenges facing the value chain where insurance could potentially play a role. Some of the questions would be:
How can developers attract more financing and can insurance play a role?
How can the large materials suppliers effectively include insurance as part of their offering?
What government level interventions could help address the risk to property without increasing moral hazard?
As a concept, the bank or developer takes out portfolio cover to mitigate the risk of large scale fire on its insured properties.

46
4.3 MarketingconsiderationsTo elicit effective demand, effort will therefore be required to educate consumers on the need for and working of insurance to elicit interest. Despite the pervasive negative sentiment, there is some potential to turn the tide of negative sentiment, building on the following:
Generally, there is a basic knowledge of insurance.
Some respondents expressly identified insurance as a measure they could take to protect property, especially when the concept was explained to them.
Although the prevailing sentiment towards insurance is negative, the National Hospital Insurance Fund (NHIF) is the exception, which they found affordable and reliable (they believe NHIF works well, seeing it firsthand either for themselves or others).
Respondents reveal they are keen to guard against health risks and protect their businesses/ rentals.
FGD respondents noted the following potential strategies for insurance to become more attractive:
Make it trustworthy (reverse and address the negative perceptions previously noted).
Involve trustworthy (known) stakeholders, such as banks and MFIs and other trusted locals.
Give something tangible back even when there is no loss (to make it more like a savings mechanism or a reward for good performance).
Marketing considerations should consider a range of requirements, such as:
Bundling: desire for combining savings with insurance as well as broader, multi‐risk, composite products
Social network dynamics: this is a key informal loss recovery mechanism, which makes one consider designing insurance products around this social dynamic (see Box below for an example of this)
Partner with local trusted stakeholders
Sales strategy: ensure that a range of products be made available to the clients as required or offer a multi risk policy that covers a range of risks.
Channels: Trust, customer access, and distribution are critical
Include fire in all offerings, as that is the largest perceived risk.

47
Box 5: Example of a financial product innovation leveraging social network dynamics
“FlexiPay” is a product concept inspired by the Financial Diaries that is aimed at filling gaps in consumers’ current financial strategies and aligning with their mental models. FlexiPay seeks to leverage existing social network dynamics using a mobile payment platform to more efficiently tap funding from social networks to timely support household needs, such as medical treatment. It is still in early stages of development, but the concept (outlined below) is indicative of innovating to leverage existing informal strengths. When a patient learns of a course of medical treatment that he or she cannot initially afford, the facility will
issue an “m‐bill” to that patient, with a unique billing number, the cost of treatment, a deadline for treatment,
and diagnosis. Upon receipt of the m‐bill, the patient may make payments towards the expense at any pace he
or she can—the “flexi” component of the name. But, he or she may also make use of other financing tools to
more quickly meet the funding goal:
Ask for help: This feature enables the patient to enter phone numbers of possible supporters. The m‐
bill will then be sent to them directly, enabling them to see all the relevant details: diagnosis,
fundraising deadline, and outstanding balance. Supporters can pay directly to the hospital by making
a payment against the m‐bill. Notification goes to both the provider and patient.
Get advance: Here, the mobile provider, drawing on data that includes the cost of care and the
subscriber’s credit worthiness (assessed by their Airtel usage AND the interactions of their social
network on this platform) will provide an advance payment to the provider, helping bridge the
immediate funding gap for the patient (for a fee) and still enabling both the patient and the social
network to continue making payments against that advance.
Thus the platform provides high levels of flexibility to patients while not imposing new cash flow management or credit management burdens directly on health service providers.
Experienced cost is critical for delivering client value, but the perception of risk may be more important for marketing, and creating the market, as it responds to a perceived need – a challenging dilemma when we aim to meet client needs. In Kenya, the Financial Diaries and supporting risk analysis (Zollmann, 2015, with analysis by Bowman) reveals a mismatch between perception and experience of risk. In this analysis, for instance, clients significantly underestimated the impact of the death of the main income earner and overestimated the impact of health treatment. In this case, it may be better initially to “market” a health treatment cover which may meet a perceived need rather than offer life insurance which actually meets a real need.
Conclusions Property microinsurance has been an overlooked part of the microinsurance market and the previous “Cenfri diagnostic” (Smith et al., 2010) also ignored its potential as a market making product line, rather focusing on life and health. However, when one includes income generating assets and considers the high proportion that property occupies in a poor person’s portfolio of assets, it becomes an apparent and critical tool for managing risk. For housing finance lenders, in particular those with housing microfinance (HMF) loans, property insurance becomes a critical risk management tool to not only protect their loans but also the clients ability to recover from a shock. In the short run, there appears to be an opportunity to develop an enhanced housing credit insurance proposition that covers the impact of fire and the risk of a lack of effective title (as described in more detail in section 4). Both concepts relate to protecting housing

48
assets – one (“fire”) from risks to the physical condition of the house while the other (“title”) from risks to the owner’s property rights. Bundling the coverage as a compulsory feature of housing microfinance loans will support both the institution and the clients’ interests, perhaps with a more comprehensive optional up‐sell component. While these could be standalone insurance products, linking them to housing loans is the optimal first step to develop a market for these products. For lenders and insurers, two compelling reasons present themselves for putting effort into enhancing the housing microfinance loan product’s compulsory credit insurance by adding fire coverage and offering a cash payout to the borrower in the case of loss. First, as individuals invest in and increase the value of their housing asset, it becomes a growing priority to ensure that the assets are adequately protected from both the borrower and the lender’s perspective. For the borrower, a fire event is less catastrophic when she is not required to continue paying a loan for an improvement to a home that is significantly damaged or no longer exists, and the payout can jumpstart the rebuilding process. For the lender, it acts as a further risk management tool to ensure the loan is paid back, ensures that the client can come back to borrow again after a shock, is relatively simple to implement, fits within its existing loan cycle and uses client data already collected on the loan application. Second, focusing on marketing and education considerations, successfully countering the pervasive negative perception of insurance is a critical step to growing the property insurance market. While high profile public relations blitzes and well‐designed promotional materials have a role to play, positive first‐hand experience with insurance and word‐of‐mouth marketing from neighbors, friends, and family are more enduring solutions. Because compulsory insurance is often seen as a cost not a benefit to the client, enhancing the policy to offer tangible value to the borrower and lender is one strategy for positively altering attitudes toward insurance in the long‐term. Developing a title insurance product that could be bundled with the fire coverage in a single “enhanced housing credit” product, while more complicated, could become a meaningful innovation for unlocking new housing finance and insurance markets. This concept presents more legal and technical challenges, but the first step could be issuing “lender’s policies” where the insurance covers the lender’s interest (without informing the end client) and pays off some of the outstanding loan amount in the event of actual loss of possession. Housing microfinance is a logical initial target for this insurance policy because the lending is focused on borrowers who already own and live in the property. By focusing on these home loans and not offering a cash payout to the owner for any amount above the loan value, the moral hazard risk should be minimized and the available due diligence from the lender’s side should provide important information on the status of the owner and the property. Ultimately, a viable title insurance lender’s policy could expand housing credit markets by providing more certainty to the lender that their loan would be repaid while at the same time offering the owner an incentive to invest in the property. Overall, the increasing focus on bundling cover into other services, and with other products, offers potential to increase outreach and scale, although the challenge of marketing a more complex product remains. With new technology coming on line, the potential to reduce the cost of claims, automate the tracking of inventory, communication, and identification of property could help overcome some of the challenges that have historically followed property insurance and allow a range of new products to come to the forefront.

49
References Association of Kenya Insurance, 2006, 2009, and 2013 Insurance Industry Reports. Association of Microfinance Institutions – Kenya (2013). “2013 Annual Report on the Microfinance
Sector in Kenya.” Bankable Frontier Associates (2011). “GAFIS Propositions for Low Income Savers…Analysis of Kenyan
Survey.” (Unpublished). Central Bank of Kenya (2013). “Bank Supervision Annual Report.” Available at
https://www.centralbank.go.ke/index.php/news/358‐annual‐report‐2013. Communications Commission of Kenya (2013). “2013 Annual Report.” Centre for Affordable Housing Finance (2013). “2013 Yearbook: Housing Finance in Africa.” De Soto, H. (2000). “The Mystery of Capital: Why Capitalism Triumphs in the West but Fails Everywhere
Else”. New York: Basic Books. FinAccess (2013). “National Survey.” Research undertaken by the Kenya Financial Sector Deepening
Programme (FSDK) and the Central Bank of Kenya. Dataset made available to study researchers. FinMark Trust, 2011. “FinScope South Africa Small Business Survey 2010.” Study published by FinMark
Trust. Available at: http://www.finmark.org.za/wp‐content/uploads/pubs/FS‐Small‐Business_‐reportFNL.pdf (Accessed April 1, 2015).
FinScope (2014). “FinScope South Africa 2014, Consumer Survey” Garand, D., Swiderek, D. (2013). “Kenya Microinsurance Analysis.” Unpublished study commissioned by
the Kenya Financial Sector Deepening Programme. Habitat for Humanity International (2013). “Kenya Housing Market Mapping and Value Chain Analysis.” Habitat for Humanity International (2015). “Chapter 14: Secure Tenure Guidelines for Practitioners.” A
Handbook for Housing Microfinance. (3rd Ed.) Forthcoming publication, available at www.habitat.org/cisf.
Insurance Regulatory Authority (IRA) (2014). “Microinsurance Policy Framework.” Kenya Bankers Association (2015). “The State of Urban Home Ownership in Kenya: A Survey.” Available
at http://www.kba.co.ke/images/stories/hpi/Home%20own%20survey.pdf. McCord, M. et al. (2012). “The Landscape of Microinsurance in Africa 2012.” Study published by Munich
Re Foundation and GIZ. Available at: http://www.munichre‐

50
foundation.org/home/Publications/2013LandscapeofMicroinsurance_Africa_fullReport.html. (Accessed September 24, 2014).
McCord, M., Ingram, M., Tati‐Jaleran, C. (2013). “The Landscape of Microinsurance in Latin America and
the Caribbean.” Mukherjee, P., Oza, A., Chassin, L., & Ruchismita, R. (2013). “The Landscape of Microinsurance in Asia
and Oceania 2013.” Study published by Munich Re Foundation and GIZ. Porteous, D. (2005). “The Access Frontier as an Approach and Tool in Making Markets Work for the
Poor” Shelter Afrique (2011). “Feasibility Study on Developing a Social Housing Program.” Study carried out by
ShoreBank International. Smith, A., Chamberlain, D., Smit, H., Ncube, S., & Chelwa, G. (2010). “Kenya Microinsurance Landscape:
Market and Regulatory Analysis.” Study commissioned by the Insurance Regulatory Authority of Kenya. Available at http://cenfri.org/documents/microinsurance/2012/Kenya%20microinsurance%20diagnostic.pdf.
Swiss Re. “Sigma study, World Insurance in 2013: Steering Towards Recovery.” 3/2014. Yannis, Arvantis (2013). “African Housing Dynamics: Lessons from the Kenyan Market.” Africa Economic
Brief, Volume 4, Africa Development Bank Group. Zollmann, Julie (2015). “Two Steps Back: How Low Income Kenyans Think About and Experience Risk In
Their Pursuit Of Prosperity.” Study published by Financial Sector Deepening (FSD) Kenya.
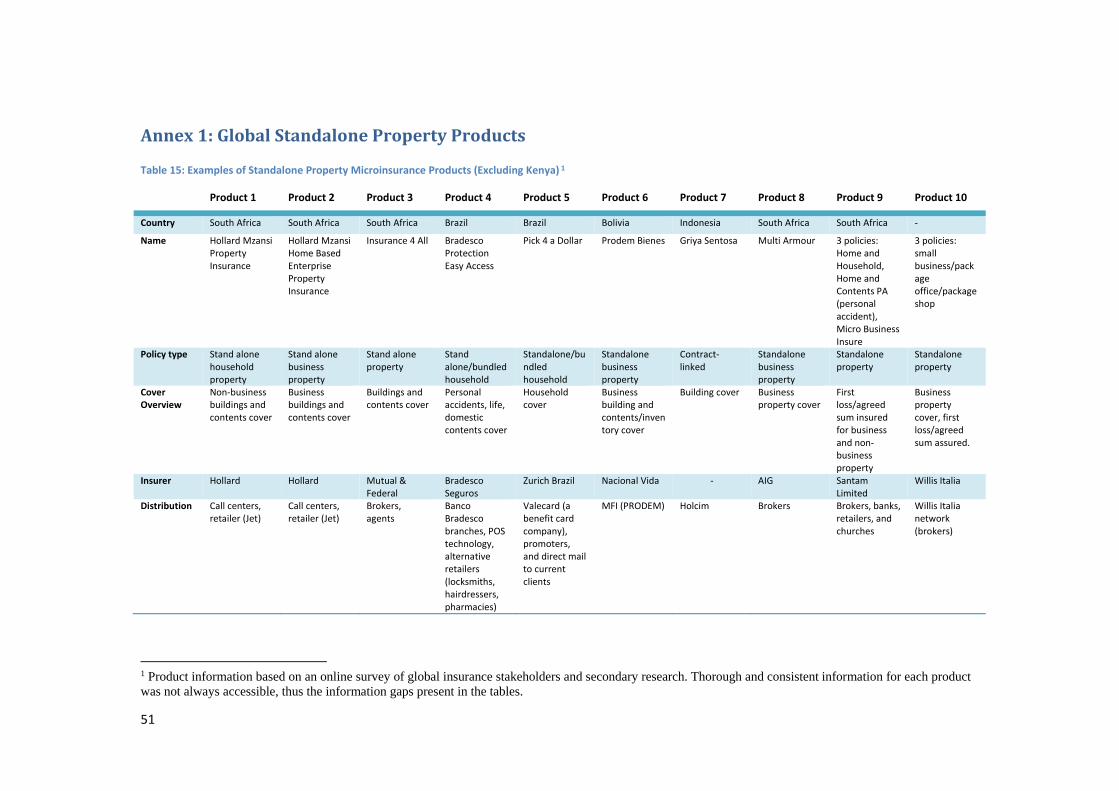
51
Annex1:GlobalStandalonePropertyProducts Table 15: Examples of Standalone Property Microinsurance Products (Excluding Kenya) 1
Product 1 Product 2 Product 3 Product 4 Product 5 Product 6 Product 7 Product 8 Product 9 Product 10
Country South Africa South Africa South Africa Brazil Brazil Bolivia Indonesia South Africa South Africa ‐
Name Hollard Mzansi Property Insurance
Hollard Mzansi Home Based Enterprise Property Insurance
Insurance 4 All Bradesco Protection Easy Access
Pick 4 a Dollar Prodem Bienes Griya Sentosa Multi Armour 3 policies: Home and Household, Home and Contents PA (personal accident), Micro Business Insure
3 policies: small business/package office/package shop
Policy type Stand alone household property
Stand alone business property
Stand alone property
Stand alone/bundled household
Standalone/bundled household
Standalone business property
Contract‐linked
Standalonebusiness property
Standaloneproperty
Standaloneproperty
Cover Overview
Non‐business buildings and contents cover
Business buildings and contents cover
Buildings and contents cover
Personal accidents, life, domestic contents cover
Household cover
Business building and contents/inventory cover
Building cover Business property cover
First loss/agreed sum insured for business and non‐business property
Business property cover, first loss/agreed sum assured.
Insurer Hollard Hollard Mutual & Federal
Bradesco Seguros
Zurich Brazil Nacional Vida ‐ AIG Santam Limited
Willis Italia
Distribution Call centers, retailer (Jet)
Call centers, retailer (Jet)
Brokers, agents
Banco Bradesco branches, POS technology, alternative retailers (locksmiths, hairdressers, pharmacies)
Valecard (a benefit card company), promoters, and direct mail to current clients
MFI (PRODEM) Holcim Brokers Brokers, banks, retailers, and churches
Willis Italia network (brokers)
1 Product information based on an online survey of global insurance stakeholders and secondary research. Thorough and consistent information for each product was not always accessible, thus the information gaps present in the tables.

52
Product 1 Product 2 Product 3 Product 4 Product 5 Product 6 Product 7 Product 8 Product 9 Product 10
Cover Details
Standard SASRIA cover ‐ cover for loss or damage to the buildings, cover for contents damaged by fire, lightning, explosion, storm, wind, hail, snow or natural flood.
Standard SASRIA cover ‐ cover for loss or damage to the buildings, cover for contents damaged by fire, lightning, explosion, storm, wind, hail, snow or natural flood.
Protects structure against loss or damage caused by natural disasters like fire, lightning, explosion, storm, wind, hail, snow and flood, impact by cars or animals. Protects the contents of against loss, damage, and theft.
‐ Basic product: Cover for accidental death in public transport or caused by other events, unemployment (Optional) Home Protection: Cover for FLEXA to contents, cover for rental loss
Covers damage due to fire, water, meteorological events, vehicle/airplane damage, rioting, violent robbery
Insurance linked to materials/house contract, offers protection from fire, riot, storm/wind and water, earthquake, tsunami, volcano. Additional 10% of insurance benefit is paid for emergency needs (e.g. temporary housing)
Total loss and damage from FLEXA for business property
FLEXA, Catnat, political unrest, theft, third party liability
FLEXA + catnat, theft, general liability for business property
Sum Assured
Between R50,000‐150,000 (4,200‐13,000 USD) cover for loss or damage to the buildings, R20,000‐50,000 (1,700‐4,200 USD) cover for contents Theft is 30% of contents sum assured
Between R50,000‐150,000 (4,200‐13,000 USD) cover for loss or damage to the buildings, R20,000‐50,000 (1,700‐4,200 USD) cover for contents Theft is 30% of contents sum assured
Building: sum assured based on number of rooms in house, from R18,000‐108,000 (1,500‐9,200 USD). Theft: 25% of sum assured
‐ Up to BRL 30,000 (USD 18,800) for FLEXA to contents of home, up to BRL 3,000 (US$ 1,880) for rental loss
Sum assured from $1‐50,000 USD
Up to IDR 25 million (around USD 2,500) to replace damage
Min/max: 10,000/40,000 (Rand?) (850‐3,400 USD)
Min/Max Home and Household Building‐5,000/370,000 Rand Content‐5,000/150,000 Rand Min/Max Home and Contents PA Death/disab‐5,000/200,000 Min/Max Micro Business Insure Contents‐75,000/750,000 Rand
Min/Max for Product 1: 500,000/15,000,000 euros Min/Max for Product 2: 300,000/5,000,000 euros Min/Max for Product 3: 100,000/3,000,000 euros

53
Product 1 Product 2 Product 3 Product 4 Product 5 Product 6 Product 7 Product 8 Product 9 Product 10
Rider An option with Funeral Insurance may be possible.
An option with Funeral Insurance may be possible.
optional bereavement and funeral
‐ ‐ ‐ ‐ ‐ SASRIA (RSA Riot and Strike cover); Personal legal liability up to R100,000; Public liability up to R3,000,000; Products liability up to R1,000,000
‐
Premium R65.10‐130.19 (5‐11 USD)
R115.96‐180.58 (10‐15 USD)
R21 and up (2 USD)
‐ BRL 5.99 (about US$ 3.75) for basic product, each extra cover cost BRL 3.00 (about US$ 1.90)
$3.10 USD per $1,000 USD, for SA less than $25,000 USD $2.60 USD for SA above $25,000 USD
‐ ‐ Minimum of 15 R (1.20 USD)
90 euro (minimum annual), 250 euro (max annual)
Underwriting and Assessment
‐ ‐ ‐ ‐ ‐ ‐ ‐ Ownership documents, qualified assessment
Self assessment by the client (no formal assessment required)
Ownership documents, brief visual inspection and sign off by insurer, self assessment by the client. Value of property determined by area‐based estimates and proposal form
Term of policy
Annual Annual Annual Annual Annual Annual ‐ Monthly ‐ Annual
Launched 2011‐2012 ‐ 2008 2012 2010 ‐ ‐ ‐ Home and Household: 2007 Home and Contents PA: 2013 Micro Business Insure: 2012
2010/2012/2013

54
Product 1 Product 2 Product 3 Product 4 Product 5 Product 6 Product 7 Product 8 Product 9 Product 10
Scale >10,000 policies
‐ Limited take up
>10,000policies
>100,000 policies
Limited take up
‐ Limited take up
Limited take up
Limited take up
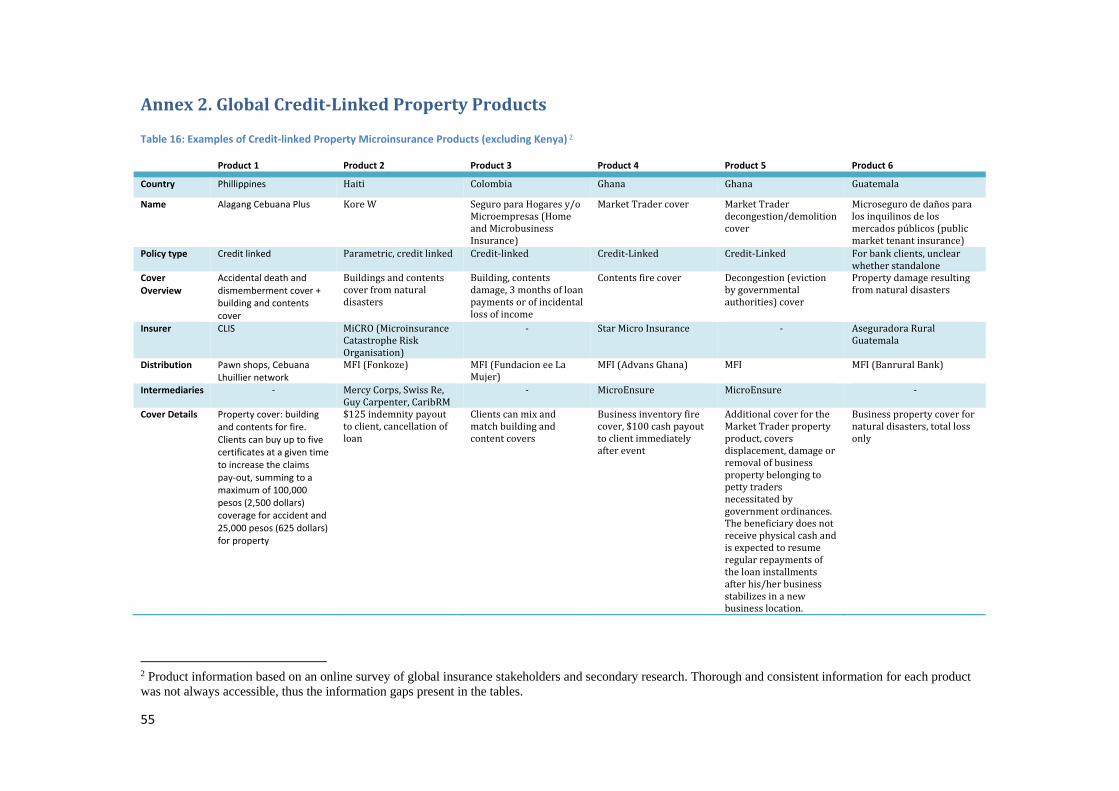
55
Annex2.GlobalCredit‐LinkedPropertyProducts Table 16: Examples of Credit‐linked Property Microinsurance Products (excluding Kenya) 2
Product 1 Product 2 Product 3 Product 4 Product 5 Product 6
Country Phillippines Haiti Colombia Ghana Ghana Guatemala
Name Alagang Cebuana Plus KoreW SeguroparaHogaresy/oMicroempresas(HomeandMicrobusinessInsurance)
MarketTradercover MarketTraderdecongestion/demolitioncover
Microsegurodedañosparalosinquilinosdelosmercadospúblicos(publicmarkettenantinsurance)
Policy type Credit linked Parametric,creditlinked Credit‐linked Credit‐Linked Credit‐Linked Forbankclients,unclearwhetherstandalone
Cover Overview
Accidental death and dismemberment cover + building and contents cover
Buildingsandcontentscoverfromnaturaldisasters
Building,contentsdamage,3monthsofloanpaymentsorofincidentallossofincome
Contentsfirecover Decongestion(evictionbygovernmentalauthorities)cover
Propertydamageresultingfromnaturaldisasters
Insurer CLIS MiCRO(MicroinsuranceCatastropheRiskOrganisation)
‐ StarMicroInsurance ‐ AseguradoraRuralGuatemala
Distribution Pawn shops, Cebuana Lhuillier network
MFI(Fonkoze) MFI(FundacioneeLaMujer)
MFI(AdvansGhana) MFI MFI(BanruralBank)
Intermediaries ‐ MercyCorps,SwissRe,GuyCarpenter,CaribRM
‐ MicroEnsure MicroEnsure ‐
Cover Details Property cover: building and contents for fire. Clients can buy up to five certificates at a given time to increase the claims pay‐out, summing to a maximum of 100,000 pesos (2,500 dollars) coverage for accident and 25,000 pesos (625 dollars) for property
$125indemnitypayouttoclient,cancellationofloan
Clientscanmixandmatchbuildingandcontentcovers
Businessinventoryfirecover,$100cashpayouttoclientimmediatelyafterevent
AdditionalcoverfortheMarketTraderpropertyproduct,coversdisplacement,damageorremovalofbusinesspropertybelongingtopettytradersnecessitatedbygovernmentordinances.Thebeneficiarydoesnotreceivephysicalcashandisexpectedtoresumeregularrepaymentsoftheloaninstallmentsafterhis/herbusinessstabilizesinanewbusinesslocation.
Businesspropertycoverfornaturaldisasters,totallossonly
2 Product information based on an online survey of global insurance stakeholders and secondary research. Thorough and consistent information for each product was not always accessible, thus the information gaps present in the tables.

56
Product 1 Product 2 Product 3 Product 4 Product 5 Product 6
Sum Assured 20,000 pesos (500 dollars) in personal protection and 5,000 pesos (125 dollars) in fire assistance
Loanbalance BUILDING:MaxsumassuredforstrongconstructionUSD5,435MaxsumassuredforweakconstructionUSD1,630Contents:MaxsumassuredUSD2,717(Basic)MaxsumassuredUSD543(Theft)MaxsumassuredUSD543(InternalDamage)
Loanbalance ThemaximumamountpayableisGHS3,000.00approx.USD900.00
Minimumsumassuredis3,000/6,000/13,000/25,000(currencyislikelydollars,thoughsourcewasnotclearonthis)
Rider Doc Cebuana, a value added service which provides free phone consultations with doctors
‐ ‐ ‐ ‐ Accidentaldeath insurance,uptospecifiedamount
Premium 25 pesos (around 0.62 USD)
3%ofloan(subsidized),8%(unsubsidized)
$6.20‐$13.70(building‐dependingonqualityofconstruction);$4.57‐$11.68(contents)
‐ ‐ 1.5‐ 4USD
Payment methods
‐ Cash,bankdebitorder,premiumfinancing
‐ ‐ ‐ Bankdebitorder
Underwriting and Assessment
‐ Inspectionandphotosfromcreditcenterchief.Useofcreditcenters/branchestoproviderapidlossassessmentsafteradisaster.
‐ ‐ ‐ Ownershipdocuments,picturestakenbyinsurer,briefvisualinspectionandsignoffbyinsurer,self‐assessmentbytheclient.Valueisdeterminedbymarketstudyandgeneralvisits.
Term of policy 4 months Loanterm ‐ ‐ ‐ AnnualLaunched 2004 2011 2010 ‐ ‐ 2015Scale > 1 million policies Peakedat60,000‐70,000
policies,nolongeractive.‐ ‐ ‐ ‐

57
Annex3.KenyaStandalonePropertyProducts Table 17: Examples of Kenya Standalone Property Microinsurance Products3
Product1 Product2 Product3 Product4 Product5 Product6 Product7
Country Kenya Kenya Kenya Kenya Kenya Kenya KenyaName MakaoSalama Biasharasalama NuruyaJamii DomesticPackage
(Orienthomeinsurance)
Fireandburglary(Orientstockinsurance)
M‐PesaAgentsPropertyCover
TumainiyaJamii
CoverOverview
Buildingsandcontentscover.Lossordamagetoproperty,contentsandpersonaleffectsasaresultoffire,theftandotheraccidentaloccurrences.
Businesscoveragainsttherisksoffire,lighteningandburglary.Alsoextendstocoverpoliticalviolence,waterdamage,riots,strikesandcivilcommotion.Providespersonalaccidentcoverforentrepreneurandfamily,coveringaccidentaldeath,permanentandtotaldisability,hospitalizationcashpayoutandmedicalexpenses.
Accidentaldisabilitycover,funeralcoveraswellascoverforhouseholdpropertyagainstfire.
Coverslossordamagetotheinsuredpropertythatiscausedbyaccidentalfire,explosion,burglarythatcausesvisibledamagetotheinsuredpropertyandarmedrobberyprovideditisnotcausedbyahouseholdmemberordomesticworker.Alsocoversriots,strikesandmaliciousdamageaslongastheinsureddidnotparticipateintheevents.
Coverslossordamagetothepropertythatiscausedbyaccidentalfire,explosion,burglarythatcausesvisibledamagetotheinsuredpropertyandarmedroberyprovideditisnotcausedbyanemployee.Alsocoversriots,strikesandmaliciousdamageaslongastheinsureddidnotparticipateintheevents.Theftofgoodsintheopenduringbusinesshoursonly.
Coversfire,burglary,fidelityguarantee(theftbyemployees),workersinjury,deathanddisability,lastexpense,andmedicalreimbursementforM‐Pesaagents
Providesafuneralexpensecoverforthefamily,adisabilitycoverforthepolicyownerandadomesticcover(materialdamage)forthepropertyheldbythepolicyowner.
Insurer UAPinsurance CIC CIC KenyaOrient KenyaOrient JubileeInsurance Jubileeinsurance
Distribution Agentsandbrokers Agents Chasebankagents FamilyBank,ChaseBankagents
M‐Pesa
SumAssured Valueoftheproperty 100,000‐500,000Kshs
10,000‐50,000Kshs 10,000‐50,000Kshs. ‐ 3benefitstructures,rangingfrom15,000‐200,000Kshs.
10,000‐50,000Kshs.foreachtypeofcover
Premium 2.175%ofvalueinsured(Buildings0.125%+Contents0.8%+Allrisks1.25%=2.175%)
Sumassured/premium,100,000/365,250,000/718,400,000/1,095,500,000/1,296
Benefitamount/premium,10,000/490,20,000/970,30,000/1,450,40,000/1,930,50,000/2,420
10,000to50,000SA,prem=300,Kshs.50,000to100,000SA,prem=400,Kshs.100,000to150,000SA,prem=600
Premrateof1.1%ofsumassuredsubjecttoaminimumofKsh.1,100inclusiveoflevies
1,800‐4,800Kshs.yearly
‐
3 Product information based on stakeholder interviews, an unpublished survey of the microinsurance market commissioned by FSDK, and secondary research. Thorough and consistent information for each product was not always accessible, thus the information gaps present in the tables.

58
Product1 Product2 Product3 Product4 Product5 Product6 Product7
Excesspayable(deductible)
‐ ‐ ‐ ‐ Anexcessof10%isimposedsubjecttoaminimumofKshs.5000
‐ ‐
Paymentmethods
‐ Cashorpremiumfinancing
Mpesa Premiumfinancingthroughchasebank
Premiumfinancingthroughthebank
M‐Pesa ‐
Paymentfrequency
‐ ‐ Annual ‐ ‐ Annual Annual
UnderwritingandAssessment
‐ ‐ ‐ ‐ ‐ ‐ Policeabstractand/oraletterofconfirmationfromthelocalchief,andalettersignedbyrecognizedofficialsoftheassociationorgroup,businesspermit/rentalreceiptandacopyofid
Exclusions ‐ Forburglary,thefirst10%ofeveryclaim(minimumKsh5,000/),theftorattemptedtheftwhereanymemberoftheinsured’shousehold,orhisbusinessstaff,oranypersonlawfullyinthepremisesisinvolved.Lossordamageoccasionedbyconfiscationbyauthorities,inconsequencedirectlyorindirectlybyactsofterrorism.
Childrenabovetheageof24years,deathofafamilymembernotnamedintheschedule,death,disabilityorlossofpropertyasaresultofpoliticalrisks,riot,strike,civilcommotion,andactsofterrorism
Armedrobberycausedbyfamilymembersordomesticworkers,jewelryandportableitemslikecameras,laptops,watchesandmobilephones,politicaleventsorterrorism
Politicaleventsorterrorism,robberycommittedbyemployees,breakdownormalfunctionofelectricalequipment,lossesarisingfromuseofaduplicatekeyunlessviolentlyacquired.
‐ ‐
Termofpolicy
‐ ‐ Annual ‐ ‐ Annual Annual
Launched 2014 2010 ‐ ScheduledtolaunchQ4of2012
2011 ‐ ‐
Scale ‐ Limited take up Limited take up ‐ Limited take up ‐ ‐

59
Annex4.KenyaCredit‐LinkedProducts Table 18: Examples of Kenya Credit‐Linked Property Microinsurance Products4
Product1 Product2
Country Kenya Kenya
Name PropertyInsurance MarketTraderdecongestion/demolitioncover
CoverOverview Fireandperilstogetherwithpoliticalviolencecover.Thepolicypaystheoutstandingloanbalanceondamagetotheborrower'sbusinessbyfireandperils.Italsopaysondestructionofthebusinessbypoliticalviolence.
Decongestion(evictionbygovernmentalauthorities)cover
Insurer APAInsurance APAInsuranceDistribution MFIs,Cooperatives MFI’sIntermediaries MicroEnsure MicroEnsure
CoverDetails AdditionalcoverfortheMarketTraderpropertyproduct,coversdisplacement,damageorremovalofbusinesspropertybelongingtopettytradersnecessitatedbygovernmentordinances.Thebeneficiarydoesnotreceivephysicalcashandisexpectedtoresumeregularrepaymentsoftheloaninstallmentsafterhis/herbusinessstabilizesinanewbusinesslocation.
SumAssured Sumassured:valueoftheloan(fromaslowas$50toashighas$8,000) Premium Arateisappliedontheloanamountdependingontermofloan.From$2per
annum
Paymentmethods PaidbyMFI
Paymentfrequency Singlepaymentforloanperiod
Exclusions Lossbytheft,damagethroughcessationofwork,damageordestructionofpropertybygovernmentorlocalauthorityorders.
Supportstructures Clientsregularlytrainedontheproduct.Tutorialcards&postersprintedfortheclient
Launched 2010
Scale Notablescaleachievedinjust2years
4 Product information based on stakeholder interviews, an unpublished survey of the microinsurance market commissioned by FSDK, and secondary research. Thorough and consistent information for each product was not always accessible, thus the information gaps present in the tables.

60
Annex5.StakeholdersInterviewed
Agence Francaise de Developpement (French Development Agency)
APA Insurance Equity Insurance Agency
Habitat for Humanity KenyaHousing Finance Insurance Agency
Insurance Regulatory Authority of Kenya
Jubilee Insurance
Kenya Commercial Bank
Kenya Financial Sector Deepening ProgrammeMicroEnsure National Cooperative Housing Union (NACHU)
Safaricom
Shelter Afrique
UAP Insurance

61
Annex6.BreakdownofHouseholdSurveyRespondents
Urban Rural Total Comments
Nairobi 39 0 39
Kawangare, Kakamega, NACHU group. Most
w/ income = Ksh 10‐25k/month, some = Ksh
26‐40k/month; all but one in permanent
houses; and most (75%) are owners.
Rift Valley 15 25 40
Cheptiret, Eldoret. Most w/ income = Ksh 10‐
25k/month, some = Ksh 26‐40k/month; most
(70%) in permanent houses, and all but one
are owners.
Coast 51 16 67
Likoni, Kisauni, Mazaras. Most w/ income =
Ksh 10‐25k/month, some = Ksh 26‐
40k/month; 96% of the urban are in
permanent houses and 64% of urban are
owners; only 30% of rural are in permanent
houses and 100% of rural are owners.
Western 11 25 36
Chavakali, Kakamega. Most w/ income = Ksh
10‐25k/month, some = Ksh 26‐40k/month;
most (73% urban, 75% rural) are in
permanent houses; all (urban and rural) are
owners.
Upper Eastern 15 0 15Archers Post. All w/ income = Ksh 10‐
25k/month; all in permanent houses; all
owners.
Total 131 66 197


