
April 2020 FC 180/2
This document may be printed on demand following an FAO initiative to minimize its environmental impact and
promote greener communications. This and other documents can be consulted at www.fao.org
NC164/e
E
FINANCE COMMITTEE
Hundred and Eightieth Session
Rome, 18 - 22 May 2020
Financial Position of the Organization
Queries on the substantive document may be addressed to:
Mr Aiman Hija
Director and Treasurer, Finance Division
Tel: +3906 5705 4676

2 FC 180/2
EXECUTIVE SUMMARY
This document presents an update to the Finance Committee on the financial position of the
Organization as at 31 December 2019 (the end of biennium 2018-19).
Regular Programme Liquidity Position - As at 31 December 2019, the balance of Regular
Programme cash, cash equivalents and short-term deposits amounted to USD 223.7 million
(USD 162.5 million at 31 December 2017 the end of the previous biennium).
Staff Related Liabilities - The total liability of the four plans as at 31 December 2019 was
USD 1 481.6 million of which USD 928.5 million was unfunded (After Service Medical
Coverage accounted for USD 866.0 million of the unfunded liability, whilst the
Termination Payments Fund accounted for the remaining unfunded portion of
USD 62.5 million). The underfunding of the After Service Medical Coverage (ASMC)
liability continues to be a cause of major structural deficit on the General Fund.
Available-for-sale Investments - The value of long-term investments at 31 December 2019
amounted to USD 553.1 million (USD 534.3 million at 31 December 2017). The increase of
USD 18.8 million reflected the positive performance of both equity and fixed income
markets.
General and Related Fund deficit - The General Fund deficit increased from
USD 899.3 million as at 31 December 2017 to USD 937.6 million as at 31 December 2019.
GUIDANCE SOUGHT FROM THE FINANCE COMMITTEE
The Committee is invited to note that while the liquidity position of the Organization is
stable, its ongoing cash flow health is dependent on the timely payment of assessed
contributions, and to urge all Member Nations to make timely and full payment of assessed
contributions.
Draft Advice
The Committee:
noted that based on the latest Regular Programme cash levels and projected payment
patterns of Member Nations, the Organization’s liquidity was expected to be sufficient to
cover operational needs through 31 December 2020;
recognizing that the Organization’s ongoing cash flow health was dependent on the timely
payment of assessed contributions, urged Member Nations to make payments of assessed
contributions on time and in full;
noted the increase in the General Fund deficit of the Organization to USD 937.6 million as
at 31 December 2019 from USD 899.3 million as at 31 December 2017 and that the overall
level of the deficit was primarily due to unfunded charges for staff related liabilities; and
noted the information provided on investment performance and that this matter would be
considered in further detail by the Committee under the agenda item on the Report on
Investments 2019.

FC 180/2 3
Introduction and Contents
1. The update of the Report on the Financial Position of the Organization presents an overview
of the unaudited results as at and for the biennium ended 31 December 2019. The report is organized
as follows:
Financial Results for the biennium ended 31 December 2019:
i) Statement of Assets, Liabilities, Reserves and Fund Balances as at
31 December 2019 presented by source of funds and including comparative balances
as at 31 December 2017 - Table 1.
ii) Statement of Income and Expenditure and Changes in Reserves and Fund Balances
for the biennium ended 31 December 2019 presented by source of funds and including
comparative balances for the biennium ended 31 December 2017 - Table 2.
Summary Comment on Financial Results for the biennium ended 31 December 2019.
Cash Flow for 2020 to 31 December 2020

4 FC 180/2
Table 1
UNAUDITED AUDITED
Funds Total
General and Trust and
Related UNDP
ASSETS
Cash and Cash Equivalents 223,744 772,387 996,131 680,203
Investments - Held for Trading - 594,459 594,459 509,278
Contributions Receivable from Member Nations and UNDP 182,340 54,406 236,746 227,618
less: Provision for Delays of Contributions (27,706) (9,260) (36,966) (31,329)
Accounts Receivable 43,029 8,221 51,250 42,984
Investments - Available for Sale 553,110 553,110 534,344
TOTAL ASSETS 974,517 1,420,213 2,394,730 1,963,098
LIABILITIES
Contributions Received in Advance 27,252 1,085,293 1,112,545 797,791
Unliquidated Obligations 100,298 299,293 399,591 373,986
Accounts Payable 59,930 - 59,930 55,592
Deferred Income 86,799 - 86,799 74,344
Staff Related Schemes 1,481,634 - 1,481,634 1,527,423
TOTAL LIABILITIES 1,755,913 1,384,586 3,140,499 2,829,136
RESERVES AND FUND BALANCES
Working Capital Fund 25,745 - 25,745 25,745
Special Reserve Account 31,549 - 31,549 30,434
Capital Expenditure Account 49,671 - 49,671 39,307
Security Expenditure Account 22,229 - 22,229 18,263
Special Fund for Emergency and Rehabilitation Activities - 35,627 35,627 34,993
Unrealised Gains / (Losses) on Investments 60,244 - 60,244 52,234
Actuarial (Gains)/ Losses (33,245) - (33,245) (167,712)
Fund Balances (deficit) , End of Period (937,589) - (937,589) (899,303)
TOTAL RESERVES AND FUND BALANCES (781,396) 35,627 (745,769) (866,039)
TOTAL LIABILITIES, RESERVES AND FUND BALANCES 974,517 1,420,213 2,394,730 1,963,097
STATEMENT OF ASSETS, LIABILITIES, RESERVES and FUND BALANCES
31 December 2019 31 December 2017
(USD 000)
As at 31 December 2019
FC 180/2 5
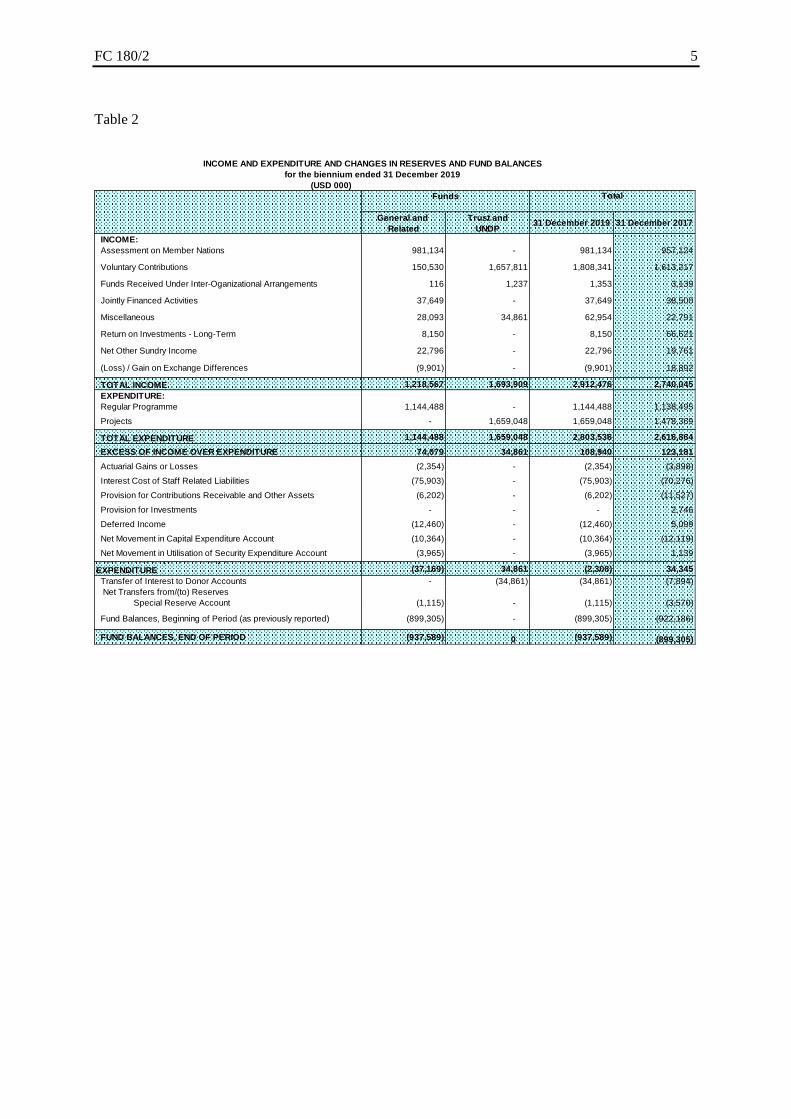
Table 2
(USD 000)
Funds
General and Trust and
Related UNDP
INCOME:
Assessment on Member Nations 981,134 - 981,134 957,124
Voluntary Contributions 150,530 1,657,811 1,808,341 1,613,217
Funds Received Under Inter-Oganizational Arrangements 116 1,237 1,353 3,139
Jointly Financed Activities 37,649 - 37,649 38,500
Miscellaneous 28,093 34,861 62,954 22,791
Return on Investments - Long-Term 8,150 - 8,150 66,621
Net Other Sundry Income 22,796 - 22,796 19,761
(Loss) / Gain on Exchange Differences (9,901) - (9,901) 18,892
TOTAL INCOME 1,218,567 1,693,909 2,912,476 2,740,045
EXPENDITURE:
Regular Programme 1,144,488 - 1,144,488 1,138,495
Projects - 1,659,048 1,659,048 1,478,369
TOTAL EXPENDITURE 1,144,488 1,659,048 2,803,536 2,616,864
EXCESS OF INCOME OVER EXPENDITURE 74,079 34,861 108,940 123,181
Actuarial Gains or Losses (2,354) - (2,354) (3,898)
Interest Cost of Staff Related Liabilities (75,903) - (75,903) (70,276)
Provision for Contributions Receivable and Other Assets (6,202) - (6,202) (11,527)
Provision for Investments - - - 2,746
Deferred Income (12,460) - (12,460) 5,099
Net Movement in Capital Expenditure Account (10,364) - (10,364) (12,119)
Net Movement in Utilisation of Security Expenditure Account (3,965) - (3,965) 1,139
(37,169) 34,861 (2,308) 34,345
Transfer of Interest to Donor Accounts - (34,861) (34,861) (7,894)
Net Transfers from/(to) Reserves
Special Reserve Account (1,115) - (1,115) (3,570)
Fund Balances, Beginning of Period (as previously reported) (899,305) - (899,305) (922,186)
FUND BALANCES, END OF PERIOD (937,589) 0 (937,589) (899,305)
Total
NET EXCESS / (SHORTFALL) OF INCOME OVER
EXPENDITURE
INCOME AND EXPENDITURE AND CHANGES IN RESERVES AND FUND BALANCES
for the biennium ended 31 December 2019
31 December 2019 31 December 2017
6 FC 180/2
Summary Comment on Financial Results for the biennium ended
31 December 2019
Liquidity position and outstanding contributions
2. The liquidity of the Organization under the General Fund as represented by cash and cash
equivalents totalled USD 223.7 million at 31 December 2019. This compared with USD 162.5 million
at 31 December 2017.
Investments - held for trading
3. The value of "Investments - held for trading" as at 31 December 2019 amounted to
USD 811.64 million and together with "term deposits" of USD 673.2 million (disclosed within cash
and cash equivalents), for a total of USD 1 484.84 million1 (USD 1 052.3 million as at
31 December 2017) mainly represented unspent balances on Trust Fund projects.
4. FAO’s prudent, low risk investment style and the interest environment in the United States of
America generated returns of 1.98 percent in 2018 and 2.44 percent in 2019. These exceeded the
benchmark returns by 16 basis points and 24 basis points in 2018 and 2019, respectively.
Investments - available-for-sale
5. Available-for-sale investment portfolios, which represent those investments set aside to fund
the Organization's Staff Related Schemes, increased in value from USD 534.3 million at
31 December 2017 to USD 553.1 million2 as at 31 December 2019. The overall increase reflects the
positive market performance of both equity and fixed income markets.
6. During 2019 the available-for-sale investment portfolio yielded an annual return of
12.80 percent, versus a benchmark return of 14.04 percent, representing an underperformance of
124 basis points.
Staff Related Schemes
7. FAO has four staff-related plans (the “Plans”) that provide benefits to staff members either
upon completion of service or as a result of work related illness or injury. The Plans are as follows:
After Service Medical Coverage (ASMC)
Separation Payments Scheme (SPS)
Compensation Plan Reserve Fund (CPRF)
Termination Payments Fund (TPF)
8. The results of the latest actuarial valuation as at 31 December 2019 and related funding
requirements and issues are presented to the 180th Session of the Finance Committee in document
FC 180/4, 2019 Actuarial Valuation of Staff Related Liabilities.
1 USD 1 484.84 million reported in FC 180/2 differs from USD 1 539.4 million reported in FC 180/3 due to the
differences in accounting classifications of: i) accrued interest income being reported within Accounts
Receivable, and ii) NT Government Select Fund, and cash and cash equivalents from the Bank of International
Settlements term deposits and from the HFT investment portfolios being reported within Cash and Cash
equivalents.
2 USD 553.1 million reported in FC 180/2 differs from USD 555.4 million reported in FC 180/3 due to the
differences in accounting valuation standards and the counting classification of accrued interest income reported
within Accounts Receivable.

FC 180/2 7
9. The total liability of the Plans at 31 December 2019 amounted to USD 1 481.6 million,
representing an decrease of USD 45.8 million compared with the balance of USD 1 527.4 million as at
31 December 2017.
10. As at 31 December 2019, unfunded staff related liabilities amounted to USD 928.5 million, of
which After Service Medical Coverage accounted for USD 866.0 million and the Termination
Payments Fund accounted for USD 62.5 million. Table 3 presents the analysis of the total actuarial
liability by plan by funding status.
Table 3
General and Related Fund Balance
11. The General Fund deficit increased from USD 899.3 million as at 31 December 2017 to
USD 937.6 million as at 31 December 2019.
TCP Implementation
12. The cumulative average monthly TCP expenditure for the biennium ended 31 December 2019
was USD 5.1 million compared with an average of USD 5.8 million for the biennium ended
31 December 2017. The overall decline in the expenditure rate for the 2018-19 biennia compared with
the 2016-17 biennia was mainly due to a large part of early approvals against the 2016-
17 appropriation having been for emergency assistance projects as these projects tend to have large
procurement components and are implemented quickly.
13. As at 31 December 2019, the available unspent appropriation from the 2018-19 biennium
totalled USD 86.8 million (USD 74.5 million as at 31 December 2017). This amount was carried
forward to 2020.
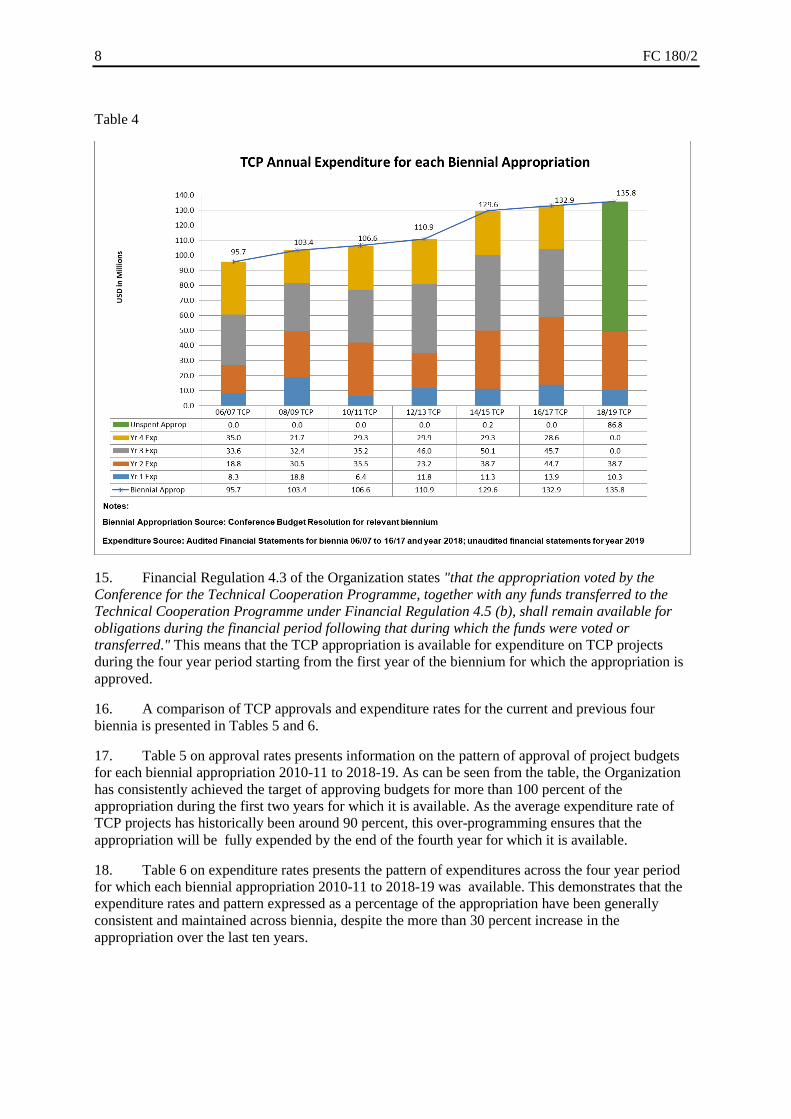
14. Table 4 presents the TCP expenditure for all appropriation periods and TCP available
appropriation for each year from 1 January 2006 to 31 December 2019.
8 FC 180/2
Table 4
15. Financial Regulation 4.3 of the Organization states "that the appropriation voted by the
Conference for the Technical Cooperation Programme, together with any funds transferred to the
Technical Cooperation Programme under Financial Regulation 4.5 (b), shall remain available for
obligations during the financial period following that during which the funds were voted or
transferred." This means that the TCP appropriation is available for expenditure on TCP projects
during the four year period starting from the first year of the biennium for which the appropriation is
approved.
16. A comparison of TCP approvals and expenditure rates for the current and previous four
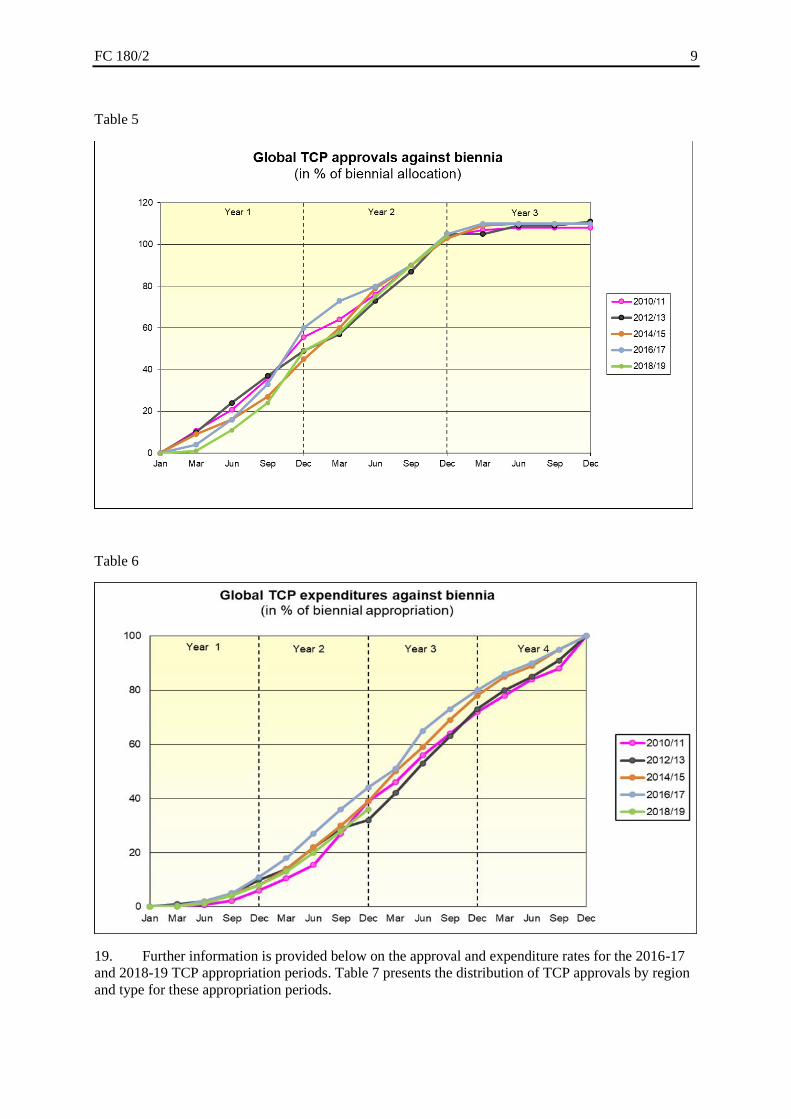
biennia is presented in Tables 5 and 6.
17. Table 5 on approval rates presents information on the pattern of approval of project budgets
for each biennial appropriation 2010-11 to 2018-19. As can be seen from the table, the Organization
has consistently achieved the target of approving budgets for more than 100 percent of the
appropriation during the first two years for which it is available. As the average expenditure rate of
TCP projects has historically been around 90 percent, this over-programming ensures that the
appropriation will be fully expended by the end of the fourth year for which it is available.
18. Table 6 on expenditure rates presents the pattern of expenditures across the four year period
for which each biennial appropriation 2010-11 to 2018-19 was available. This demonstrates that the
expenditure rates and pattern expressed as a percentage of the appropriation have been generally
consistent and maintained across biennia, despite the more than 30 percent increase in the
appropriation over the last ten years.
FC 180/2 9
Table 5
Table 6
19. Further information is provided below on the approval and expenditure rates for the 2016-17
and 2018-19 TCP appropriation periods. Table 7 presents the distribution of TCP approvals by region
and type for these appropriation periods.

10 FC 180/2
Table 7
Note: The percentage allocation of emergency funds represents the comparison of the regional
emergency approvals to the total emergency support allocation.
TCP approvals and expenditures against the 2016-17 appropriation
20. As of 31 December 2019, 733 TCP projects have been approved against the 2016-17 net
appropriation of USD 132.9 million, for a total value of USD 144.2 million. The 8.5 percent over-
programming aims to ensure the full expenditure of the appropriation by 31 December 2019 taking
into account that the average expenditure rate of TCP projects is below 100 percent of their approved
budgets.
21. Expenditures against the 2016-17 appropriation had reached USD 132.9 million on
31 December 2019 representing 100 percent of the total appropriation.
TCP approvals and expenditures against the 2018-19 appropriation
22. As of 31 December 2019, a total of 749 projects for a value of USD 141.4 million had been
approved against the 2018-19 TCP appropriation, representing 104.1 percent of the appropriation of
USD 135.8 million.
23. Expenditures against the 2018-19 appropriation had reached USD 49.0 million on
31 December 2019 representing 36 percent of the total appropriation. The balance of
USD 86.8 million is available for expenditure through 31 December 2021. This level of expenditure is
in line with previous biennia.
24. The Secretariat and in particular the Regional Offices are following-up with budget holders
and technical officers to encourage expeditious implementation of all projects.

FC 180/2 11
Losses on Exchange Differences
25. During the biennium ended 31 December 2019 the Organization recorded a net loss on
exchange of USD 9.9 million, of which:
USD 11.0 million of net losses were generated from Euro-Dollar translation differences3 (non-
cash); offset by
USD 1.1 million actual cash backed foreign exchange net gains incurred by the Organization
that were transferred to the Special Reserve Account.
Voluntary Contributions
26. “Trust Funds and UNDP” comprise activities funded from voluntary contributions through
projects, including those funded by the United Nations Development Programme.
27. Contributions Received in Advance for Trust and UNDP Funds amounted to
USD 1 085.3 million at 31 December 2019 compared with USD 752.5 million at 31 December 2017.
These amounts represent the balance of voluntary contributions received from donors which have not
yet been expended on the implementation of projects.
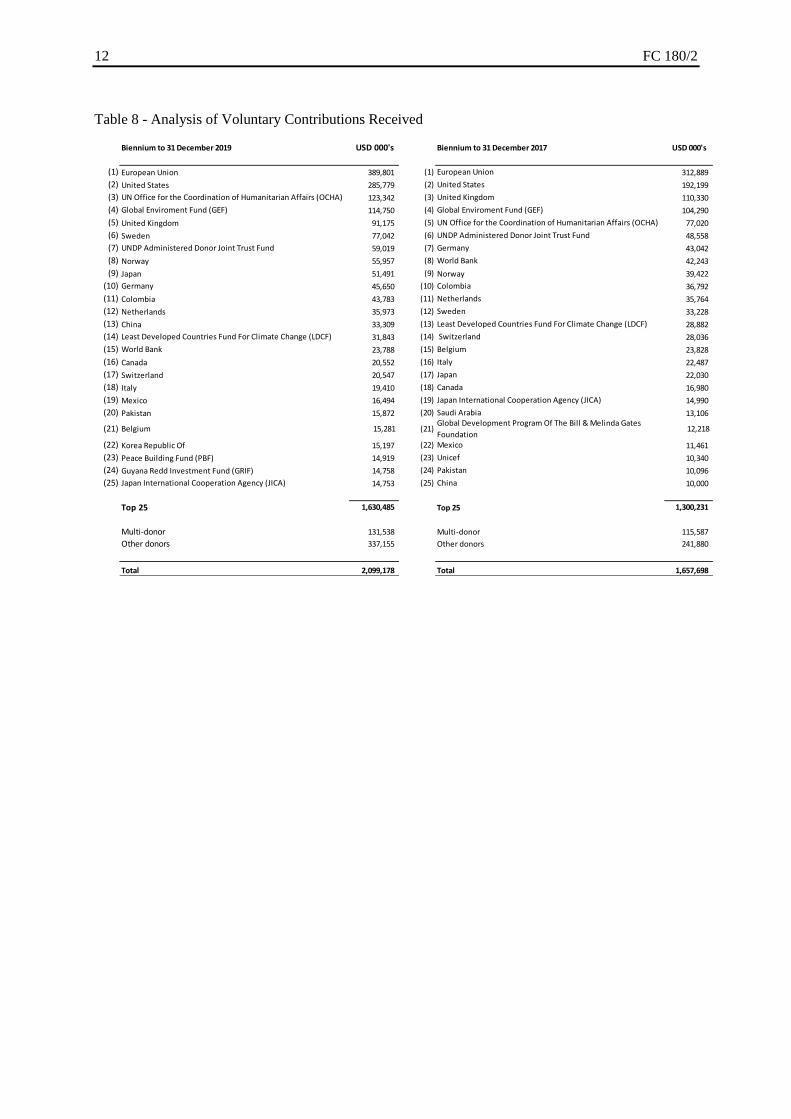
28. Table 8 presents an analysis of the Trust Fund contributions received4 from donors during the
biennium ended 31 December 2019. This table includes details of the top 25 contributors during the
period together with comparative rankings for the equivalent period to 31 December 2017.
29. In Table 2, income reported from voluntary contributions is recognized proportionately with
the degree of project activity completed as measured in terms of expenditure.
30. Income reported on Trust Fund and UNDP projects for the biennium to 31 December 2019
amounted to USD 1 657.8 million, compared with USD 1 478.4 million reported for the biennium to
31 December 2017.
3 The exchange differences are generated both as Assessments are received and also on the translation of the
outstanding balance of Assessments at the period end. 4 For operational purposes, FAO also maintains a comprehensive tracking of the approval of voluntary
contributions, counted at the time when trust funds are both approved by the resource partner and have become
operationally active. At that time, part but frequently not all of the funds have been received by FAO. The
phased model of funds receipt for trust funds explains the difference between the figures reported in this
document for “Contributions Received” and the figures for “Contributions Approved” published elsewhere.
12 FC 180/2
Table 8 - Analysis of Voluntary Contributions Received
Biennium to 31 December 2019 USD 000's Biennium to 31 December 2017 USD 000's
(1) European Union 389,801 (1) European Union 312,889
(2) United States 285,779 (2) United States 192,199
(3) UN Office for the Coordination of Humanitarian Affairs (OCHA) 123,342 (3) United Kingdom 110,330
(4) Global Enviroment Fund (GEF) 114,750 (4) Global Enviroment Fund (GEF) 104,290
(5) United Kingdom 91,175 (5) UN Office for the Coordination of Humanitarian Affairs (OCHA) 77,020
(6) Sweden 77,042 (6) UNDP Administered Donor Joint Trust Fund 48,558
(7) UNDP Administered Donor Joint Trust Fund 59,019 (7) Germany 43,042
(8) Norway 55,957 (8) World Bank 42,243
(9) Japan 51,491 (9) Norway 39,422
(10) Germany 45,650 (10) Colombia 36,792
(11) Colombia 43,783 (11) Netherlands 35,764
(12) Netherlands 35,973 (12) Sweden 33,228
(13) China 33,309 (13) Least Developed Countries Fund For Climate Change (LDCF) 28,882
(14) Least Developed Countries Fund For Climate Change (LDCF) 31,843 (14) Switzerland 28,036
(15) World Bank 23,788 (15) Belgium 23,828
(16) Canada 20,552 (16) Italy 22,487
(17) Switzerland 20,547 (17) Japan 22,030
(18) Italy 19,410 (18) Canada 16,980
(19) Mexico 16,494 (19) Japan International Cooperation Agency (JICA) 14,990
(20) Pakistan 15,872 (20) Saudi Arabia 13,106
(21) Belgium 15,281 (21)Global Development Program Of The Bill & Melinda Gates
Foundation 12,218
(22) Korea Republic Of 15,197 (22) Mexico 11,461
(23) Peace Building Fund (PBF) 14,919 (23) Unicef 10,340
(24) Guyana Redd Investment Fund (GRIF) 14,758 (24) Pakistan 10,096
(25) Japan International Cooperation Agency (JICA) 14,753 (25) China 10,000
Top 25 1,630,485 Top 25 1,300,231
Multi-donor 131,538 Multi-donor 115,587
Other donors 337,155 Other donors 241,880
Total 2,099,178 Total 1,657,698

FC 180/2 13
2020 Cash Flow Forecast (Regular Programme)
31. Table 9 below presents the Organization’s actual consolidated Regular Programme month end
short-term liquidity position (which includes cash and cash equivalents) with a forecast from 1 January
through 31 December 2020 and comparative figures for 2019. All figures are expressed in
United States Dollars millions.
32. The opening cash flow position was USD 223.7 million as at 31 December 2019 compared
with USD 226.0 million at 31 December 2018. The percentage of 2019 assessed contributions paid to
the Organization by Member Nations as at 31 December 2019 was 74.84 percent, a lower rate of
receipts than the equivalent figure of 78.60 percent for the previous year. Further details on the status
of current assessments and arrears as at 31 December 2019 are presented in document FC 180/INF/2.
33. Based on Members’ past payment patterns and the Regular Programme cash level as at
31 December 2019, the Organization’s liquidity is expected to be sufficient to cover operational needs
through the end of 2020. The current forecast is based on a similar trend as in the previous year and is
subject to change upon receipt of confirmation from the Members of their expected payment dates.
Consequently, the accuracy of the forecast in Table 9 below is dependent on the actual timing of the
receipts of the most significant contributions in 2020.
Table 9


