Fairbank, Maslin, Maullin & AssociatesOpinion Research & Public Policy Analysis
Santa Monica, CA – Oakland, CA – Madison, WI - Mexico City
220-2515
June 5-15, 2008
Los Angeles County Los Angeles County Transportation Survey Transportation Survey
20072007
Fairbank, Maslin,
Maullin & AssociatesOpinion Research &
Public Policy Analysis
Los Angeles County Transportation Survey 2008
Slide 2
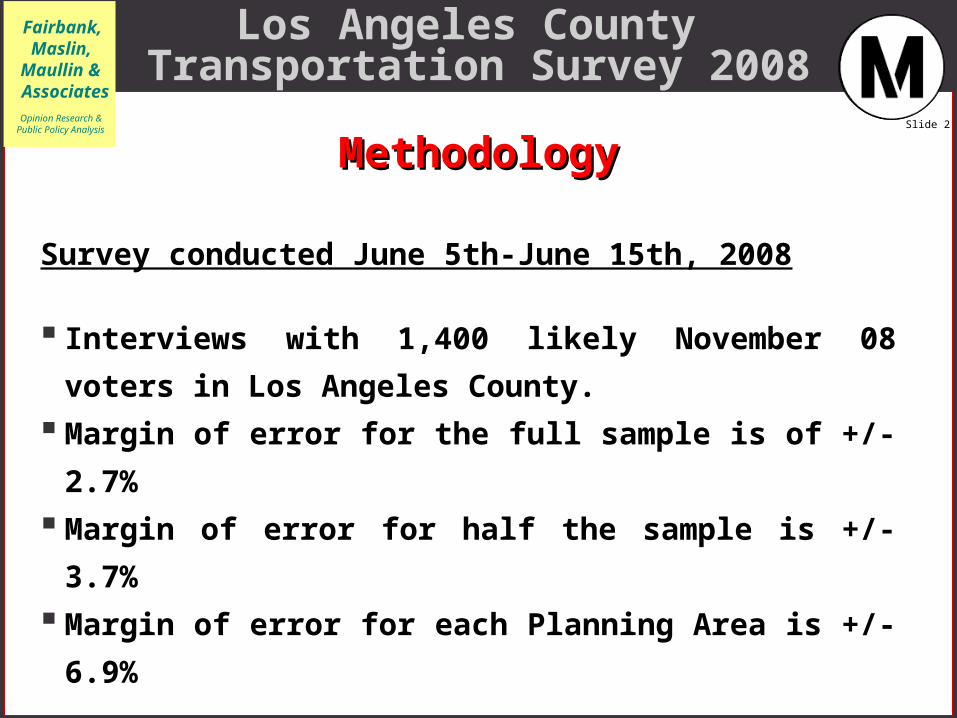
MethodologyMethodology
Survey conducted June 5th-June 15th, 2008
Interviews with 1,400 likely November 08 voters in Los
Angeles County.
Margin of error for the full sample is of +/- 2.7%
Margin of error for half the sample is +/-3.7%
Margin of error for each Planning Area is +/-6.9%
Fairbank, Maslin,
Maullin & AssociatesOpinion Research &
Public Policy Analysis
Los Angeles County Transportation Survey 2008
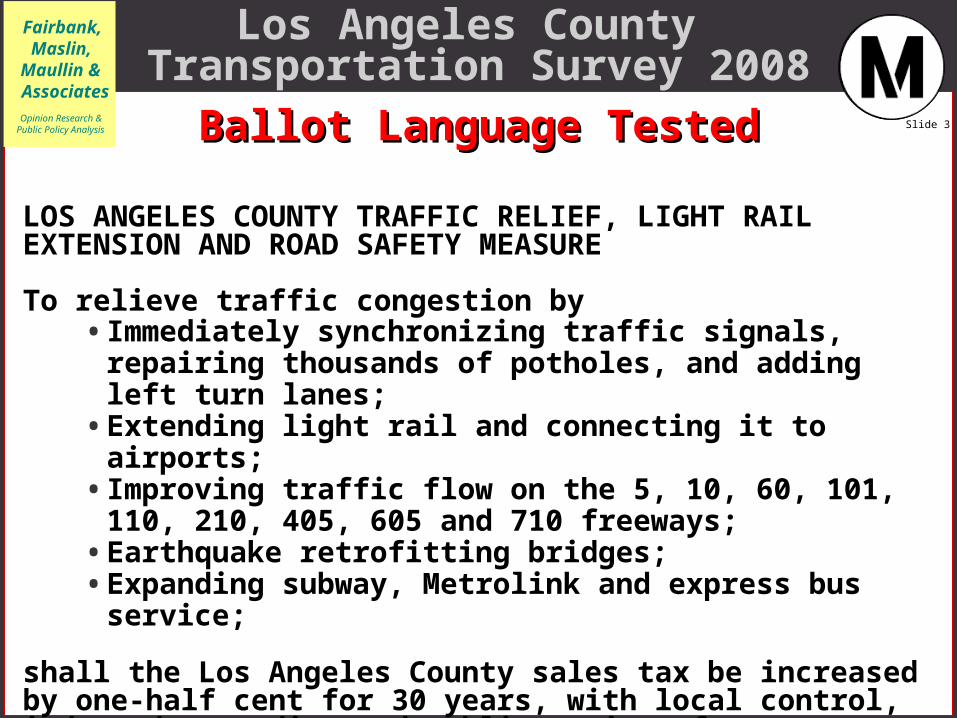
Slide 3Ballot Language TestedBallot Language Tested
LOS ANGELES COUNTY TRAFFIC RELIEF, LIGHT RAIL EXTENSION AND ROAD SAFETY MEASURE
To relieve traffic congestion by • Immediately synchronizing traffic signals, repairing
thousands of potholes, and adding left turn lanes;• Extending light rail and connecting it to airports;• Improving traffic flow on the 5, 10, 60, 101, 110, 210, 405,
605 and 710 freeways;• Earthquake retrofitting bridges;• Expanding subway, Metrolink and express bus service;
shall the Los Angeles County sales tax be increased by one-half cent for 30 years, with local control, independent audits and public review of expenditures?

Fairbank, Maslin,
Maullin & AssociatesOpinion Research &
Public Policy Analysis
Los Angeles County Transportation Survey 2008
Slide 4Initial Ballot Vote and Vote After Initial Ballot Vote and Vote After General and Specific Area Projects/Services General and Specific Area Projects/Services
37%
21%
5%
2%
7%
22%
6%
0% 20% 40% 60% 80%
TOTALTOTALNONO30%30%
TOTAL TOTAL YESYES63%63%
Definitely yes
Probably yes
Lean yes
Lean no
Probably no
Definitely no
Undecided
5/9 (Split Sample C). If the election were held today on this measure, do you think you would vote yes in favor or no to oppose it?
Initial Ballot Vote
42%
22%
6%
2%
4%
18%
6%
0% 20% 40% 60% 80%
TOTALTOTALNONO26%26%
TOTAL TOTAL YESYES70%70%
Vote After Projects/Services
(Traffic Relief, Light Rail, Road Safety Measure)

Fairbank, Maslin,
Maullin & AssociatesOpinion Research &
Public Policy Analysis
Los Angeles County Transportation Survey 2008
Slide 5
45%
21%
7%
3%
1%
18%
5%
0% 20% 40% 60% 80%
Initial Ballot Vote and Vote After General Initial Ballot Vote and Vote After General and Specific Area Projects/Services and Vote and Specific Area Projects/Services and Vote
after Supportive Statementsafter Supportive Statements
37%
21%
5%
2%
7%
22%
6%
0% 20% 40% 60% 80%
TOTALTOTALNONO30%30%
TOTAL TOTAL YESYES63%63%
Definitely yes
Probably yes
Lean yes
Lean no
Probably no
Definitely no
Undecided
5/9 (Split Sample C)/11 (Split Sample C). If the election were held today on this measure, do you think you would vote yes in favor or no to oppose it?
Initial Ballot Vote
TOTALTOTALNONO26%26%
TOTAL TOTAL YESYES73%73%
Vote After Projects/Services
42%
22%
6%
2%
4%
18%
6%
0% 20% 40% 60% 80%
Vote After Supportive Statements
TOTALTOTALNONO26%26%
TOTAL TOTAL YESYES70%70%
(Traffic Relief, Light Rail, Road Safety Measure)

Fairbank, Maslin,
Maullin & AssociatesOpinion Research &
Public Policy Analysis
Los Angeles County Transportation Survey 2008
Slide 6Oppositional StatementOppositional Statement
Those people who oppose the measure say that this regressive tax comes at a bad time because hard working families and individuals are getting squeezed in their pocket books from higher food costs, rising gas prices and increased home foreclosures. Opponents also say that the plan calls for only 30 percent of the funds raised to be used for mass transit projects, while 25 percent will go to pay the salaries of already highly paid bus drivers and mechanics, who have gone on strike nine times in the last 35 years. Finally, opponents say Los Angeles County residents have been paying a one-cent sales tax dedicated for local street, freeway and mass transit improvements for the last 20 years, and we still have traffic gridlock. Why should we trust the government now to follow through on their promises.
12. If the election were held today, would you vote yes in favor or no to oppose it?
Fairbank, Maslin,
Maullin & AssociatesOpinion Research &
Public Policy Analysis
Los Angeles County Transportation Survey 2008
Slide 7
37%
21%
5%
2%
7%
22%
6%
0% 20% 40% 60% 80%
42%
22%
6%
2%
4%
18%
6%
0% 20% 40% 60% 80%
45%
21%
7%
3%
1%
18%
5%
0% 20% 40% 60% 80%
38%
20%
8%
3%
4%
20%
7%
0% 20% 40% 60% 80%
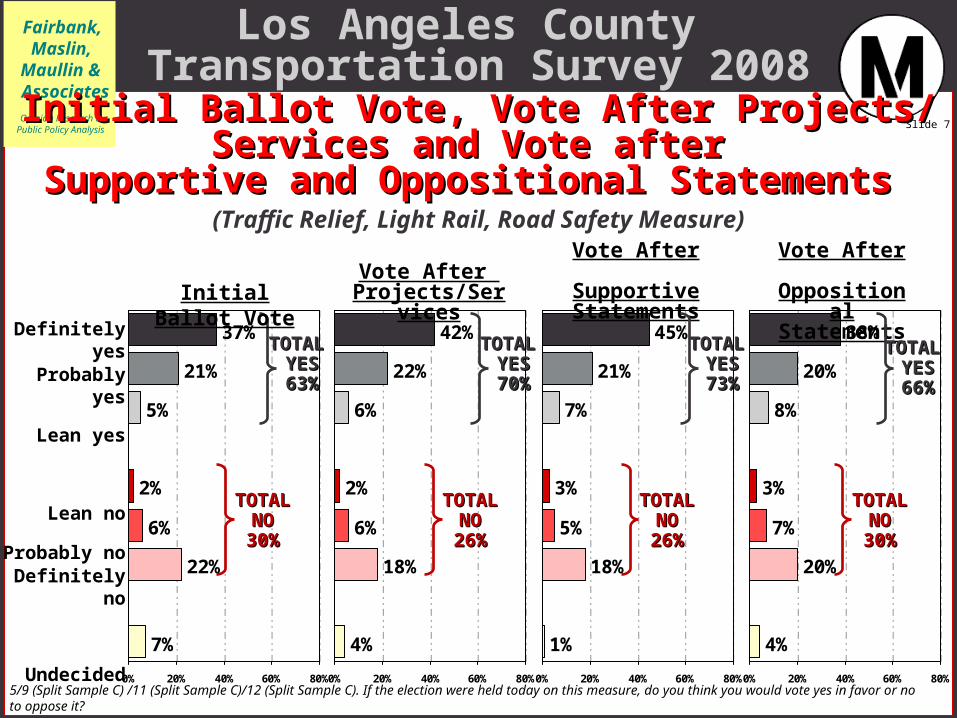
Initial Ballot Vote, Vote After Projects/Initial Ballot Vote, Vote After Projects/Services and Vote after Services and Vote after
Supportive and Oppositional Statements Supportive and Oppositional Statements
TOTALTOTALNONO30%30%
TOTAL TOTAL YESYES63%63%
Definitely yes
Probably yes
Lean yes
Lean no
Probably no
Definitely no
Undecided
5/9 (Split Sample C) /11 (Split Sample C)/12 (Split Sample C). If the election were held today on this measure, do you think you would vote yes in favor or no to oppose it?
Initial Ballot VoteVote After
Projects/Services
Vote After Supportive Statements
Vote After OppositionalStatements
TOTALTOTALNONO26%26%
TOTAL TOTAL YESYES70%70%
TOTALTOTALNONO26%26%
TOTAL TOTAL YESYES73%73%
TOTALTOTALNONO30%30%
TOTAL TOTAL YESYES66%66%
(Traffic Relief, Light Rail, Road Safety Measure)
Fairbank, Maslin,
Maullin & AssociatesOpinion Research &
Public Policy Analysis
Los Angeles County Transportation Survey 2008
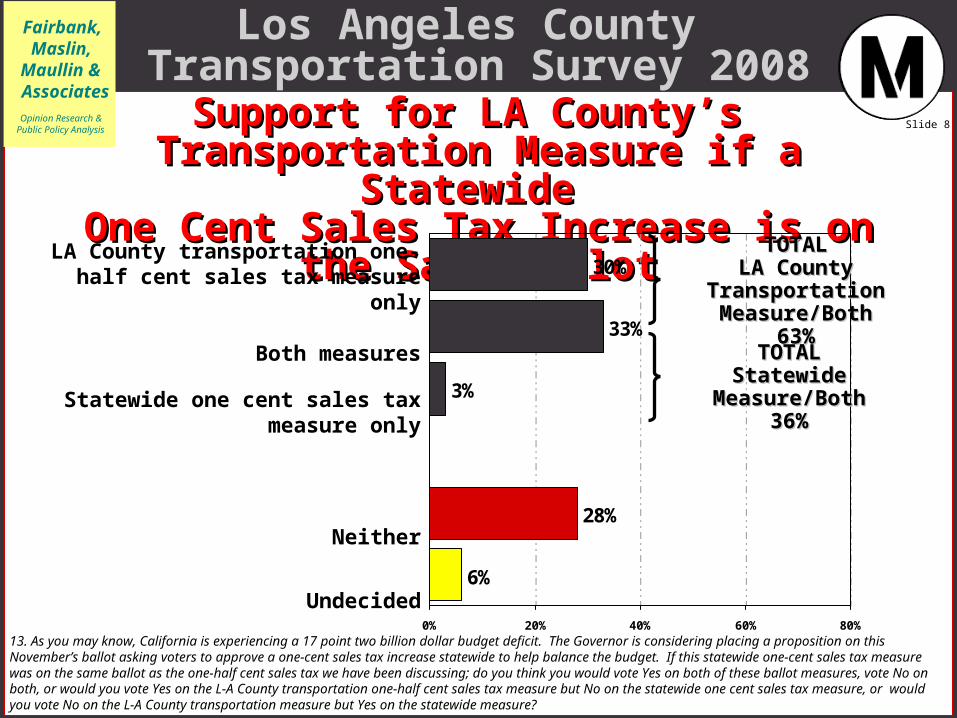
Slide 8Support for LA County’s Support for LA County’s Transportation Measure if a Statewide Transportation Measure if a Statewide
One Cent Sales Tax Increase is on the Same BallotOne Cent Sales Tax Increase is on the Same Ballot
30%
33%
3%
28%
6%
0% 20% 40% 60% 80%
TOTALTOTALLA County Transportation LA County Transportation
Measure/BothMeasure/Both63%63%
13. As you may know, California is experiencing a 17 point two billion dollar budget deficit. The Governor is considering placing a proposition on this November’s ballot asking voters to approve a one-cent sales tax increase statewide to help balance the budget. If this statewide one-cent sales tax measure was on the same ballot as the one-half cent sales tax we have been discussing; do you think you would vote Yes on both of these ballot measures, vote No on both, or would you vote Yes on the L-A County transportation one-half cent sales tax measure but No on the statewide one cent sales tax measure, or would you vote No on the L-A County transportation measure but Yes on the statewide measure?
TOTALTOTALStatewide Measure/BothStatewide Measure/Both
36%36%
LA County transportation one-half cent sales tax measure only
Both measures
Statewide one cent sales tax measure only
Neither
Undecided
Fairbank, Maslin, Maullin & AssociatesOpinion Research & Public Policy Analysis
Santa Monica, CA – Oakland, CA – Madison, WI - Mexico City
220-2515
June 5-15, 2008
Los Angeles County Los Angeles County Transportation Survey Transportation Survey
20072007Alternate Language
Fairbank, Maslin,
Maullin & AssociatesOpinion Research &
Public Policy Analysis
Los Angeles County Transportation Survey 2008
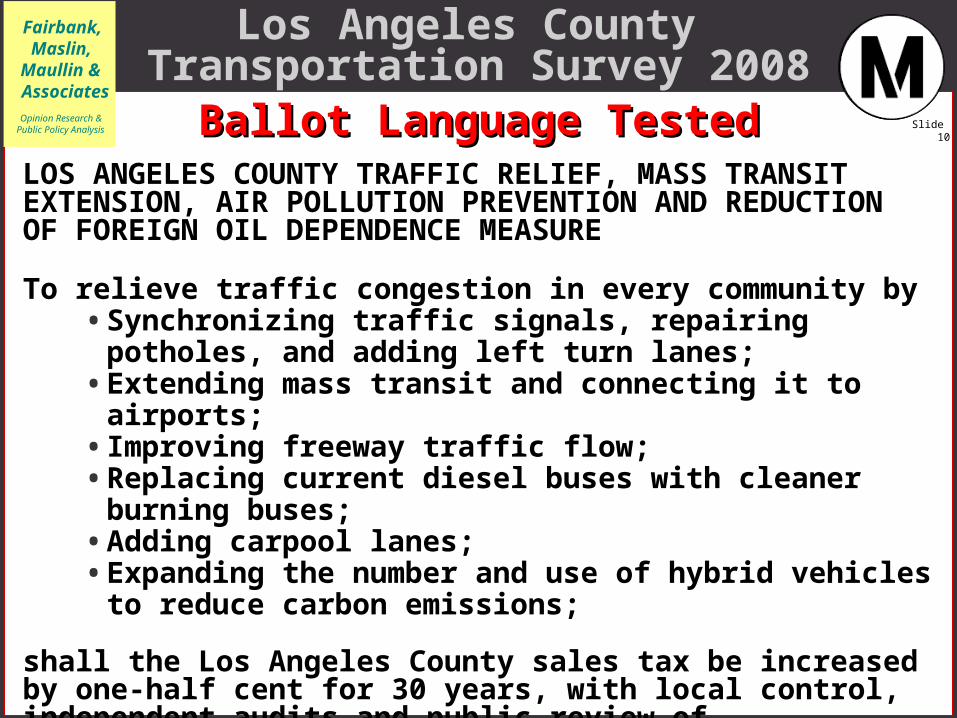
Slide 10Ballot Language TestedBallot Language TestedLOS ANGELES COUNTY TRAFFIC RELIEF, MASS TRANSIT EXTENSION, AIR POLLUTION PREVENTION AND REDUCTION OF FOREIGN OIL DEPENDENCE MEASURE
To relieve traffic congestion in every community by • Synchronizing traffic signals, repairing potholes, and
adding left turn lanes;• Extending mass transit and connecting it to airports;• Improving freeway traffic flow;• Replacing current diesel buses with cleaner burning
buses;• Adding carpool lanes;• Expanding the number and use of hybrid vehicles to
reduce carbon emissions;
shall the Los Angeles County sales tax be increased by one-half cent for 30 years, with local control, independent audits and public review of expenditures?

Fairbank, Maslin,
Maullin & AssociatesOpinion Research &
Public Policy Analysis
Los Angeles County Transportation Survey 2008
Slide 11
36%
23%
6%
2%
6%
20%
7%
0% 20% 40% 60% 80%
Support for Traffic Relief/Light Rail and Support for Traffic Relief/Light Rail and Road Safety Versus Traffic Relief/Mass Road Safety Versus Traffic Relief/Mass
Transit/Air Pollution Prevention/Foreign Oil Transit/Air Pollution Prevention/Foreign Oil Dependence ReductionDependence Reduction
37%
21%
5%
2%
7%
22%
6%
0% 20% 40% 60% 80%
TOTALTOTALNONO30%30%
TOTAL TOTAL YESYES63%63%
Definitely yes
Probably yes
Lean yes
Lean no
Probably no
Definitely no
Undecided
5/6. If the election were held today on this measure, do you think you would vote yes in favor or no to oppose it?
Traffic Relief/Light Rail/Road Safety Measure
TOTALTOTALNONO29%29%
TOTAL TOTAL YESYES65%65%
Traffic Relief/Mass Transit/Air Pollution Prevention/Foreign
Oil Dependence Reduction
35%
24%
6%
2%
6%
18%
9%
0% 20% 40% 60% 80%
Combined
TOTALTOTALNONO29%29%
TOTAL TOTAL YESYES65%65%
Fairbank, Maslin,
Maullin & AssociatesOpinion Research &
Public Policy Analysis
Los Angeles County Transportation Survey 2008
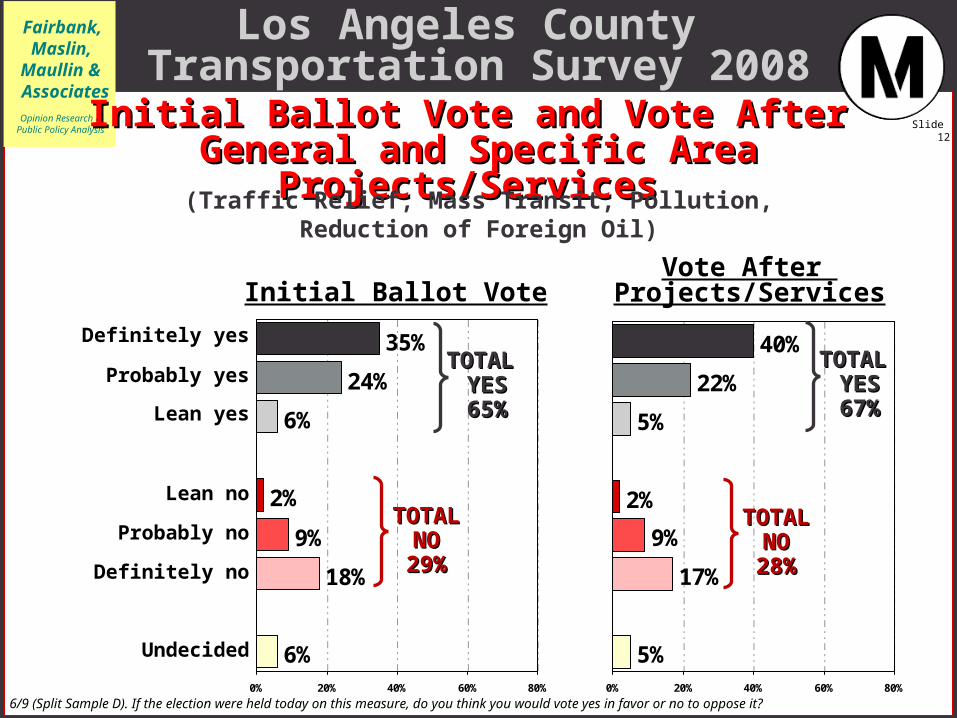
Slide 12Initial Ballot Vote and Vote After Initial Ballot Vote and Vote After General and Specific Area Projects/Services General and Specific Area Projects/Services
35%
24%
6%
2%
6%
18%
9%
0% 20% 40% 60% 80%
TOTALTOTALNONO29%29%
TOTAL TOTAL YESYES65%65%
Definitely yes
Probably yes
Lean yes
Lean no
Probably no
Definitely no
Undecided
6/9 (Split Sample D). If the election were held today on this measure, do you think you would vote yes in favor or no to oppose it?
Initial Ballot Vote
40%
22%
5%
2%
5%
17%
9%
0% 20% 40% 60% 80%
TOTALTOTALNONO28%28%
TOTAL TOTAL YESYES67%67%
Vote After Projects/Services
(Traffic Relief, Mass Transit, Pollution, Reduction of Foreign Oil)

Fairbank, Maslin,
Maullin & AssociatesOpinion Research &
Public Policy Analysis
Los Angeles County Transportation Survey 2008
Slide 13
43%
20%
7%
2%
3%
18%
7%
0% 20% 40% 60% 80%
Initial Ballot Vote and Vote After General Initial Ballot Vote and Vote After General and Specific Area Projects/Services and and Specific Area Projects/Services and
Vote after Supportive StatementsVote after Supportive Statements
35%
24%
6%
2%
6%
18%
9%
0% 20% 40% 60% 80%
TOTALTOTALNONO29%29%
TOTAL TOTAL YESYES65%65%
Definitely yes
Probably yes
Lean yes
Lean no
Probably no
Definitely no
Undecided
6/9 (Split Sample D)/11 (Split Sample D). If the election were held today on this measure, do you think you would vote yes in favor or no to oppose it?
Initial Ballot Vote
TOTALTOTALNONO27%27%
TOTAL TOTAL YESYES70% 70%
Vote After Projects/Services
40%
22%
5%
2%
5%
17%
9%
0% 20% 40% 60% 80%
Vote After Supportive Statements
TOTALTOTALNONO28%28%
TOTAL TOTAL YESYES67%67%
(Traffic Relief, Mass Transit, Pollution, Reduction of Foreign Oil Dependence)
Fairbank, Maslin,
Maullin & AssociatesOpinion Research &
Public Policy Analysis
Los Angeles County Transportation Survey 2008
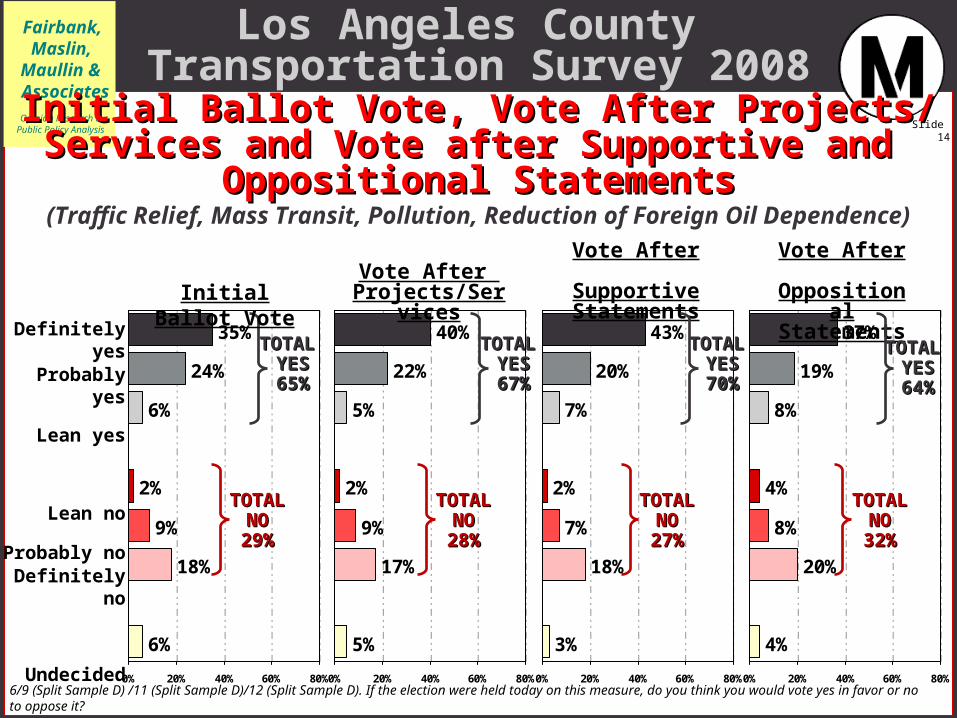
Slide 14
35%
24%
6%
2%
6%
18%
9%
0% 20% 40% 60% 80%
40%
22%
5%
2%
5%
17%
9%
0% 20% 40% 60% 80%
43%
20%
7%
2%
3%
18%
7%
0% 20% 40% 60% 80%
37%
19%
8%
4%
4%
20%
8%
0% 20% 40% 60% 80%
Initial Ballot Vote, Vote After Projects/Initial Ballot Vote, Vote After Projects/Services and Vote after Supportive and Services and Vote after Supportive and
Oppositional StatementsOppositional Statements
TOTALTOTALNONO29%29%
TOTAL TOTAL YESYES65%65%
Definitely yes
Probably yes
Lean yes
Lean no
Probably no
Definitely no
Undecided
6/9 (Split Sample D) /11 (Split Sample D)/12 (Split Sample D). If the election were held today on this measure, do you think you would vote yes in favor or no to oppose it?
Initial Ballot VoteVote After
Projects/Services
Vote After Supportive Statements
Vote After OppositionalStatements
TOTALTOTALNONO28%28%
TOTAL TOTAL YESYES67%67%
TOTALTOTALNONO27%27%
TOTAL TOTAL YESYES70%70%
TOTALTOTALNONO32%32%
TOTAL TOTAL YESYES64%64%
(Traffic Relief, Mass Transit, Pollution, Reduction of Foreign Oil Dependence)

Fairbank, Maslin, Maullin & AssociatesOpinion Research & Public Policy Analysis
Santa Monica, CA – Oakland, CA – Madison, WI - Mexico City
220-2515
June 5-15, 2008
Los Angeles County Los Angeles County Transportation Survey Transportation Survey
20072007Combined
Fairbank, Maslin,
Maullin & AssociatesOpinion Research &
Public Policy Analysis
Los Angeles County Transportation Survey 2008
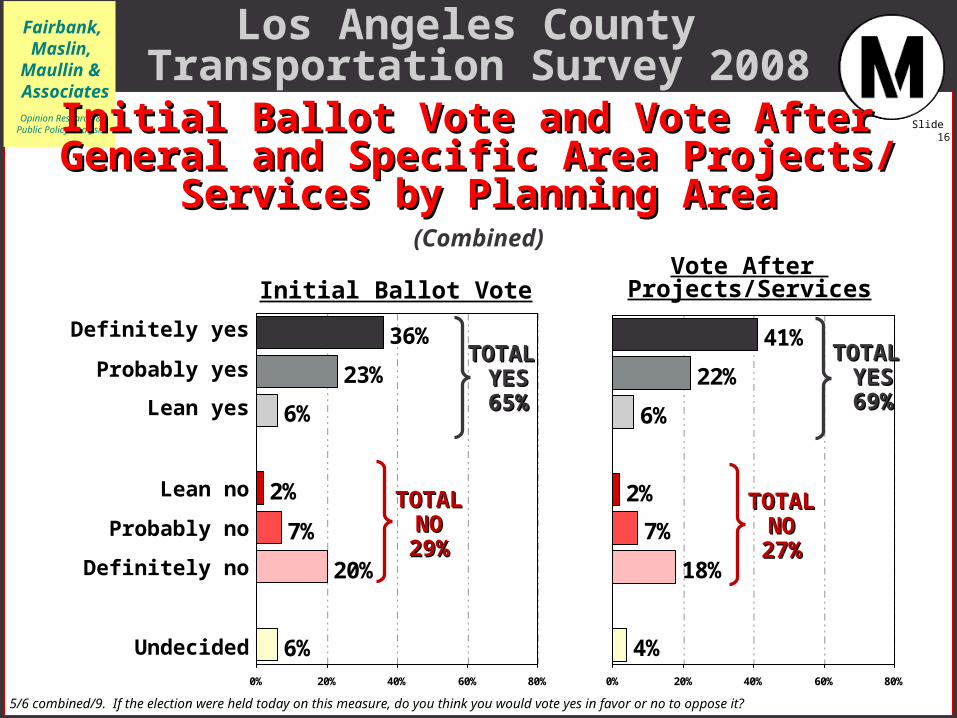
Slide 16Initial Ballot Vote and Vote After Initial Ballot Vote and Vote After General and Specific Area Projects/General and Specific Area Projects/
Services by Planning AreaServices by Planning Area
36%
23%
6%
2%
6%
20%
7%
0% 20% 40% 60% 80%
TOTALTOTALNONO29%29%
TOTAL TOTAL YESYES65%65%
Definitely yes
Probably yes
Lean yes
Lean no
Probably no
Definitely no
Undecided
5/6 combined/9. If the election were held today on this measure, do you think you would vote yes in favor or no to oppose it?
Initial Ballot Vote
41%
22%
6%
2%
4%
18%
7%
0% 20% 40% 60% 80%
TOTALTOTALNONO27%27%
TOTAL TOTAL YESYES69%69%
Vote After Projects/Services
(Combined)
Fairbank, Maslin,
Maullin & AssociatesOpinion Research &
Public Policy Analysis
Los Angeles County Transportation Survey 2008
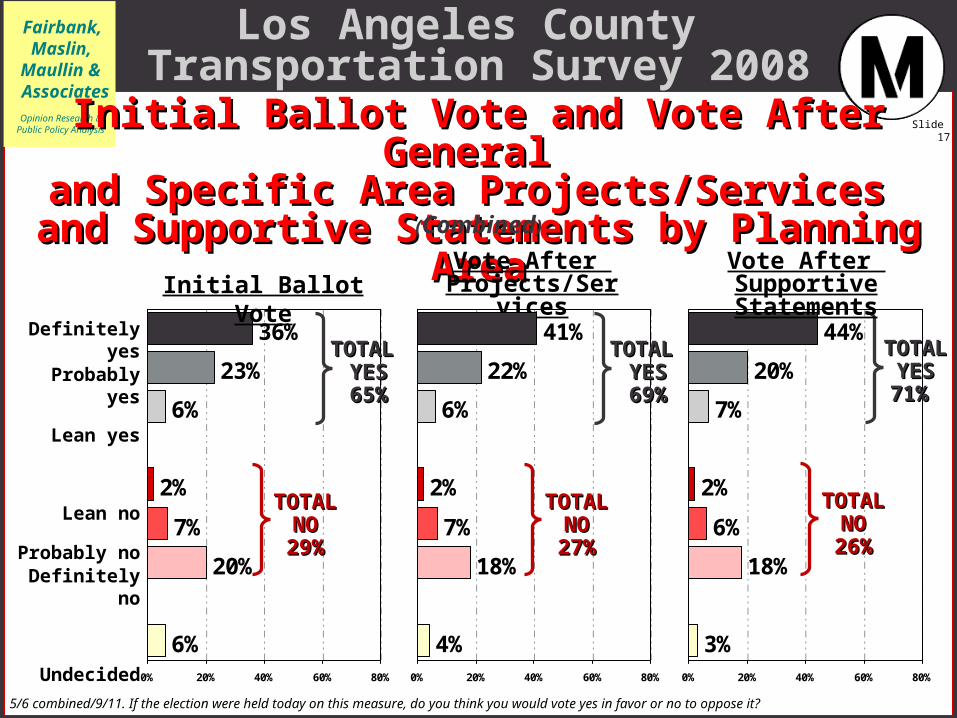
Slide 17
44%
20%
7%
2%
3%
18%
6%
0% 20% 40% 60% 80%
Initial Ballot Vote and Vote After General Initial Ballot Vote and Vote After General and Specific Area Projects/Services and Specific Area Projects/Services
and Supportive Statements by Planning Areaand Supportive Statements by Planning Area
36%
23%
6%
2%
6%
20%
7%
0% 20% 40% 60% 80%
TOTALTOTALNONO29%29%
TOTAL TOTAL YESYES65%65%
Definitely yes
Probably yes
Lean yes
Lean no
Probably no
Definitely no
Undecided
5/6 combined/9/11. If the election were held today on this measure, do you think you would vote yes in favor or no to oppose it?
Initial Ballot Vote
TOTALTOTALNONO26%26%
TOTAL TOTAL YESYES71% 71%
Vote After Projects/Services
41%
22%
6%
2%
4%
18%
7%
0% 20% 40% 60% 80%
Vote After Supportive Statements
TOTALTOTALNONO27%27%
TOTAL TOTAL YESYES69%69%
(Combined)
Fairbank, Maslin,
Maullin & AssociatesOpinion Research &
Public Policy Analysis
Los Angeles County Transportation Survey 2008
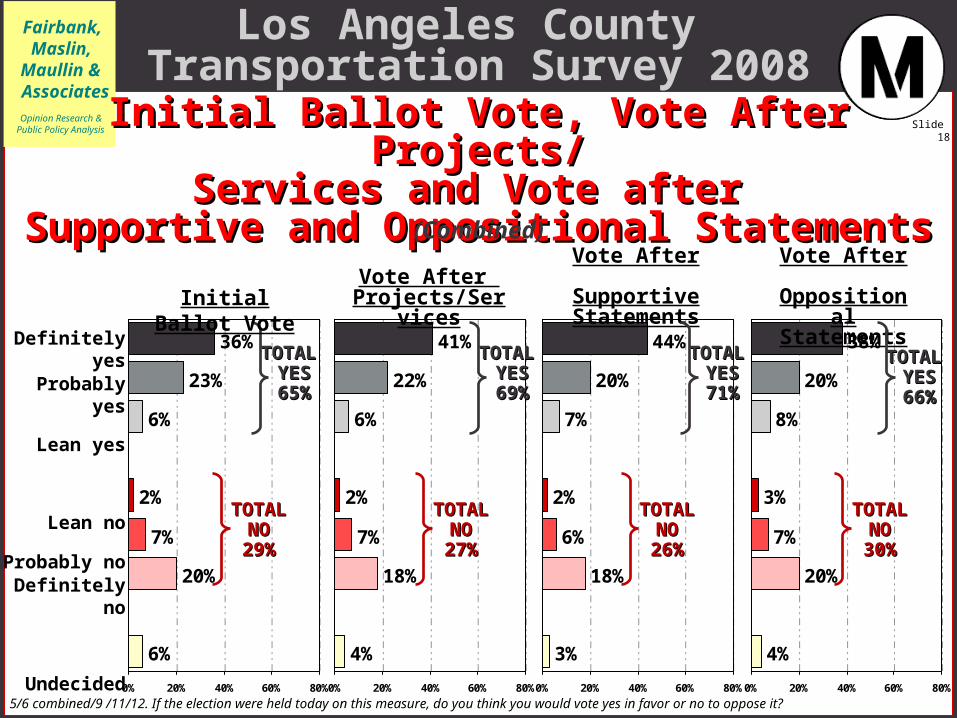
Slide 18
38%
20%
8%
3%
4%
20%
7%
0% 20% 40% 60% 80%
36%
23%
6%
2%
6%
20%
7%
0% 20% 40% 60% 80%
41%
22%
6%
2%
4%
18%
7%
0% 20% 40% 60% 80%
44%
20%
7%
2%
3%
18%
6%
0% 20% 40% 60% 80%
Initial Ballot Vote, Vote After Projects/Initial Ballot Vote, Vote After Projects/Services and Vote after Services and Vote after
Supportive and Oppositional StatementsSupportive and Oppositional Statements
TOTALTOTALNONO29%29%
TOTAL TOTAL YESYES65%65%
Definitely yes
Probably yes
Lean yes
Lean no
Probably no
Definitely no
Undecided
5/6 combined/9 /11/12. If the election were held today on this measure, do you think you would vote yes in favor or no to oppose it?
Initial Ballot VoteVote After
Projects/Services
Vote After Supportive Statements
Vote After OppositionalStatements
TOTALTOTALNONO27%27%
TOTAL TOTAL YESYES69%69%
TOTALTOTALNONO26%26%
TOTAL TOTAL YESYES71%71%
TOTALTOTALNONO30%30%
TOTAL TOTAL YESYES66%66%
(Combined)


