62
†To whom correspondence should be addressed.
E-mail: [email protected]
Copyright by The Korean Institute of Chemical Engineers.
Korean J. Chem. Eng., 31(1), 62-67 (2014)DOI: 10.1007/s11814-013-0180-y
INVITED REVIEW PAPER
pISSN: 0256-1115eISSN: 1975-7220
Fabrication and characterization of silicon nanostructures based onmetal-assisted chemical etching
Wendong Zhang*,**, Xuge Fan*,
**, Shengbo Sang*,**, Pengwei Li*,
**, Gang Li*,**,
Yongjiao Sun*,**, and Jie Hu*,
**,†
*MicroNano System Research Center, Information Engineering College, Taiyuan University of Technology,Taiyuan, Shanxi, China
**Key Lab of Advanced Transducers and Intelligent Control System, Ministry of Education,Taiyuan University of Technology, Taiyuan, Shanxi, China
(Received 27 May 2013 • accepted 16 September 2013)
Abstract−We present a facile method to fabricate one-dimensional Si nanostructures based on Ag-induced selective
etching of silicon wafers. To obtain evenly distributed Si nanowires (SiNWs), the fabrication parameters have been
optimized. As a result, a maximum of average growth rate of 0.15 µm/min could be reached. Then, the fabricated sam-
ples were characterized by water contact angle (CA) experiments. As expected, the as-etched silicon samples exhibited
a contact angle in the range of 132o-136.5o, whereas a higher contact angle (145o) could be obtained by chemical modi-
fication of the SiNWs with octadecyltrichlorosilane (OTS). Additionally, Raman spectra experiments have been carried
out on as-prepared nanostructures, showing a typical decreasing from 520.9 cm−1 to 512.4 cm−1 and an asymmetric
broadening, which might be associated with the phonon quantum confinement effect of Si nanostructures.
Keywords: Metal-assisted Chemical Etching, Si Nanostructures, Si Nanowires, Wettability, Raman Spectra
INTRODUCTION
One-dimensional nanostructures, including nanowires, nanotubes,
nanorods and nanopores, have attracted increasing attention because
of their size effects and novel physical characteristics [1,2]. Among
many others, silicon nanowires are of particular interest since they
can be widely used as a building blocks for devices in nanoelec-
tronics [3], opto-electronics [4], energy conversion [5-7], energy
storage [8,9] and biochemical sensors [10,11], due to their compat-
ibility with the existing Si technology, and their known structural,
electronic, and optical properties. To prepare Si nanostructures, vari-
ous kinds of methods have been developed, such as chemical vapor
deposition [12], molecular beam epitaxy [13], laser ablation [14],
template assisted growth [15], thermal evaporation [16], oxide-assisted
growth [17], supercritical-fluid-based and solution-based growth
[18], and lithography-related etching methods [19-21]. However,
most of these methods require complicated equipment with diffi-
cult work conditions such as high temperature, high vacuum, long
processing time or hazardous silicon precursors, which make them
time consuming and expensive.
Recently, a facile low-temperature method has been developed
based on a metal-assisted chemical etching (MaCE) that can over-
come the above-mentioned limitations. Using this method, the large
area growth of vertically aligned crystalline silicon nanowires can
be readily fabricated on Si substrates via a redox reaction between
silicon and silver ions in an aqueous solution containing silver nitrate
(AgNO3) and hydrofluoric acid (HF) [22-25]. In addition, highly
oriented SiNWs array and Si nanostructures can also be prepared
by MaCE of Si wafers in HF-based aqueous solution containing
oxidizing agents, such as Fe(NO3)3 or H2O2 [26-29]. In the metal-
assisted chemical etching of Si, only noble metals (Pt, Au, Ag, Pd)
can be practically used to assist the etching of Si [22,26,27]. It has
been well-accepted that the chemical reactions occur preferentially
near the noble metal. Because of its inherent simplicity, low cost,
easy process control, and reproducibility, MaCE is likely to be used
even more extensively as a reliable method for fabricating Si nano-
structures [28].
In this paper, we present a method to fabricate Si nanostructures
including Si nanoporous and SiNWs array in the HF/AgNO3 solu-
tion using MaCE method. By optimizing the reaction conditions
such as solution concentration, etching time and reaction tempera-
ture, bundle SiNWs array and nanoporous could be obtained. The
etching mechanism of Si nanostructures has also been investigated.
Furthermore, water contact angle experiments have been carried out
on silicon nanostructures and OTS coated SiNWs. Finally, Raman
spectra of Si nanostructures fabricated via MaCE method were also
analyzed.
EXPERIMENTAL SECTION
In our experiment, commercially available p-type Si (100) wafers
with a resistivity of 0.014-0.015Ω·cm were used as substrates for
the preparation of silicon nanostructures. AgNO3 (>99.8%), hydrof-
luoric acid (>40%), sulfuric acid (95-98%), nitric acid (65-68%),
hydrogen peroxide 30% and hydrochloric acid 37% were purchased
from Tianjin Kermel Chemical Reagent Co., Ltd. Ethanol, toluene
and acetone were purchased from Sinopharm Chemical Reagent
Co., Ltd. Octadecyltrichlorosilane (OTS) was purchased from Sigma-
Aldrich.
Prior to the formation of Si nanostructures, the polished Si wafer
Fabrication and characterization of silicon nanostructures based on metal-assisted chemical etching 63
Korean J. Chem. Eng.(Vol. 31, No. 1)
was cut into rectangular shape with dimension of 1 cm×1 cm and
sufficiently cleaned in a mixture of H2SO4 and H2O2 solution with a
volume ratio of 3 : 1 for 10 min to remove organic materials. After-
ward, the samples were washed in acetone and ethanol each for 5min,
using an ultrasonic cleaner. Then, the Si pieces were rinsed with
deionized (DI) water, followed by dipping in 5% HF solution to
remove any oxides. Finally, to fabricate Si nanostructures by elec-
troless etching, the cleaned wafers were transferred into an Ag depo-
sition solution containing 5 M HF and 0.02 M AgNO3 for 10 min at
room temperature. Then the Ag deposited samples were immersed
in a certain concentration of etching solution, while the etching tem-
perature and time were varied. The etched samples were rinsed with
concentrated HNO3 solution to remove thick Ag layer. At last, the
samples were washed with DI water for several times, and blown
dry with nitrogen for further investigations.
The morphologies of fabricated Si nanostructures were character-
ized by scanning electron microscopy (SEM, JSM-6700). A home-
made water contact angle measurement system was introduced to
measure the wettability of polished Si wafer and nanostructures.
The DI water droplet is about 2.5µL and each measurement was
repeated three times. To lower the surface energy, the fabricated Si
nanostructures were immersed in a 1 mmol/L OTS-toluene solu-
tion for 60 min, then the OTS coated nanostructures were washed
by toluene. The Raman spectroscopy measurement was carried out
using Raman Microscope (In Via), and it was performed with an
Ar+ laser operating at 514.5 nm with 6 mW power, a 3,000 l/mm
grating and a 50× objective lens, at constant temperature (293 K)
and constant humidity (40%) in a clean room.
RESULTS AND DISCUSSION
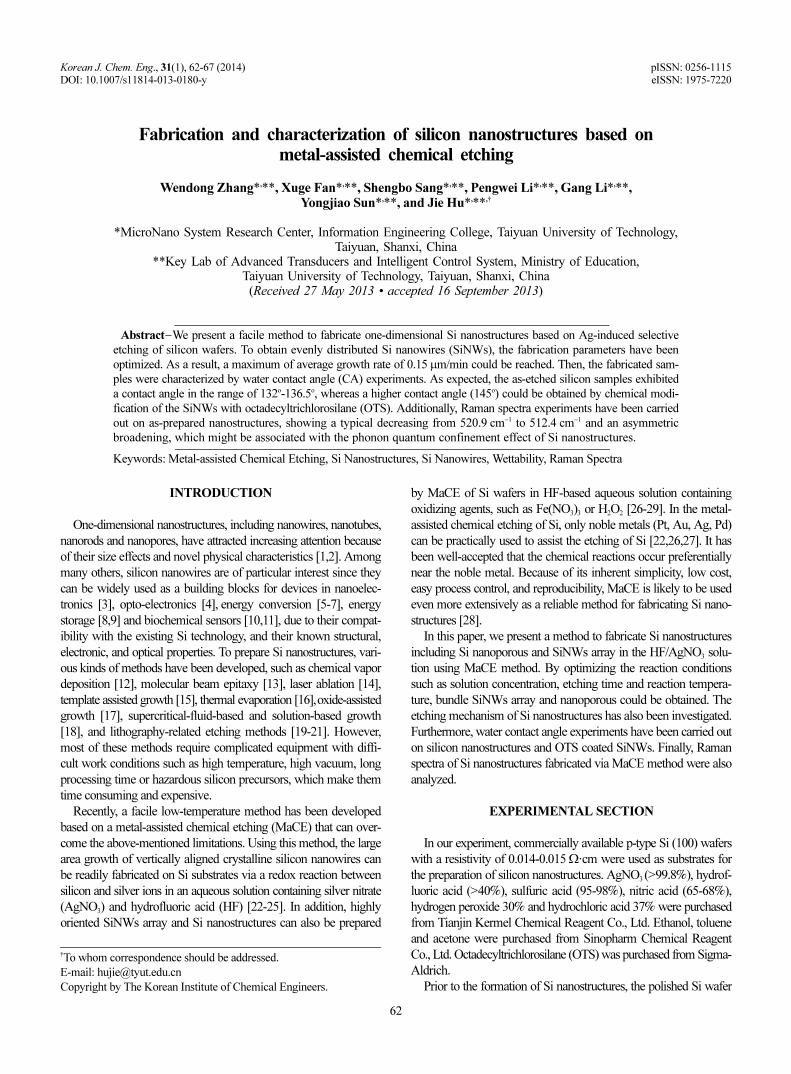
Fig. 1(a) shows a typical SEM image of the as-prepared sample,
and clearly the surfaces of etched Si samples are covered with den-
drites nanostructures, which is in accordance with relevant previ-
ous literatures [22-25], demonstrating the tree-like nanostructures
were silver. It can be explained that Ag nanoparticles gradually grew
into Ag nanoclusters and consequently agglomerated to develop
the Ag dendritic structures rather than a compact Ag film, which
results into selective oxidation and dissolution of Si in the aqueous
HF/AgNO3 solution.
Fig. 1(b)-(d) show SEM images of Si samples etched in 0.02 mol/
L AgNO3 and 10% HF solution under 50 oC for different times, and
all of the etched Si samples have been treated by the concentrated
HNO3. When the Si sample was etched for 10 min, the nanoporous
were formed on the surface (as Fig. 1(b)). With the increasing of
the etching time, the nanostructures gradually evolved into SiNWs
array (as Fig. 1(c)). When the etching time was up to 120 min, most
of SiNWs collapsed or disappeared due to over-etching (as Fig. 1(d)).
Therefore, in the following experiments, the etching time was mainly
set as 60 min.
A similar bundle SiNWs array can still be prepared with higher
density and more uniform distribution, when etching temperature
Fig. 1. SEM images of silver dendrite film wrapping in the Si samples (a) and Si nanostructure etched with 0.02 mol/L AgNO3 and 10%HF at 50 oC for 10 min (b), 60 min (c), and 120 min (d).

64 W. Zhang et al.
January, 2014
is decreased from 50 oC to 20 oC. Fig. 2(a) shows the SEM image
of Si samples etched in the solution of 0.02 mol/L AgNO3 and 10%
HF under 20 oC for 60min. The bundle SiNWs structures were close-
ly interconnected and arranged perpendicular to the Si (100) sur-
face. Fig. 2(b-c) show different magnification images of Si nano-
structures prepared in 0.03 mol/L AgNO3 and 10% HF at 50 oC for
60 min. Fig. 2(d) shows the cross-sectional image of SiNWs array
with the length of nearly 15µm. According to these results, evenly
distributed and ordered SiNWs array can be prepared under this
condition.
Time-dependent etchings of Si samples were performed to dis-
cuss the growth rate of SiNWs. Fig. 3 exhibits the relationship be-
tween the length of the fabricated SiNWs and etching time under
different conditions where the length of the SiNWs increased pro-
portionally with increasing etching time up to 60 min. The maximum
length of nanowires is nearly 15µm and the maximum of average
growth rate is about 0.15µm/min. Specifically, the SiNWs array
grew fastest in solution of 0.03 mol/L AgNO3 and 10% HF at 50 oC,
which is increased from 9.3µm to 15µm. While in the solution of
0.02 mol/L AgNO3 and 10% HF at 20 oC, the SiNWs array grew
lowest, which is only increased from 1.3µm to 5µm. It illustrated
that both concentration and temperature could influence the growth
rates, and the concentration is the primary influencing factor.
In the whole reaction process of MaCE in the HF/AgNO3 solution,
Ag nanoparticles are playing an important role of catalyst in elec-Fig. 3. Si nanowires length versus etching time, obtained with sam-
ples prepared under different reaction conditions.
Fig. 2. (a) Top-view SEM image of silicon nanowires prepared with 0.02 mol/L AgNO3 and 10% HF at 20 oC for 60 min. (b) Similar resultsobtained with 0.03 mol/L AgNO3 and 10% HF at 50 oC for 60 min. (c) high magnification image and (d) tilted-view image of (b).

Fabrication and characterization of silicon nanostructures based on metal-assisted chemical etching 65
Korean J. Chem. Eng.(Vol. 31, No. 1)
trochemical etching of Si in HF solution where deep cylindrical nano
pores were formed in [100] silicon [30-33]. The mechanism of for-
mation of the vertically aligned SiNWs array can be explained as
being a self-assembled Ag-induced selective etching process based
on localized microscopic electrochemical cell model, which is pre-
sented in Fig. 4. The process depends on the continuous galvanic
displacement of Si by Ag ions being reduced to Ag, which forms
many local nano-electrochemical cells on the Si surface. The origi-
nal Ag nanoparticles serve as active cathode, and the Si area sur-
rounding the Ag nanoparticles serve as active anode. Fig. 4(a) shows
the process of Ag nucleation deposition. Ag ions adjacent to the Si
wafer attract intensively electrons from the valence band of Si with
a product of Ag atoms. Then Ag atoms simultaneously congregate
into Ag nuclei and deposit uniformly on the Si substrate to form
nanoclusters. After that, Si wafer beneath the Ag nanoparticles was
oxidized to SiO2 and the oxidized surface was etched away by HF
(as Fig. 4(b)). The reaction product SiF6
2− was dissolved into the
solution. According to the above reaction process, those locations
where Ag nuclei existed continuously presented oxidation and reduc-
tion reaction. With the increase of reaction time, the pits were pro-
duced at the same positions, which made Ag nanoclusters sink into
such pits. The size of pits on Si surface increases initially as dimen-
sions of Ag nanoclusters increase and gradually leads to the produc-
tion of porous structures (as Fig. 4(c)). Once the Ag nanoclusters
get trapped into the Si pores, they sink deeper and deeper, which
causes the positions around Ag nanoparticles to form SiNWs or
nanoporous (as Fig. 4(d)).
To investigate wettability, water contact angle measurements were
made to test polished Si substrate and as-prepared nanostructures.
Fig. 5(a) shows the optical image of contact angle of a DI water
droplet on the surface of polished Si substrate. It can be seen that the
CA is 72o and indicated that the polished Si wafer is hydrophilic.
Fig. 5(b) presents the CA for bundle SiNWs array sample, which
was prepared with 0.02 mol/L AgNO3 and 10% HF etching solution
at 50 oC for 60 min, and it is about 133o. For the other fabricated
SiNWs samples, their CAs is in the range of 132o-136.5o. In addition,
we performed chemical surface modification of SiNWs array by
the self-assembled OTS monolayer. The OTS coated sample has
the highest contact angle, which is about 145o, as shown in Fig. 5(c).
Compared with uncoated sample, the CA of the OTS coated SiNWs
further increased by 12o, which could be explained that the surface
energy of the SiNWs was reduced. It demonstrated that the OTS
coated SiNWs almost has a superhydrophobic surface. The observed
hydrophobic characteristics for bundle SiNWs array could be ex-
plained by Cassie’s model [34]. When a water droplet is placed on
the surface of Si nanostructures, it is possible that the bundled SiNW
structures might have the functionality of delaying the diffusion of
air below the water droplet, which produces a phenomenon that
abundant air could be trapped in the interval of the nanowire struc-
tures. Based on Cassie’s model, a greater amount of air staying in
the Si nanostructures would enhance the hydrophobicity of the Si
sample surfaces [35,36].
Fig. 5. Photographs showing different CAs on the surface of different samples. (a) Polished Si substrate. (b) Bundle SiNWs. (c) BundleSiNWs after surface treatment by self-assembled OTS monolayer.
Fig. 4. Scheme of a growth mechanism for the SiNWs etched in the AgNO3/HF solution. (a) Ag nucleation deposition. (b) Ag nanoparticleand induced local oxidation. (c) Pits formation. (d) Final Si nanostructures.

66 W. Zhang et al.
January, 2014
Finally, micro-Raman with excitation wavelengths of 514.5 nm
was used to characterize the as-prepared nanostructures to address
their lattice vibrational properties. Fig. 6 shows a comparison of
Raman spectra of Si samples etched under four conditions and pol-
ished Si wafer. A Raman peak at 520.9 cm−1 was measured for the
polished Si wafer, which can be explained by the scattering of the
first-order optical phonon for crystalline Si [37]. The Raman spec-
tra of Si nanostructures generally show a peak at 512.4 cm−1 and
514 cm−1. It can be concluded from the Raman spectra that the first-
order Raman peaks of etched Si nanostructures have an obvious
red shift (the maximum shift value reaches nearly 9 cm−1) and exhib-
its an asymmetric broadening toward the low-energy side. This asym-
metric broadening and obvious downshift might be associated with
the phonon quantum confinement effect of SiNWs [38]. Besides,
they are mainly due to laser-induced inhomogeneous heating since
the bundle SiNWs is freestanding on the substrate and a poor thermal
anchorage to the substrate is anticipated [39,40].
CONCLUSIONS
We have demonstrated a relatively simple, cheap, and rapid method
for the fabrication of Si nanostructures using p-type (100) Si sub-
strates and a MaCE based technique with aqueous HF/AgNO3 etch-
ing solution. The vertically aligned silicon nanowires have been
prepared by optimization the etching parameters, including etching
time, etching solution concentration and temperature. The results
show a maximum nanowire length of 15µm obtained with an aver-
age etch rate of about 0.15µm/min. The formation of SiNWs could
be attributed to the selective etching of Si substrate directly deposi-
tion with Ag nanoclusters via self-assembled nano-electrochemical
process. SiNWs array takes place where there are no Ag nanoparti-
cles depositions. The water contact angle experiments showed that
the surface of etched Si nanostructures was hydrophobic and, as
expected, their hydrophobicity could be significantly enhanced by
surface coated of OTS. Finally, Raman spectra of the fabricated silicon
nanostructures showed a clear redshift and an asymmetric broaden-
ing compared to that of the flat silicon wafer, which might be related
to the phonon quantum confinement effect of Si nanostructures and
laser-induced inhomogeneous heating. We believe that the method
presented in this work is simple and low cost, which might not only
be useful for optoelectronics and nano-electronics but also have poten-
tial applications in the fields of solar cells and biology.
ACKOWLEDGEMENTS
This research was supported by a grant from the National Natu-
ral Science Foundation of China (no. 51205274, no. 51205273), the
Shanxi Province Science Foundation for Youths (no. 2013021017-
2), the Shanxi Scholarship Council of China (no. 2013-035), China
Postdoctoral Science Foundation (no. 2013M530894), and Excel-
lent Innovation Programs for Postgraduate in Shanxi Province (no.
20110348).
REFERENCES
1. C.N.R. Rao, F.L. Deepak, G. Gundiah and A. Govindraj, Prog, Solid
State Chem., 31(1-2), 5 (2003).
2. Y. Xia, P. Yang, Y. Sun, Y. Wu, B. Mayers, B. Gates, Y. Yin, F. Kim
and H. Yan, Adv. Mater., 15, 353 (2003).
3. J. Goldberger, A. I. Hochbaum, R. Fan and P. Yang, Nano Lett., 6(5),
973 (2006).
4. B. Tian, X. Zheng, T. J. Kempa, Y. Fang, N. Yu, G. Yu, J. Huang and
C. M. Lieber, Nature, 449, 885 (2007).
5. K. Q. Peng, X. Wang, X. L. Wu and S. T. Lee, Nano Lett., 9(11),
3704 (2009).
6. Y. Qu, L. Liao, Y. Li, H. Zhang, Y. Huang and X. Duan, Nano Lett.,
9(12), 4539 (2009).
7. V. Sivakov, G. Andra, A. Gawlik, A. Berger, J. Plentz, F. Falk and
S. H. Christiansen, Nano Lett., 9(4), 1549 (2009).
8. Y. Yao, M. T. McDowell, I. Ryu, H. Wu, N. Liu, L. Hu, W. D. Nix
and Y. Cui, Nano Lett., 11(7), 2949 (2011).
9. M. Ge, J. Rong, X. Fang and C. Zhou, Nano Lett., 12(5), 2318 (2012).
10. K. Chen, B. R. Li and Y. Chen, Nantod., 6(2), 131 (2011).
11. M. M. A. Hakim, M. Lombardini, K. Sun, F. Giustiniano, P. L.
Roach, D. E. Davies, P. H. Howarth, M. R. R. Planque, H. Morgan
and P. Ashburn, Nano Lett., 12(4), 1868 (2012).
12. E. Ria, X. M. Liu, C. A. Ross, A. O. Adeyeye and W. K. Choi, J.
Appl. Phys., 112(2), 024312 (2012).
13. J. Bauer, F. Fleischer, O. Breitenstein, L. Schubert, P. Werner, U.
Gsele and M. Zacharias, Appl. Phys. Lett., 90, 012105 (2007).
14. Y. H. Yang, S. J. Wu, S. H. Chiu, P. Lin and Y. T. Chen, J. Phys.
Chem. B, 108, 846 (2004).
15. K. K. Lew and J. M. Redwing, J. Cryst. Growth, 254(1-2), 14 (2003).
16. H. Pan, S. Lim, C. Poh, H. Sun, X. Wu, Y. Feng and J. Lin, Nano-
technology, 16, 417 (2005).
17. R. Q. Zhang, Y. Lifshitz and S. T. Lee, Adv. Mater., 15(7-8), 635
(2003).
18. A. T. Heitsch, D. D. Fanfair, H. Y. Tuan and B. A. Korgel, J. Am.
Chem. Soc., 130(16), 5436 (2008).
19. K. J. Morton, G. Nieberg, S. F. Bai and S. Y. Chou, Nanotechnol-
ogy, 19, 345301 (2008).
20. H. D. Tong, S. Chen, W. G. van der Wiel, E. T. Carlen and A. van
den Berg, Nano Lett., 9(3), 1015 (2009).
21. S. T. Connor, M. X. Tang and Y. Cui, Appl. Phys. Lett., 93(13),
Fig. 6. The comparative Raman spectra of polished Si wafer andnanostructures after being etched in the solution of AgNO3
and HF under different reaction conditions.

Fabrication and characterization of silicon nanostructures based on metal-assisted chemical etching 67
Korean J. Chem. Eng.(Vol. 31, No. 1)
133109 (2008).
22. K. Q. Peng, Y. J. Yan, S. P. Gao and J. Zhu, Adv. Mater., 14(16), 1164
(2002).
23. M. L. Zhang, K. Q. Peng, X. Fan, J. S. Jie, R. Q. Zhang, S. T. Lee
and N. B. Wong, J. Phys. Chem. C, 112(12), 4444 (2008).
24. H. Chen, H. Wang, X. H. Zhang, C. S. Lee and S. T. Lee, Nano Lett.,
10(3), 864 (2010).
25. A. G. Nassiopoulou, V. Gianneta and C. Katsogridakis, Nanoscale
Res. Lett., 6, 597 (2011).
26. K. Q. Peng, Y. Wu, H. Fang, X. Y. Zhong, Y. Xu and J. Zhu, Angew.
Chem. Int. Ed., 44(18), 2737 (2005).
27. K. Q. Peng, J. J. Hu, Y. J. Yan, Y. Wu, H. Fang, Y. Xu, S. T. Lee and
J. Zhu, Adv. Funct. Mater., 16(3), 387 (2006).
28. Z. P. Huang, H. Fang and J. Zhu, Adv. Mater., 19(5), 744 (2007).
29. K. Q. Peng, X. Wang, X. L. Wu and S. T. Lee, Appl. Phys. Lett.,
95(14), 143119 (2009).
30. C. F. Pan, Z. X. Luo, C. Xu, J. Luo, R. R. Liang, G. Zhu, W. Z. Wu,
W. X. Guo, X. X. Yan, J. Xu, Z. L. Wang and J. Zhu, ACS Nano.,
5(8), 6629 (2011).
31. K. Q. Peng, Y. J. Yan, S. P. Gao and J. Zhu, Adv. Funct. Mater., 13(2),
127 (2003).
32. K. Q. Peng and J. Zhu, J. Electroanal. Chem., 558, 35 (2003).
33. K. Q. Peng, Y. Wu, H. Fang, X. Y. Zhong, Y. Xu and J. Zhu, Angew.
Chem., 117(18), 2797 (2005).
34. A. B. D. Cassie and S. Baxter, Trans. Faraday Soc., 40, 546 (1944).
35. X. J. Huang, J. H. Lee, J. W. Lee, J. B. Yoon and Y. K. Choi, Small,
4(2), 211 (2008).
36. F. Shi, Y. Y. Song, J. Niu, X. H. Xia, Z. Q. Wang and X. Zhang,
Chem. Mater., 18(5), 1365 (2006).
37. B. B. Li, D. P. Yu and S. L. Zhang, Phys. Rev. B, 59(3), 1645 (1999).
38. C. Li, G. Fang, S. Sheng, Z. Chen, J. Wang, S. Ma and X. Zhao, Phys-
ica E, 30(1-2), 169 (2005).
39. K. W. Adu, H. R. Gutierrez, U. J. Kim and P. C. Eklund, Phys. Rev.
B, 73(15), 15533 (2006).
40. R. Gupta, Q. Xiong, C. K. Adu, U. J. Kim and P. C. Eklund, Nano
Lett., 3(5), 627 (2003).


