
FIGHTING CANCER WITH A FORK
DOES SUGAR FEED THE TUMOR?
Colleen Gill, MS, RD, CSONutrition Foundations
303-810-8612 [email protected]
9/15/12

RESOLVING THE CONFLICTGoal: Perspective on Carbs and Cancer
◦ The plate model as “the big picture”◦ Priorities at different stages
Research: Carbs and Cancer◦ Carbohydrate Metabolism◦ Sugar or Insulin? Insulin Resistance◦ Glycemic Index and Cancer
Carb Choices/Options◦ Glycemic Index Details
Influence of Lifestyle and Medications

“DON’T GO NUTS”NUTRITION WITHOUT STRESSSTRESS = Novel
UnexpectedThreat to self or egoSense of lack of control
Focus on the “Big Picture”Keep diet empowering; Not a new stress
American Institute for Cancer Research; www.aicr.org
Free monthly Classes, University
Two goals at a time: 1 diet, 1 exercise

2/3 of your plate should be plant based50% vegetables, legumes; daily cruciferousFiber sources slow stomach emptying
Healthy fats and carbohydratesLess refined, processed foodsMore fish, olive oil and healthy fats, impacts
receptors
Exercise and ideal body weight Impacts blood sugars and insulin resistanceMake exercise a scheduled priority
Sleep well! Impacts insulin resistance, weight
FOOD "TALKS" TO CELLSWHAT WE ADD = WHAT WE LIMIT

PRIORITIES CHANGE IN FAILURE TO THRIVE
Set up a schedule! Eat often Post a list: “Things I Tolerate”
Normalize/(lower) expectationsStart “healthy”, but calorie dense
With small volumes, nothing is problematic
Educational materials can be targeted to different groups & purposes
Are insulin levels likely to be high with small meals and snacks?
We are all eatingNo +/- to exposure; “Shades of gray”
We are all unique! Individual genetics impacts how we handle what we eat. Subgroups may benefit Weight, insulin resistance, activity level
Human studies are expensiveAnd complicated by human subjects Placebo effect; Pleasers; Self interest Motivation differences: survivors versus prevention
NUTRITION STUDIES CAN BE “SOFT” (AND CONFUSING)
THE SUGAR CONTROVERSY
Controversy and Confusion = Stress◦ Books/internet warnings against sugar◦ Staff promoting use to limit weight loss◦ Family members anxious about both!
Anxiety builds with PET scans◦ IV infusion of radioactively labeled sugars◦ Increased receptors on rapidly metabolizing cancer
cells can make them “light up”
Yes, BUT . . . Sugar feeds EVERY cell ◦ Blood sugar cannot be eliminated and live◦ Excursions in blood sugar/insulin can be limited

Stomach Paces emptying
Intestines1 - 4 hours
Jejunum•Lactose•Maltose
Glucose absorption raises blood sugar
Colon 24 - 48 hours•Water (1 – 2 L)
Mouth•Amylase/starch
www.ibsresearchupdate.org
Taken in Broken downAbsorbedUsed for fuel
L Schiller Nutr in Clin Practice 2006;21:34
Pancreas Releases Insulin
Insulin Connects?
Messages Sent•Transport sugar•Food is abundant•OK to grow

FRUCTOSE, SUGAR AND CARBS
Fructose in evolutionFall fruit created a degree of IR,
Triggers fat storage for winter survivalHFCS? Agave?
Sugar = Fructose + Glucose Empty calories, leading to weight gainConsumption is up 15# since 1986; to 90#
Carbs: Rice versus FructoseDoes the lack of fructose in rice minimize risk
despite the higher carb Asian diet? Howarth et al, 2008; Am J Clin Nutr 88(4): 1074-
1082

INSULIN IS THE REAL ISSUEYes, cancer cells like sugar as “fuel”
◦ Basis of PET scans to detect tumor activity◦ But tumors can make their own glucose (fat, protein)
Stimulates growth directly and through IGF1 Increases inflammatory hormones Suppresses immune function Limits normal cell death/apoptosis
Real Concern
Large volumes, high GI, fructose? Higher blood sugars
More Insulin (if IR)Primitive Growth Signal

DIABETES INCREASED CANCER RISK
INFLAMMATION, HYPERINSULINEMIA
Doubled risk: Liver, Pancreas, Endometrial Increased exposure to insulin (liver, pancreatic) Impact on NAFLD, cirrhosis may contribute
Consensus statement, Cancer J Clin 2010; 60:207-21
Colon, bladder, post menopausal breast 1.2 – 1.5x Larsson et al, 2006;2007
Diabetes + ER- BC doubled risk & mortalityNJ Cancer Res Clin Oncol, 12/2010
Increased aggressive nature and recurrence rates of many other cancers AICR Science Now, 2008
Consensus statement, Cancer J Clin 2010; 60:207-21

DIABETES INCREASED MORTALITY* IN CANCER
Meta-analysis: Increased mortality of 1.41 compared to those with normal blood sugar levels
Endometrial 1.76, Breast 1.61, Colorectal 1.32Non-significant increases in Prostate (1.51),
gastric 1.36, liver 1.3, lung 1.15, pancreatic 1.09JAMA 2008 300(23): 2754 – 64
*Cause? DM, hyperglycemia, IR, Inflammation, Diabetes Drugs, Obesity…

OBESITY TRENDS* AMONG U.S. ADULTS*BMI 30, ABOUT 30# OVERWEIGHT AT 5’4”
1990 2000
2010
* BRFSS: Behavioral Risk Factor Surveillance System, www.cdc.gov/brfss/
10%–14%
15%–19%
20%–24%
25%–29%
≥30%
no data
<10%
© 2010 Sports Cardiovascular and Wellness Nutrition (SCAN)

INSULIN LEVELS AND BREAST CANCER DIAGNOSIS AND RECURRENCEWHI:Highest versus lowest quartile fasting insulin
◦ HR of 1.46 (2.4 in women without HRT)J Natl Cancer Inst 2009; 101: 48 – 60
535 women with Breast Cancer Fasting insulin levels Higher stage/grade Highest quartile fasting insulin
◦ Double recurrence◦ Triple mortality J. Clin Oncology 20 (1): 42;
2002
Metabolic syndrome in Breast Ca recurrence three fold Int J Cancer, 2006

IMPACT OF HYPERINSULINEMIAIN BREAST CANCER
6 – 10 x number of insulin receptors “growth advantage”
Papa, et al. J Clin Invest 86 (5): 1503; 1990
Insulin increased Estrogen/SignalingIncreases receptor expressionWith estradiol, increases cell growth Stimulates aromatase activity
Levels of sex hormone binding globulin Lann D, LeRoith D; J Mammary Gland Biol Neoplasia
2008
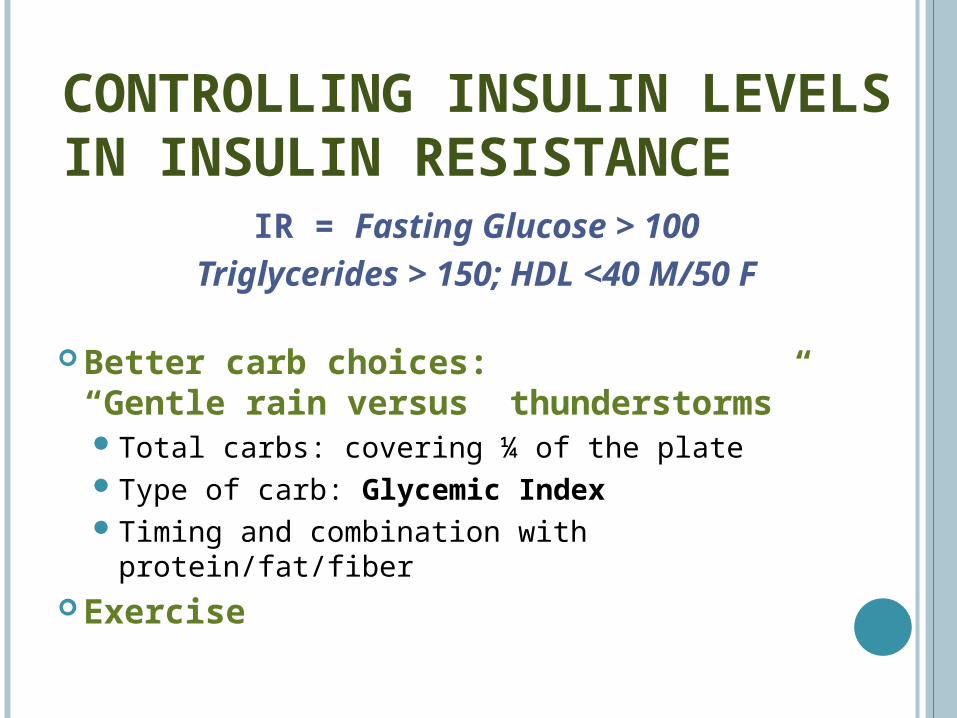
CONTROLLING INSULIN LEVELS IN INSULIN RESISTANCE
IR = Fasting Glucose > 100Triglycerides > 150; HDL <40 M/50 F
Better carb choices: “Gentle rain versus thunderstorms”Total carbs: covering ¼ of the plateType of carb: Glycemic IndexTiming and combination with protein/fat/fiber
Exercise

GLYCEMIC INDEX: NEW TERM TO COMPARING CARBS IMPACT ON BS
Volunteers eat 50 grams of carbohydratefrom the tested food◦ Amounts of food varied!◦ Blood sugar levels were plotted @ 15 minutes
Exposure to sugar (AUC) is determined◦ Compared to the increase obtained from glucose
or white bread in the same volunteer
Food is ranked on a scale◦ Compared to glucose or white bread as 100


GI ISN’T PERFECTNature is variable
◦ GI can vary with growing conditions
Glucose response varies with time of day
Testing is limited◦ Combination foods often difficult to predict
Glycemic response = only 23% of the variability in blood insulin levels◦ Impaired glucose tolerance is major factor
Glycemic load takes serving size into account
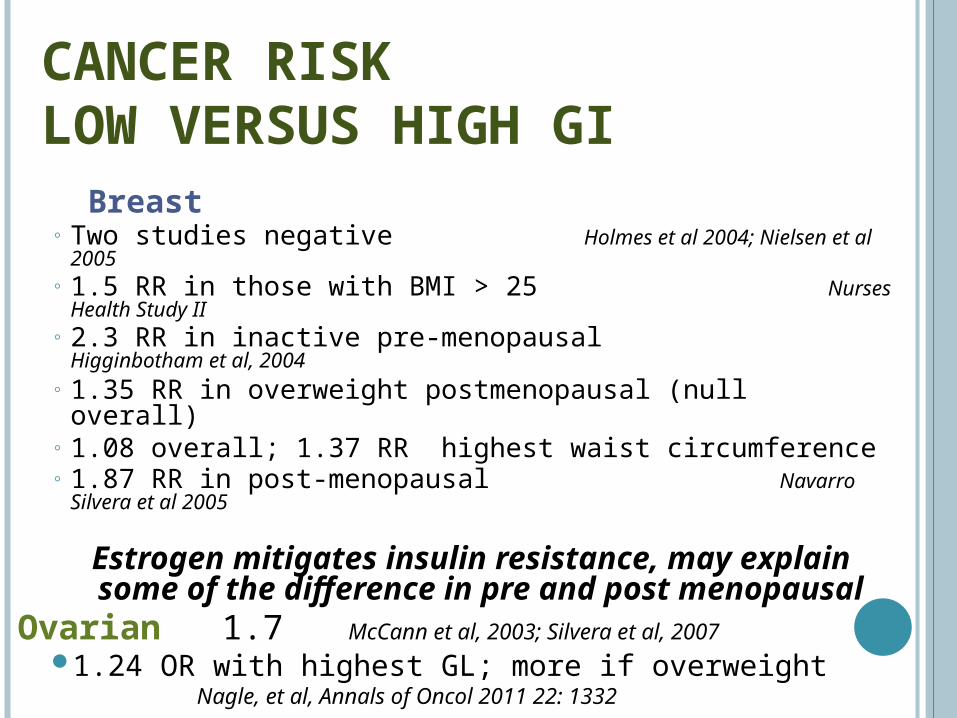
CANCER RISK LOW VERSUS HIGH GI
Breast◦ Two studies negative Holmes et al 2004; Nielsen et al
2005◦ 1.5 RR in those with BMI > 25 Nurses Health Study II◦ 2.3 RR in inactive pre-menopausal Higginbotham et al, 2004◦ 1.35 RR in overweight postmenopausal (null overall)◦ 1.08 overall; 1.37 RR highest waist circumference ◦ 1.87 RR in post-menopausal Navarro Silvera et al 2005
Estrogen mitigates insulin resistance, may explain some of the difference in pre and
post menopausalOvarian 1.7 McCann et al, 2003; Silvera et al, 2007
1.24 OR with highest GL; more if overweight Nagle, et al, Annals of Oncol 2011 22: 1332

BMI, ACTIVITY AFFECTSRISK OF A HIGH GL DIET
Pancreatic Cancer Risk by GL Quartiles 1 1.2 with BMI <25
1 1.8 with BMI >25 (overweight) 1 1.1 with high activity level
1 1.8 if sedentary BMI < 25, active: 1 1
BMI > 25, inactive: 1 2.7
Carbohydrate in diet will not affect risk IF you are lean and active

WHAT AFFECTS GLYCEMIC INDEX? Type of starch, speed of breakdown
◦ Easily attacked by enzymes = GI Particle size/processing
◦ More surface area for enzymes = GI Heat and moisture = GI Factors that slow stomach emptying
◦ Meals/foods with fat, fiber, protein = GI◦ Acid content = GI

A CARB IS A CARB, BUT. . .
35 carbs, 1 fiber 38 carbs, 5 fiber

CARB QUALITY: + FIBER/-SUGAR
Check total amount of carbohydrate
+ Fiber Content
•Reflects processing
•Slows emptying
- Sugar
•Natural/Added


HIGH GLYCEMIC INDEX FOODS> 100 ON WHITE BREAD SCALERefined breakfast cereals (100 – 132)
◦ All Bran (60), Oatmeal (64), Special K (75), Shredded Wheat (94) are lower
Most breads (100 – 130) ◦ Minimally processed, whole grain: 9 Grain, oat
bran, rye/pumpernickel are lower at 60 – 66
Potatoes (115 - 120)◦ Waxy/new potatoes are intermediate at 87;
sweet potatoes lower at 75
Polished, sticky rice (120 - 156)◦ Basmati/Converted/Brown rice 72 - 81
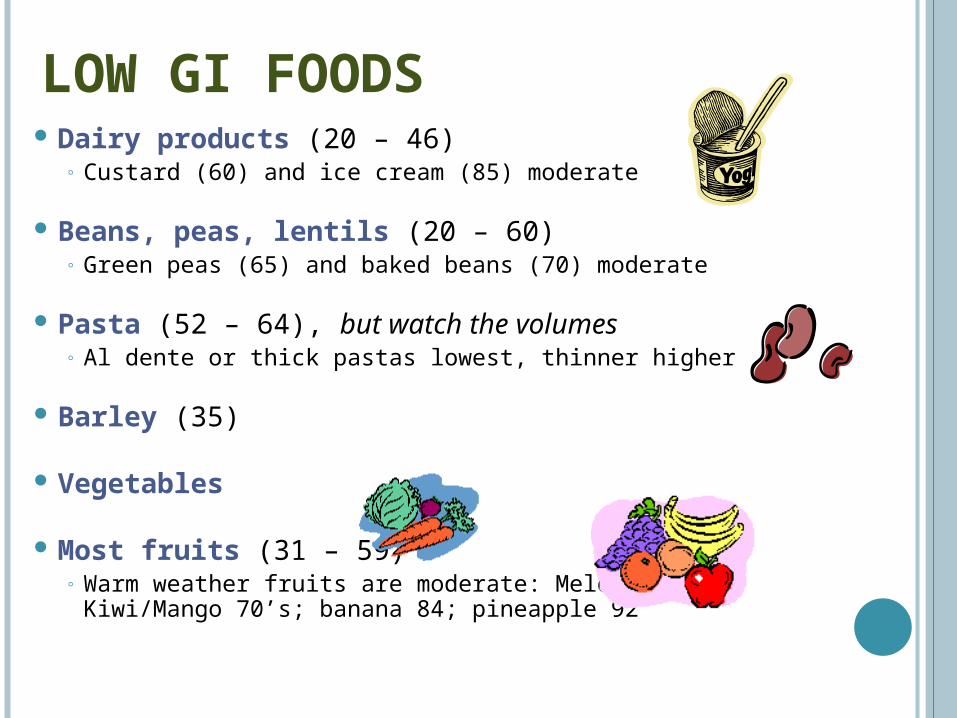
LOW GI FOODS Dairy products (20 – 46)
◦ Custard (60) and ice cream (85) moderate
Beans, peas, lentils (20 – 60)◦ Green peas (65) and baked beans (70) moderate
Pasta (52 – 64), but watch the volumes◦ Al dente or thick pastas lowest, thinner higher
Barley (35)
Vegetables
Most fruits (31 – 59)◦ Warm weather fruits are moderate: Melon 91-100;
Kiwi/Mango 70’s; banana 84; pineapple 92

BEVERAGES AND GLYCEMIC INDEX Gatorade @111
Sodas @ 90 – 97
Juices @ 43 – 68
Soy Smoothies @ 43 – 49
Oral supplements with higher protein, fat and fiber content are likely best
Remember that foods/fluids high in sugar are often “empty” calories
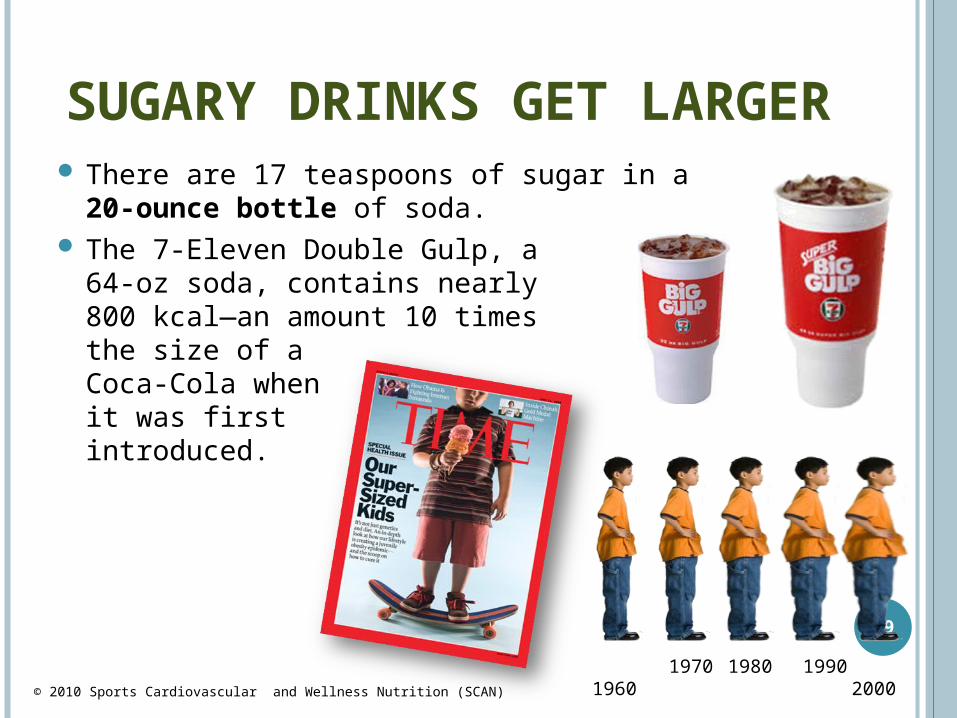
SUGARY DRINKS GET LARGER
There are 17 teaspoons of sugar in a 20-ounce bottle of soda.
The 7-Eleven Double Gulp, a 64-oz soda, contains nearly 800 kcal—an amount 10 timesthe size of aCoca-Cola when it was first introduced.
29
1960 1970 2000
1980 1990© 2010 Sports Cardiovascular and Wellness Nutrition (SCAN)

CARBS AND INSULIN CONTROLTOTAL AMOUNT, TYPE, TIMING
When there is insulin resistanceFasting Glucose >100; TG > 150; HDL <40/50
Watch the total carbs (1/4 plate!)Mix higher GI foods with lower GI
◦ Goal <1/2 high GI foods/meal; www.mendosa.com“Eat it raw, eat it whole” for a lower GIAvoid “naked carbs” on an empty stomach
◦ Eat sweets less often, with meals that contain protein, fiber and fat to slow stomach emptying

ANY EXERCISE HELPS
Makes good estrogens,
limits growth signal
Maintains muscle mass, increases calories burned
Prevents osteoporosis
Weight gain estrogen release Fatigue, depression and stress Blood sugars which insulin levels
and immune function
Any Exercise
Aerobic Exercise
Strength Training
Weight Bearing Exercise

GOAL: 30 – 60”, MOST DAYSAEROBIC + STRENGTH TRAINING REDUCED IR
Controls weight↓ blood pressure,
stress, Insulin resistance , fatigue
Increases HDL, ↓ LDL
© 2010 Sports Cardiovascular and Wellness Nutrition (SCAN)
Pedometers offer greatfeedback!(When used)
www.digiwalker.com
Break it into 10 minute bouts
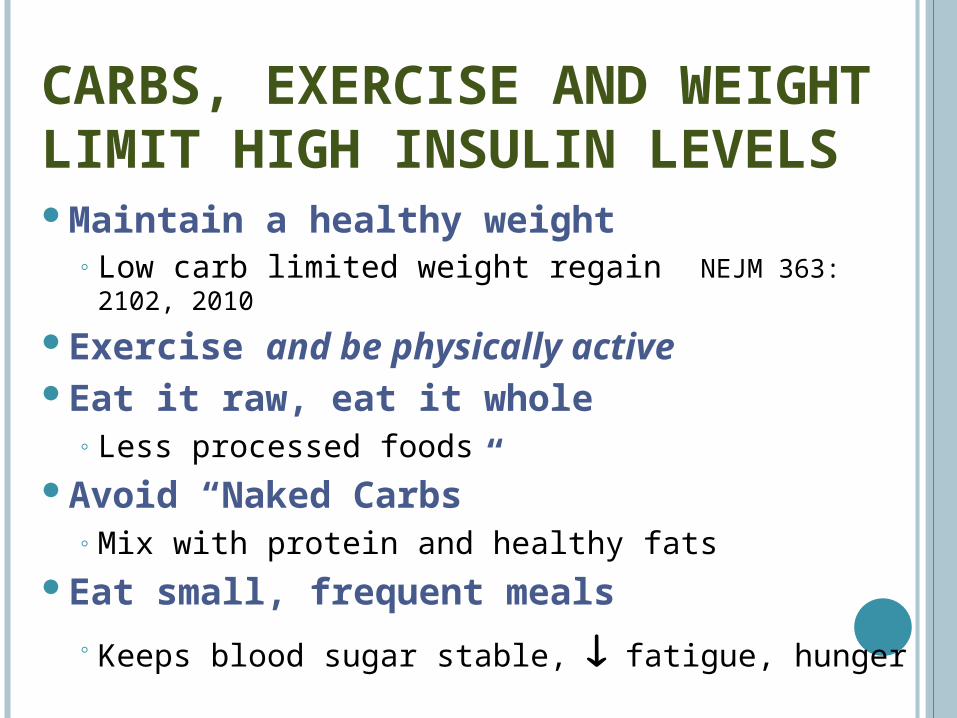
CARBS, EXERCISE AND WEIGHTLIMIT HIGH INSULIN LEVELSMaintain a healthy weight
◦ Low carb limited weight regain NEJM 363: 2102, 2010
Exercise and be physically activeEat it raw, eat it whole
◦ Less processed foodsAvoid “Naked Carbs”
◦ Mix with protein and healthy fats Eat small, frequent meals
◦ Keeps blood sugar stable, fatigue, hunger

Insulin Resistance- Components -
Genetics Genetics+
Obesity
Genetics+
Obesity+
GlucoseToxicity
Insu
lin
Res
ista
nce

Insulin Resistance- Reversal -
Genetics Genetics+
Obesity
Genetics+
Obesity+
GlucoseToxicity
GlucoseControl
+Weight
Loss
GlucoseControl
Insu
lin
Res
ista
nce

LIFESTYLE INFLUENCES IR
Genetics loads the gun (~1/2) Lifestyle pulls the trigger (~1/2)
Physical activity, weight
Sleep deprivation insulin resistance1 – 2 hours less sleep than 1970
O Buxton et al. Diabetes 2010; 59:2126-33
◦ Increased diabetes◦ Increased fight/flight response; IR◦ Increases weight
Sweet preference; more late snacking Less motivation to exercise◦ 1 night 21% lower insulin sensitivity in Type 1 DM
Donga et al. Diabetes Care 2010; 33:1573 Donga et al. J Clin Endocrinol Metab 2010, 95(6):2963

SUPPLEMENTS THAT MAY LIMIT INSULIN RESISTANCEFish Oil, anti-inflammatory
◦ 3,000 mg Omega 3 (EPA + DHA) a day◦ Lowers triglycerides
Magnesium 250+ mg Diabetes 1/2011
◦ Lowered fasting BS, insulin resistanceCinnamon, source of manganese
◦ 1- 3 g/day lowered BS, LDL, TC, TGVinegar, slows stomach emptyingVitamin D
◦ Higher levels = 40% lower risk of DM◦ Liu et al, Am J Clin Nutr 2010; 91: 1627

METFORMIN SEEMS PROTECTIVE+Decreased risk of breast cancer; OR 0.44; p = 0.01 + survival pancreatic cancer Hsu, JOP 2011;12(4) 330
Lower cancer mortality vs sulfonylureas P =0.012 Bowker et al, Diabetes Care 2006; 29: 254 - 258
Mechanisms: Science 2012: 335: 29 Lower liver production of glucose; sensitivity to insulin Anti-inflammatory; anti-angiogenic; apoptosis enzyme AMPK lowers insulin/IFG levels Blocks mTOR; kills cancer stem cells-Insulin, decreases normal cell death-Sulfonoreas, increases insulin secretion
NCIC MA32 trial, Metformin v Placebo x 5 years
Consensus statement, Cancer J Clin 2010; 60:207-21Kourelis and Siegel, Med Oncol 2011

DOES SUGAR FEED THE TUMOR?. . ONLY WITH INSULIN TOOYes, sugar feeds EVERY cell in the body
◦ Blood glucose cannot be eliminated (and live)Address anxiety with prioritization
◦ Stage/diagnosis/therapy side effects/risk of IR◦ Allow more simple sugar where/when:
There are no signs of IR and volumes are limited
Excursions in blood sugar/insulin can be limitedSpread carbs through the day with small,
frequent meals/snacks; a “gentle rain”◦ Use lower GI carbs, combined with protein/fat

Our goal is not to eliminate entire food groups
Rather to make better choices in all of them
The Plate Model (+Details/GI)

THE PLATE MODEL =OPTIMAL BLOOD SUGARS
The Right Amounts¼ carbohydrate sources
bread, pasta, potatoes, rice, cereals¼ protein (and fat) sources~ ½ fruit (fist size), vegetables, beans
The Right Mix No Naked CarbsEat sweets as part of a mixed mealWith protein, fat, fiber to slow stomach emptying; rescue
With The Right TypeLimit processed/”white” foods, high glycemic index
options
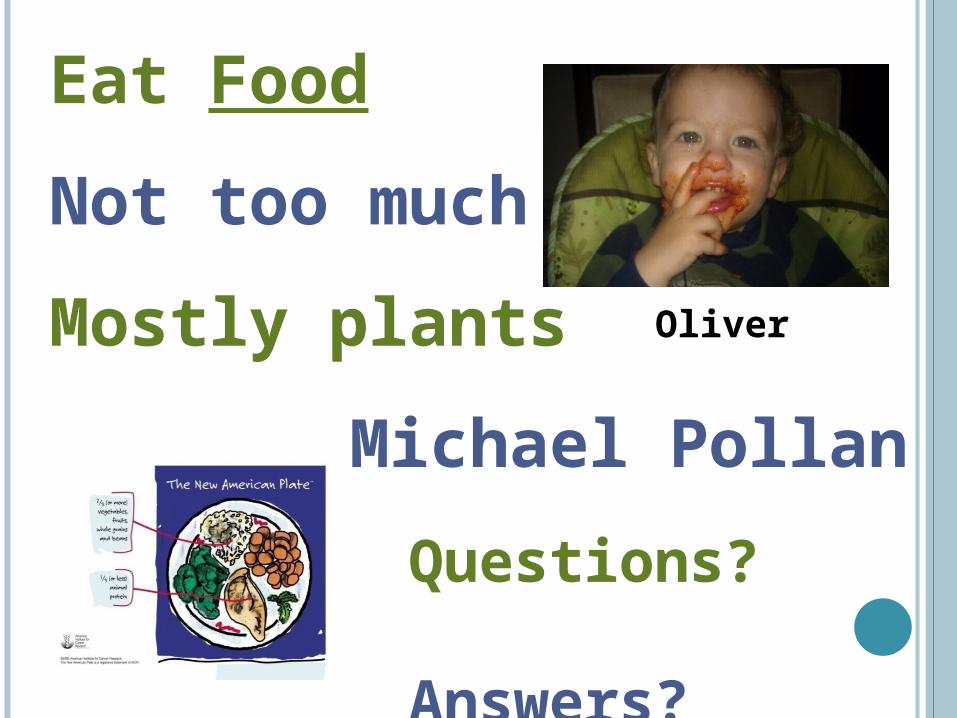
Eat Food
Not too much
Mostly plants
Michael Pollan
Questions? Answers?
Oliver


