
M. Poplawski and N. Miller Page 1
Exploring flicker in Solid‐State Lighting:
What you might find, and how to deal with it
Michael Poplawski, Pacific Northwest National Laboratory Naomi J. Miller, FIES, FIALD, Pacific Northwest National Laboratory
Introduction
Traditional commercial electric light sources running on alternating current (AC) power modulate light
output. Whether perceptible or not, incandescent, halogen, metal‐halide, and fluorescent light sources
modulate luminous flux, typically periodically, but otherwise with characteristics that are functions of
the light source design and construction.
Light modulation has many names, including flicker, flutter, and shimmer. The Illuminating Engineering
Society of North America (IESNA) Lighting Handbook defines flicker – the most commonly used term – as
“the rapid variation in light source intensity” (Rea, 2000). However, photometric flicker should not be
confused with electrical flicker, which refers to noise on AC distribution lines that can directly create
additional (light) modulation on resistive (incandescent) loads. In cases of electrical flicker, the AC line is
the source of the modulation, rather than characteristics of the light source design and construction.
Measurement of light modulation, or (photometric) flicker, is not a standard practice for commercially
available light sources. However, as light‐emitting diode (LED) lamps and luminaires continue their
significant penetration of the lighting market, apprehension is rising over the possibility for, and amount
of, flicker found in some of these products. Photometric flicker from 60Hz magnetically ‐ballasted
fluorescent, metal halide, and high‐pressure sodium lamps has been an ongoing concern of the lighting
community because of the possible connection to headaches, distraction, fatigue, lower productivity,
and annoyance in a small but significant population. No standard procedure currently exists for
measuring luminous flux modulation from light sources, and while metrics for quantifying the amount of
flicker have been developed by industry bodies, they are not widely understood or used, and appear to
have inadequacies that may be exposed by solid‐state lighting (SSL) technology.
This paper presents the measured flicker found in a variety of traditional lighting technology products,
as well as a sample of commercially available SSL products, and addresses the question of whether SSL
sources modulate luminous flux any differently than the traditional sources the lighting industry has
been built on.
Photometric Flicker
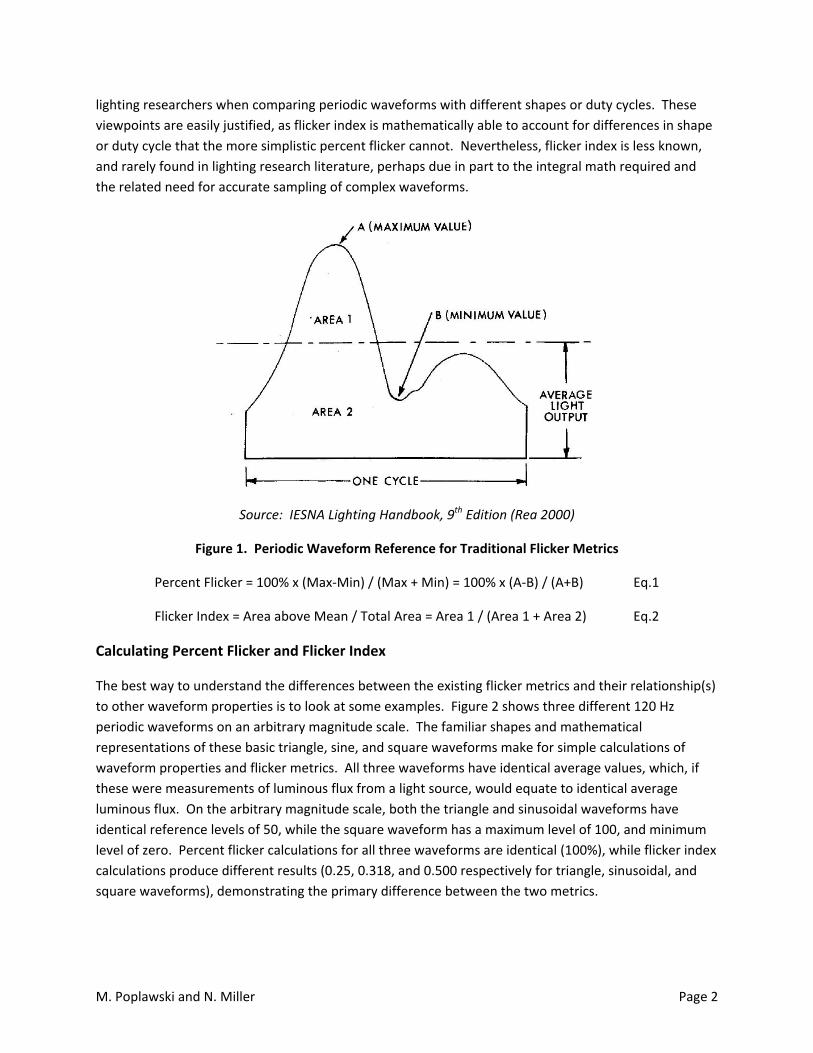
According to the IESNA, lighting experts have proposed and used two metrics for photometric flicker
(Rea, 2000). Percent flicker, defined by Eq. 1 with reference to Figure 1, is the best known of the two
metrics and is commonly used in lighting research literature, where it is also referred to as peak‐to‐peak
contrast, Michelson contrast, or even just “modulation”. Flicker index, defined by Eq. 2, also with
reference to Figure 1, is generally preferred over and/or considered more reliable than percent flicker by
M. Poplawski and N. Miller Page 2
lighting researchers when comparing periodic waveforms with different shapes or duty cycles. These
viewpoints are easily justified, as flicker index is mathematically able to account for differences in shape
or duty cycle that the more simplistic percent flicker cannot. Nevertheless, flicker index is less known,
and rarely found in lighting research literature, perhaps due in part to the integral math required and
the related need for accurate sampling of complex waveforms.
Source: IESNA Lighting Handbook, 9th Edition (Rea 2000)
Figure 1. Periodic Waveform Reference for Traditional Flicker Metrics
Percent Flicker = 100% x (Max‐Min) / (Max + Min) = 100% x (A‐B) / (A+B) Eq.1
Flicker Index = Area above Mean / Total Area = Area 1 / (Area 1 + Area 2) Eq.2
Calculating Percent Flicker and Flicker Index
The best way to understand the differences between the existing flicker metrics and their relationship(s)
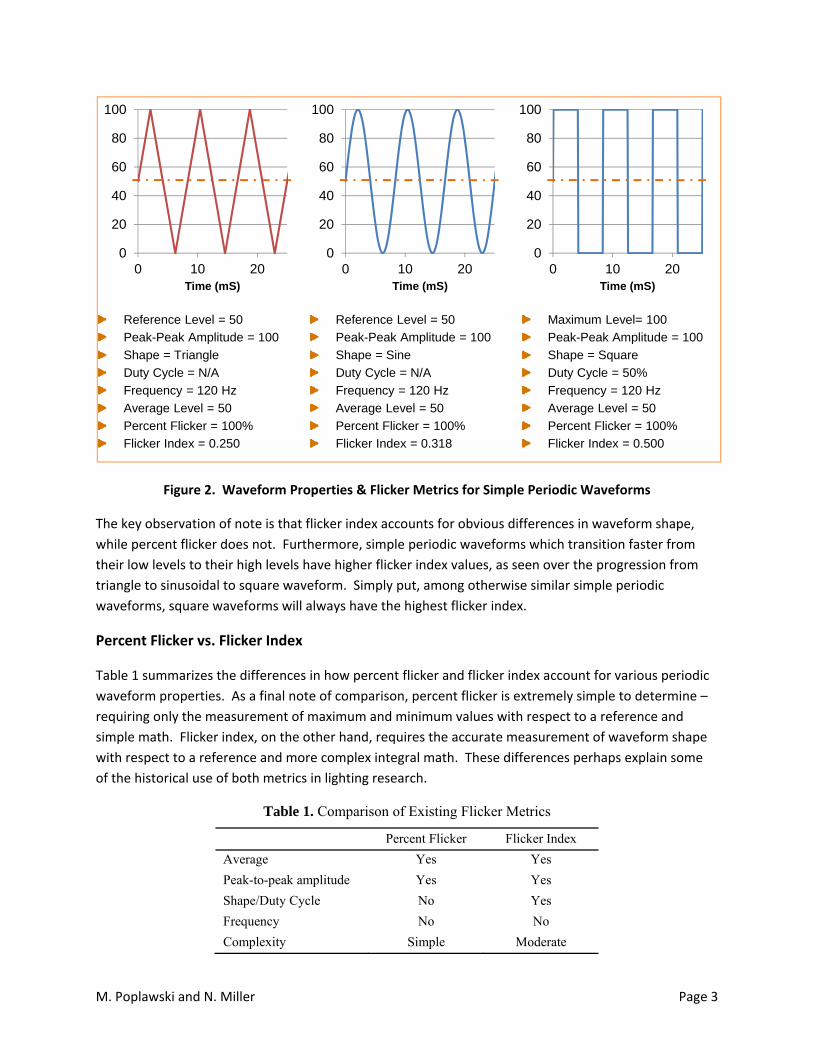
to other waveform properties is to look at some examples. Figure 2 shows three different 120 Hz
periodic waveforms on an arbitrary magnitude scale. The familiar shapes and mathematical
representations of these basic triangle, sine, and square waveforms make for simple calculations of
waveform properties and flicker metrics. All three waveforms have identical average values, which, if
these were measurements of luminous flux from a light source, would equate to identical average
luminous flux. On the arbitrary magnitude scale, both the triangle and sinusoidal waveforms have
identical reference levels of 50, while the square waveform has a maximum level of 100, and minimum
level of zero. Percent flicker calculations for all three waveforms are identical (100%), while flicker index
calculations produce different results (0.25, 0.318, and 0.500 respectively for triangle, sinusoidal, and
square waveforms), demonstrating the primary difference between the two metrics.
M. Poplawski and N. Miller Page 3
Figure 2. Waveform Properties & Flicker Metrics for Simple Periodic Waveforms
The key observation of note is that flicker index accounts for obvious differences in waveform shape,
while percent flicker does not. Furthermore, simple periodic waveforms which transition faster from
their low levels to their high levels have higher flicker index values, as seen over the progression from
triangle to sinusoidal to square waveform. Simply put, among otherwise similar simple periodic
waveforms, square waveforms will always have the highest flicker index.
Percent Flicker vs. Flicker Index
Table 1 summarizes the differences in how percent flicker and flicker index account for various periodic
waveform properties. As a final note of comparison, percent flicker is extremely simple to determine –
requiring only the measurement of maximum and minimum values with respect to a reference and
simple math. Flicker index, on the other hand, requires the accurate measurement of waveform shape
with respect to a reference and more complex integral math. These differences perhaps explain some
of the historical use of both metrics in lighting research.
Table 1. Comparison of Existing Flicker Metrics
Percent Flicker Flicker Index
Average Yes Yes
Peak-to-peak amplitude Yes Yes
Shape/Duty Cycle No Yes
Frequency No No
Complexity Simple Moderate
0
20
40
60
80
100
0 10 20Time (mS)
0
20
40
60
80
100
0 10 20Time (mS)
Reference Level = 50
Peak-Peak Amplitude = 100
Shape = Triangle
Duty Cycle = N/A
Frequency = 120 Hz
Average Level = 50
Percent Flicker = 100%
Flicker Index = 0.250
Reference Level = 50
Peak-Peak Amplitude = 100
Shape = Sine
Duty Cycle = N/A
Frequency = 120 Hz
Average Level = 50
Percent Flicker = 100%
Flicker Index = 0.318
Maximum Level= 100
Peak-Peak Amplitude = 100
Shape = Square
Duty Cycle = 50%
Frequency = 120 Hz
Average Level = 50
Percent Flicker = 100%
Flicker Index = 0.500
0
20
40
60
80
100
0 10 20Time (mS)
M. Poplawski and N. Miller Page 4
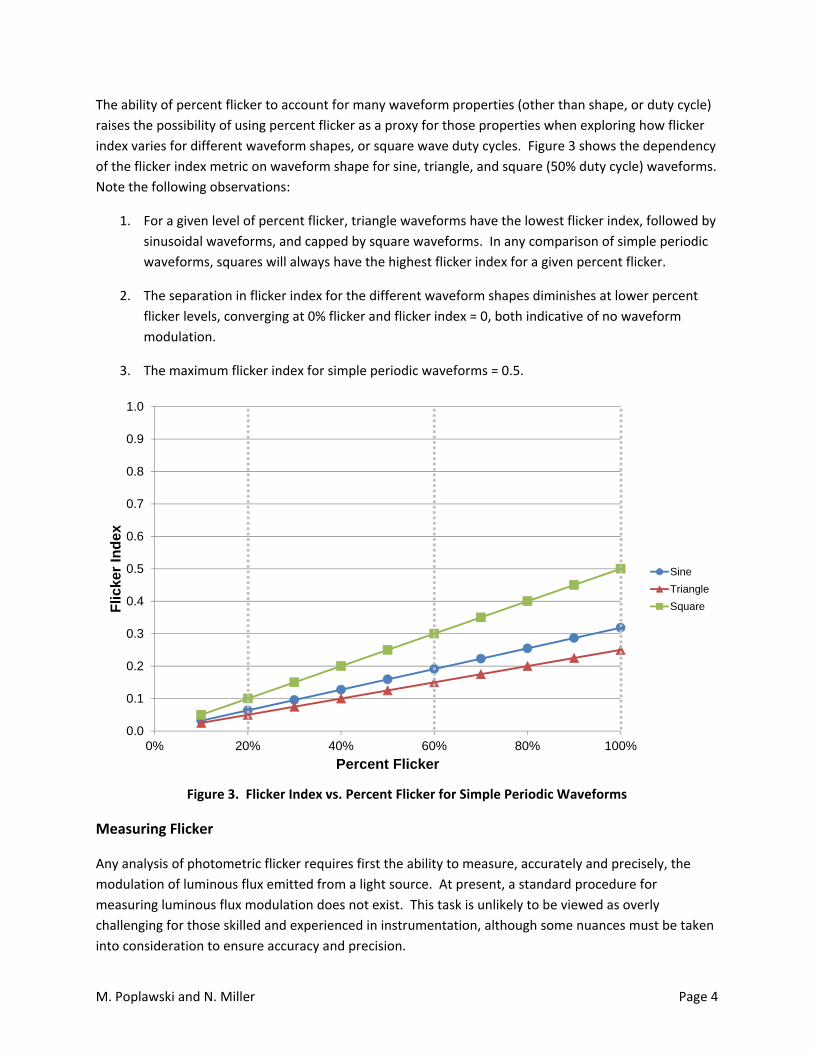
The ability of percent flicker to account for many waveform properties (other than shape, or duty cycle)
raises the possibility of using percent flicker as a proxy for those properties when exploring how flicker
index varies for different waveform shapes, or square wave duty cycles. Figure 3 shows the dependency
of the flicker index metric on waveform shape for sine, triangle, and square (50% duty cycle) waveforms.
Note the following observations:
1. For a given level of percent flicker, triangle waveforms have the lowest flicker index, followed by
sinusoidal waveforms, and capped by square waveforms. In any comparison of simple periodic
waveforms, squares will always have the highest flicker index for a given percent flicker.
2. The separation in flicker index for the different waveform shapes diminishes at lower percent
flicker levels, converging at 0% flicker and flicker index = 0, both indicative of no waveform
modulation.
3. The maximum flicker index for simple periodic waveforms = 0.5.
Figure 3. Flicker Index vs. Percent Flicker for Simple Periodic Waveforms
Measuring Flicker
Any analysis of photometric flicker requires first the ability to measure, accurately and precisely, the
modulation of luminous flux emitted from a light source. At present, a standard procedure for
measuring luminous flux modulation does not exist. This task is unlikely to be viewed as overly
challenging for those skilled and experienced in instrumentation, although some nuances must be taken
into consideration to ensure accuracy and precision.
0.0
0.1
0.2
0.3
0.4
0.5
0.6
0.7
0.8
0.9
1.0
0% 20% 40% 60% 80% 100%
Flic
ker
Ind
ex
Percent Flicker
Sine
Triangle
Square
M. Poplawski and N. Miller Page 5
Photosensors capable of measuring visible light over a wide dynamic range have long existed in the
marketplace. Standard practice for many sensor applications includes the digitization of the (typically)
analog sensor output, thereby facilitating the use of a wide range of digital signal processing software.
The data sampling and processing requirements for this application are well within the range of
(relatively) inexpensive and commonly available hardware and software.
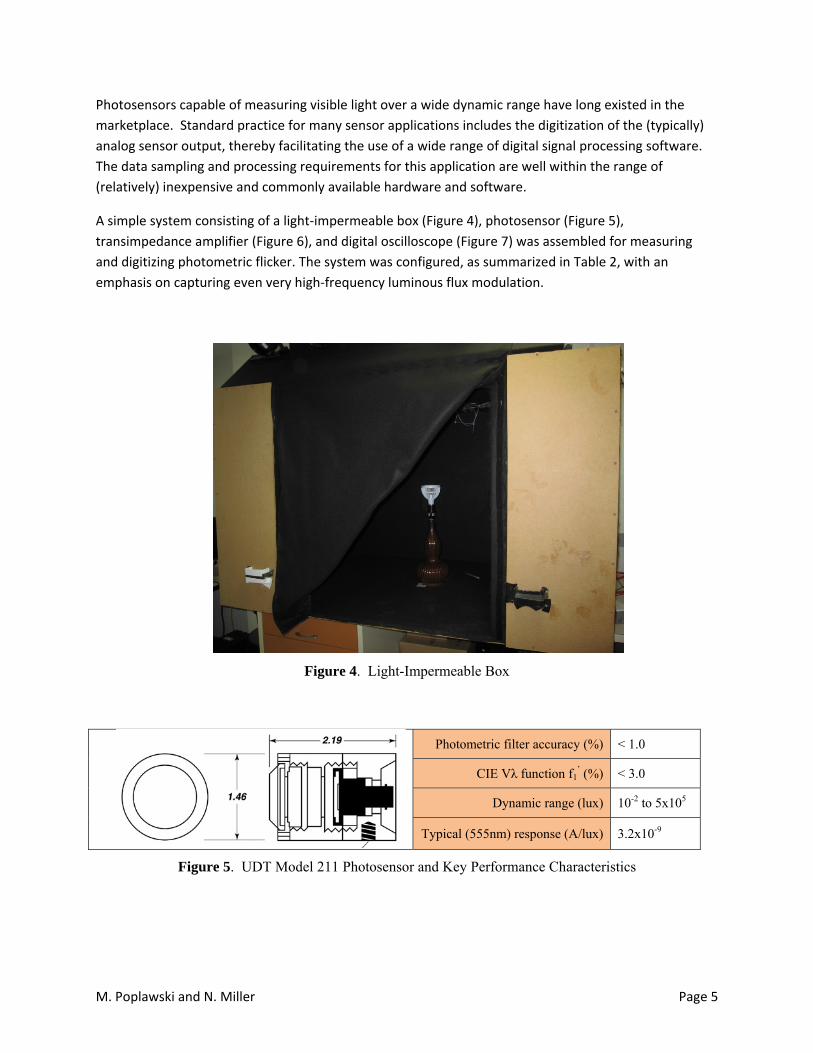
A simple system consisting of a light‐impermeable box (Figure 4), photosensor (Figure 5),
transimpedance amplifier (Figure 6), and digital oscilloscope (Figure 7) was assembled for measuring
and digitizing photometric flicker. The system was configured, as summarized in Table 2, with an
emphasis on capturing even very high‐frequency luminous flux modulation.
Figure 4. Light-Impermeable Box
Photometric filter accuracy (%) < 1.0
CIE Vλ function f1’ (%) < 3.0
Dynamic range (lux) 10-2 to 5x10⁵
Typical (555nm) response (A/lux) 3.2x10⁻⁹
Figure 5. UDT Model 211 Photosensor and Key Performance Characteristics

M. Poplawski and N. Miller Page 6
Gain (Volts/Amp) 103-1010
Noise (mV RMS) 0.5
Current Range (Amps) 10-2-10-13
Overall Accuracy (%) ± 2
Typical Input Impedance (Ω) 0.001
Output Impedance (Ω) < 1
Output Voltage Range (V) ± 5
Figure 6. UDT Tramp Transimpedance Amplifier and Key Performance Characteristics
-3dB Analog Bandwidth (MHz) 100
Hardware Bandwidth (MHz) 20
Max. Sample Rate (GS/s) 1
Max Record Length (points) 1M
Input Impedance (kΩ) 101
Max. Input Voltage ±40
Figure 7. Tektronix DPO2014 Digital Oscilloscope and Key Performance Characteristics
Table 2. Data Acquisition Configuration Summary
Sample rate (MS/s) 100,000
Sampling period (uS) 1
Sampling window (mS) 125
Record length (samples) 125,000
Number of records 10
Flicker in traditional lighting technologies
The performance evaluation of any new technology should start with a clear understanding of how the
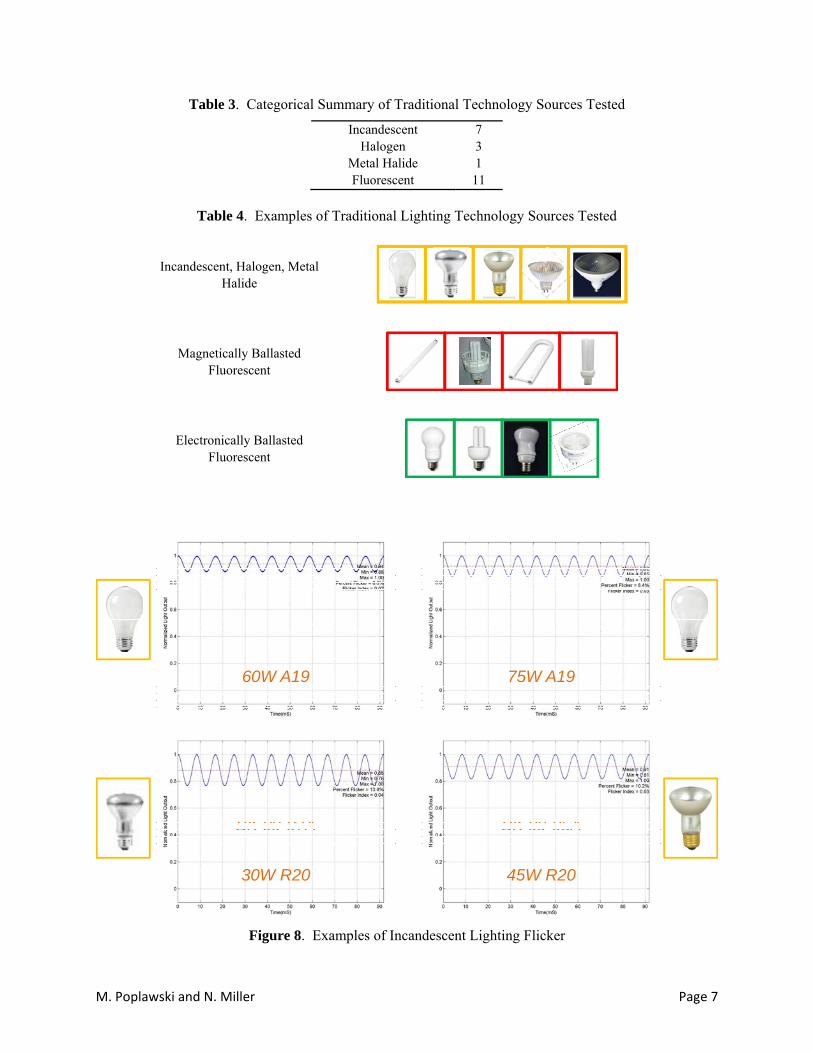
incumbents perform. Table 3 categorizes 22 unique traditional lighting technology sources evaluated
for flicker to form a baseline understanding of traditional lighting technology. The measured luminous
flux modulation and calculated flicker metrics for a subset of these sources (shown in Table 4) are shown
in Figures 8‐11.
M. Poplawski and N. Miller Page 7
Table 3. Categorical Summary of Traditional Technology Sources Tested
Incandescent 7 Halogen 3
Metal Halide 1 Fluorescent 11
Table 4. Examples of Traditional Lighting Technology Sources Tested
Incandescent, Halogen, Metal Halide
Magnetically Ballasted Fluorescent
Electronically Ballasted Fluorescent
Figure 8. Examples of Incandescent Lighting Flicker
BK 10-X-36A BK 10-X-37A
BK 09-07A BK 09-05A
60W A19 75W A19
30W R20 45W R20
M. Poplawski and N. Miller Page 8
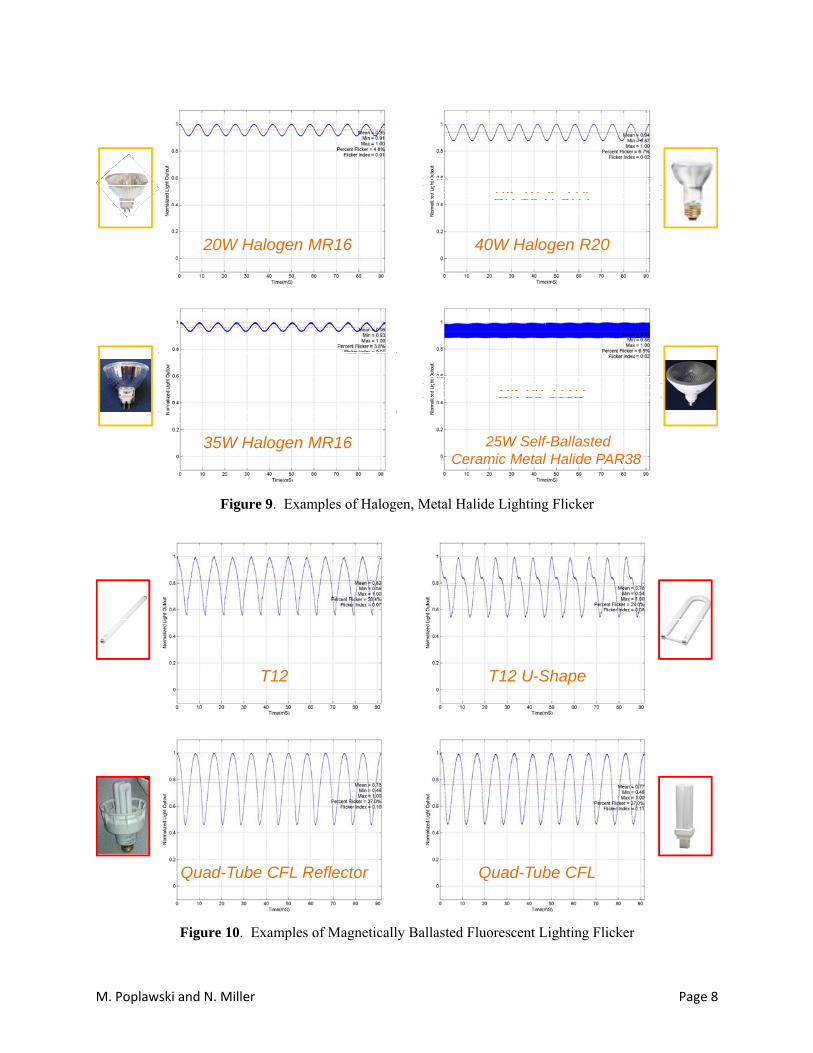
Figure 9. Examples of Halogen, Metal Halide Lighting Flicker
Figure 10. Examples of Magnetically Ballasted Fluorescent Lighting Flicker
BK 08-94A BK 10-X-37A
BK 10-21D BK 09-111D
20W Halogen MR16 40W Halogen R20
35W Halogen MR16 25W Self-Ballasted Ceramic Metal Halide PAR38
BK 10-X-28 BK 10-X-32
BK 10-X-33 BK 10-X-34
T12 T12 U-Shape
Quad-Tube CFL Reflector Quad-Tube CFL
M. Poplawski and N. Miller Page 9
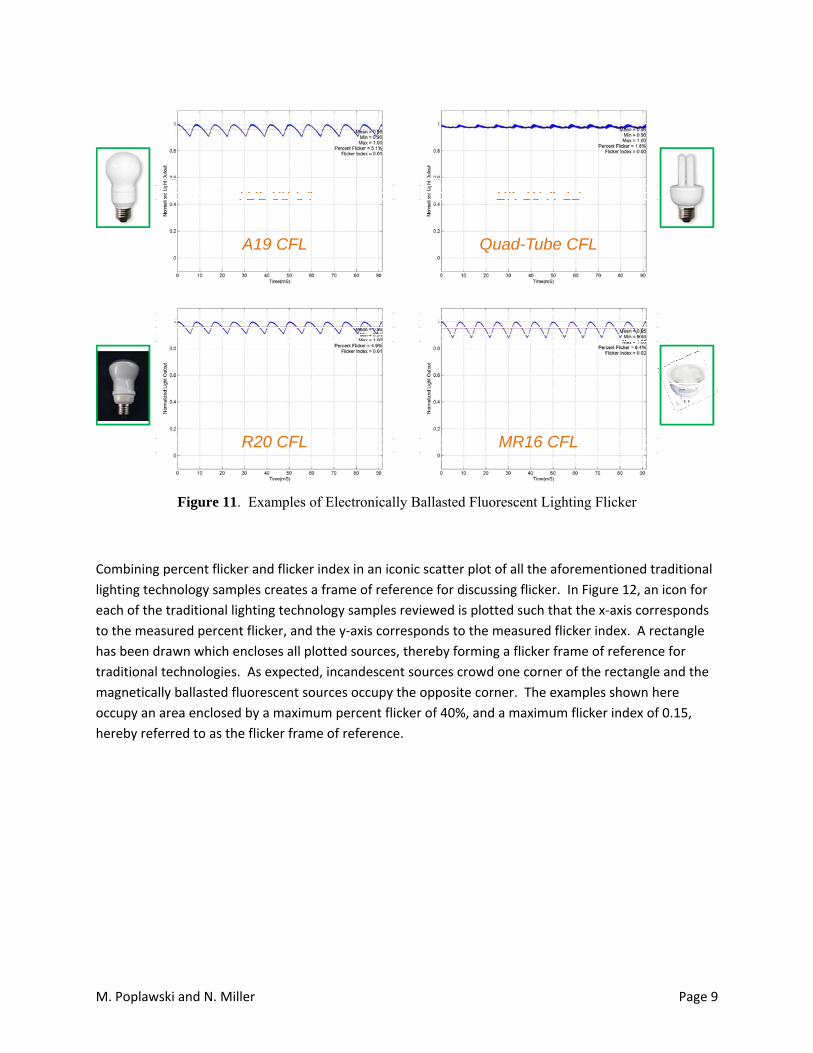
Figure 11. Examples of Electronically Ballasted Fluorescent Lighting Flicker
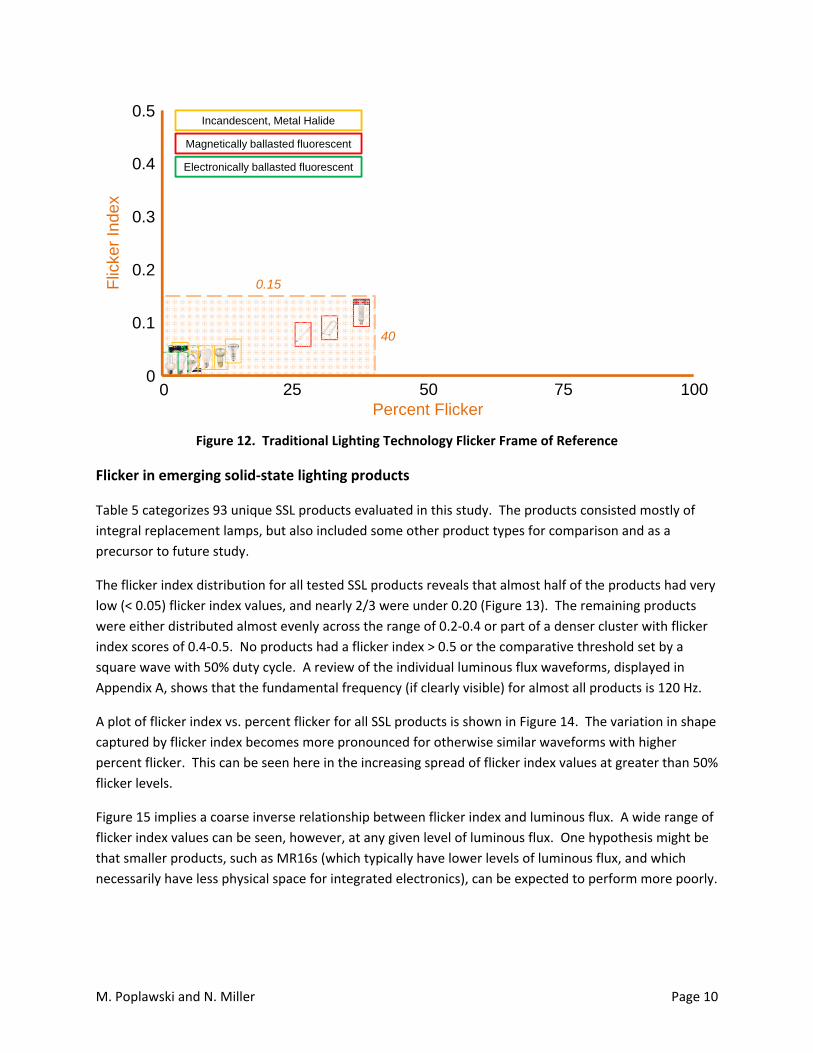
Combining percent flicker and flicker index in an iconic scatter plot of all the aforementioned traditional
lighting technology samples creates a frame of reference for discussing flicker. In Figure 12, an icon for
each of the traditional lighting technology samples reviewed is plotted such that the x‐axis corresponds
to the measured percent flicker, and the y‐axis corresponds to the measured flicker index. A rectangle
has been drawn which encloses all plotted sources, thereby forming a flicker frame of reference for
traditional technologies. As expected, incandescent sources crowd one corner of the rectangle and the
magnetically ballasted fluorescent sources occupy the opposite corner. The examples shown here
occupy an area enclosed by a maximum percent flicker of 40%, and a maximum flicker index of 0.15,
hereby referred to as the flicker frame of reference.
TDL 08-64 BK 10-X-12
BK 09-10B BK 09-11
A19 CFL Quad-Tube CFL
R20 CFL MR16 CFL
M. Poplawski and N. Miller Page 10
Figure 12. Traditional Lighting Technology Flicker Frame of Reference
Flicker in emerging solid‐state lighting products
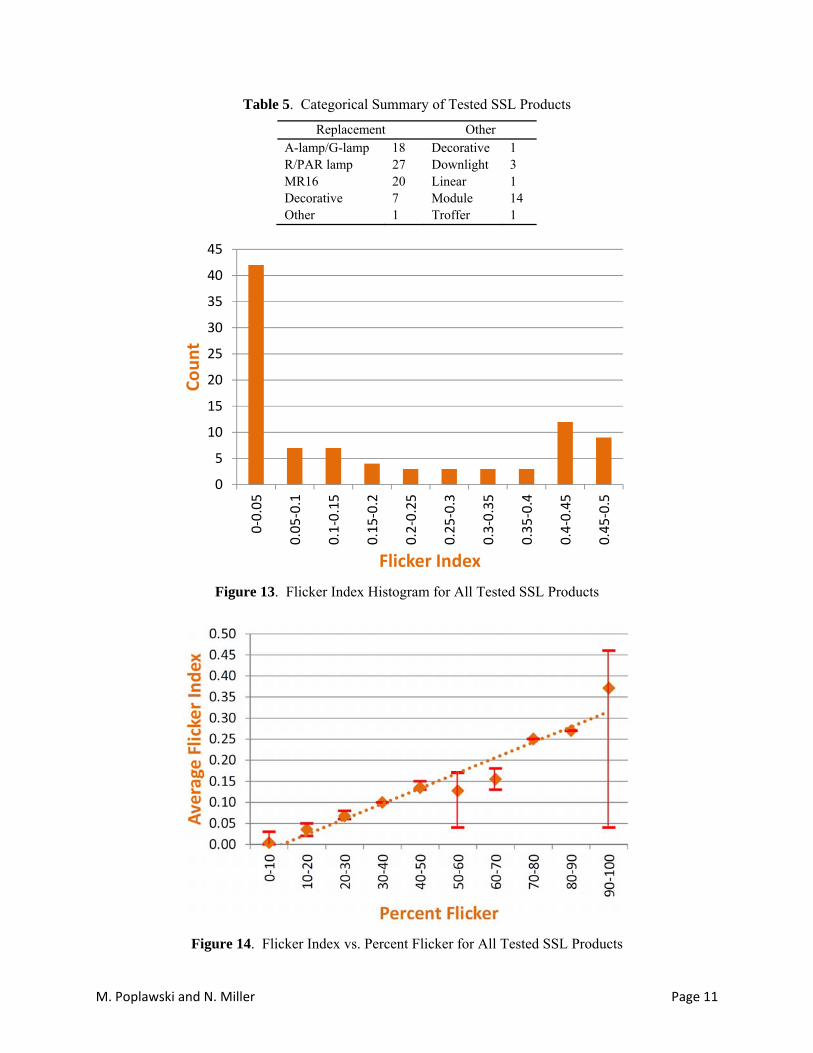
Table 5 categorizes 93 unique SSL products evaluated in this study. The products consisted mostly of
integral replacement lamps, but also included some other product types for comparison and as a
precursor to future study.
The flicker index distribution for all tested SSL products reveals that almost half of the products had very
low (< 0.05) flicker index values, and nearly 2/3 were under 0.20 (Figure 13). The remaining products
were either distributed almost evenly across the range of 0.2‐0.4 or part of a denser cluster with flicker
index scores of 0.4‐0.5. No products had a flicker index > 0.5 or the comparative threshold set by a
square wave with 50% duty cycle. A review of the individual luminous flux waveforms, displayed in
Appendix A, shows that the fundamental frequency (if clearly visible) for almost all products is 120 Hz.
A plot of flicker index vs. percent flicker for all SSL products is shown in Figure 14. The variation in shape
captured by flicker index becomes more pronounced for otherwise similar waveforms with higher
percent flicker. This can be seen here in the increasing spread of flicker index values at greater than 50%
flicker levels.
Figure 15 implies a coarse inverse relationship between flicker index and luminous flux. A wide range of
flicker index values can be seen, however, at any given level of luminous flux. One hypothesis might be
that smaller products, such as MR16s (which typically have lower levels of luminous flux, and which
necessarily have less physical space for integrated electronics), can be expected to perform more poorly.
Percent Flicker
Flic
ker
Inde
x
00
1005025 75
0.4
0.3
0.2
0.1
0.5
0.15
40
Incandescent, Metal Halide
Magnetically ballasted fluorescent
Electronically ballasted fluorescent
M. Poplawski and N. Miller Page 11
Table 5. Categorical Summary of Tested SSL Products
Replacement Other A-lamp/G-lamp 18 Decorative 1 R/PAR lamp 27 Downlight 3 MR16 20 Linear 1 Decorative 7 Module 14 Other 1 Troffer 1
Figure 13. Flicker Index Histogram for All Tested SSL Products
Figure 14. Flicker Index vs. Percent Flicker for All Tested SSL Products
0
5
10
15
20
25
30
35
40
450‐0.05
0.05‐0.1
0.1‐0.15
0.15‐0.2
0.2‐0.25
0.25‐0.3
0.3‐0.35
0.35‐0.4
0.4‐0.45
0.45‐0.5
Count
Flicker Index

M. Poplawski and N. Miller Page 12
Figure 15. Flicker Index vs. Luminous Flux for All Tested SSL Products
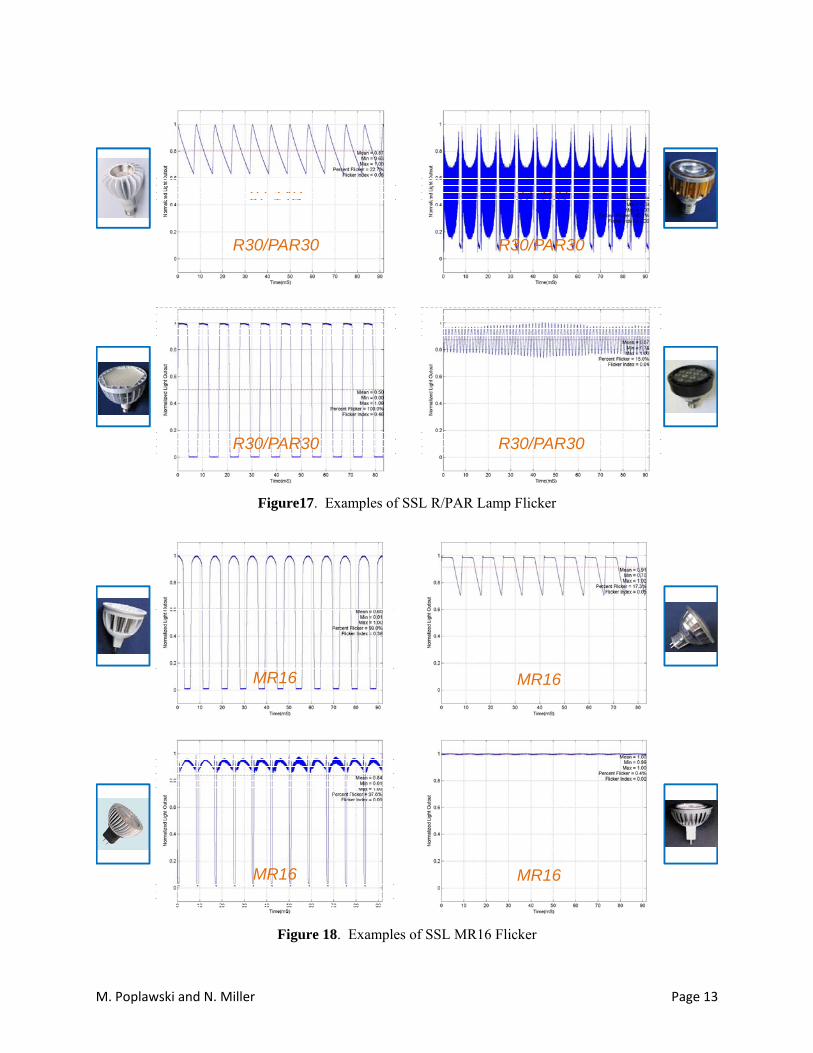
The measured luminous flux modulation and calculated flicker metrics for a subset of these products,
across various source categories, are shown in Figures 16‐20.
Figure 16. Examples of SSL A-Lamp/G-lamp Flicker
07-23A 09-20A
10-28D 09-21A
A-lamp/G-lamp A-lamp/G-lamp
A-lamp/G-lamp A-lamp/G-lamp
M. Poplawski and N. Miller Page 13
Figure17. Examples of SSL R/PAR Lamp Flicker
Figure 18. Examples of SSL MR16 Flicker
07-14B 07-18B
09-76D 09-112A
R30/PAR30 R30/PAR30
R30/PAR30 R30/PAR30
07-53A
MR16
09-80C
MR16
08-98E
MR16
09-93B
MR16
M. Poplawski and N. Miller Page 14
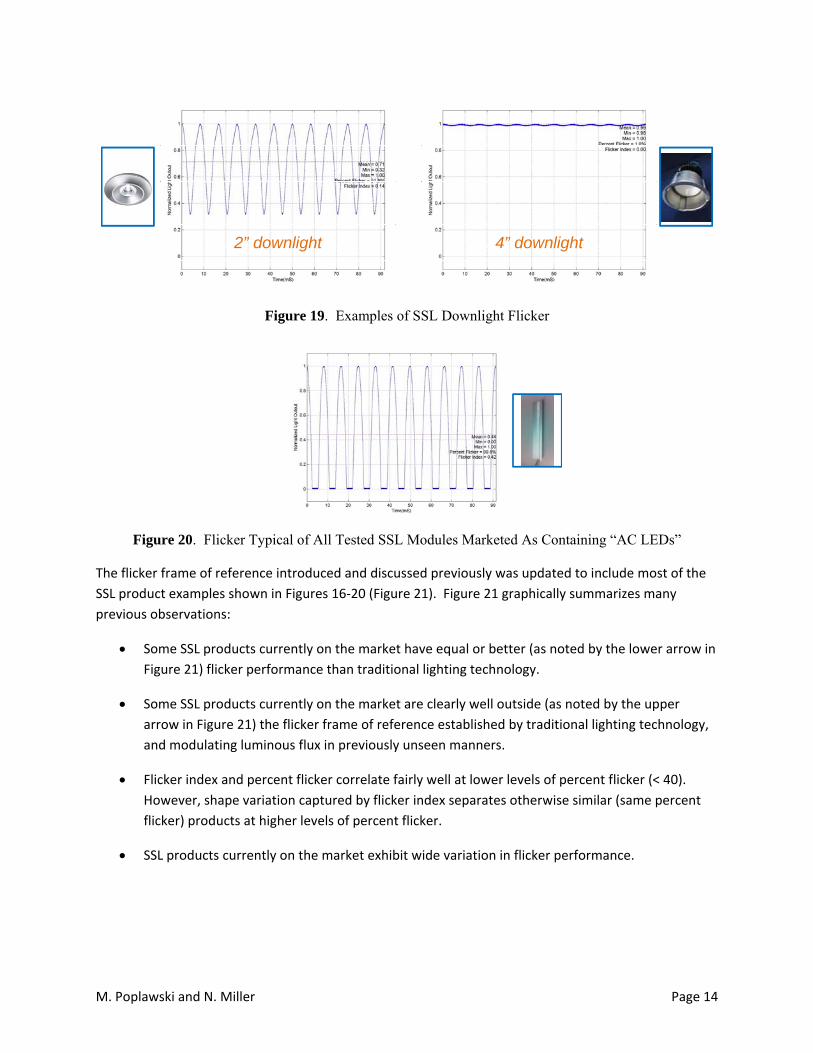
Figure 19. Examples of SSL Downlight Flicker
Figure 20. Flicker Typical of All Tested SSL Modules Marketed As Containing “AC LEDs”
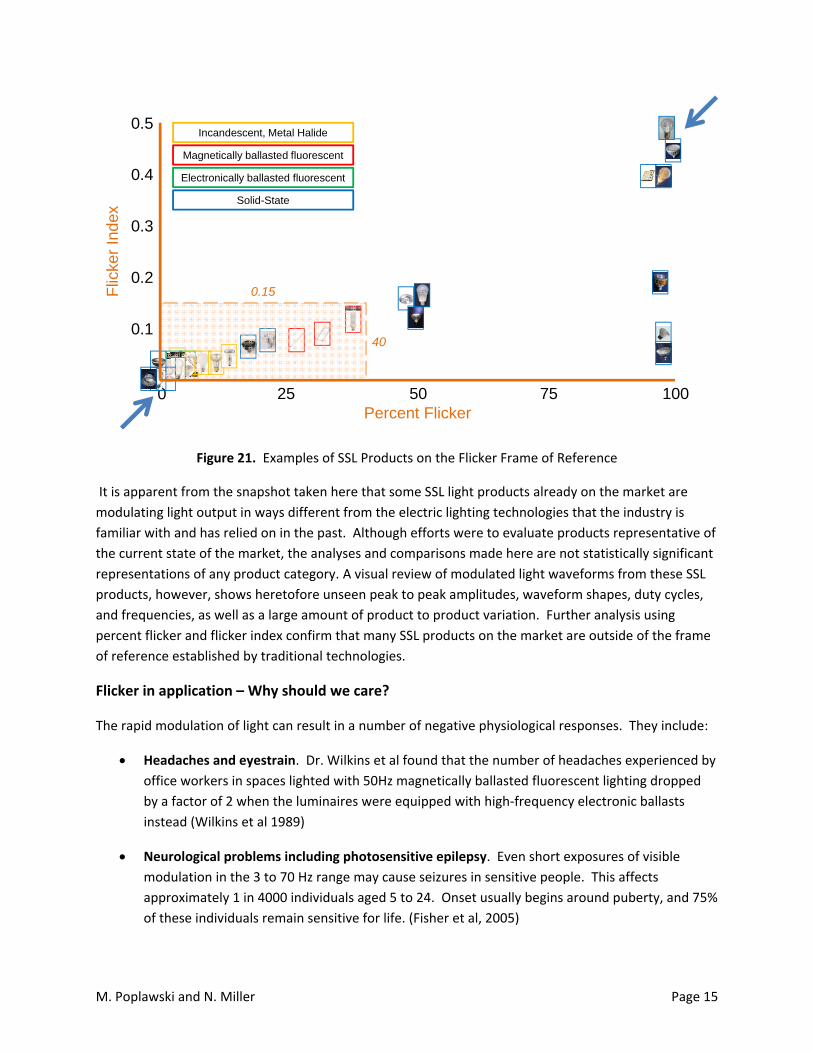
The flicker frame of reference introduced and discussed previously was updated to include most of the
SSL product examples shown in Figures 16‐20 (Figure 21). Figure 21 graphically summarizes many
previous observations:
Some SSL products currently on the market have equal or better (as noted by the lower arrow in
Figure 21) flicker performance than traditional lighting technology.
Some SSL products currently on the market are clearly well outside (as noted by the upper
arrow in Figure 21) the flicker frame of reference established by traditional lighting technology,
and modulating luminous flux in previously unseen manners.
Flicker index and percent flicker correlate fairly well at lower levels of percent flicker (< 40).
However, shape variation captured by flicker index separates otherwise similar (same percent
flicker) products at higher levels of percent flicker.
SSL products currently on the market exhibit wide variation in flicker performance.
07-61 09-44
2” downlight 4” downlight
CALiPER ID
Category
M. Poplawski and N. Miller Page 15
Figure 21. Examples of SSL Products on the Flicker Frame of Reference
It is apparent from the snapshot taken here that some SSL light products already on the market are
modulating light output in ways different from the electric lighting technologies that the industry is
familiar with and has relied on in the past. Although efforts were to evaluate products representative of
the current state of the market, the analyses and comparisons made here are not statistically significant
representations of any product category. A visual review of modulated light waveforms from these SSL
products, however, shows heretofore unseen peak to peak amplitudes, waveform shapes, duty cycles,
and frequencies, as well as a large amount of product to product variation. Further analysis using
percent flicker and flicker index confirm that many SSL products on the market are outside of the frame
of reference established by traditional technologies.
Flicker in application – Why should we care?
The rapid modulation of light can result in a number of negative physiological responses. They include:
Headaches and eyestrain. Dr. Wilkins et al found that the number of headaches experienced by
office workers in spaces lighted with 50Hz magnetically ballasted fluorescent lighting dropped
by a factor of 2 when the luminaires were equipped with high‐frequency electronic ballasts
instead (Wilkins et al 1989)
Neurological problems including photosensitive epilepsy. Even short exposures of visible
modulation in the 3 to 70 Hz range may cause seizures in sensitive people. This affects
approximately 1 in 4000 individuals aged 5 to 24. Onset usually begins around puberty, and 75%
of these individuals remain sensitive for life. (Fisher et al, 2005)
Percent Flicker
Flic
ker
Inde
x
1005025 75
0.4
0.2
0.1
0.5
0.15
40
0.3
00
Incandescent, Metal Halide
Magnetically ballasted fluorescent
Electronically ballasted fluorescent
Solid-State
M. Poplawski and N. Miller Page 16
Reductions in visual performance. Veitch and McColl in 1995 found that 100‐120 Hz modulation
(not perceived as flicker) from magnetically‐ballasted fluorescent lighting systems reduced
group average performance on visual tasks, when compared to performance under high‐
frequency electronic ballasts. This occurred for reading, both for paper tasks and for text on
computer screens.
Distraction. The periphery of the visual field is more sensitive to flicker, and the rapid
modulation may draw a driver’s gaze toward a flickering sign or toward a car with flickering
taillights, for example. Drawing the eye away from the task ahead could be dangerous for the
driver or objects and people in the driver’s path.
Hazard from the strobe effect of flickering light sources interacting with moving machinery,
resulting in an apparently different rate of motion, or even appearance of being stopped. This
hazard has been recognized in industrial applications for decades. (IES RP‐7: Recommended
Practice for Lighting Industrial Facilities, 2001.)
Disruptive behaviors in individuals with autism. Children with autism are especially sensitive to
changes in their environment, and flicker from lighting can result in increased repetitive
behaviors.i Rates of autism in children in the US are approximately 1 in 110. (Fenton and
Penney, 1985)
What makes flicker worse?
The following conditions contribute to a higher risk of adverse responses to flicker:
Duration of exposure (longer is worse)
Area of the retina receiving stimulation (greater is worse)
Location in visual field (central is worse because it projects to a greater area of the visual cortex,
even though flicker is less noticeable in the fovea)
Brightness of the flash (higher luminances are worse; scotopic luminances produce low risk, high
mesopic and photopic luminances produce higher risk)
Contrast of the flash with the surround luminance (higher is worse)
Color contrast of flash (deep red is worse)
These issues of health, perception, and performance may be an annoyance for some individuals, a
hazard for others, and some may remain unaffected. It is important that the susceptible populations are
identified, the probability of occurrence quantified, and the severity of the consequences assessed.
Ideally, a risk matrix is needed to help professionals designing lighting assess potential populations and
applications of concern. This, in conjunction with a reliable, lighting technology‐neutral flicker metric,
M. Poplawski and N. Miller Page 17
would help these designers and engineers choose low‐flicker products and avoid others for particular
settings.
Where Flicker matters
General lighting. Avoid high modulation or light levels of flicker in luminaires that provide general
lighting in spaces, since general lighting fills most of the visual field and is unlikely to be mitigated by
other non‐flickering sources of light. This may include overhead lighting in corridors, offices, classrooms,
laboratories, etc.
Spaces where children or susceptible populations spend considerable time. Avoid flicker in luminaires
used in spaces where children or individuals with greater sensitivity are likely to spend longer periods of
time. This includes hospitals, clinics, medical offices, classrooms, daycare centers, etc.
Task lighting. Avoid task lights that flicker, because the light from the luminaire may fill most of the
visual field, and be providing the highest luminances in the field of view.
Industrial spaces with moving machinery. Task lighting on machinery should NOT produce high levels of
flicker. If HID luminaires driven by magnetic ballasts are used overhead, their flicker can be mitigated by
daylight from skylights; or, luminaires with overlapping coverage areas can be powered on separate
phases of a three‐phase electrical distribution system.
Where flicker is less important
Parking lots/roadways where users are moving in a motor vehicle or spending short periods of time.
Flicker is less problematic with short exposures.
Accent light on artwork. As long as the ambient lighting in a space doesn’t flicker, flicker from low levels
of accent lighting on artwork may not be noticeable or problematic. Sensitive users may notice the
strobe effect when their gaze moves as they scan across the room. This may be somewhat distracting,
depending on the relative modulation of the accent lighting relative to the viewer’s adaptation
luminance.
Places where the distraction of flashing may be an advantage. Controlled flicker, such as flashing of an
LED marker light on a bicycle may provide sufficient distraction to enhance visibility. It may be prudent
to avoid the prominent sensitivity ranges for photosensitive epilepsy, however.
Conclusion
The data presented in this paper indicate great variability in waveforms (flicker profiles) from
commercially available LED products. Flicker is therefore a key attribute that the practitioner
needs to consider in evaluating LED products. A standardized measurement procedure and
reporting protocol is needed to help the practitioner in that effort, but industry consensus

M. Poplawski and N. Miller Page 18
methods are not currently available. In the meantime, a spinning top “flicker checker” is a
simple tool the practitioner can use when viewing products, to identify those that exhibit
flicker. Visual assessment by the lighting practitioner of LED lighting products in their intended
application is always recommended.
Anyone who specifies lighting products needs to be aware of the possibility of finding
unfamiliar levels of flicker in some SSL products, and understand how to specify lighting systems
for susceptible populations in both indoor and outdoor spaces. While flicker may be acceptable in
certain applications, this is still an area for investigation. Definitive guidance cannot be given at
this time, but the purpose of this paper is to show examples of the waveform variability that
exists in current commercially available LED products, and to identify some of the health and
performance issues that may result from exposure to too much flicker, including applications
and user populations where caution is warranted.
An IEEE Standards Working Group, IEEE PAR1789 "Recommending practices for modulating current in
High Brightness LEDs for mitigating health risks to viewers" has been formed by Prof. Brad Lehman of
Northeastern University to advise the lighting industry, ANSI/NEMA, IEC, EnergyStar® and other
standards groups about the emerging concern of flicker in LED lighting. IEEE PAR1789 activity is currently
focused on three areas. An Education sub‐committee disseminates the ongoing work in IEEE PAR1789,
primarily through the development of a series of white papers, conference presentations, and journal
articles. The Defining Measures for Flicker sub‐committee is focused on developing a new, technology‐
neutral metric for flicker. The known health risks from flickering light sources are being documented by
a Hazard Analysis sub‐committee, which will subsequently set its sights on developing and refining a risk
assessment matrix, which should be an invaluable tool for guiding the lighting industry towards
designing and specifying SSL products safely.
References
D. M. Fenton and R. Penney, “The effects of fluorescent and incandescent lighting on the repetitive
behaviours of autistic and intellectually handicapped children,” Journal of Intellectual & Developmental
Disability, vol. 11, no. 3, p. 137–141, 1985.
IES RP‐7: Recommended Practice for Lighting Industrial Facilities, 2001. Illuminating Engineering
Society, New York.
R. S. Fisher, G. Harding, G. Erba, G.L. Barkley, and A. Wilkins, “Photic‐and Pattern‐induced Seizures:
Expert Consensus of the Epilepsy Foundation of America Working Group,” Epilepsia, vol. 46, no. 9, pp.
1426‐1441, 2005.
M. Poplawski and N. Miller Page 19
M.S. Rea, ed. The IESNA Lighting Handbook: Reference & Application, 9th Edition. Illuminating
Engineering Society of North America, New York, 2000.
J.A. Veitch and S. L. McColl, “Modulation of fluorescent light: Flicker rate and light source effects on
visual performance and visual comfort,” Lighting Research and Technology, vol. 27, no. 4, p. 243, 1995.
A.J. Wilkins, I. Nimmo‐Smith, A.I. Slater, and L. Bedocs, “Fluorescent lighting, headaches and eyestrain,”
Lighting Research and Technology, vol. 21, no. 1, p.11, 1989.


