
Exploring Factors Associated with Exploring Factors Associated with Grade VIII Students’ Attainment Grade VIII Students’ Attainment in Science: The issue of medium in Science: The issue of medium
of Instructionof Instruction
Hafiz M. Iqbal, PhDHafiz M. Iqbal, PhDInstitute of Education and Research,Institute of Education and Research,
University of the PunjabUniversity of the PunjabLahore-PakistanLahore-Pakistan


Importance of Science Education Importance of Science Education
Development of inquisitive mindsDevelopment of inquisitive minds Scientific manpowerScientific manpower Positive attitudes toward science, etcPositive attitudes toward science, etc

Factors Associated with Science AttainmentFactors Associated with Science Attainment
NEAS Data (19 variables), includingNEAS Data (19 variables), including– Location of schoolLocation of school– Students; genderStudents; gender– School typeSchool type– HomeworkHomework– Parental expectationsParental expectations– Liking scienceLiking science– Home language, etcHome language, etc

Science scores broken down by provincesScience scores broken down by provinces
Province N Mean Std. Dev.
Balochistan 1560 15.94 4.63
NWFP 1867 16.31 4.94
Punjab 4233 18.65 5.69
Sindh 2095 14.41 4.88
AJK 1180 16.69 4.12
FANA 1150 15.97 4.46
FATA 933 15.68 4.89
ICT 353 19.23 4.59
Total 13371 16.75 5.26p<1%, medium effect size

Science scores broken down by genderScience scores broken down by gender
N Mean Std. Dev.
Gender
Male 7186 16.44 5.20
Female 6185 17.11 5.32
Location
Rural 5518 17.27 5.44
Urban 7853 16.38 5.11
School type
Boys 6453 16.60 5.13
Girls 6092 17.14 5.33
Mixed 826 15.00 5.41
Total 13371 16.75 5.26
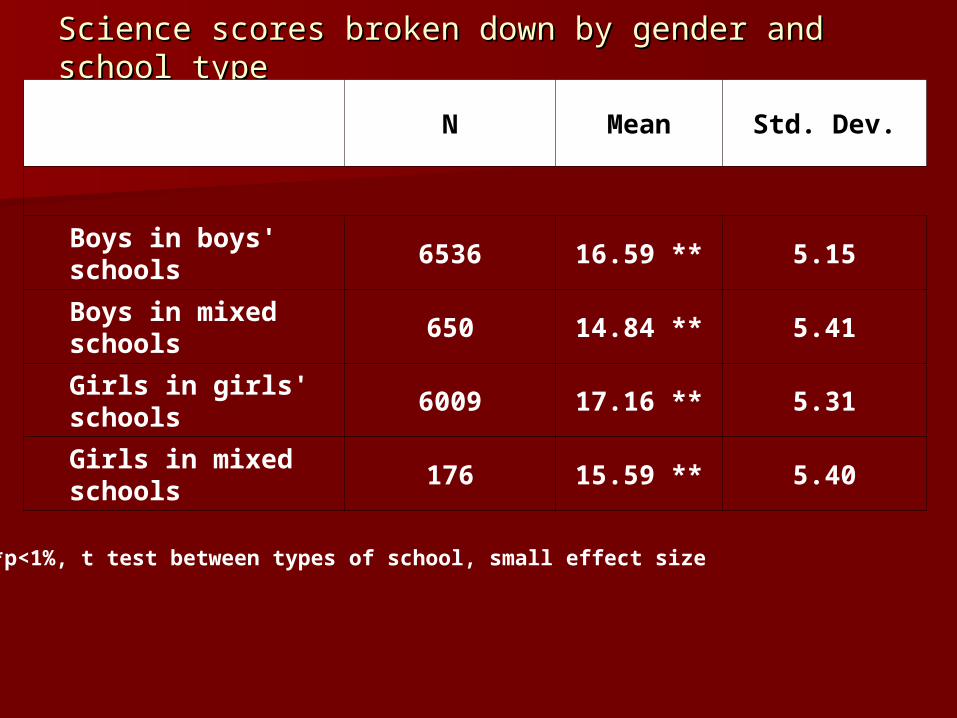
Science scores broken down by gender and school Science scores broken down by gender and school typetype
N Mean Std. Dev.
Boys in boys' schools6536 16.59 ** 5.15
Boys in mixed schools650 14.84 ** 5.41
Girls in girls' schools6009 17.16 ** 5.31
Girls in mixed schools176 15.59 ** 5.40
**p<1%, t test between types of school, small effect size
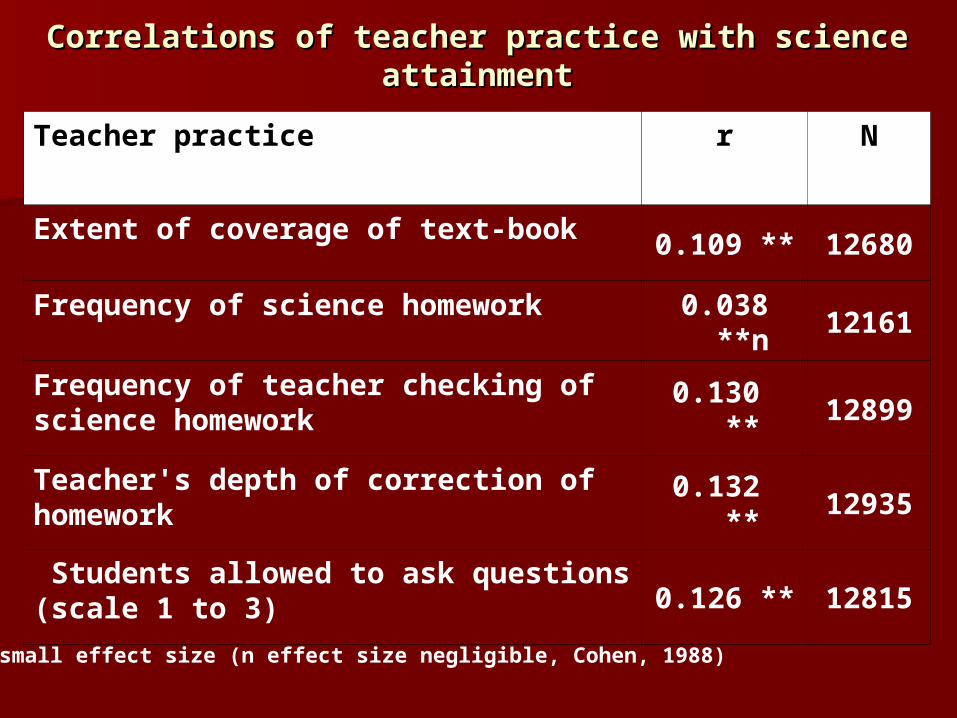
Correlations of teacher practice with science Correlations of teacher practice with science attainmentattainment
Teacher practice r N
Extent of coverage of text-book 0.109 ** 12680
Frequency of science homework 0.038 **n 12161
Frequency of teacher checking of science homework 0.130 ** 12899
Teacher's depth of correction of homework0.132 ** 12935
Students allowed to ask questions (scale 1 to 3)0.126 ** 12815
**p<1%, small effect size (n effect size negligible, Cohen, 1988)

Liking science scaleLiking science scale
Item Corrected Item-Total Correlation
I feel pleasure completing any science work. 0.441
When I get an interesting question of science, I don't give up till I have solved it. 0.449
I have a natural liking for science. 0.417
I can complete science work with great success as compared to other student of my age. 0.385
I feel proud when I solve a difficult question of science. 0.373
I praise those people a lot who are expert in science. 0.406

Liking science scores broken down by genderLiking science scores broken down by gender
Gender N Mean Std. Dev.
Male 6111 2.641 ** 0.363
Female 5331 2.696 ** 0.322**p<1%, t-test, very small effect size

School variables as correlates of student science School variables as correlates of student science attainmentattainment
Item ScaleCorrelation with science
score
N
Number of library books 4-point 0.125 ** 12618
Usable science laboratory 3-point 0.091 ** 12722
Usable library 3-point 0.083 ** 12735
Usable science laboratory and library 5-point 0.101 ** 12662
**p<1%
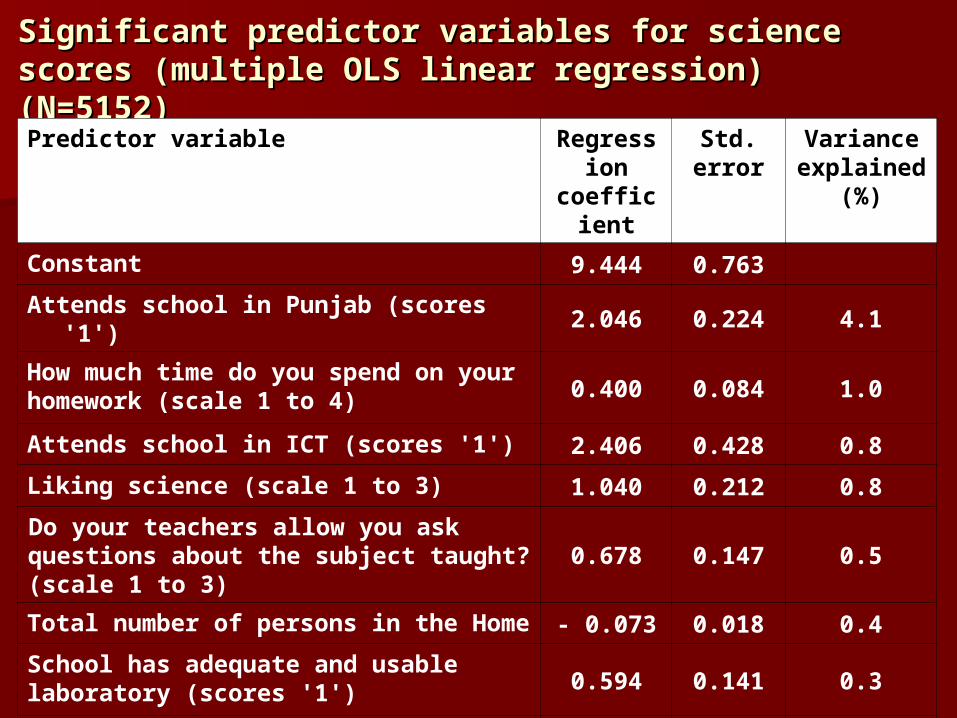
Significant predictor variables for science Significant predictor variables for science scores (multiple OLS linear regression) scores (multiple OLS linear regression) (N=5152)(N=5152)Predictor variable Regression
coefficientStd.
errorVariance explained
(%)
Constant 9.444 0.763
Attends school in Punjab (scores '1') 2.046 0.224 4.1
How much time do you spend on your homework (scale 1 to 4) 0.400 0.084 1.0
Attends school in ICT (scores '1') 2.406 0.428 0.8
Liking science (scale 1 to 3) 1.040 0.212 0.8
Do your teachers allow you ask questions about the subject taught? (scale 1 to 3) 0.678 0.147 0.5
Total number of persons in the Home - 0.073 0.018 0.4
School has adequate and usable laboratory (scores '1') 0.594 0.141 0.3
Attends school in Sindh (scores '1') - 0.944 0.261 0.3

Significant predictor variables for science Significant predictor variables for science scores (multiple OLS linear regression) scores (multiple OLS linear regression) (N=5152)(N=5152)Predictor variable Regression
coefficientStd.
errorVariance explained
(%)
My parents expect me to do well in the science subjects (scale 1 to 3). 0.471 0.135 0.2
Student gender ( from Student Report)Girl '0', boy '1' - 0.408 0.143 0.2
How many times do your teachers check your homework in science (scale 1 to 3) 0.520 0.153 0.2
Home language is Punjabi (scores '1') - 0.851 0.233 0.1
Extra-curricular activities (scale 1 to 3) - 0.443 0.152 0.02
Do you have use of a calculator at home? (scores '1') 0.358 0.140 0.1
Home language is Sindhi (scores '1') - 0.494 0.236 0.1
Student travels to school by car (scores '1') 0.434 0.220 0.0

Variance in science scores across three levelsVariance in science scores across three levels
Variance attributed to Variance Std. error
Students 16.569 0.389
Schools 8.234 0.654
Provinces 1.126 0.667
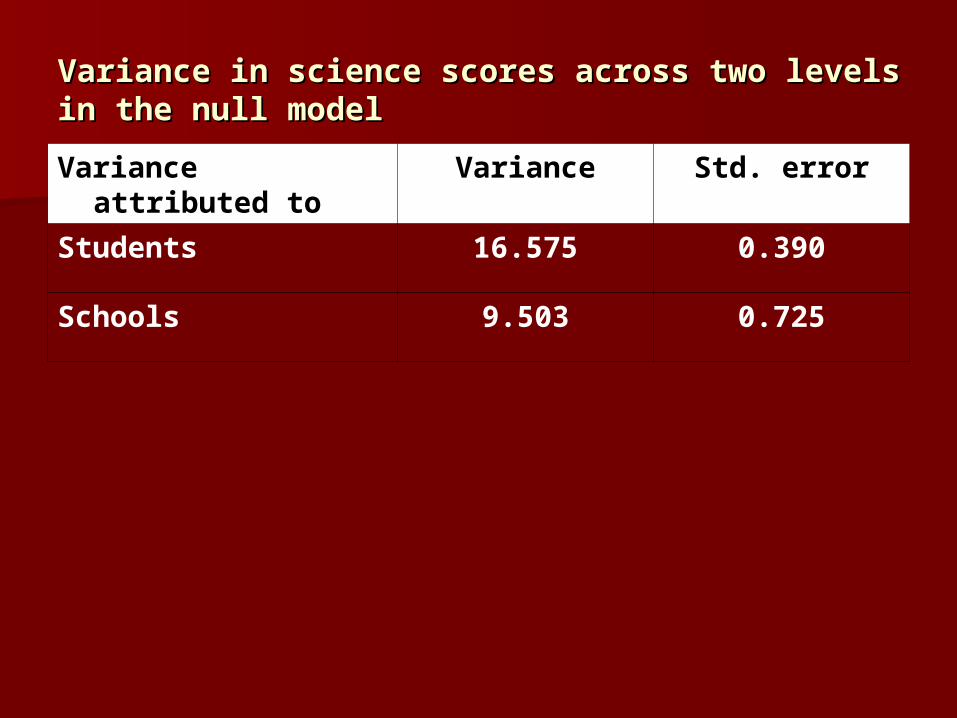
Variance in science scores across two levels in Variance in science scores across two levels in the null modelthe null model
Variance attributed to Variance Std. error
Students 16.575 0.390
Schools 9.503 0.725

Effect of students home language

Science scores broken down by language spoken at Science scores broken down by language spoken at homehome
Which language do you generally speak at home? N Mean SD
Urdu 1939 17.56 5.60
Barahwi 261 15.33 4.74
Balochi 824 15.63 5.02
Punjabi 3138 18.12 5.23
Pashto 2648 16.14 4.91
Sindhi 1171 14.44 5.05
Siraeki 833 17.77 6.06
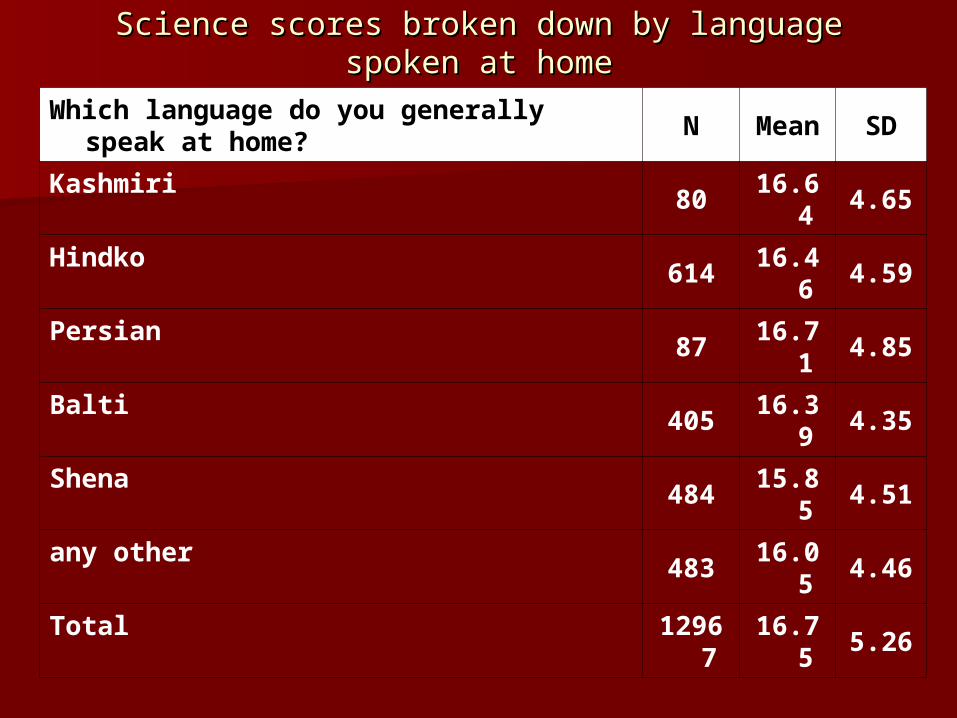
Science scores broken down by language spoken at Science scores broken down by language spoken at homehome
Which language do you generally speak at home? N Mean SD
Kashmiri 80 16.64 4.65
Hindko 614 16.46 4.59
Persian 87 16.71 4.85
Balti 405 16.39 4.35
Shena 484 15.85 4.51
any other 483 16.05 4.46
Total 12967 16.75 5.26

Science scores broken down by medium of Science scores broken down by medium of instructioninstruction
Medium of instruction Mean N Std. Dev.
Urdu 17.06 11091 5.26
Sindhi 14.25 1209 4.96
Pushto 14.68 50 4.20
unknown 12.36 44 4.25
Double 15.72 18 3.59
Total 16.76 12412 5.30

Recent Language PolicyRecent Language Policy
English as a medium of instructions for science and math from grade one
Implications
Language policy is going to affect all other students related variables and hence their attainment in science


