
Expert System to ManageWater Consumption in
Concentrator Plants
J.M. Menacho, S. Correa and W. Cifuentes, De Re Metallica Ingeniería SpA, De Re Metallica Technology SpA, I Congreso Internacional de Conminución de Minerales (Intermet) , Mayo 11 – 13, 2017, Lima, Perú.

Initial Reflexion…
http://www.resourcegovernance.org/blog/will-thirsty-copper-mines-leave-chileans-feeling-parched
A recent report revealed that copper mining inthe northern region of Chile consumes theequivalent of 20 olympic swimming pools perhour. That means 11,203 liters per second… inthe middle of one of the driest deserts on Earth.

Contents
• Frame
• The DRM Water Management Expert System
Thickener Model
Dam Infiltration Model
• The DRM-MetSim Simulator
• Example of Application
• Final Remarks

Water Consumption in theChilean Mining Industry
Camila Montes, Strategic and Public PoliciesAnalyst, Water Use in Copper Mining: Trends of a Critical Input, The Chilean Copper Commision, April 26, 2016.
Fresh Water Consumption Projections:Expected fresh water consumption in coppermining 2015 – 2026 (m3/s)
Seawater accounts 50% of the total for 2026

Camila Montes, Strategic and Public Policies Analyst, Water Use in Copper Mining: Trends of a CriticalInput, The Chilean Copper Commision, April 26, 2016.
Unit consumption per ton of ore processed
Surface Water5.9 m3/s (39%)
Groundwater6.1 m3/s (40%)
Seawater2.4 m3/s (16%)
Water Consumption in theChilean Mining Industry
70%
16%
14%Concentration
Leaching
Others

Water Recycle Efficiency
J. Cantallopts, Consumo de Agua en la Minería del Cobre al 2015, Pub. Cochilco, 16 de junio, 2016.
Recirculation ratein the mining site , %
Recirculation ratein concentrators, %
72.5% 73.2%

Reducing Water Consumption
Cristián Cifuentes, COCHILCO Mining Analyst, Research Department, Key Challenges to EncourageInvestment in Chile,¨Presentation to the European Commission, Lima, Marzo 10 – 11, 2012.
• Managing for sustainability. Maintain constant monitoring and measurementof water flows by processes.
• Reduce fresh water withdrawals regarding total use. New technologies inconsumer savings, greater reuse.
• Develop dynamic water balance simulator for the Concentrator Site aimed toprevent non-compliance of planned consumptions as well as identify andcapitalize water saving opportunities.
• Develop studies and reports that contribute to the design, implementationand monitoring of public policies aimed at sustainable development ofmining.
• Support and encourage the development of new sources of water to supplymining.
• Hydric resource national strategy 2012 – 2025 (under progress).

DRM Dynamic Water Balance Simulator

Simplified diagram for the dynamic water balance at concentrator plants.
Q = Water Flowrate, L/sMS = Solids Flowrate, t/h
Fresh Water
Water O´Flow from theThickeners
Water to Dam
Recycle from the Dam
Q1, MS1
Q2
Q3
Q4, MS4
Q5, MS5
Q6, MS6
Water in the ConcentrateQ7
QP Losses Evaporation
Evaporation
Underground Infiltration
Predictive estimation of thedynamic water balance
Reduce Fresh Water Consumption
Maximize Water Recoveryfrom Tail Thickeners
Optionally, Manage Recycled
Dam WaterEstimate Water
Quality
Dynamic Water BalanceSimulator

Thickening Model®

Continuity equations for the solid and the slurry components are considered asfollows:
V is the volume of the slurry below the clear water in the thickener, Q and C areslurry flowrate and solids concentration, respectively; vS is the slurry meansettling velocity. The system of equations is solved under the following B.C.:
ON ON UF UFd VC
= Q C - Q C anddθ
ON UF
s
dV= Q - Q - S v
dθ
A relationship between slurry hold up and effluent flowrate is also considered. Asresult, the transient mean solids concentration inside the active thickener zone isobtained and also the transient flowrate and concentration of solids in thethickener discharge as well as the size of the active volume.
C = C t -1 for θ = t -1 ; V = V t -1 for θ = t -1 and
V t; C t = C
Q t
DRM Thickening Model®

• The free settling rate of particles is represented by the Stokes law, modified byintroducing the fractal dimension concept to the particle size dependency.
• The hindered settling rate of the slurry is estimated by means of the well-known Richardson and Zaki equation.
• The settling rate model employs an “apparent viscosity” which is function ofthe yield stress assuming the slurry behaves as a Bingham fluid instead of aNewtonian fluid.
• The mean size of the free particles without flocculation is estimated as the d32
volume-area size of the particle size distribution in the thickener feed.
• Another assumption is that solids concentration in the thickener discharge isproportional to the solids concentration inside the active thickener volume.
Richardson J F & Zaki W N. Sedimentation and fluidisation. Part 1. Trans. Inst. Chem. Eng. 32:35-53,1954.Bingham, E.C. (1916). "An Investigation of the Laws of Plastic Flow". US Bureau of Standards Bulletin.13: 309–353.
Stokes, G.G., 1851, On the effect of the internal friction of fluids on the motion of pendulums:Cambridge Philosophical Society, Transactions, v. 9, no. 8, p. 287.
DRM Thickening Model®

• The initial mean particle size dp0 increases up to dp, following an exponentialdependency of the flocculant dosage. Actual floc size and density areconsidered when the Stokes law is applied.
• Value of the yield stress depends mainly on the volume concentration ofsolids in the slurry as suggested by Burger et al. (1999).
• The yield stress value also depends on the particle size distribution accordingto equation proposed by Wellman (1979).
• The yield stress value also depends on the clay composition in the ore feedingthe plant. An empirical equation is employed for this purpose.
• The torque value in the rakes depends mainly on the yield stress and it ismodelled by the Boger approach (1983).
DRM Thickening Model®
Nguyen, Q. D., Boger, D.V. 1983,” The Rheological Properties of Dispersions of Laponite, a Synthetic Hectorite-Like Clay, in Electrolyte Solutions”, Clay Minerals, Vol. 9, pp. 231-243.

Dam Infiltration Model®

Water partially infiltrates down the dam and it may eventually reach the watertable. Seepage is modelled by the Richards equation(2) applied to water movingthrough a variable saturation porous media. In one dimension it is given by
θ h= K h + 1
t z z
Where θ is the saturation in the lower soil, K is its hydraulic conductivity, h is thematrical potential, z is the vertical height coordinate and t is time. B.C. are:
s
0
z=z
s s S
H t + L thθ z z ,0 = θ and K h + 1 = q z ,t = AK t
z L t
KS is the mean saturated value of K in the settled tailings. Note that Infiltrationthrough the dam is modelled with the Darcy law for saturated media. Waterinfiltration into the water table along the time is the final result of the model.
Richards, L.A., 1931. Capillary conduction of liquids in porous mediums. Physics 1, 318–333.
DRM Dam Infiltration Model®

• Relations among k, h and q are needed to know in order to solve the Richardsequation. The van Genuchten model is employed for this purpose.
• Estimates of matrical potential and non-saturated hydraulic conductivitycurves are performed by using the Fredlund approach.
• The Fractal Geometry Model is used to estimate the saturated hydraulicconductivity.
• The bottom of the dam is assumed to be composed by several horizontallayers bearing different saturated hydraulic conductivity. This comes from thesequential deposition and further segregation of the tailings along the time.The effective saturated hydraulic conductivity for layered soils is estimated bythe harmonic mean.
M.Th. van Genuchten (1980). A Closed-Form Equation for Predicting the Hydraulic Conductivity ofUnsatured Soils, Soil Sci. Soc. Am. Journal, 41, pp. 278-285.
M. Rivera y J. Menacho, Un nuevo modelo para estimar la conductividad hidráulica saturada enlixiviación en pilas, III Cong. Lat. Metalurgia, Cusco-Perú, 14-16 Octubre 2009.
MM.D. Fredlund, D.G. Fredlundand G.W. Wilson, Prediction of the Soil-Water Characteristic Curve fromGrain-Size Distribution and Volume-Mass Properties, 3rd Brazilian Symposium on Unsaturated Soils, Riode Janeiro, Brazil, April 22-25 1997, 12 pp.
DRM Dam Infiltration Model®

ii
L t = L t
H t,i iK L
s
H t + L tQ z ,t = AK t
L t
θ h= K h + 1
t z z
PQ t
WQ t
IQ t
W IQ t Q t
RQ t EvQ t
i ii
K t = L t L t K t ; Saturated Zone
Non-Saturated Zone
DRM Dam Infiltration Model®
Napa Subterránea

Water Balance inside theConcentrator: MetSim Split Factor
Model
ALIMENTACIÓN P1
ALIMENTACIÓN P2 MOLIENDA P2
FLOTACIÓN P2
FLOTACIÓN P1
MOLIENDA P2
MOLIENDA P0
FLOTACIÓN P0
ALIMENTACIÓN P0

Main Input/Output DataIndustrial Data (Calibration mode)
Plant ore throughput Plant weight recovery Plant total water consumption Granulometry to flotation Solids % in tail thickener feed Flocculant dosage
Laboratory Data (Predictive mode)
Slurry settling rate Yield stress
Main Responses:
Fresh water consumption Solids percent in the thickener U/F Yield stress in the thickener U/F Torque in rakes of the tail thickeners
DYNAMIC
WATER
BALANCE
SIMULATOR
IMPORTANT!We employed the MetSim platform to program ourown model above-described in APL language. In otherwords, this model is not part of the MetSim library.
Industrial Data (Predictive mode)
Detailed future Mine Plan

Example of Application
A0 70001 t/d 2537.9 m3/h A0
Humedad 0.0210 % 2922 m3/h A1
A1 18562 t/d 6419 m3/h A2
Humedad 0.0210 % 384 m3/h
A2 65000 t/d 27 Pa
Humedad 0.0210 % 2922 m3/h
Flag 2 12800 m3/h
4699 m3/h
57.02% %
6.0 g/L
182.0 um
1142.0 m3/h
Fecha
Tonelaje
A0
t/d
Humedad
A0
%
Tonelaje
A1
t/d
Humedad
A1
%
Tonelaje
A2
t/d
Humedad
A2
%
Agua Rec
Tranque
m3/h
Tamaño
P80 um
Dosis de
Floculante
Relaves
g/t
1 03-03-2016 59485 1.60% 30670 1.60% 79621 1.58% 1156 191.0 6.0
2 04-03-2016 54160 1.64% 29120 1.64% 82945 1.60% 1062 196.0 6.0
3 05-03-2016 58716 1.61% 30675 1.61% 80227 1.58% 1164 208.0 6.0
4 06-03-2016 55546 1.52% 31701 1.52% 81686 1.49% 1053 186.0 6.0
5 07-03-2016 58937 1.71% 21817 1.71% 82260 1.68% 1130 183.0 6.0
6 08-03-2016 40138 1.66% 29204 1.69% 77941 1.66% 1156 200.0 6.0
7 09-03-2016 44102 1.52% 29149 1.52% 48221 1.48% 1089 192.0 6.0
8 10-03-2016 60491 1.61% 31735 1.61% 56894 1.60% 1055 200.0 6.0
9 11-03-2016 59360 1.61% 32575 1.61% 68846 1.58% 1160 195.0 6.0
10 12-03-2016 58065 1.55% 30841 1.55% 78136 1.51% 1113 201.0 6.0
11 13-03-2016 61242 1.51% 32158 1.50% 72849 1.47% 1110 196.0 6.0
12 14-03-2016 62122 1.42% 32501 1.42% 46567 1.38% 1196 186.0 6.0
13 15-03-2016 60659 1.57% 32162 1.57% 48558 1.51% 1021 203.0 6.0
14 16-03-2016 58806 1.58% 25464 1.58% 68804 1.54% 1127 181.0 6.0
15 17-03-2016 58375 1.52% 30761 1.52% 58808 1.48% 1170 181.0 6.0
16 18-03-2016 56307 1.66% 29778 1.66% 72588 1.62% 1092 189.0 5.1
17 19-03-2016 62035 1.67% 30845 1.67% 76587 1.63% 1029 205.0 5.0
18 20-03-2016 58515 1.44% 28580 1.45% 77562 1.41% 1054 180.0 5.0
19 21-03-2016 44050 1.57% 30346 1.57% 78160 1.52% 1068 187.0 5.0
20 22-03-2016 53407 1.61% 29944 1.61% 76842 1.60% 1005 194.0 5.0
21 23-03-2016 60717 1.48% 28914 1.48% 76992 1.45% 1161 188.0 5.0
22 24-03-2016 42973 1.64% 29924 1.63% 73826 1.61% 1133 189.0 5.4
23 25-03-2016 49041 1.58% 32183 1.58% 74411 1.56% 1077 185.0 5.5
24 26-03-2016 57086 1.48% 32133 1.48% 81541 1.45% 1087 183.0 5.5
25 27-03-2016 42410 1.70% 31308 1.68% 77103 1.64% 1165 182.0 5.8
26 28-03-2016 55054 1.53% 30638 1.53% 77040 1.52% 1007 209.0 5.7
27 29-03-2016 34287 1.50% 27102 1.50% 80871 1.45% 1141 183.0 6.0
28 30-03-2016 49721 1.58% 32085 1.59% 65637 1.57% 1043 180.0 5.4
29 31-03-2016 50543 1.37% 32781 1.37% 80841 1.34% 1152 181.0 5.4
30 01-04-2016 37361 1.61% 30489 1.60% 79234 1.58% 1140 204.0 6.1
31 02-04-2016 37129 1.52% 32024 1.52% 81367 1.51% 1191 186.0 6.0
32 03-04-2016 33044 1.61% 30283 1.62% 78875 1.62% 1062 180.0 6.0
33 04-04-2016 38460 1.73% 32693 1.72% 80262 1.72% 1164 182.0 5.7
34 05-04-2016 47403 1.59% 30023 1.60% 79441 1.60% 1053 208.0 5.4
35 06-04-2016 55152 1.67% 27617 1.67% 75605 1.66% 1130 188.0 5.4
36 07-04-2016 49323 1.65% 32825 1.66% 77572 1.63% 1156 194.0 5.3
37 08-04-2016 55579 1.61% 33270 1.61% 79985 1.58% 1089 187.0 6.3
38 09-04-2016 58057 1.57% 30360 1.56% 73702 1.56% 1055 193.0 5.8
39 10-04-2016 55671 1.59% 32850 1.59% 77933 1.55% 1160 187.0 5.2
40 11-04-2016 55976 1.61% 32215 1.61% 83032 1.60% 1113 194.0 5.9
41 12-04-2016 62255 1.68% 33583 1.69% 57559 1.71% 1110 189.0 6.4
42 13-04-2016 56280 1.50% 32396 1.50% 80654 1.50% 1196 198.0 6.5
43 14-04-2016 43206 1.55% 30281 1.55% 81714 1.55% 1021 190.0 5.9
44 15-04-2016 50404 1.70% 27843 1.67% 82078 1.66% 1127 197.0 5.1
45 16-04-2016 56695 1.64% 29389 1.64% 82374 1.61% 1170 195.0 5.1
46 17-04-2016 55760 1.69% 27406 1.69% 81599 1.67% 1092 204.0 5.5
47 18-04-2016 57376 1.63% 31513 1.63% 78280 1.62% 1029 184.0 4.9
48 19-04-2016 59586 1.58% 31439 1.58% 70300 1.57% 1054 187.0 5.1
49 20-04-2016 60628 1.61% 33437 1.62% 79990 1.62% 1068 186.0 5.3
50 21-04-2016 62592 1.56% 33705 1.56% 55020 1.57% 1005 194.0 5.4
51 22-04-2016 63503 1.54% 32456 1.55% 80619 1.53% 1161 186.0 5.5
52 23-04-2016 59885 1.64% 34020 1.64% 79855 1.62% 1133 209.0 5.7
53 24-04-2016 54489 1.60% 34387 1.61% 76697 1.59% 1077 200.0 5.3
54 25-04-2016 59543 1.60% 33673 1.59% 52777 1.54% 1087 182.0 6.1
55 26-04-2016 59669 1.63% 21193 1.62% 76309 1.59% 1165 200.0 6.1
56 27-04-2016 57446 1.73% 18735 1.73% 80020 1.70% 1007 190.0 5.9
57 28-04-2016 64462 1.69% 16657 1.70% 79997 1.65% 1141 189.0 6.0
58 29-04-2016 63338 1.70% 20374 1.71% 78914 1.69% 1043 201.0 5.3
59 30-04-2016 62932 1.52% 20547 1.52% 84150 1.50% 1152 183.0 5.5
60 01-05-2016 70001 2.10% 18562 1.20% 65000 1.50% 1142 182.0 6.0
3269555 1.60% 1783339 1.59% 4473278 1.57% 66269 191 5.7
viernes, 21 de abril de 2017
Split Factor FlotacionDatos enviados/recibidos de Metsim
Make-up agua procesos
Consumo Agua Fresca
Tonelaje por circuito a Modelo
Desde THK Relaves
Desde THK Colectivo
Dosis de Floculante
Tamaño particula en relave
Total
Yield Stress
Consumo Agua Fresca
Consumo Agua Procesos
% Solidos descarga THK Relaves
Datos Programa Produccion
Agua hacia relaves como pulpa
PLANILLA DE CONTROLINGRESO DE DATOS METALURGICOS
Agua recuperada en tranque
Botonera Control
Calcular..
Limpiar Procesos
Reestablecer Metsim
Salir
Fecha
Agua Recup
de THK Relav
m3/h
Agua Recup
de THK
Colectivo
m3/h
Agua de
Procesos
m3/h
Agua
Fresca
m3/h
Yield Stress
Pa
% Solidos U/F
THK
1 03-mar 6997.4 411.5 14043.3 3462.5 27.0 56.98%
2 04-mar 6798.1 397.9 13675.0 3350.8 26.8 56.98%
3 05-mar 6978.8 410.3 14019.2 3461.8 26.8 56.96%
4 06-mar 6929.0 406.3 13939.3 3448.7 26.6 56.95%
5 07-mar 6661.9 392.2 13411.7 3248.5 26.6 56.97%
6 08-mar 5983.4 346.3 12039.4 2753.3 26.7 57.04%
7 09-mar 5116.5 300.4 10161.4 1948.4 27.2 57.15%
8 10-mar 6305.7 373.2 12514.3 2796.9 28.0 57.13%
9 11-mar 6711.6 395.1 13386.0 3164.7 27.9 57.08%
10 12-mar 6896.4 404.8 13821.8 3371.4 27.5 57.03%
11 13-mar 6907.7 407.4 13828.0 3356.4 27.1 57.00%
12 14-mar 6031.8 360.0 11962.0 2578.1 26.9 57.05%
13 15-mar 6025.9 358.6 11941.3 2568.8 27.3 57.09%
14 16-mar 6361.3 375.1 12713.8 2928.9 27.6 57.08%
15 17-mar 6224.6 368.0 12388.3 2773.5 27.5 57.09%
16 18-mar 6574.1 386.0 13144.7 3098.9 27.6 57.07%
17 19-mar 7021.4 413.7 14054.9 3441.6 27.4 57.01%
18 20-mar 6787.1 399.2 13629.4 3312.4 27.0 57.00%
19 21-mar 6224.7 361.4 12514.4 2922.0 26.9 57.04%
20 22-mar 6592.4 385.9 13221.5 3156.3 27.2 57.03%
21 23-mar 6884.4 405.6 13811.6 3370.0 27.1 57.00%
22 24-mar 6003.7 348.7 12049.3 2734.0 26.9 57.06%
23 25-mar 6409.6 373.8 12842.0 3012.3 27.3 57.06%
24 26-mar 7026.4 411.7 14108.1 3496.6 27.3 57.01%
25 27-mar 6156.5 356.9 12362.3 2857.9 27.0 57.05%
26 28-mar 6707.0 393.1 13451.2 3240.8 27.3 57.03%
27 29-mar 5731.6 328.9 11558.6 2597.9 27.1 57.09%
28 30-mar 6130.7 358.6 12233.8 2751.1 27.6 57.11%
29 31-mar 6738.5 392.4 13529.0 3288.9 27.7 57.06%
30 01-abr 5970.5 343.7 12001.7 2739.0 27.4 57.10%
31 02-abr 6108.4 351.1 12281.3 2848.4 27.6 57.11%
32 03-abr 5755.9 329.5 11567.2 2580.3 27.7 57.15%
33 04-abr 6166.0 354.7 12362.9 2857.3 28.0 57.14%
34 05-abr 6425.7 373.1 12883.8 3039.6 27.9 57.11%
35 06-abr 6533.4 382.8 13078.4 3086.0 27.7 57.08%
36 07-abr 6566.1 382.5 13156.9 3132.7 27.5 57.06%
37 08-abr 6954.1 407.1 13944.6 3425.8 27.4 57.02%
38 09-abr 6709.9 394.9 13443.6 3223.3 27.0 57.01%
39 10-abr 6860.1 402.3 13763.1 3359.5 27.0 56.99%
40 11-abr 7022.6 411.5 14117.8 3510.7 26.8 56.96%
41 12-abr 6470.0 384.5 12880.3 2949.6 26.6 56.99%
42 13-abr 6961.4 408.3 13990.0 3458.6 26.9 56.97%
43 14-abr 6305.2 365.6 12701.6 3009.7 26.7 57.01%
44 15-abr 6542.8 381.7 13155.2 3156.5 27.0 57.02%
45 16-abr 6910.1 405.1 13884.1 3417.2 27.0 56.99%
46 17-abr 6748.2 395.7 13564.7 3300.3 26.8 56.99%
47 18-abr 6887.8 404.7 13823.4 3381.8 26.8 56.97%
48 19-abr 6702.7 395.7 13418.8 3203.5 26.7 56.98%
49 20-abr 7180.8 422.7 14415.1 3602.5 26.8 56.94%
50 21-abr 6399.1 380.9 12738.0 2894.4 26.5 56.99%
51 22-abr 7290.9 430.1 14641.5 3687.0 26.8 56.94%
52 23-abr 7162.6 421.7 14386.6 3596.4 26.5 56.92%
53 24-abr 6819.9 400.3 13696.9 3342.5 26.3 56.94%
54 25-abr 6178.2 367.3 12288.6 2725.0 26.4 57.00%
55 26-abr 6463.7 381.2 12980.6 3064.5 26.9 57.02%
56 27-abr 6385.3 375.4 12838.2 3024.3 27.0 57.03%
57 28-abr 6614.3 391.1 13290.5 3180.0 27.2 57.03%
58 29-abr 6689.9 395.2 13431.4 3228.1 27.1 57.02%
59 30-abr 6862.1 404.6 13817.1 3399.7 27.0 56.99%
60 01-may 6418.5 383.6 12799.8 2922.1 26.9 57.02%
PLANILLA CONTROLRESULTADOS
viernes, 21 de abril de 2017
Progreso
Agua Procesos Total
Datos Programa Produccion
Calcular...
Volver

The DRM Water Management Simulator®
Experimental data
Simulatedresults
Real and Simulated solid percent in the tailing thickener U/F
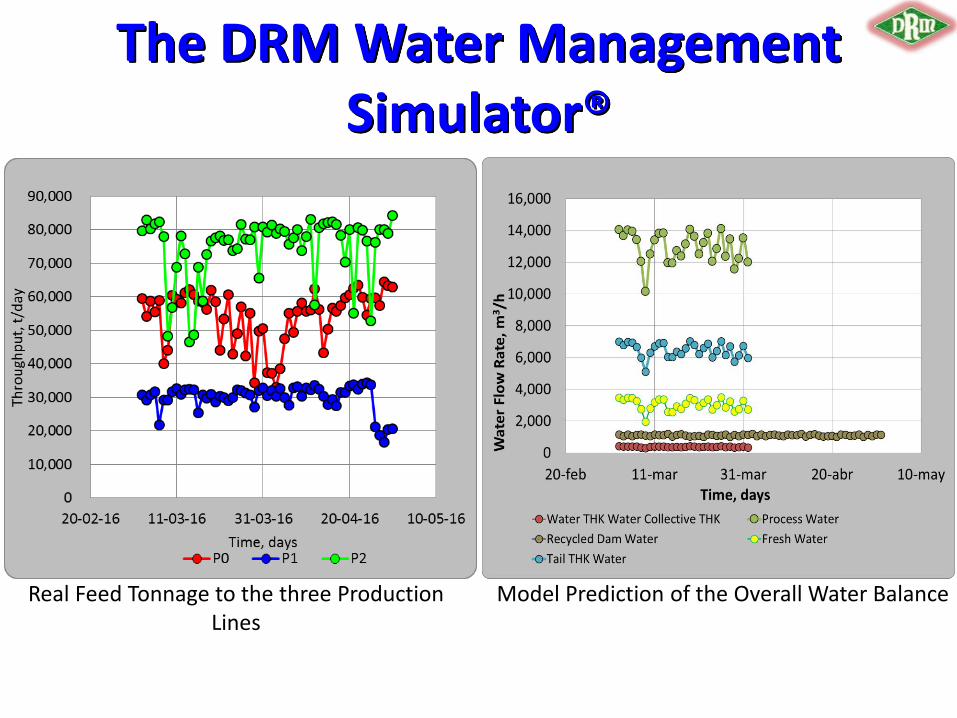
Model Prediction of the Overall Water BalanceReal Feed Tonnage to the three ProductionLines
The DRM Water Management Simulator®

Model estimate of the Rake Torque in theTailing Thickeners
Model Prediction of the Yield Stress in theThickeners U/F
The DRM Water Management Simulator®

If the thickener feed gets finer, the settling rate reduces and less water is recycledback to the Concentrator. If all other remain the same, the solid % in the thickenerU/F will not change but… less water is now recovered from the thickeners.
Dynamic Tailing Thickener Simulation: Finer Feed Disturbance and Thickener Response
Same U/F Solid Concentration
Disturbance
The U/F is Diluted for a While
Warning
The DRM Water Management Simulator®

Final Remarks• A new expert system to manage water consumption in concentrator plants
has been presented.
• The DRM Water Management Expert System contains a dynamic model of thetailing thickening able to simulate not only the current situation but alsooptional scenarios to minimise the overall Concentrator water consumption.
• The DRM Water Management Expert System has optionally a dynamic modelfor the seepage of water down the Dam and its possible infiltration into theWater Table. Short and long term situations can be easily simulated foroptimal management of the water consumption in the Concentrator.
• The dynamic model was programed in APL language over the MetSimplatform, properly connected to an Excel interface to facilitate I/O tasks.
• The practical use of the Water Management Expert System is illustrated bysimulating typical “fines disturbance” impacting more than 10% the waterrecovery from the tailing thickeners.
• A commercial computer code designed for Operational Optimization andPlanning Tasks is available. Related services from DRM are also available.


