
Experimental thinkaloud protocols: a new method for
evaluating the validity of survey questions
Patrick Sturgis
National Centre for Research Methods (NCRM)
and
University of Southampton
Paper presented at the New Measurement Issues in Survey Research meeting of the Survey Resources Network, 21 September 2010

Do different questions measure the same thing?
Many important concepts are measured by different ‘standard’ questions in surveys: Social/political trust General health Life happiness/satisfaction Fear of crime/confidence in police
How to tell if they are ‘equivalent’? How to tell which is the ‘best’ measure?

Validity assessment strategies
Face/process validity Correlation with criterion variables Multi-trait-multi-method (MTMM) Expert panels Behaviour coding Interviewer debrief Thinkaloud protocols/cognitive interview
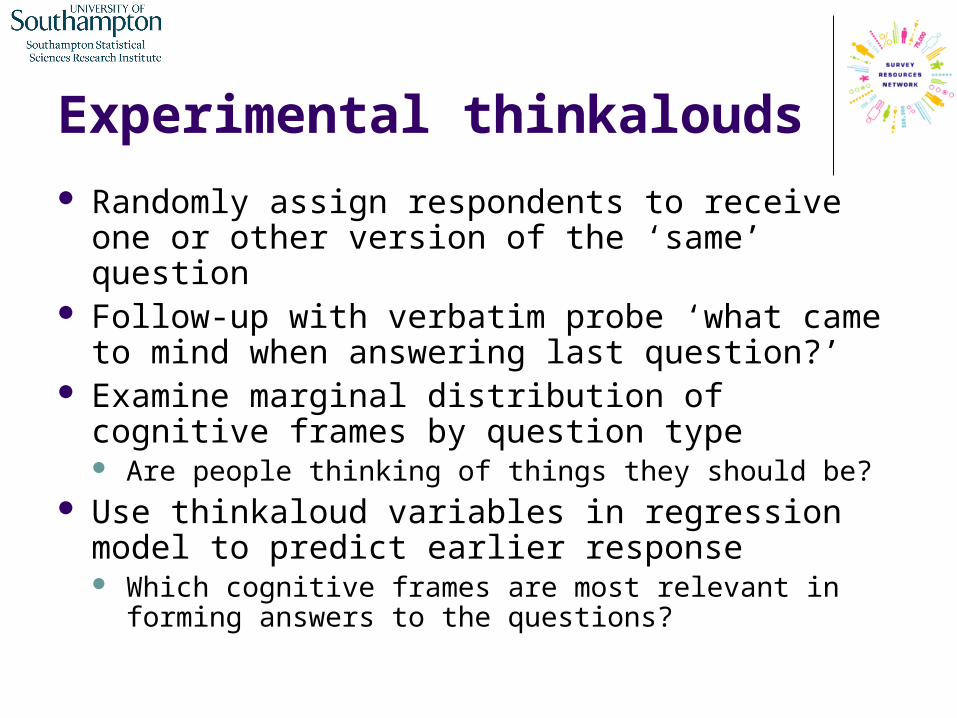
Experimental thinkalouds
Randomly assign respondents to receive one or other version of the ‘same’ question
Follow-up with verbatim probe ‘what came to mind when answering last question?’
Examine marginal distribution of cognitive frames by question type Are people thinking of things they should be?
Use thinkaloud variables in regression model to predict earlier response Which cognitive frames are most relevant in forming
answers to the questions?

Example 1 - Trust

Conceptions of Trust
Trust is a ‘good thing’ Trusting citizens are good citizens (voting,
volunteering, civic engagement) Trusting societies are good societies (more
democratic, egalitarian, > economic performance)
Trust ‘lubricates’ social and economic transactions
Reduces ‘monitoring costs’ and the need for contracts etc.

The standard trust question Generally speaking, would you say that most
people can be trusted, or that you can't be too careful in dealing with people? Most people can be trusted Can’t be too careful
Usually credited to Rosenberg (1959), the ‘Rosenberg Generalized Trust’ (RGT) item
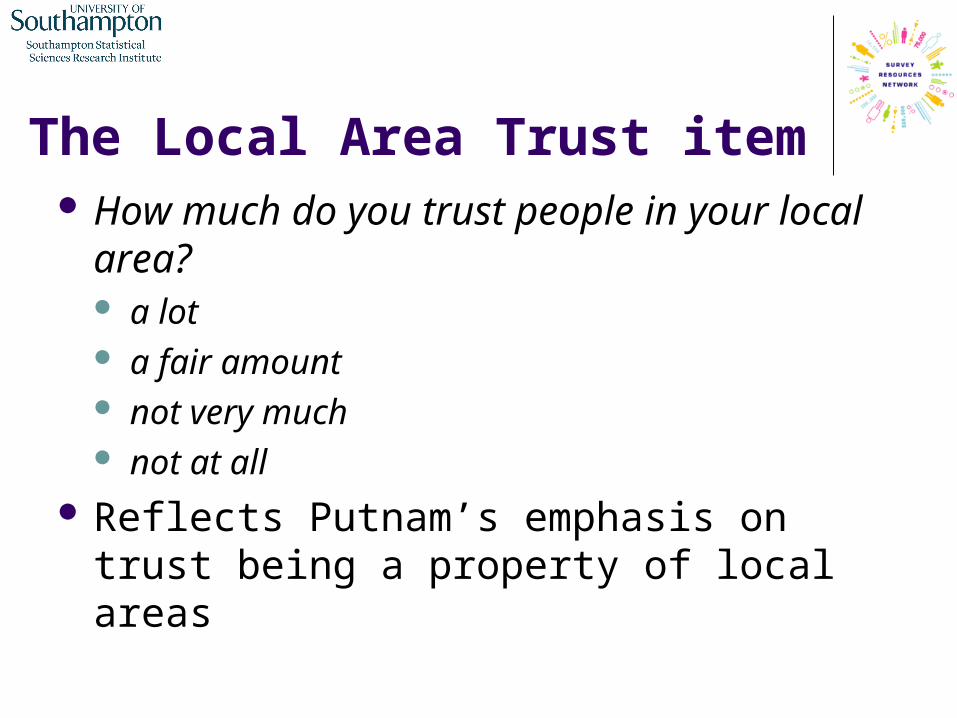
The Local Area Trust item How much do you trust people in your local
area? a lot a fair amount not very much not at all
Reflects Putnam’s emphasis on trust being a property of local areas

Trust by Question type These items are both used more or less
interchangeably as measures of generalized trust Yet, they yield very different estimates of trust at the
national level. e.g.: Social Capital Community Benchmark survey: 47% most
people can be trusted; 83% trust people in local area ‘some’ or ‘a lot’
UK Taking Part survey: 44% most people can be trusted; 74% trust ‘many’ or ‘some’ of the people in their local area
Why such a large discrepancy in generalized trust (trust in strangers)?
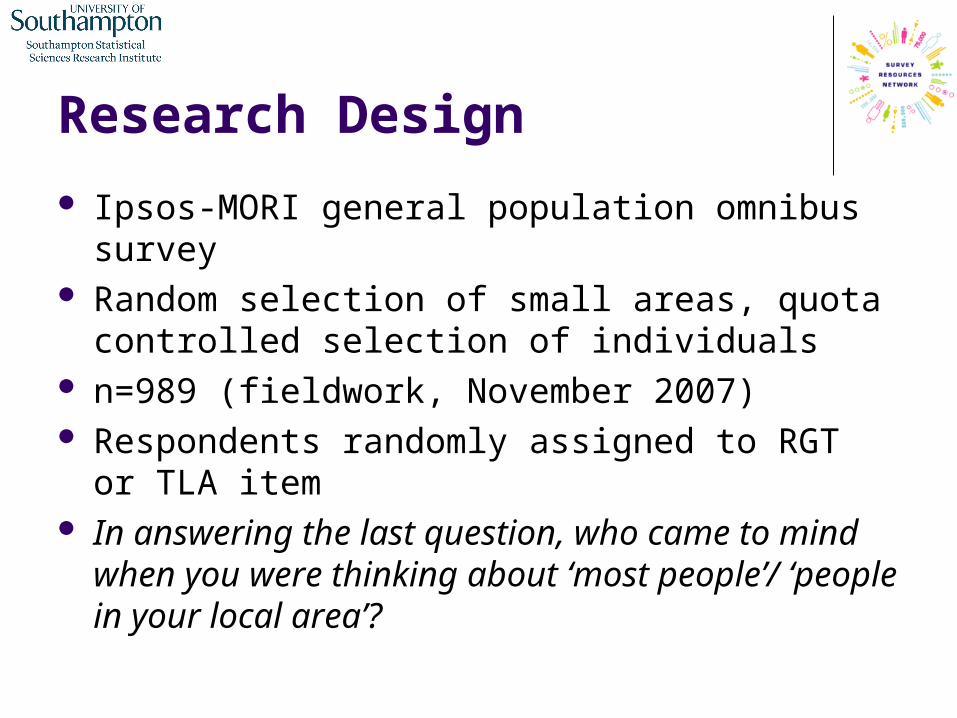
Research Design
Ipsos-MORI general population omnibus survey Random selection of small areas, quota controlled
selection of individuals n=989 (fieldwork, November 2007) Respondents randomly assigned to RGT or TLA
item In answering the last question, who came to mind
when you were thinking about ‘most people’/ ‘people in your local area’?

Distributions for trust questions
RGT item (n=508) TLA item (n=481)
Most people can be trusted 48% (229) A lot 20% (100)
Can’t be too careful 52% (252) A fair amount 60% (302)
Not very much 17% (88)
Not at all 3% (17)

Primary Codes Higher Order Codes % mentioned 1. colleagues/ ex-colleagues 2. family/ family member 3. friends Known others 42% 4. most people I know/ meet 5. neighbours 6. people from my church 7. anyone/ all people 8. everyone/ everybody 9. foreigners/ ethnic minorities 10. general public/ people in general Unknown others 22% 11. children/ young people 12. no-one in particular 13. strangers 14. people in this town/ village Local community 5% 15. doctors 16.officials/ authority figures/professionals
17. police Named job/ profession 10% 18. politicians/political parties 19. salesmen/ sales people 20. tradesmen 21. don't know these days 22. identity theft 23. you have to place trust in people 24. people interested in themselves Other (not relevant) 13% 25. people mostly trustworthy 26. trust people until they upset me 27. trusting is naïve 28. other answers 29. don't know/not stated Don’t know/ no answer 22%

Who comes to mind by RGT
0%
10%
20%
30%
40%
50%
60%
70%
80%
known others unknown others namedjob/profession
people in localarea
other don't know/notstated
code
% m
en
tio
ne
d
most people can be trusted
can't be too careful

Who comes to mind by TLA
0%
10%
20%
30%
40%
50%
60%
70%
80%
known others unknown others namedjob/profession
people in localarea
other don't know/notstated
code
% m
en
tio
ne
d
a lot
a fair amount
not at all/not very much

Who came to mind – both questions
0%
10%
20%
30%
40%
50%
60%
known others unknown others namedjob/profession
people in local area other don't know/notstated
code
% m
enti
on
ed
RGT
TLA

Explanatory Models 1 RGT Item – Binary Logit Model Model 1a Model 2a
Covariates Logit (S.E.) O.R
. Logit (S.E.) O.R. Age (years) 0.028 (0.036) 1.03 0.013 (0.038) 1.01 Sex (male=1) 0.057 (0.197) 1.06 0.091 (0.207) 1.09 social class (ABC1=1) 0.817 (0.213)*** 2.26 0.949 (0.227)*** 2.58 longstanding illness (yes = 1) 0.355 (0.335) 1.43 0.462 (0.349) 1.59 Highest qualification (ref=no qualifications) Degree 0.944 (0.337)** 2.60 1.029 (0.354)** 2.80 GSCE or above 0.108 (0.261) 1.11 0.142 (0.276) 1.15 Marital status (ref = single, never married) Divorced 0.236 (0.454) 1.27 0.508 (0.476) 1.66 Married 0.176 (0.274) 1.19 0.413 (0.291) 1.51 Widow -0.124 (0.516) 0.88 0.272 (0.540) 1.31 Who came to mind? (ref=2. unknown others) 1. known others - - 1.535 (0.267)*** 4.64 3. people in local area - - 1.885 (0.763)** 6.60 4. named job/ profession - - -0.255 (0.373) 0.78 5. other (not relevant) - - 0.257 (0.328) 1.29 6. non-one/ don't know/ not stated - - 1.043 (0.280)*** 2.84 Constant -1.178 (0.345) 0.31 -2.161 (0.410) 0.12

Explanatory Models 2 TLA Item – Ordered Logit Model Model 1b Model 2b
Covariates Logit (S.E.) O.R
. Logit (S.E.) O.R. Age (years) 0.097 (0.034)** 1.10 0.076 (0.034)* 1.08 Sex (male=1) -0.393 (0.186)** 0.68 -0.255 (0.190) 0.77 social class (ABC1=1) 0.751 (0.204)*** 2.12 0.771 (0.207)*** 2.16 longstanding illness (yes = 1) 0.230 (0.293) 1.26 0.297 (0.297) 1.35 Highest qualification (ref=no qualifications) Degree 0.605 (0.312)* 1.83 0.425 (0.320) 1.53 GSCE or above 0.218 (0.255) 1.24 0.075 (0.258) 1.08 Marital status (ref = single, never married) Divorced -0.247 (0.409) 0.78 -0.206 (0.418) 0.81 Married 0.323 (0.249) 1.38 0.275 (0.253) 1.32 Widow 0.516 (0.440) 1.68 0.447 (0.448) 1.56 Who came to mind? (ref=2. unknown others) 1. known others - 1.559 (0.305)*** 4.75 3. people in local area - 0.953 (0.408)* 2.59 4. named job/ profession - 0.087 (0.305) 1.09 5. other (not relevant) - 0.383 (0.356) 1.47 6. non-one/ don't know/ not stated - 0.579 (0.346) 1.78 Constant - - - -

The science of well-being
“Now is the time for every government to collect data on a uniform basis on the happiness of its population…every survey of individuals should automatically measure their well-being, so that in time we can really say what matters to people and by how much. When we do, it will produce very different priorities for our society. ” Layard 2010, Science.

Survey measures of subjective well-being
Tend to ask about ‘happiness’ or ‘satisfaction’ with life
And treat these as if they are measuring the same concept

Happiness = Satisfaction?
Yes – time-series models show same pattern of effects (Blanchlower and Oswald, 2002)
No – happiness and satisfaction correlated but not equivalent in European Values Survey (Gundelach and Kreiner 2004)

Mode effects
Widely different estimates of well-being across different surveys
Could mode be an explanatory factor? Being unhappy with your life is not socially
desirable (people may over-state happiness to an interviewer)
Conti and Pudney (2008) find higher ratings of satisfaction in interviewer relative to self-administered questions
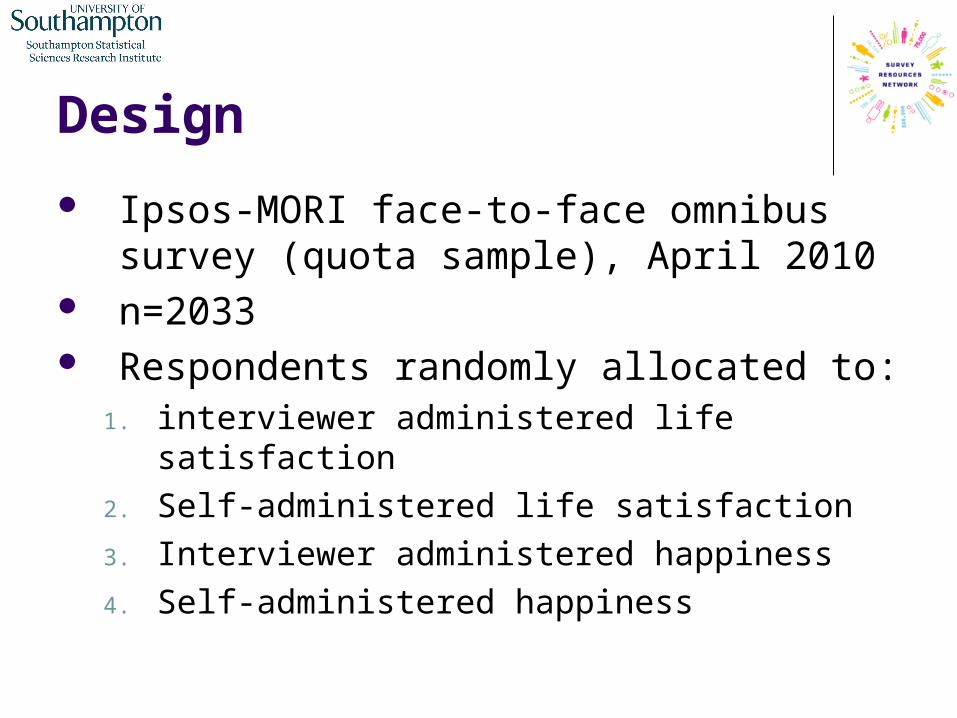
Design
Ipsos-MORI face-to-face omnibus survey (quota sample), April 2010
n=2033 Respondents randomly allocated to:
1. interviewer administered life satisfaction
2. Self-administered life satisfaction
3. Interviewer administered happiness
4. Self-administered happiness

Questions (from European Social Survey)
All things considered, how happy would you say you are? Please answer using the scale on the card where 1 means ‘extremely unhappy’ and 10 means ‘extremely happy’.
1. Extremely unhappy..10. Extremely happy
All things considered, how satisfied are you with your life as a whole nowadays? Please answer using the scale on the card where 1 means ‘extremely dissatisfied’ and 10 means ‘extremely satisfied
1. Extremely dissatisfied..10. Extremely satisfied

Verbatims
Now, thinking about your answer to the last question, please tell me what came to mind when thinking about your answer. There are no right or wrong answers; I just want you to tell me everything that came to mind in thinking about how happy you are. What else?
PROBE FULLY

Results 1 satisfaction = happiness?

Raw distributions for happiness and satisfaction
Mean=7.38 Mean=7.39
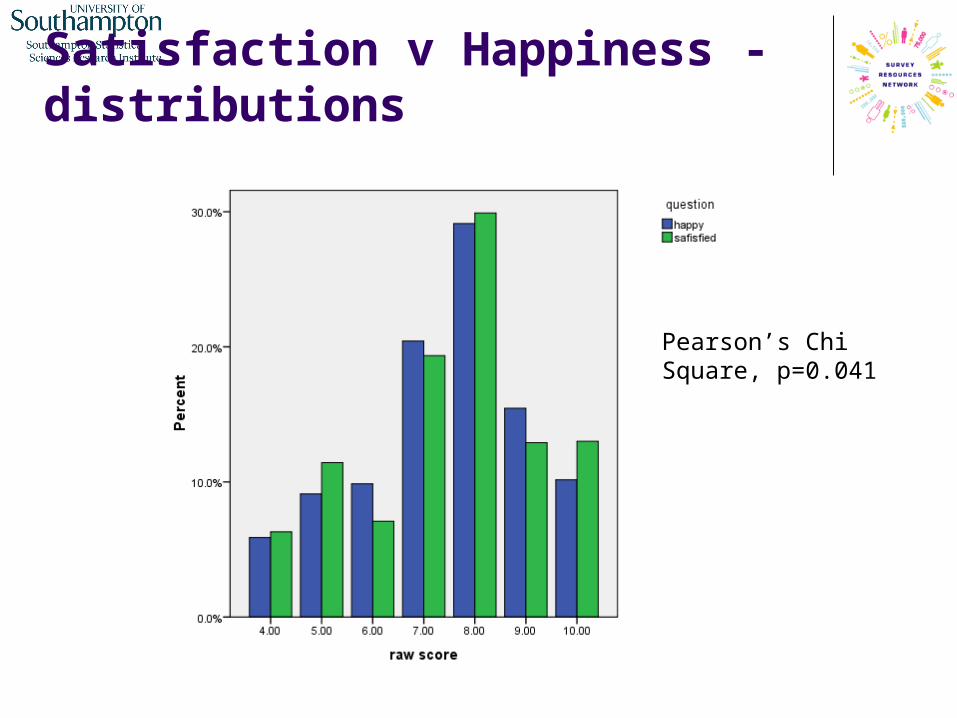
Satisfaction v Happiness - distributions
Pearson’s Chi Square, p=0.041
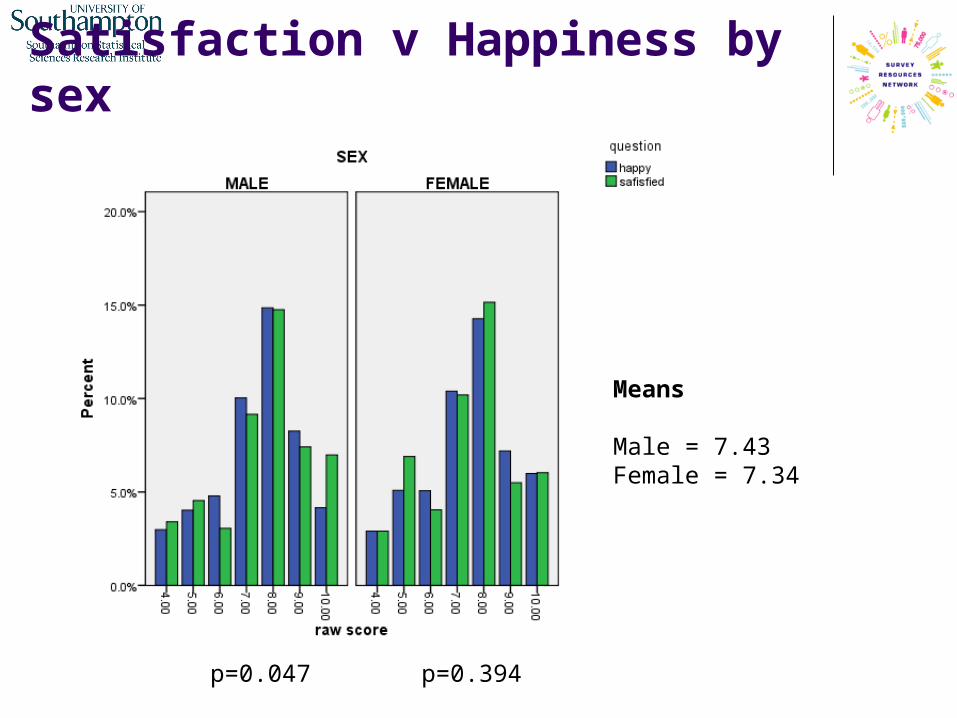
Satisfaction v Happiness by sex
p=0.394p=0.047
Means
Male = 7.43Female = 7.34
Results 2 mode effects

Mode effect by question - means
Question CAPI (s.e.) CASI (s.e.) Happiness 7.45 (.077) 7.32 (.081) Satisfaction 7.29 (.081) 7.49 (.085)*

Mode effect by question - distributions
p=0.015p=0.209

Question*mode*sex - means
Question CAPI (s.e.) CASI (s.e.) men Happiness 7.40 (.105) 7.36 (.118) Satisfaction 7.46 (.118) 7.52 (.127) women Happiness 7.50 (.111) 7.28 (.112) Satisfaction 7.12 (.118) 7.48 (.127)**

Question*mode*sex - distributions
p=0.018
p=0.145p=0.037
p=0.053

Prediction model
happiness s.e. satisfaction s.e. (Constant) 6.154 .351 6.385 .352
sex (male) -.012 .137 .292 .137
age (years) .016 .004 .006 .004
social grade (AB) .062 .187 .337 .188
social grade (CD) -.050 .179 .217 .175
net income (banded) .131 .058 .206 .055
parent(yes) -.049 .156 -.070 .158
highest qual (degree) .201 .171 -.263 .169
no qualifications -.169 .217 .052 .212
mode (CASI) -.060 .134 -.280 .134
n 643.000 645.000 R2 .053 .052

Verbatim responses

Verbatim responses Verbatim responses coded to a descriptive
frame with 111 codes
These were then allocated to one of 14 thematic codes

Thematic Codes
1. work/job/education 2. family/friends/pets 3. emotions/feelings/outlook 4. ageing 5. house/home/area 6. financial/material possessions 7. social life/hobby 8. freedom/independence 9. events/temporary 10. health (self) 11. health (other) 12. political/environmental concerns 13. neutral/in the middle 14. other/idiosyncratic

Significant differences in thematic codes across questions
0.0
5.0
10.0
15.0
20.0
25.0
work/job/education economy/financial/material events/temporary political/environmental
thematic code
% r
ep
ort
ing
co
de
happiness
satisfaction
Conclusions
great deal of heterogeneity in the frames of reference people use in answering trust questions
Acquaintances more trusted than strangers Problematic to assume these questions
measure generalized trust Local area question should not be used
interchangeably with standard trust item


