
2-1
● Project Site
Indonesia
Ex-Post Evaluation of ODA Loan Project “Multipurpose Dam Hydroelectric
Power Plants Project”
External Evaluator:Masami Sugimoto
(SHINKO Overseas Management Consulting, Inc.)
Field Survey: Feb. 2009 - Jun. 2009
1.Project Profile and Japanese ODA Loan
1.1 Background
This Project is to construct three hydroelectric power plants to cope with the
growing electricity demand in corresponding power supply areas. The Project is
implemented as a part of the master projects whose major components are multi-
purpose dams to supply multiple public services comprising domestic and indus-
trial clean water supply and irrigation in surrounding areas of the cities of Sura-
baya (East Java Province), Bandar Lampung (Lampung Province) and Makassar
(South Sulawesi Province). The Project was formulated under the PT. PLN
(Persero), a state-owned power company of Indonesia, combining the power plants
portion of the multipurpose dam and their supporting projects under the Ministry
of Public Works. The 6th Five-year National Development Plan under which the
Project was formulated aimed at power development utilizing potential hydro-
power resources coupled with construction of coal-fired thermal power plants to
supply base-load electricity demand.
Map of Project Area Distant view of Wonorejo Hydroelectric
Power Plant
Jakarta Makassar
● Project Site

2-2
1.2 Objective
The objective of this project is to construct 6.2MW (Java Bali System), 28MW
(Wilayah IV <Lampung>) and 17.2MW (Wilayah VIII <South Sulawesi>) hy-
droelectric power plants aiming to meet growing electricity demand in each region,
and thereby contributing to the regions’ economic development and improvement
of the people’s standard of living.
1.3 Borrower/Executing Agency:Government of Indonesia/Directorate
General of Water Resources, The Ministry of Public Works
1.4 Outline of the Loan Agreement
Approved Amount/Disbursed
Amount 6,291million yen/4,044 million yen
End Notes Exchange Date/Loan
Agreement Signing Date December 1996 / December 1996
Terms and Conditions
Interest Rate: 2.7%(Consulting
Service 2.3%)
Repayment Period: 30 years
Grace Period: 10 years
Procurement: General Untied
Final Disbursement Date March 2007
Main Contractor
(over 1 billion yen)
Sumitomo Corporation (Japan)
Main Consultant
(over 100 million yen)
PT. Kwarsa Hexagon (Indonesia)
CTI Engineering, Co. Ltd. (Japan),
Electric Power Development Co.,
Ltd (Japan)
Feasibility Studies, etc. Brantas River Basin Development
Master Plan, OCTA, 1973 (Won-
orejo Dam)
Engineering Service (E/S) for Won-
orejo Dam, 1991
Feasibility Study (F/S) for Bili-Bili
Dam, 1982
Engineering Service (E/S) for
Bili-Bili Dam, 1988

2-3
Related Projects Wonorejo Multipurpose Dam Con-
struction Project
Way Sekampung Irrigation Project
(I) (II) (III)
Bili-Bili Dam Project
Bili-Bili Irrigation Project
2.Evaluation Results (Rating: A)
2.1 Relevance (Rating: a)
2.1.1 Relevance at Appraisal
The 6th Five Year National Development Plan (REPELITA VI, 1994~1998)
aimed at improving power supply reliability and power development in line with
the policy to get rid of the oil dependency based on regional resource endowment
throughout the country. Volume of power consumption was growing with the an-
nual rate of far more than 10%, and it was an urgent issue to develop potential hy-
dropower resources coupled with construction of coal-fired thermal power plants
to supply base-load electricity demand. It also urged restructuring of the power
sector including private sector participation and organizational changes to achieve
improved efficiency in power supply.
The following table articulately indicates the critical conditions of power supply
against demand under such circumstances stated above.
Table 1: Power Supply-Demand Conditions in Indonesia
(Unit: Peak Load <MW>, Installed Capacity <MW>)
PLN Supply Area 1993 1994 1995 1996 1997 1998
Peak Load 5,756 7,093 8,273 9,645 11,285 13,203Jawa
-Bali Existing Capac-ity Installed 6,223 6,223 6,118 5,898 5,578 5,538
Peak Load 301 343 374 416 483 561IV Existing Capac-
ity Installed 571 566 565 545 538 511
Peak Load 176 194 215 239 286 342VIII Existing Capac-
ity Installed 349 348 347 319 300 296
Source: Appraisal Documents
Note: At the time of Appraisal in 1996, power supply areas of PLN were Jawa-Bali for Wonorejo, Area IV
for Batutegi and Area VIII for Bili-Bili respectively. The PLN supply areas have been rearranged into

2-4
Wilayah (regional offices) which covers each responsible area assigned. (Cf. Table 2)
2.1.2 Relevance at Ex-Post Evaluation
The “Medium-Term National Development Plan (Rencana Pembangunan Jangka
Menengah Nasional: RPJM-N) <2004-2009>”, which announces the necessity of
the development of the power sector for overall national development, puts con-
tinued emphasis on the development of alternative power resources including hy-
dropower aiming for alleviating the dependency on oil as a main energy source.
The growth of power demand has been also remarkable. The high rate of growth at
10% per annum in 1997 was once suspended by the economic crisis experienced in
the same year, however, constant consumption with annual rate of 7.6% has been
continuing afterwards. From the aspect of the diversification of power sources
under the policy to alleviate oil dependency, hydroelectric power generation util-
izing potential hydraulic resources is strengthened coupled with extended conver-
sion to coal-fired thermal power generation for meeting base-load power demand.
They occupy 39% and 11% respectively in total installed capacity, which turned to
exceed the oil and gas fired generation that occupy 46%1. The potential capacity of
hydroelectric power generation throughout Indonesia was estimated to be about
75,000MW (“Hydroelectric Power Potentiality Study,” 1982), however, the total
power volume developed up to the year 2008 amounts to 4,125MW, only 5.5% of
the total potential.
PLN nominates areas whose peak-load demand can not be met with installed
capacity of power generation as “Daerah Krisis (Critical Area),” and prioritize
their power development in the Long-Term Power Development Plan (PUPTL,
2009~2018). South Sumatra (Batutegi) and South Sulawesi (Bili-Bili) are two of
the 10 Critical Areas.
The power supply-demand conditions in respective supply areas of the three
power stations2 are critical. PUPTL forecasts 2 to 3-time increase in power de-
mand represented by peak load in coming 10 years. To cope with this expanding
power demand, estimated construction of needed power plants amounts to 57,442
MW (PLN, IPP inclusive) during the same period, among which hydroelectric
power plant should occupy 4,740 MW, 3.8% of the capacity totally required (3,835,
10.9% for PLN only).The next table shows forecasted power demand of three re-
gions to which the power stations of this Project belong.
1 Geothermal 4%. All the figures are taken from RUPTL 2 At the time of Ex-Post Evaluation, Batutegi and Bili-Bili Powaer Plants are connected to the power grids
of Sumatra and Sulawesi. Whereas, Wonorejo Power Plant which belongs to the Jawa-Bali System supplies electricity to a part of District Tulungagung District (Kabupaten) through Tulungagung Sub-station.

2-5
Table 2:Forecasted Power Demand and Peak Load in Three Supply Regions
Power Demand (MWh) Peak load (MW)
Power
Plant
Supply Area
(Wilayah) 2008 2018
(Note)
In-
crease
(%)
2008 2018
(Note)
In-
crease
(%)
Won-
orejo East Java 22,219 48,623 119 3,681 7,842 113
Batutegi Lampung 1,985 5,027 153 420 963 129
Bili-Bili South/ Cen-
tral Sulawesi 3,292 9,834 199 592 1,744 195
Source:RUPTL, 2009-2018
Note):East Java show 2007 figures
Table 3:Total Necessary Capacity during 2008~18
(Unit: MW)
Source:RUPTL, 2009-2018
This project has been highly relevant with Indonesia’s national policies and de-
velopment needs at the times of both appraisal and ex-post evaluation.
2.2 Efficiency (Rating: b)
2.2.1 Output
The Project is to construct the hydroelectric power plants portion of the multi-
purpose dams implemented under a yen loan (Wonorejo in East Java, Batutregi in
South Sumatra and Bili-Bili in South Sulawesi), and consists of equipment pro-
curement for power plants and related transmission and sub-station facilities, civil
works and consulting services (only for Bili-Bili Power Station). Actual output has
no significant difference from the original plan except the following items.
Jawa-Bali Sumatra Sulawesi
PLN 27,042 3,668 1,754
(Hydroelectric Power) 2,984 262 505
IPP 13,910 5,477 1,488
(Hydroelectric Power) 140 631 257
Total 40,952 9,145 3,242
(Hydroelectric Power) 3,142 893 762

2-6
(Major points of difference)
1. Substation Facilities of Batutegi
The originally designed transformer of the Batutegi Substation was 17,250kVA
x 1 unit, but it was expanded up to 17.86MVA x 2 sets, 35.72MVA in total, to
strengthen the system reliability.
2. Power plant and transmission facilities of Bili-Bili
Bili-Bili Power Plant additionally procured chromium-coated spare parts (about
300 million yen) in preparation to a possible damage on the turbine by impure
water contaminated with earth and sand from the dam reservoir caused by the the
large-scale landslide of Mt. Bawakaraeng upstream. Additionally, 2-kilometer
double-circuit transmission lines connecting to the Rindam- Malino distribution
lines were constructed to the upstream direction in addition to the 15-kilometer
double circuit transmission lines (20kV) from the power plant to Borongloe in or-
der to strengthen the system.
3. Consulting services for Bili-Bili
Bili-Bili Power Plant made a consulting contract with reduced man-month
volume at 103.00 M/M for international consultants and 216.50 M/M for domestic
consultants. Although the actual volume of man-month input turned out to increase
up to 114.43 M/M due to the extension of the implementation period, the volume
of the domestic consultants portion was saved up to 202.51 M/M partly replacing
them with PLN engineers.
2.2.2 Project Period
Under the initial plan, the project period was from December 1996 to August
2003 (81 months), but the actual project period was from December 1996 to March
2007 (124 months) including 15-month extension of the loan disbursement period,
which turned out 53.1% longer than planned. Major reasons of the implementation
delay include (1) two-year delay in commencement of the consulting services due
to the procedural delay affected by the economic crisis that attacked Indonesia in
1997 and succeeding political and administrative confusion, (2) one-year delay
caused by prolonged contract negotiation with the second lowest bidder after ter-
minating the negotiation with the lowest in the equipment procurement and (3)
required additional one and a half years for additional procurement of coated spare
parts (spray micronized chrome particles with high velocity oxygen-fuel thermal
process) in preparation to a possible damage on the turbine runner portion of the
generator by contaminated water from the dam reservoir caused by the inflow of

2-7
earth and sands from the large-scale landslide of Mt. Bawakaraeng upstream.
2.2.3 Project Cost
Planned project cost was 8,388 million yen (of which Japanese ODA loan was
6,291 million yen), and the total project cost at the time of ex-post evaluation was
4,922 million yen (of which Japanese ODA loan was 4,044 million yen), 41.3%
smaller than planned. In spite of almost the same output performance compared to
the original plan, the total project cost was much saved within plan. It is mainly
due to the significant depreciation of Rupiah currency brought by the Asian cur-
rency crisis started in 1997, and transfer of a part of the Project to the Way
Sekampung Irrigation Project which is funded under the budget of the Ministry of
Public Works.
Although the project cost was held within the initial plan, the project period
considerably exceeded the plan; therefore the evaluation for efficiency of this
project is moderate.
2.3 Effectiveness (Rating: a)
2.3.1 Effectiveness Measurement with Operation and Effect Indicators
The following table summarizes the annual trend of the operation and effect in-
dicators of the actual performance.
Table 4:Annual Trend of Performance in Operation & Effect Indicators
No Indicators Unit 2002 2003 2004 2005 2006 2007 2008
Operation Indicators
1 Unplanned Out-age Hours
Wonorejo hours/year 17.4 3.67 2.26 0.56 0.39 0 0
Batutegi hours/year 31.0 138.6 175.3 186.5 7.3 43.2 168.4
Batutegi Hydroelectric Power Plant
The Ex-Post Evaluation Team is having a
joint meeting with PLN officials for col-
lective discussion on the Project perform-
ance.
2-8
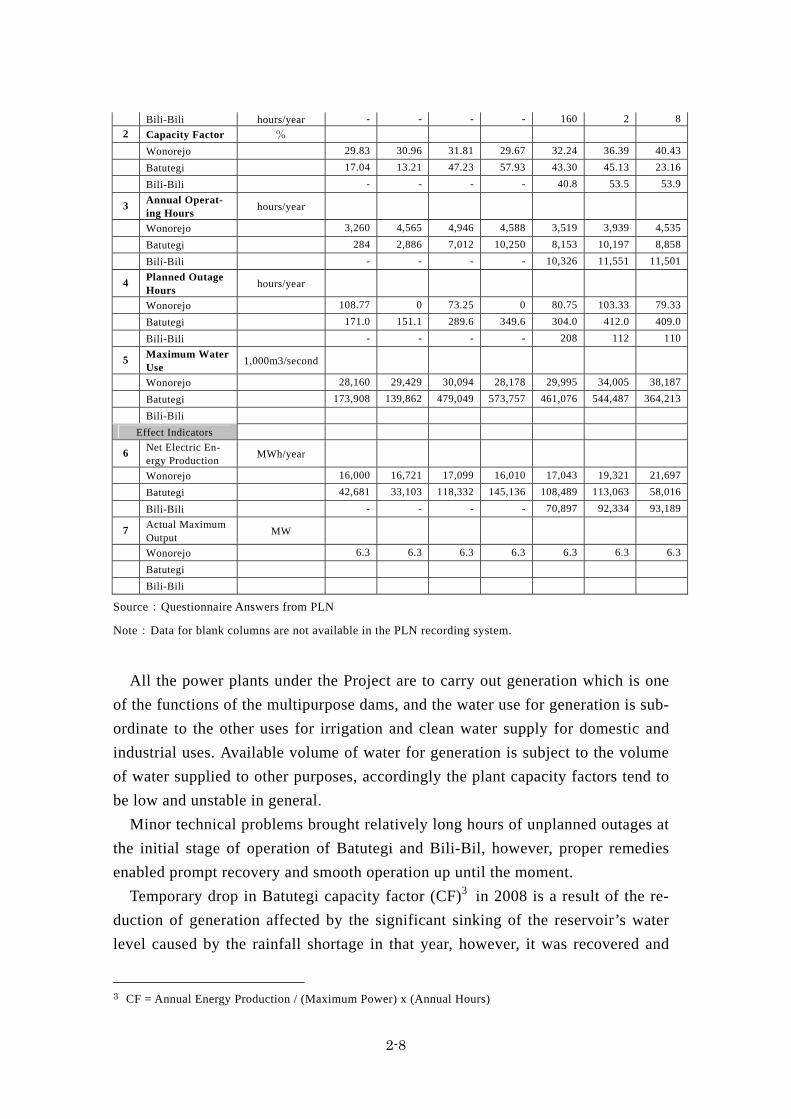
Bili-Bili hours/year - - - - 160 2 8
2 Capacity Factor %
Wonorejo 29.83 30.96 31.81 29.67 32.24 36.39 40.43
Batutegi 17.04 13.21 47.23 57.93 43.30 45.13 23.16
Bili-Bili - - - - 40.8 53.5 53.9
3 Annual Operat-ing Hours
hours/year
Wonorejo 3,260 4,565 4,946 4,588 3,519 3,939 4,535
Batutegi 284 2,886 7,012 10,250 8,153 10,197 8,858
Bili-Bili - - - - 10,326 11,551 11,501
4 Planned Outage Hours
hours/year
Wonorejo 108.77 0 73.25 0 80.75 103.33 79.33
Batutegi 171.0 151.1 289.6 349.6 304.0 412.0 409.0
Bili-Bili - - - - 208 112 110
5 Maximum Water Use
1,000m3/second
Wonorejo 28,160 29,429 30,094 28,178 29,995 34,005 38,187
Batutegi 173,908 139,862 479,049 573,757 461,076 544,487 364,213
Bili-Bili
Effect Indicators
6 Net Electric En-ergy Production
MWh/year
Wonorejo 16,000 16,721 17,099 16,010 17,043 19,321 21,697
Batutegi 42,681 33,103 118,332 145,136 108,489 113,063 58,016
Bili-Bili - - - - 70,897 92,334 93,189
7 Actual Maximum Output
MW
Wonorejo 6.3 6.3 6.3 6.3 6.3 6.3 6.3
Batutegi
Bili-Bili
Source:Questionnaire Answers from PLN
Note:Data for blank columns are not available in the PLN recording system.
All the power plants under the Project are to carry out generation which is one
of the functions of the multipurpose dams, and the water use for generation is sub-
ordinate to the other uses for irrigation and clean water supply for domestic and
industrial uses. Available volume of water for generation is subject to the volume
of water supplied to other purposes, accordingly the plant capacity factors tend to
be low and unstable in general.
Minor technical problems brought relatively long hours of unplanned outages at
the initial stage of operation of Batutegi and Bili-Bil, however, proper remedies
enabled prompt recovery and smooth operation up until the moment.
Temporary drop in Batutegi capacity factor (CF)3 in 2008 is a result of the re-
duction of generation affected by the significant sinking of the reservoir’s water
level caused by the rainfall shortage in that year, however, it was recovered and
3 CF = Annual Energy Production / (Maximum Power) x (Annual Hours)

2-9
returned to normal afterwards.
As a conclusion, all the hydroelectric power plants under the Project are gener-
ating electricity optimally and their operational conditions are favorable.
2.3.2 Results of Financial Internal Rate of Return
Update of the Financial Internal Return (FIRR) was attempted based on the
same method of estimation at Appraisal and obtained the result as follows. The
update for Bili-Bili Power Plant was unable due to the lack of accurate accounting
record under unreliable project accounting system on disbursements from the state
budget and annual amounts of disbursement of the total project cost at the time of
Ex-Post Evaluation. Economic Internal Rate of Return (EIRR) for all the power
plants under the Project was not possible either due to the lack of appropriate fi-
nancial data necessary for the calculation.
Table 5:Assumptions & Results of FIRR Update
Project Life 50 years after commencement of project implemen-
tation
Cost
1. Investment Cost (Civil Works, Equipment Pro-
curement, Consulting Services)
2. Operation & Maintenance (O&M) Cost (15% of
total investment cost)
Benefit Revenue from power sales
Appraisal Wonorejo: 18.9%, Batutegi: 10.4%, Bili-Bili: 12.8%
FIRR Ex-Post
Evaluation
Wonorejo: 16.1%, Batutegi: 25.0%
The main reason of the considerable increase in Batutegi FIPP is the drastic re-
duction in its total project cost.
2.3.3 Qualitative Effect
(1) Shares of Power Plants and Relevant Indicators
Connected power supply transmission systems and corresponding areas of
power supply of each power plant of the Project are summarized in the following
Table 6, and respective share of each power plant is shown in Table 7 as follows.
Table 6:Connected Systems & Power Supply Areas
Power Plant Connected System or Sub-
station
Power Supply Area of Connected
System

2-10
Wonorejo Tulungagung Substation 4 Sub-districts (Kecamatan) of Tu-
lungagung District (Kabupaten)
Batutegi South Sumatra System Whole Sumatra Island
Bili-Bili South, Southeast, West
Sumatra System Whole Sulawesi Island
Table 7:Capacity Share of Each Power Plant in Respective Supply Regions
(Unit: MW)2007 Wonorejo(6.5 MW)
(Jawa Bali) PLN Total IPP Total Share of
Wonorejo Hydropower 2,386 150 2,536 0.26%
Mini Hydro 0 0 0 Steam 7,320 3,050 10,370 Combined Cycle 6,143 0 6,143 Gas 2,086 150 2,236 Diesel 76 0 76 Geothermal 360 515 875 Jawa Bali Total 18,371 3,865 22,236 0.03%
Batutegi(28 MW) (Sumatra) PLN Total IPP Total
Share of Batutegi
Hydropower 850 3.3%Mini Hydro 13 Steam 945 Combined Cycle 818 Gas 481 Diesel 832 Geothermal 40
Sumatra Total 3,979 361 4,340 0.65%Bili-Bili(20.1 MW)
(Sulawesi) PLN Total IPP Total Share of Bili-Bili
Hydropower 172 11.69%Mini Hydro 38 Steam 25 Combined Cycle 0 Gas 123 Diesel 440 Geothermal 40
Sulawesi Total 838 195 1,033 1.95%
Source:PUPTL 2009-2018
Note 1: Wonorejo belongs to Jawa Bali System, but supplies electricity only to 4 sub-districts of Tulun-
gagung District via Tulungagung Substation. The share of Wonorejo is indicated only for refer-
ence.
Note 2: Due to the lack of classified data according to energy resources for IPP, the figures on shares of
Batutegi and Bili-Bili in Sumatra and Sulawesi indicate the shares in PLN total.

2-11
While the generated electricity by Batutegi and Bili-Bili is supplied, being
mixed with electricity from other power sources, to whole islands of Sumatra and
Sulawesi respectively through intra-island power grids, electricity from Wonerejo
under the Jawa-Bali power transmission system is distributed in a limited area of
Tulungagung District via Tulungagung Substation being connected with the 20kV
transmission lines. Although it is difficult to measure direct benefit derived from
the power stations under the Project as stated above, except Wonorejo, due to their
negligible shares among the corresponding areas of power supply, the “Electrifi-
cation Ratio” and “Gross Regional Domestic Projects (GRDP)” are presented in
the following tables just for reference.
Table 8: Annual Trend of Electrification Ratio (Unit: %)
Power Supply
System 2004 2005 2006 2007
Jawa Bali 62.3 63.1 63.9 66.3
Sumatra 54.9 55.8 57.2 56.8
Sulawesi 51.6 53.0 53.2 53.6
Indonesia Total 57.5 58.3 59.0 60.9
Source: RUPTL
Table 9: Annual Trend of GRDP (Unit: billion Rupiah)
Power Supply
System 2003 2004 2005 2006 2007
Jawa Bali 927,599 977,537 1,033,670 1,093,320 1,160,726
Sumatra 346,715 356,879 369,612 389,067 403,377
Sulawesi 65,961 69,714 74,079 79,212 84,662
Indonesia Total 1,538,655 1,604,036 1,690,229 1,777,994 1,878,019
Source: Statistics BPS (Central Bureau of Statistics)
(2) Relevant Indicators of Power Supply Area of Wonorejo Power Station
Tulungagung District consists of 19 sub-districts, and four sub-districts among
those get electric supply from Wonorejo Power Station; namely, “Campurdarat,”
“Sumburgempol,” “Boyolangu” and “Kedungwaru” Sub-districts. GRDP and
number of business entities are shown in the following table.
2-12
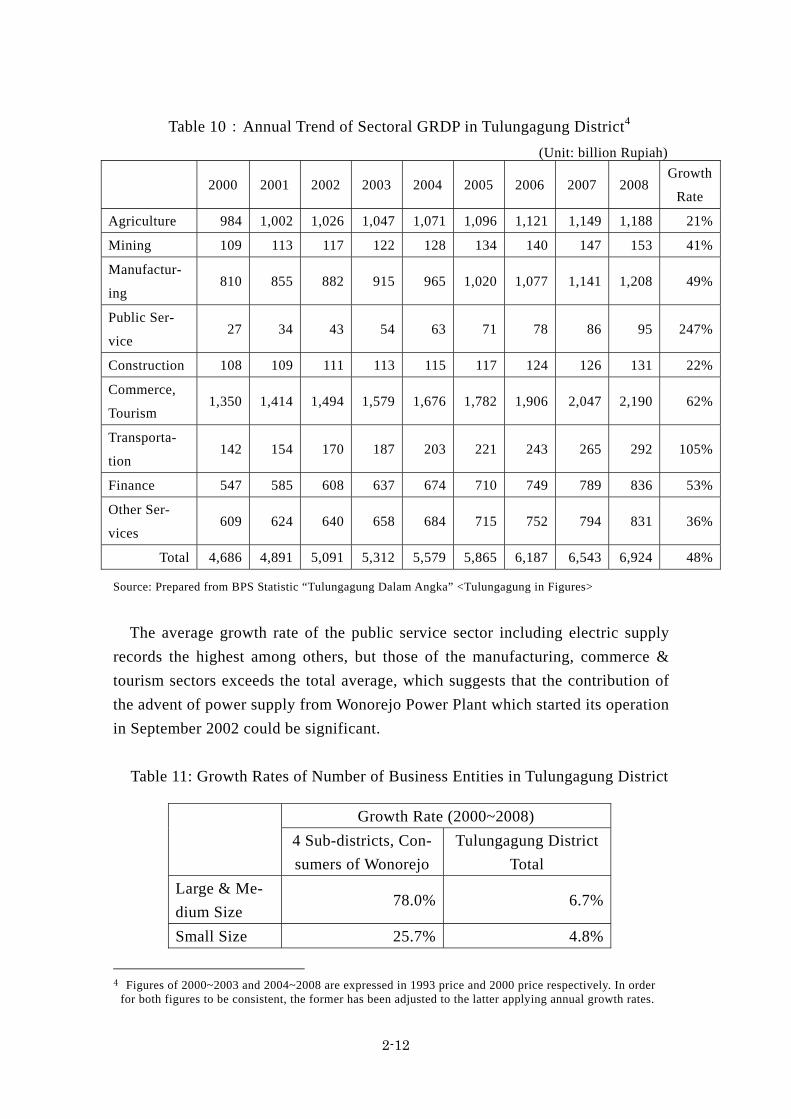
Table 10:Annual Trend of Sectoral GRDP in Tulungagung District4
(Unit: billion Rupiah)
2000 2001 2002 2003 2004 2005 2006 2007 2008 Growth
Rate
Agriculture 984 1,002 1,026 1,047 1,071 1,096 1,121 1,149 1,188 21%
Mining 109 113 117 122 128 134 140 147 153 41%
Manufactur-
ing 810 855 882 915 965 1,020 1,077 1,141 1,208 49%
Public Ser-
vice 27 34 43 54 63 71 78 86 95 247%
Construction 108 109 111 113 115 117 124 126 131 22%
Commerce,
Tourism 1,350 1,414 1,494 1,579 1,676 1,782 1,906 2,047 2,190 62%
Transporta-
tion 142 154 170 187 203 221 243 265 292 105%
Finance 547 585 608 637 674 710 749 789 836 53%
Other Ser-
vices 609 624 640 658 684 715 752 794 831 36%
Total 4,686 4,891 5,091 5,312 5,579 5,865 6,187 6,543 6,924 48%
Source: Prepared from BPS Statistic “Tulungagung Dalam Angka” <Tulungagung in Figures>
The average growth rate of the public service sector including electric supply
records the highest among others, but those of the manufacturing, commerce &
tourism sectors exceeds the total average, which suggests that the contribution of
the advent of power supply from Wonorejo Power Plant which started its operation
in September 2002 could be significant.
Table 11: Growth Rates of Number of Business Entities in Tulungagung District
Growth Rate (2000~2008)
4 Sub-districts, Con-
sumers of Wonorejo
Tulungagung District
Total
Large & Me-
dium Size 78.0% 6.7%
Small Size 25.7% 4.8%
4 Figures of 2000~2003 and 2004~2008 are expressed in 1993 price and 2000 price respectively. In order
for both figures to be consistent, the former has been adjusted to the latter applying annual growth rates.
2-13
and Individual
Source: BPS Statistic “Tulungagung Dalam Angka” (Tulungagung in Figures)
Rates of growth during 2000~2008 in four sub-districts being supplied with the
Wonorejo electricity are remarkably higher than the rates of the total, which could
indicate significant contribution of newly built Wonorejo Power Plant.
(1) Effect on Oil Consumption Saving
Effect on oil consumption saving and accompanied generation cost reduction is
expected to the Project as a source of alternative energy to replace oil consumption.
The value of oil consumption saving is estimated US$ 58 million based on the ac-
tual generation performance of the three power stations applying unit diesel price
for generation cited in RUPTL 2009-2018.
(2) Result of Beneficiary Survey
As mentioned earlier, the generated electricity by Batutegi and Bili-Bili is sup-
plied, being mixed with electricity from a great number of other power sources, to
whole islands of Sumatra and Sulawesi respectively through intra-island power
grids and their shares are small as indicated in Table 8. Therefore it is not possible
to specify influenced beneficiaries, and no meaningful beneficiary survey can be
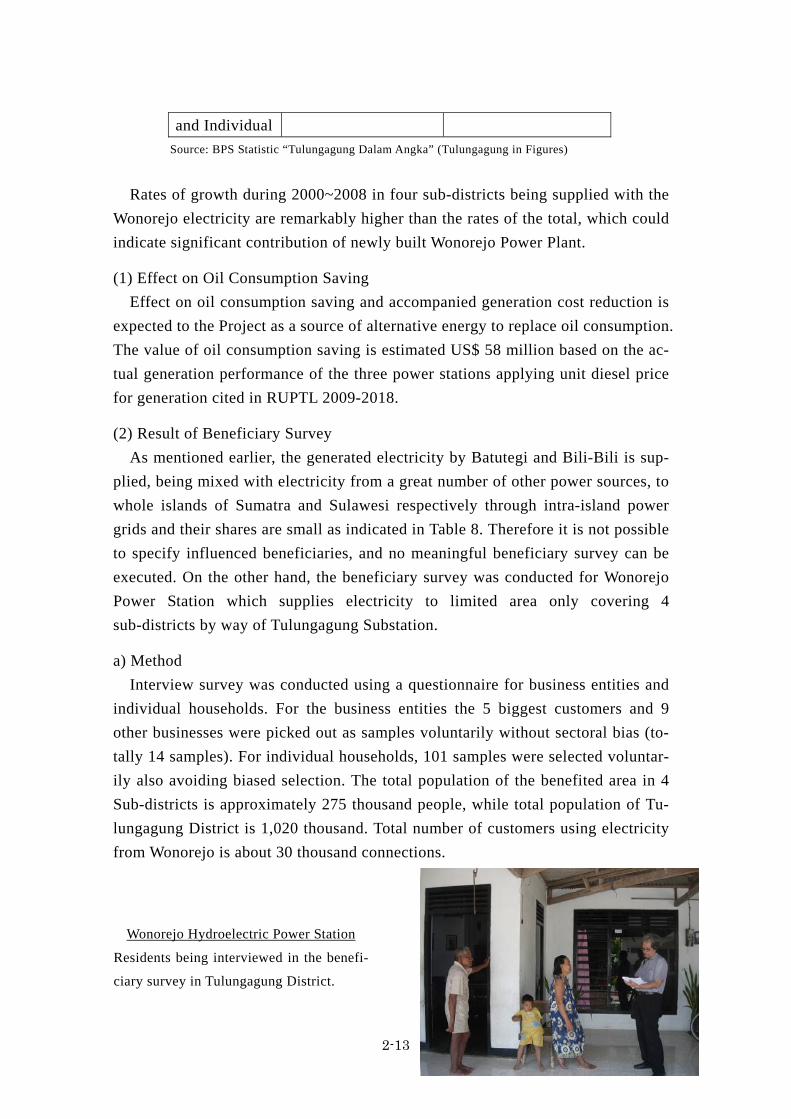
executed. On the other hand, the beneficiary survey was conducted for Wonorejo
Power Station which supplies electricity to limited area only covering 4
sub-districts by way of Tulungagung Substation.
a) Method
Interview survey was conducted using a questionnaire for business entities and
individual households. For the business entities the 5 biggest customers and 9
other businesses were picked out as samples voluntarily without sectoral bias (to-
tally 14 samples). For individual households, 101 samples were selected voluntar-
ily also avoiding biased selection. The total population of the benefited area in 4
Sub-districts is approximately 275 thousand people, while total population of Tu-
lungagung District is 1,020 thousand. Total number of customers using electricity
from Wonorejo is about 30 thousand connections.
Wonorejo Hydroelectric Power Station
Residents being interviewed in the benefi-
ciary survey in Tulungagung District.

2-14
b) Summary of Survey Result
Regarding the inquiry of general quality of power supplied, only 7% of business
entities and 15% households evaluate the quality before the Project “Excellent”
whereas 85% and 89% respectively answered that the quality became “Excellent”
after the Project. About the frequency of power failure, 57% of business entities
and 28% of households say “Scarcely happened” before the Project, but for the
condition after the Project, 100% and 83% answer “Scarcely happens.” For the
voltage stability, 79% of business entities and only 17% of households appreciate
it “Very stable,” but the figures increased up to 100% and 73% on the condition
after the Project.
The above result indicates that the conditions of power supply in the benefited
area significantly improved in quantity as well as in quality in conjunction with
the operation commencement of Wonorejo Power Plant.
Therefore, this project has largely produced the planned effects, and its effec-
tiveness is high.
2. 4 Impact
2.4.1 Impact on Natural Environment
The Project is to construct relatively small-scale power stations to be attached to
the multipurpose dams which are the main component of the comprehensive mas-
ter projects, and therefore do not impose heavy burden on natural environment. It
is also under careful environmental monitoring during implementation and after
operation, in which no significant adverse effect on the environment has been re-
ported.
2.4.2 Impact on Social Environment
Same as above, no significant social impact has been reported. In the construc-
tion of the transmission lines from Batutegi Pawer Station to Pagalaran which is
the only case where land acquisition took place, the process was smoothly exe-
cuted without any serious problem. No relocation of residents was executed.
2.5 Sustainability (Rating: a)
2.5.1 Structural Aspects of Operation and Maintenance
Each power station is operated and maintained under the layered responsibility
of the relevant institutions under PLN as shown below.

2-15
Table 13:Institutional Structure of Operation & Maintenance (O&M)
Power
Plant Institutional Structure of O&M
Wonorejo - PT PJB:Pembangkitan Jawa-Bali <Subsidiary of PLN>
- Wonerejo Power Station
Batutegi
-PT PLN (PERSERO) Pembangkitan Sumatra Bagian Selatan
-PT PLN (PERSERO) Sektor Pembangkitan Badar Lampung
- Batutegi Power Station
Bili-Bili
- PT PLN (PERSERO) Wilayah Sulawesi Selatan, Tenggara & Barat
- Sektor Bakaru
- Bili-Bili Power Station
The organization of the power plants are simply structured basically as illus-
trated in the figure below with minor difference among the plants.
In Batutegi and Bili-Bili Power Plants under the direct management of PLN,
three supervisors are assigned respectively in charge of “Operation,” “Mainte-
nance” and “Administration & Finance.” In case of Batutegi, the operation de-
partment is further divided into four working teams. Numbers of assigned staff
engineers are about 10 for operation, 3 for maintenance and one (excluding secu-
rities and cleaners) for administration & finance.
On the other hand, in Wonorejo Power Plant which is under management of
PJB, a subsidiary company of PLN, totally 13 engineers are assigned under the
Foreman (head of power station). Different from two other power plants, the O&M
section is not segregated into operation and maintenance and staffed with relevant
engineers with various expertise like “System Control,” “Mechanical Engineer-
ing,” “Electric Engineering,” “Equipment Management” and “Civil Engineering.”
Manager
Supervisor
Operation
Supervisor
Maintenance
Supervisor
Administration & Finance

2-16
2.5.2 Technical Aspects of Operation and Maintenance
Most of the staff assigned to the sections of operation and maintenance above
have academic background of electrical or mechanical engineering at STM or
other institutions of higher education. All follow technical training courses below
specially prepared for the area of hydroelectric generation several times a year so
as to continually upgrade their technical skills.
PLN makes much of staff education and training based on its internal regula-
tion. The training is conducted systematically providing staff with such courses as
below.
a. Freshman educational training
b. Professional training (Power generation, Transmission O&M, Distribution
O&M, etc.)
c. Grade training (Managers, Strategic specialist, etc.)
d. Other supplementary training (Technical workshop, seminar, diffusion of
knowledge, etc.)
Those training programs are carried out basically at PUSDIKLAT (Center of
Education & Training) of PLN. Additionally courses especially focused on hy-
droelectric power generation are prepared in the training center in Padang, West
Sumatra, and approximately 1,100 staff members were participated in more than
50 courses mainly on O&M and other technical training in 2008.
The engineers assigned to the three power plants under the Project were suffi-
ciently trained following the special courses above. At the same time PLN applies
a basic policy to assign staffs with enough experience in other power stations es-
pecially to new power stations. No technical problems or shortcomings were found
considering well-prepared institutional arrangement and practices as well as the
current good conditions of the facilities under operation.
2.5.3 Financial Aspects of Operation and Maintenance
Operation and maintenance budgets of power stations under direct manage-
ment of PLN are formulated at each location based on their requirement for O&M
activities and requested to the headquarters through relevant Sektors and Wilayah
(regional office). The approved amount is provided from the recurrent budget of
PLN headquarters. PLN’s financial difficulty as shown below does not allow those
budgetary requests to be fully met, however, no significant cash flow shortage for
operation and maintenance is prevailing in the field. Also being supported by their
significantly cheap cost of operation, the three power plants under the Project are
well operated and maintained without any significant financial obstacle.

2-17
Table 14: Trend of Financial Performance of PLN on Consolidated Basis (Unit: billion Rupiah)
2002 2003 2004 2005 2006 2007 2008
Power Sales 39,018 49,809 58,232 63,246 70,735 76,286 84,250
Government
Subsidy 4,739 4,097 3,470 12,511 32,909 36,605 78,577
Total Opera-
tion Revenue 44,183 54,430 62,273 76,543 104,726 114,042 164,209
Fuel & Lubri-
cation Cost 17,957 21,478 24,491 37,355 63,401 65,560 107,783
Total Opera-
tion Cost 52,345 55,876 59,710 76,024 105,228 111,505 160,598
Operation
Profit -8,162 -1,446 2,563 519 -502 2,537 3,611
Foreign Ex-
change Profit /
Loss
2,725 1,009 -1,523 -699 1,763 -858 -9,296
Total Profit -6,060 -3,558 -2,021 -4,921 -1,928 -5,645 -12,304
Source: Annual Report, PLN
PLN is chronically supported by a big amount of government subsidy and is
hardly operating as a financially independent corporation, but could be regarded as
a direct government’s business. That state of affairs is also implicitly represented
by the attitude to categorize government subsidy as the company’s operational
revenue. One of the fundamental factors is a serious financial burden of fuel cost
for generation. Especially in 2008, having been attacked by the soaring oil price,
PLN received almost the same amount of gigantic government subsidy as the total
power sales. PLN recorded a massive financial loss amounting to 12 trillion
Rupiah in the same year incurring big foreign exchange loss caused by the sig-
nificant depreciation of Rupiah currency, which could not be recovered even by
the large scale government subsidy. That amount of PLN’s loss occupied 83% of
the entire amount of loss of all the state-owned companies incurred (23 companies,
total 14.5 trillion Rupiah5). On the other hand, PJB, PLN’s subsidiary company
5 The company that suffered from the second biggest financial loss was Merpati Nusantara, state-owned
airline company, whose amount of loss was 500 billion Rupiah which is only 5% of the PLN’s. (KOMPAS <internet version>, May 14, 2009)

2-18
which operates Wonorejo Power Station has been enjoying favorable operational
performance with positive operating and total profit in consecutive 5 years until
2006 (profit / sales ratio: 5~7%). Operation and maintenance of Wonorejo Power
Plant is also running well with ample budget.
Thus PLN as a company faces a significant financial problem and much effort
should be made in operation and management to improve the situation, however, it
is the condition that the Indonesian power sector is under full financial support of
the government with massive subsidy. The financial issue of operation and main-
tenance in the field belongs to a different dimension, and PLN’s financial problem
does not exercise direct influence at this stage on the power plants’ cash flow for
effective operation and maintenance.
2.5.4 Current Status of Operation and Maintenance
Constructed facilities of Bili-Bili Power Plant are well maintained and oper-
ated smoothly. The additionally procured spare parts of the generator in prepara-
tion to the possible damage by contaminated water have not been used yet and are
kept in good condition, and smooth generation is going on with existing generators.
In addition to the fact that the water inflow from the dam reservoir containing
earth and sand has turned out to be not so serious as anticipated, the installation of
a cyclone separator under a partially modified technical design, which removes the
foreign substances and avoids their influx into the radiators, could effectively sup-
port the smooth operation. Wonorejo and Batutegi Power Plants are operated in
good conditions under appropriate maintenance as well without any significant
troubles. The two sets of governors of Batutegi Power Plant were facing a minor
technical trouble in a part of their function, or life has been expired according to
the engineer, but it does not affect at all the automatic operation which is currently
going on. Their replacement cost (about 16 million yen) has been already budg-
eted.
Minor operational problems, such as Japanese indication on the governors’
display and lost password and back-up programs of the HMI (Human Machine In-
terface), were prevailing in the field. Those deficiencies do not impede anything as
long as the generators are under automatic operation, but will reveal problems
once the generation has been changed to manual operation under some unusual
conditions. Although it can not be objectively identified whether it was due to the
acceptance of imperfect equipment or improper procedural treatment during the
internal transfer to the field, it has been obviously derived from such weakness in
internal management as lack of careful acceptance based on the supply contract or

2-19
predetermined procedural rules, miss-documentation after acceptance and so forth.
An internal management system for careful inspection at acceptance should be
strengthened in order to avoid such failures and secure transfer of perfect goods to
the field of operation. The consulting services of Wonorejo and Batutegi Power
Plants are provided under the corresponding multipurpose dam projects imple-
mented by the Ministry of Public Works. Operation & maintenance manuals for
power stations were prepared by the consultants within the said consultancy,
however they are not delivered to the PLN’s power stations concerned. In such a
case that a part of project implementation is executed in a different agency, effec-
tive communication and collaboration are essential to maximize the project effect.
Although minor problems on equipment under unsatisfactory conditions and
unused operational manual were found in the field, no major problem has been
observed in the capacity of the executing agency nor its operation and mainte-
nance system, therefore, sustainability of this project is high.
3. Conclusion, Lessons Learned and Recommendations
3.1 Conclusion
This Project has been highly relevant in line with the Indonesia’s national pol-
icy to cope with the country’s growing power demand concurrently aiming at alle-
viation of oil dependency, and consistent with the development needs. Although
the efficiency of the Project is moderate with significant delay in its implementa-
tion, the effectiveness is high contributing to the improvement of prevailing insuf-
ficient power supply in respective power transmission systems and to activate re-
gional economy and increase people’s welfare through improved power supply in
quantity as well as in quality. No major problem has been observed in the capacity
of the executing agency nor its operation and maintenance system, therefore, sus-
tainability of this project is high.
In light of the above, this project is evaluated to be highly satisfactory.
3.2 Lessons Learned
1. Cooperation among Implementing and Operating Agencies Involved
In case where multiple agencies are involved in project implementation and
operation, achievement of sufficient project effect and sustainability are prevented
without good cooperation among the agencies especially in the stage of transition
from implementation to operation. (Cf. 3.3 Recommendations, Section 2 below)

2-20
2. Submission and Receipt of Accurate Project Completion Report (PCR)
In yen-loan projects, a project implementing agency is requested to prepare
and submit a Project Completion Report (PCR) to JICA in accordance with the
agreed format. However, what has been submitted to JICA is a completion report
prepared by the consultant and submitted to PLN in accordance with their con-
sulting contract, which is not the PCR officially requested by JICA based on the
agreement reached in the Loan Agreement. Moreover, the completion report above
is only for Bili-Bili and does not include contents on Wonerejo and Batutegi
Power Plants whose consulting services are under the Ministry of Public Works.
At any project completion in future, the PCR submitted to JICA should be the of-
ficial one consistent with the prior agreement in L/A. JICA should also carefully
inspect the contents on its acceptance.
3.3 Recommendations
1. Improvement of Management Practices
Internal management practices in PLN and inter-agency management ar-
rangement among different implementation agencies should be improved. The in-
ternal management system should be totally strengthened in order to carry out im-
plementation and operation of hardware facilities and to achieve sufficient opera-
tional results. The following are typical examples.
2. Issues of Operation & Maintenance Manuals
The consulting services of Wonorejo and Batutegi Power Plants are provided
in “Wonorejo Multipurpose Dam Project” and “Way Sekampung Irrigation Project
(I)” under the Ministry of Public Works. The operation & maintenance manuals for
the portions of power stations were prepared by the consultants under the contracts
with the Ministry of Public Works, however those manuals have not been deliv-
ered not only to the power stations in question but even not to the PLN side. In
such a case that a part of project implementation is executed involving multiple
agencies, effective communication and collaboration are essential for aiming for
the achievement of maximal project effect. (In this connection, an operation &
maintenance manual for Bili-Bili Power Plant was not prepared based on the
agreement with PLN.) The manuals currently in the custody of the Ministry of
Public Works should be promptly sent to PLN and to be delivered to the respective
power stations. [to PLN]
3. Issues on Equipment Inspection at Acceptance
Minor operational problems, such as Japanese indication on the governors’

2-21
display and lost password and back-up programs of the HMI (Human Machine In-
terface), were prevailing in the field. Those deficiencies do not impede anything as
long as the generators are under automatic operation, but will reveal problems
once the generation has been changed to manual operation under some unusual
conditions. Although it can not be objectively identified whether it was due to the
acceptance of imperfect equipment or improper procedural treatment during the
internal transfer to the field, it has been obviously derived from such weakness in
internal management as lack of careful acceptance based on the supply contract or
predetermined procedural rules, miss-documentation after acceptance and so forth.
An internal management system for careful inspection at acceptance should be
strengthened in order to avoid such failures and secure transfer of perfect goods to
the field of operation. [To PLN]

2-22
Comparison of the Original and Actual Scope
Item Original Actual
1. Project Output
Wonorejo Power Plant (Installed Capacity: 6.3MW) ・Power Station 6.5MW ・Transmission & Substation
Facility: Transmission Lines (20KV, 13km), Switchyard
Batutegi Power Plant (Installed Capacity: 28MW) ・Power Station 28.9MW ・Transmission & Substation
Facility: Transmission Lines (150KV, 30km), Switchyard, Transformer
Bili-Bili Power Station (Installed Capacity: 17.2MW) ・Power Station 17.7MW ・Transmission & Substation
Facility: Transmission Lines (20KV, 12km), Switchyard
・Consulting Services(IC:
120MM, LC:239MM)
Wonorejo Power Plant (Installed Capacity: 6.5 MW) ・Power Station 6.5MW ・Transmission & Substation
Facility: Transmission Lines (20KV, 13km), Switchyard
Batutegi Power Plant (Installed Capacity: 28MW) ・Power Station 29.8MW ・Transmission & Substation
Facility: Transmission Lines (150KV, 30km), Switchyard, Transformer
Bili-Bili Power Station (Installed Capacity: 20.1MW) ・Power Station 20.1MW ・Transmission & Substation
Facility: Transmission Lines (20KV, 17km), Switchyard
・Consulting Services(IC:
114.43MM, LC:202.51MM)
2. Project Period December 1996~August 2003 (93 months)
December 1996~March 2007 (124 months)
L/A Signing November 1996 December 1996
Consultant Selection November1996~October 1997 November 1999
Consulting Service November 1997~August 2003 January 2000~December 2006
Procurement, Civil
Works
November 1996~February 2003 December 2000 (Bili-Bili) ~2006/12
Project Cost
Foreign Currency
Local Currency
Total
Japanese ODA Por-
tion
Exchange Rate
4,875 million yen
3,513 million yen
8,388 million yen
6,291 million yen
US$1=105.7 yen
Rp.1= 0.046 yen
(April 1996)
4,922 million
4,044 million
US$1=115.3 yen
Rp.1= 0.013 yen
(Actual rates 1997~2005)


