WORKING PAPER NO. 2013‐01
Evidence of Student Achievement in a
High School Personal Finance Course
By
Andrew T. Hill, Bonnie T. Meszaros and Brian Tyson
WORKING PAPER SERIES

The views expressed in the Working Paper Series are those of the author(s) and do not necessarily reflect those of the Department of Economics or of the University of Delaware. Working Papers have not undergone any formal review and approval and are circulated for discussion purposes only and should not be quoted without permission. Your comments and suggestions are welcome and should be directed to the corresponding author. Copyright belongs to the author(s).

Evidence of Student Achievement in a High School Personal Finance Course
Andrew T. Hill*† Economic Education Advisor
Federal Reserve Bank of Philadelphia Ten Independence Mall Philadelphia, PA 19106
Telephone: (215) 574‐4392 Fax: (215) 574‐2512
E‐mail: [email protected]
Bonnie T. Meszaros Associate Director
Center for Economic Education and Entrepreneurship University of Delaware 102 Alfred Lerner Hall Newark, DE 19716
Telephone: (302) 831‐1896 Fax: (302) 831‐6659
E‐mail: [email protected]
Brian Tyson‡ Graduate Student
University of Texas at Austin Austin, Texas 78712
December 7, 2012
* The views expressed in this paper are those of the authors and do not necessarily represent those of the Federal Reserve Bank of Philadelphia or the Federal Reserve System. The authors thank Susheela Patwari for valuable research assistance in the early stages of this project. †Corresponding author. ‡At the time this research was conducted, Brian Tyson was a research analyst at the Federal Reserve Bank of Philadelphia.

2
Evidence of Student Achievement in a High School Personal Finance Course
Abstract
This study investigates the effect of the “Keys to Financial Success” high school personal finance
curriculum on student achievement. It relies on multiple years of pre‐ and posttest data from 1,701
students who took a “Keys” course and from a comparison group of 261 students from the same
schools. The results from the pre‐ and posttests show that students who take the “Keys” course exhibit a
statistically significant increase in their personal finance achievement. These results contribute to the
growing literature showing the positive effects on the financial knowledge of high school students when
they take a well‐designed course taught by properly trained teachers.
Keywords: personal finance education, precollege, economic education, curriculum, assessment
JEL codes: A2, A21, D14
3
INTRODUCTION
Over the past decade, there has been increased attention on the need to include personal
finance in the high school curriculum. This perceived need has been fueled by articles from the popular
press, statistics on the impact of poor financial decisions made by young adults, and articles from the
academic community. In addition, the call for financial education has been reinforced by former Federal
Reserve Chairman Alan Greenspan (2001) and current Chairman Ben Bernanke (2006). While there has
been a growing interest in offering personal finance education in the K‐12 classroom, there is limited
evidence that personal finance instruction increases student personal finance achievement. This paper
explains the features of a high school personal finance curriculum – “Keys to Financial Success,” which is
offered by a consortium of partners in Delaware, New Jersey, and Pennsylvania – and the results from a
multiyear study of pre‐ and posttest scores from students in classrooms with teachers who use the
“Keys” materials.
LITERATURE
Today, more than any other time, individuals are expected to take more responsibility for
handling their personal finances and planning for their retirement. At the same time, the financial
services available to them have become more complex and specialized. Today’s consumers face an array
of sophisticated products. High levels of consumer debt, predatory lending, low savings rates, an
increase in nonbusiness bankruptcy filings, and expanded access to credit for younger populations are a
few of the factors contributing to the increased attention to the need for personal finance education
(Braunstein and Welch, 2002). With the recent financial crisis, the focus on a financially literate citizenry
has moved to center stage. Part of the responsibility to ensure that this goal is reached rests with
America’s K‐12 schools. Students leaving high school should be grounded in the fundamentals of
personal finance to be prepared for their roles as consumers, savers, and investors.

4
One of the impacts of the push for financial education in the schools has been an increase in
states’ mandates. In 2009, 44 states included personal finance to some extent in their state educational
standards and 34 states required that these standards be implemented. Thirteen states now require
students to take a personal finance course or include personal finance in an economics course as a high
school requirement for graduation (CEE, 2009). Having mandates does not necessarily translate into
student achievement. Tennyson and Nguyen (2001) found that in states that have broadly defined
personal finance mandates, students did not score higher on a personal finance test. However, those in
states that required a specific financial education course scored significantly higher than students in
states without mandates.
The Jump$tart Coalition of Personal Financial Literacy began conducting biannual national
testing of high school students in 1997. Mandell (2008) reports that results from the 2008 Jump$tart
survey were discouraging. The survey found that the financial literacy of high school seniors was at its
lowest level since the first Jump$tart survey was administered. The 2008 average score was 48.3
percent, down from a high of 57.3 percent in 1997. In fact, students who took a semester‐long high
school personal finance course did not do better on the Jump$tart examination than those who did not
take a personal finance course. These findings were cited by Willis (2008) as a reason against financial
literacy education. She argues that the move for more personal finance education in the schools should
be abandoned and suggests searching for policies that could lead more directly to good consumer
financial outcomes. Mandell and Klein (2009) drew similar conclusions and stated that until more
evidence was available that demonstrated that personal finance courses at the high school level
influenced subsequent financial behavior, the allocation of resources toward mandatory classes should
be reconsidered.
Mandell and Klein (2007) suggest that students retain little of what they learn in personal
finance because they don’t perceive that it is relevant to their lives. Motivation is a critical factor in

5
students becoming financially literate. The authors conclude that successful programs must include
instruction on setting clear and obtainable goals and helping students see how basic financial literacy
will allow them to reach their goals and add value to their lives. In addition, Mandell and Klein (2007)
conclude that the poor results on the Jump$tart surveys point out the need for teacher training and
better instructional materials. However, these surveys do show that high school students who play a
stock market game are more financially literate than students who do not (Mandell, 2006). A 2009
study to assess the impact of the Stock Market Game found that students who played the game scored
significantly higher on financial literacy tests than their peers who did not play (Hinojosa et al., 2008).
Mandell and Klein (2007) suggest that this implies that personal finance classes that are taught
interactively and are perceived by the students to be relevant to their lives may be more effective than
classes that use more traditional methods of instruction.
As the demand for personal finance education has increased so has the availability of
instructional materials. There has been a proliferation of nonprofit organizations, financial institutions,
congressional bills, and even a federal commission promoting financial literacy in recent years. Many of
these groups provide free or inexpensive instructional materials for children and adults. However,
limited research has been done on the effectiveness of these materials.
Hathaway and Khatiwada (2008) found that most research has not proven the effectiveness of
financial education programs. They conclude that there are two likely reasons for this. First, the
programs are not effective in transferring knowledge because of either their design or how they are
administered. Second, the programs are not being evaluated properly. Although the authors reviewed
research mainly on adult programs, their findings have implications for personal finance education.
Hathaway and Khatiwada (2008) conclude that a standard but adaptable framework for evaluation of all
types of literacy programs is needed. This is supported by Fox, Bartholomae, and Lee (2005) who
recommended Jacobs’s (1988) five‐tiered approach to evaluation with applications for personal finance.

6
Walstad, Rebeck, and MacDonald (2010) also stressed the use of Jacobs’s model when evaluating the
video‐based curriculum Financing Your Future. They outlined the five stages for personal finance
program evaluation. First, set a clear definition of content. Second, train teachers in content and use of
program materials. Third, specify knowledge outcomes that are measured with reliable and valid
instruments. Fourth, collect data on pre‐ and posttests. Fifth, rigorously analyze data using appropriate
forms of statistical analysis.
There are a number of studies that have shown a change in student achievement in personal
finance after exposure to a specific curriculum. In a survey of students who completed the High School
Financial Planning Program, Todd (2002) found that, following the training, 50 percent of the students
reported increases in financial knowledge. This supports findings from an earlier survey (Boyce and
Danes 1997–1998) that found that students feel more financially literate after the completion of the
personal finance course. Varcoe et al. (2005) used a 10‐item pre‐ and post‐ true/false test to determine
the impact of the Money Talks: Should I Be Listening? curriculum on student achievement. The results
from the true/false tests and the self‐reported data indicated that students who participated in Money
Talks seemed to improve their financial knowledge. However, these studies failed to include one or
more of the steps recommended in Jacobs’s (1988) five‐tier approach to evaluation.
Several studies have used a more rigorous approach to evaluation and have shown promising
results. All have used a quasi‐experimental design with treatment and comparison groups and have
provided teacher training using a specific curriculum package. Walstad and Rebeck (2005) developed a
50‐item multiple‐choice test to measure student achievement based on the content in Financial Fitness
for Life (FFL) (Morton and Schug, 2001) a personal finance and economics curriculum published by the
Council on Economic Education (formerly the National Council on Economic Education). After receiving
training in the FFL curriculum, high school teachers gave a pretest, taught the lessons, and administered
a posttest. The results showed that students receiving instruction from trained teachers using FFL had

7
higher achievement scores than students in the comparison group. Harter and Harter (2009) conducted
a study in eastern Kentucky to assess the effectiveness of the FFL lessons in elementary, middle, and
high school. Teachers participating in the study attended a workshop on the use of the FFL materials
prior to teaching with them in their own classrooms. At the high school level, student gains from the
pretest to posttest were significant when compared with the comparison group. Swinton et al. (2007)
examined student scores on Georgia’s economics end‐of‐course test. Students in classrooms with
teachers who attended a FFL workshop scored significantly higher on the required end‐of‐course test
than students taught by teachers who did not attend the workshop. Most recently, Walstad, Rebeck,
and MacDonald (2010) conducted a study on the effect of student achievement of Financing Your Future
(FYF), a series of five DVDs (CEE, 2009). Pre‐ and posttests were administered to treatment and
comparison groups. Students taught with FYF showed a statistically significant increase in their personal
finance knowledge over their peers in the comparison group.
KEYS TO FINANCIAL SUCCESS
In the spring of 2001, the University of Delaware Center for Economic Education and
Entrepreneurship (Center), the Federal Reserve Bank of Philadelphia, the Delaware Bankers Association,
and the Consumer Credit Counseling Service of Maryland and Delaware formed a partnership to provide
curriculum resources and teacher training to Delaware high schools interested in teaching a semester
personal finance course. Work commenced in the late spring and early summer of 2001 to compile a
90‐day instruction plan for a high school personal finance course that would make use of existing
curriculum resources, approach the teaching of personal finance using materials grounded in the
economic way of thinking, and allow the course to be flexible enough to be taught by teachers in the
social studies, family and consumer science, mathematics, and business departments. The resulting
course plan, called “Keys to Financial Success,” makes extensive use of lessons from the Council on

8
Economic Education’s widely distributed FFL (Morton and Schug, 2001) and Learning, Earning, and
Investing (LEI) (Caldwell et al., 2004) lesson books. These lessons make use of active and collaborative
learning and are engaging for the students. Since these two packages did not include lessons on specific
topics of importance to the partners, such as risk management, goal setting, and career planning,
lessons were developed by the staff at the Center and the Federal Reserve Bank of Philadelphia or were
taken from VISA’s Practical Money Skills (2000). To motivate students and add relevance to the course,
students are asked in the first two units to research different careers and set personal and financial
goals. Based on their research and goals, the students, with guidance from the teacher, select a career
for use during the course. The students’ goals and careers with entry‐level wages are revisited
throughout the remaining units in the course. Students are asked to apply what they have learned using
the income associated with their selected career and determine how their decisions impact their goals.
The intent of this approach is to help students see the relevance of being financially literate both now
and as adults.
The “Keys” course consists of 54 lessons built around nine themes: goals and decision‐making,
careers and planning, budgeting, saving and investing, credit, banking services, transportation issues,
housing issues, and risk protection. Throughout the course, students use the Internet for access to the
latest information on personal finance topics and financial products. This approach allows teachers to
update lessons from year to year to reflect changes in the financial marketplace. Using knowledge
gained from the lessons and information gleaned from the Internet, students create a personal portfolio
of tools and data. The students are encouraged to keep their portfolios as a reference when making
financial decisions after high school.
Participating schools commit to offering the course at least once per academic year. Teachers
attend a week‐long training course at the Federal Reserve Bank of Philadelphia taught by individuals
from the Center and the Federal Reserve Bank of Philadelphia. These economic educators have

9
advanced degrees in economics or economic education as well as extensive experience in teaching
classes for teachers.
In the 2001–2002 school year, the “Keys” course was piloted in one Delaware high school. As
shown in Table 1, the pilot year was followed by the addition of six schools in the 2002–2003 school
year, eight schools in 2003–2004, and six schools in 2004–2005. In this period, a total of 26 teachers
were trained to teach the course. In these first four years, only schools in Delaware were participating.
Beginning in the 2005–2006 academic year, schools in New Jersey and Pennsylvania were recruited to
participate in the program. In the six school years since recruiting began in New Jersey and
Pennsylvania, 97 schools were added to the program and 168 additional teachers were trained. While
new schools were continuing to adopt the “Keys” program over this period, a few schools left the
program each year. These attritions from the program were usually due to the retirement of the
teacher who had taught the course or due to school administrators realigning teachers’ schedules to
different areas.
[Insert Table 1 about here]
STUDY DESIGN
From the inception of the “Keys to Financial Success” program, the partners recognized the
importance of measuring the impact of the course on the personal finance achievement of the students.
A 50‐question personal finance test was developed based on the 50‐item high school multiple‐choice
test published by the Council for Economic Education to accompany the Financial Fitness for Life
personal finance curriculum.1 This test, developed by Walstad and Rebeck (2005), provided strong
internal consistency and was well suited to the content covered in the “Keys to Financial Success” course
since the course makes use of many lessons from the Financial Fitness for Life curriculum.
1. The test developed for this study omitted five questions from the FFL high school test and substituted five questions developed by the authors.

10
Initially, “Keys” teachers were asked to administer the 50‐item “Keys” test at the beginning of
the semester and at the end of the semester. They were also asked to administer, as a comparison, a
test with 10 questions drawn from the 50‐question “Keys” test to another section of students not taking
“Keys.” That section of comparison students could be either the “Keys” teacher’s own students or a
section of students taught in the same school by a colleague. The teacher was encouraged to choose a
comparison section of students who were about the same age and of the same ability level as the
students in his or her “Keys” course. During this early period in the study, no demographic information
was collected on the students in either the treatment or the comparison groups.
In subsequent years of the study, students in both the treatment and the comparison groups were asked
to self‐report whether they have a job currently or had one in the past, whether they have a checking
account, whether they have a savings account, their gender, and their age. The comparison test was
expanded from 10 to 20 questions. The 10 questions asked in the first comparison test were carried over
to the new 20‐question test, but 10 additional questions were added from the 50‐item test administered
to the treatment group.2 Also in the subsequent years of the study, students in both the treatment and
comparison groups were asked a set of affective questions about how they save and spend money, their
credit card use, and how they make decisions.3 All the data used in the analysis reported here are from
this later period.
2. Teachers indicated that they were unwilling to take the classroom time to administer a 50‐item test to a comparison group of students. In order to ensure that teachers were willing to administer a test to a comparison group, it was necessary to reduce the number of items to a subset of 20 questions drawn from the 50‐item test administered to the treatment group. While the difference in test length could result in differences in student performance due to more exam fatigue on the 50‐item test as compared to that on the 20‐item test, that bias would tend to cause the scores of the comparison group to be higher on the 20 items than those of their counterparts in the treatment group on those same 20 items. Given the large improvement from pre‐ to posttest exhibited by the treatment group as compared with the comparison group, this effect of exam fatigue does not seem to be much of a factor. 3. The results from the affective questions are not covered in this paper but are part of subsequent research to be published separately.

11
It is important to note that this study employs a quasi‐experimental design. Students in the
treatment group self‐selected themselves into their elective “Keys to Financial Success” course and
therefore the treatment group. Students in the comparison group are in other classes in the school and
are most often taught by the same teacher, but they are not receiving the “Keys” curriculum. The
comparison classes could be a business, social studies, or math class. As with many studies that examine
the effects of specific curriculum on student achievement, random assignment was not possible given
the specific circumstances present in the participating schools. Most significantly, schools are
overwhelmingly unwilling to allow researchers to randomly assign students to and require students to
take specific courses in the interest of research.
In Table 2, we present an overview of the content and cognitive level of the 20‐question “Keys
to Financial Success” knowledge test. Copyright restrictions prohibit us from reporting the specific
questions from the Financial Fitness for Life test, but we have summarized the content covered in each
question in the table. The related “Keys” and Financial Fitness for Life themes are also reported for each
question. The themes are listed beneath the table. The 20‐question test includes eight cognitive
questions, five analytical questions, and seven knowledge questions.
[Insert Table 2 about here]
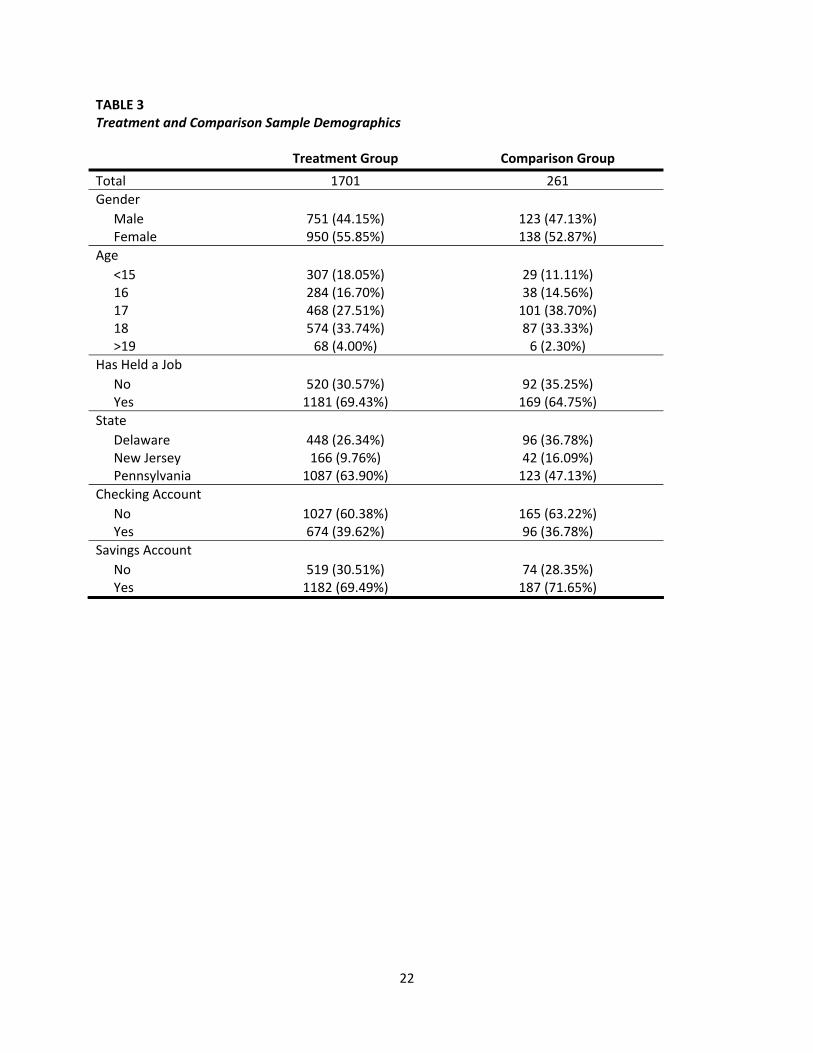
In Table 3, we report the demographics for both the treatment group and the comparison
group. With respect to gender, age, history of employment, and checking and savings account
ownership, the comparison group is relatively representative of the treatment group. The treatment
group does have a larger percentage of students aged 15 or under and a smaller percentage of students
aged 17 than the comparison group. The treatment group and comparison group differ with respect to
the states in which the students are enrolled. The majority of students in the treatment group are from
Pennsylvania. The comparison group is more heavily weighted with students from Delaware and New
Jersey.
12
[Insert Table 3 about here]
RESULTS In Table 4, we present the average pretest and posttest percentages correct on the 20‐question
test, sample sizes, and t‐values for the sample of “Keys” students (the treatment group). The increase in
average percentage correct from pretest to posttest was highly statistically significant for all subgroups
in the treatment sample. The gains in personal finance achievement for males and females were 25.17
percentage points and 24.36 percentage points, respectively.4 This result implies, as found by Walstad,
Rebeck, and MacDonald (2010), that instruction in the “Keys” course and the “Keys” test are “probably
not subject to conditions that produce gender differences in financial knowledge outcomes” (p. 349).
[Insert Table 4 about here]
Students who were 15 years of age or younger and students who were 16 showed the largest
improvement on the test (27.67 percentage points and 28.64 percentage points, respectively). They
started from about the same average percent correct (34.97 percent and 35.39 percent, respectively) on
the pretest and ended at about the same average percent correct (62.64 percent and 64.03 percent,
respectively) on the posttest. Likewise, students who were 17 and students who were 18 showed similar
starting points on the pretest (40.15 percent and 41.38 percent, respectively) and ended at similar
points on the posttest (64.28 percent and 63.39 percent, respectively). Seventeen‐year‐olds’ and 18‐
year‐olds’ achievement in personal finance as shown by the 20‐item “Keys” test increased by 24.13
percentage points and 22.01 percentage points, respectively. In this study the 17 and 18 year olds
started with a slightly greater understanding of personal finance but ended the course with roughly the
4. A test for attrition bias was conducted to investigate whether those students who took the pretest but did not take the posttest were significantly different from those who completed both the pretest and the posttest. Students from the treatment group who completed both the pretest and the posttest scored 1.07 questions higher on the 50‐question test than their counterparts who left the sample after the pretest. The t‐statistic comparing this difference to 0 was 5.60, implying that this difference is statistically significant. However, without a clear instrumental variable in our data set, we were unable to use the standard Heckman correction.

13
same level of personal finance knowledge as their younger counterparts. Students who were 19 years of
age or older, while representing a small portion of the sample, started with an average pretest score of
33.16 percent correct and ended with an average posttest score of 55.07 percent correct. The students
in the treatment group who were 19 years of age and older improved their personal finance knowledge,
on average, by 21.91 percentage points as measured by the 20‐question “Keys” test. On average, these
older students, who were older than average high school seniors, started their “Keys” courses with less
knowledge of personal finance than even their peers who were 15 years of age or younger and had
smaller gains in personal finance knowledge between the pre‐ and posttest.
“Keys” students who have held a job had pretest scores slightly over 4 percentage points higher
than those students who have never held a job. However, the posttest score for those who have held a
job was 63.57 percent correct as compared with 62.60 percent correct for those who have never held a
job. The personal finance knowledge gap between those students in the study who had held a job and
those who had not narrowed between the pretest and the posttest.
Students from New Jersey and Pennsylvania had pretest scores that were approximately the
same (37.23 percent correct and 37.89 percent correct, respectively). Students from Delaware, on
average, started with a higher pretest score of 40.65 percent correct. This pretest difference may reflect,
in part, that Delaware has a long‐standing economics requirement in elementary, middle, and high
school social studies. However, students in New Jersey and Pennsylvania gained significantly more in
their personal finance achievement when compared with their counterparts in Delaware. Between the
pretest and the posttest, Delaware students showed a 17.18‐percentage‐point increase in the number
correct on the 20‐question test, while students in New Jersey gained 29.40 percentage points and
students in Pennsylvania gained 27.12 percentage points.
Nearly 675 students in the treatment sample reported having a checking account. While those
students with checking accounts had pretest scores higher than their counterparts who did not, the

14
students without checking accounts increased their score on the test by 25.27 percentage points and
those students with checking accounts increased their score on the test by 23.88 percentage points.
Likewise, those students with a savings account had, on average, pretest scores that were 5.57
percentage points higher than those students without a savings account. Students with savings accounts
had average achievement gains of 24.44 percentage points after taking the course. Students without
savings accounts had average achievement gains of 25.37 percentage points after taking the course.
In Table 5, we present the pre‐ and posttest percentage correct results for the “Keys” students
and the students in the comparison group. We show the results for both the full 50‐item “Keys”
personal finance knowledge test as well as the 20‐item truncated test given to comparison students.
These results for the full 50‐question test are reported for just the “Keys” students, since they were the
only students to take the full 50‐item test. On average, the students gained 21.14 percentage points
between the pretest and the posttest on the 50‐item test. The increase was highly statistically
significant. Likewise, the “Keys” students gained, on average, 24.72 percentage points between the
pretest and the posttest on the 20 items given to the comparison group. On these same 20 questions,
the comparison group gained, on average, just 3.14 percentage points. Both gains are highly statistically
significant. These results imply that the “Keys” students’ performance on the 50‐question and 20‐
question tests is similar. Also, while there is some minor learning from the test exhibited by the
comparison group, that learning does not account for the majority of the achievement gains exhibited
by the “Keys” students between the pre‐ and posttest on the 20‐question instrument.
[Insert Table 5 about here]
While the results reported thus far show positive student achievement gains between the
pretest and the posttest, we estimated a regression model to further investigate the effect of the “Keys
to Financial Success” course while controlling for student characteristics and teacher effects. This

15
methodology mirrors the methodology used by Walstad, Rebeck, and MacDonald (2010) and is based on
the findings of Bosshardt and Watts (1990). The following linear model was estimated.
The dependent variable, , is the posttest raw score out of 20 for student of teacher . As
in both Bosshardt and Watts (1990) and Walstad, Rebeck, and MacDonald (2010), we controlled for
unobserved teacher effects by including , a fixed effect for each teacher. Ten independent variables
[X(1) through X(10)] were included in the regression. These independent variables were the students’
pretest raw score, a dummy variable that took the value 1 if the student was a member of the treatment
group and 0 if the student was a member of the comparison group; a dummy variable that took the
value 1 if the student was female and 0 otherwise; 0,1 dummy variables for the age groups (15 and
younger was the excluded group); a dummy variable that took the value 1 if the student reported
currently or in the past holding a job; a dummy variable that took the value 1 if the student reported
having a checking account; and a dummy variable that took the value 1 if the student reported having a
savings account.
The results for the unrestricted regression with teacher fixed‐effects, which includes all students
in both the treatment and comparison samples regardless of their teacher, are reported on the left side
of Table 6. As expected, the student’s pretest score was highly statistically significant, implying that prior
knowledge of personal finance was a good predictor of student knowledge on the posttest. The
estimated coefficient for the dummy variable that identified the treatment (“Keys”) students was 3.240
and highly statistically significant, implying that students who took the “Keys” course gained by 16.20
percentage points on average from the pretest to the posttest relative to the comparison students as
measured by the 20‐item test.

16
None of the estimated coefficients on gender or age were statistically significant. These results
imply that, counter to the results found by Danes and Haberman (2007) and Varcoe et al. (2005), there
is no gender‐specific effect of the “Keys” course on student achievement in personal finance.
Furthermore, the results imply that there are no age‐specific effects of the course on student
achievement in personal finance.
The estimated coefficient on the variable that captured whether the student currently held or
had ever held a job was statistically insignificant. This result implies that work experience did not impact
personal finance achievement.
The estimated coefficient on the variable that captured whether the student owns a checking
account was statistically insignificant. However, the estimated coefficient for whether the student owns
a savings account was positive and statistically significant at the 10 percent level.
On the right side of Table 6, we report the results from estimation of the same linear model with
teacher fixed‐effects conducted on a restricted sample of only those treatment and comparison
students’ tests collected by the same teacher. As in the unrestricted regression, the estimated
coefficient for the treatment group dummy variable implies a 16.17‐percentage‐point increase in
student achievement as a result of the “Keys” course. Like the results for the unrestricted regression,
gender, age, and job experience were all statistically insignificant. Checking account ownership is
positive and weakly statistically significant in the regression run on the restricted sample. In contrast to
the unrestricted regression, savings account ownership was highly statistically significant. The estimated
coefficient implies a 2.59 percentage point marginal effect of savings account ownership on the
student’s personal finance achievement. This positive effect may reflect the fact that students who have
savings accounts are likely to come from families in which there is more personal finance knowledge
passed from parents to children.
[Insert Table 6 about here]

17
CONCLUSIONS
The objective of this study was to investigate the effectiveness of a semester personal finance
course that uses a specific curriculum, “Keys to Financial Success,” taught by teachers who attended a
30‐hour training course. The results from the pre‐and posttests show that students who take the “Keys”
personal finance course exhibit a statistically significant increase in their personal finance achievement
as measured by the personal finance knowledge test. Students in a comparison group showed very little
gain in personal finance achievement over the same period. This study lends support to the notion that
students who are exposed to a specific personal finance curriculum and who receive instruction from
trained teachers experience achievement gains in their personal finance knowledge. Well‐known
limitations on conducting research on the effectiveness of semester courses in the U.S. meant that a
true experimental study design was impossible. Nevertheless, given the few opportunities afforded
researchers to collect pre‐ and posttest student data from semester‐long personal finance courses, our
findings, based on test results from nearly 2,000 students, lend support for the growing body of research
that shows that personal financial education, if well designed and properly implemented, can increase
students’ achievement in personal finance.

18
REFERENCES Bernanke, Ben. 2006. Financial Literacy: Testimony Before the Committee on Banking, Housing, and
Urban Affairs of the United States Senate. http://www.federalreserve.gov/newsevents/testimony/Bernanke20060523a.htm.
Bosshardt, William and Michael Watts. 1990. Education and Saving: The Long‐Term Effects of High School Financial Curriculum Mandates. Journal of Public Economics 85: 265‐276.
Boyce, Laurie and Sharon Danes. 1997‐98. Evaluation of the NEFE High School Financial Planning
Program, 1997‐1998. (report of a study sponsored by the National Endowment for Financial Education) http://www.nefe.org/pages/education.html.
Braunstein, Sandra and Carolyn Welch. 2002. Financial Literacy: An Overview of Practice, Research and
Policy. Federal Reserve Bulletin, Nov., 445‐457. Caldwell, Jean, J. Davis, Suzanne Gallagher, Jane Lopus, John Morton, Mark Schug, Mary Suiter, Phil
VanFossen, Donald Wentworth, and William Wood. 2004. Learning, Earning and Investing: High School. New York: National Council on Economic Education.
CEE (Council for Economic Education). 2009. Survey of the States 2009: Economic and Personal Finance
Education in Our Nation’s Schools. New York: CEE. http://www.councilforeconed.org/about/survey2009/.
Danes, Sharon M. and Heather R. Haberman. 2007. Teen Financial Knowledge, Self‐Efficacy, and Behavior: a Gendered View. Journal of Financial Counseling and Planning 18: 48‐60.
Fox, Jonathan, Suzanne Bartholomae, and Jankook Lee. 2005. Building the Case for Financial Education.
The Journal of Consumer Affairs 39: 195‐214.
Greenspan, Allan. 2001. Remarks by Chairman Alan Greenspan: The Importance of Education in Today’s Economy. Speech presented at the Community Affairs Research Conference of the Federal Reserve System. http://www.federalreserve.gov/boarddocs/speeches/2001/20011026/default.htm.
Harter, Cynthia and John Harter. 2009. Assessing the Effectiveness of Financial Fitness for Life in Eastern
Kentucky. Journal of Applied Economics and Policy 28: 20‐33.
Hathaway, Ian and Sameer Khatiwada. 2008. Do Financial Education Programs Work? Federal Reserve Bank of Cleveland Working Paper No. 08‐03. http://www.clevelandfed.org/research/workpaper/2008/wp0803.pdf.

19
Hinojosa, Trisha, Shazia Miller, Andrew Swanlund, Kelly Hallberg, Megan Brown, and Brenna O’Brien. 2008. The Stock Market Game Study: A Brief Report. DC: Learning Point Associates. http://www.learningpt.org/smg/SMG_Study.pdf.
Jacobs, Francine. 1988. The Five‐Tiered Approach to Evaluation: Context and Implementation. In
Evaluating Family Programs, ed. H. Weiss and F. Jacobs, 36‐68. New York: Aldine DeGruyter.
Mandell, Lewis. 2006. Financial Literacy: Improving Education Results of the 2006 National Jump$tart Survey Washington, D.C.: Jumpstart Coalition.
Mandell, Lewis. 2008. The Financial Literacy of Young American Adults: Results of the 2008 National
Jump$tart Coalition Survey of High School and College Students. DC: Jump$tart Coalition. Mandell, Lewis and Linda Klein. 2007. Motivation and financial literacy. Financial Services Review 16:
105‐116. _______________. 2009. The Impact of Financial Literacy Education on Subsequent Financial Behavior.
Journal of Financial Counseling and Planning 20: 14‐24. Morton, John and Mark Schug. 2001. Financial Fitness for Life: Bringing Home the Gold (Grades 9‐12). New York: National Council on Economic Education.
Swinton, John, Thomas DeBerry, Benjamin Scafidi, and Howard Woodard. 2007. The Impact of Financial
Education Workshops for Teachers on Students’ Economic Achievement. The Journal of Consumer Education 24: 63‐77.
Tennyson, Sharon and Chau Nguyen. 2001. State Curriculum Mandates and Student Knowledge of
Personal Finance. The Journal of Consumer Affairs 35: 241‐262. Todd, Richard. 2002. Financial Literacy Education: A Potential Tool for Reducing Predatory Lending? The
Region (Federal Reserve Bank of Minneapolis) December: 6‐13. Varcoe, Karen, Allen Martin, Zanna Devitto, and Charles Go. 2005. Using a Financial Education
Curriculum for Teens. Journal of Financial Counseling and Planning 16: 63‐71. VISA. 2000. Practical Money Skills. San Francisco: VISA, U.S.A., Inc. Walstad, William and Ken Rebeck. 2005. Financial Fitness for Life: High School Test Examiner’s Manual
(grades 9‐12). New York: Council for Economic Education. Walstad, William, Ken Rebeck, and Richard MacDonald. 2010. The Effects of Financial Education on the
Financial Knowledge of High School Students. The Journal of Consumer Affairs 44: 336‐357.
Willis, Lauren. 2008. Against Financial Literacy Education. University of Penn Law School. Public Law Research Paper No. 08‐10.

20
TABLE 1 Schools and Teachers in the Keys to Financial Success Program
School Year
Number of Schools Adopting
Number of Schools Leaving Total Schools
New Teachers Trained
Total Teachers Trained
2001‐2002 1 0 1 1 1 2002‐2003 6 0 7 7 8 2003‐2004 8 0 15 13 21 2004‐2005 6 1 20 5 26 2005‐2006 22 1 41 29 55 2006‐2007 24 9 56 40 95 2007‐2008 13 5 64 22 117 2008‐2009 12 3 73 17 134 2009‐2010 15 0 88 26 160 2010‐2011 31 1 118 34 194

21
TABLE 2 20‐Question Keys to Financial Success Test: Content and Cognitive Level KeysTest Item
FFL Test Item Content Cognitive Level
Keys Theme
FFL Theme
1 2 Reasons for saving and investing Comprehension 4 1 2 7 Opportunity cost Application 1, 2 1 3 9 Determinants of income Comprehension 1 1 4 10 Financial decision‐making Knowledge 1 1 5 18 Taxes and transfer payments Knowledge 3 2 6 19 Taxes and transfer payments Knowledge 3 2 7 20 Taxes and transfer payments Application 3 2 8 21 Saving and investing Comprehension 4 3 9 24 Rate of return on investment Application 4 3 10 27 Risk, return, and liquidity investment Comprehension 4 3 11 29 Buy and sell investments Comprehension 4 3 12 30 Buy and sell investments Knowledge 4 3 13 33 Credit history and records Knowledge 5 4 14 34 Credit history and records Knowledge 5 4 15 37 Sources of credit Comprehension 5 4 16 38 Rights and responsibilities of buyers,
sellers, and creditors Application 5 4
17 44 Use of money management tools Comprehension 6 5 18 48 Insurance, risk management Application 7, 9 5 19 NA Budgeting Comprehension 3, 8 5 20 NA Use of money management tools Knowledge 6 5
Note: Questions 19 and 20 were test items written by the authors.
Keys Themes 1. Goals and Decision‐Making 2. Careers and Planning 3. Budgeting 4. Saving and Investing 5. Credit
6. Banking Services 7. Transportation Issues 8. Housing Issues 9. Risk Protection
FFL Themes 1. The Economic Way of Thinking 2. Earning Income 3. Saving 4. Spending and Using Credit 5. Money Management
22
TABLE 3 Treatment and Comparison Sample Demographics
Treatment Group Comparison Group
Total 1701 261 Gender
Male 751 (44.15%) 123 (47.13%) Female 950 (55.85%) 138 (52.87%)
Age <15 307 (18.05%) 29 (11.11%) 16 284 (16.70%) 38 (14.56%) 17 468 (27.51%) 101 (38.70%) 18 574 (33.74%) 87 (33.33%) >19 68 (4.00%) 6 (2.30%)
Has Held a Job No 520 (30.57%) 92 (35.25%) Yes 1181 (69.43%) 169 (64.75%)
State Delaware 448 (26.34%) 96 (36.78%) New Jersey 166 (9.76%) 42 (16.09%) Pennsylvania 1087 (63.90%) 123 (47.13%)
Checking Account No 1027 (60.38%) 165 (63.22%) Yes 674 (39.62%) 96 (36.78%)
Savings Account No 519 (30.51%) 74 (28.35%) Yes 1182 (69.49%) 187 (71.65%)

23
TABLE 4 Percentage Correct on 20‐Question “Keys” Test by “Keys” Student Characteristics
Pretest Posttest Difference n t‐Value
Total 38.55% 63.27% 24.72% 1701 48.11
Gender
Male 38.20% 63.37% 25.17% 751 31.33 Female 38.84% 63.20% 24.36% 950 36.59
Age
<15 34.97% 62.64% 27.67% 307 20.06 16 35.39% 64.03% 28.64% 284 21.16 17 40.15% 64.28% 24.13% 468 26.49 18 41.38% 63.39% 22.01% 574 27.39 >19 33.16% 55.07% 21.91% 68 8.29
Has Held a Job
No 35.77% 62.60% 26.83% 520 26.03 Yes 39.78% 63.57% 23.79% 1181 40.82
State
Delaware 40.65% 57.82% 17.18% 448 20.44 New Jersey 37.23% 66.63% 29.40% 166 17.63 Pennsylvania 37.89% 65.01% 27.12% 1087 41.23
Checking Account
No 37.46% 62.73% 25.27% 1027 37.40 Yes 40.22% 64.10% 23.88% 674 30.31
Savings Account
No 34.68% 60.05% 25.37% 519 25.19 Yes 40.25% 64.69% 24.44% 1182 41.22

24
TABLE 5 Percentage Correct on “Keys to Financial Success” Knowledge Test: “Keys” Students and Comparison
Keys Students Comparison Students
Pretest(%) Posttest(%) Difference n Pretest Posttest Difference n
50‐Question Test 42.47% 63.60% 21.14%*** 1701 (13.56) (19.34)
20‐Question Test 38.55% 63.27% 24.72%*** 1701 41.72% 44.87% 3.14%*** 261
(13.96) (20.88) (14.17) (15.24)
***p < 0.01, two‐tailed t‐test
Note: Sample standard deviations are reported in parentheses.

25
TABLE 6 Fixed Effects Regression Results
Variable Unrestricted (n=1962)
Restricted (n=1117)
Keys Test Pretest Score 0.463 (0.047)*** 0.445 (0.066)*** Keys Students 3.240 (0.759)*** 3.233 (0.705)*** Gender (1 = female) 0.050 (0.126) ‐0.127 (0.159) Age = 16 ‐0.496 (0.653) 0.189 (0.561) Age = 17 ‐0.640 (1.021) 0.557 (0.532) Age = 18 ‐0.639 (0.991) 0.780 (0.527) Age = 19+ ‐0.906 (1.102) 0.325 (0.840) Job (1 = has worked) ‐0.126 (0.141) ‐0.156 (0.204) Checking Account (1 = Yes) ‐0.205 (0.139) ‐0.404 (0.208)* Savings Account (1 = Yes) 0.283 (0.152)* 0.518 (0.198)***
Constant 2.945 (1.340)** 2.324 (0.638)***
R2 0.429 0.486 F Value 30.60*** 33.11***
*p < 0.10, **p < 0.05, ***p < 0.01, two‐tailed test Note: Standard errors in parentheses


