
MARYLAND DEPARTMENT OF TRANSPORTATION STATE HIGHWAY ADMINISTRATION
RESEARCH REPORT
Evaluating the Impacts of Red Light Camera Deployment on Intersection Traffic Safety
Sung Yoon Park, Chien-Lun Lan, and Gang-Len Chang
Department of Civil & Environmental Engineering
University of Maryland-College Park College Park, MD 20742
FINAL REPORT
June 2018
MD-18-SHA/UM/4-37

ii
The contents of this report reflect the views of the author who is responsible for the facts and the
accuracy of the data presented herein. The contents do not necessarily reflect the official views
or policies of the Maryland Department of Transportation. This report does not constitute a
standard, specification, or regulation.

iii
Technical Report Documentation Page
Report No.
MD-18-SHA/UM/4-37 2. Government Accession No. 3. Recipient's Catalog No.
4. Title and Subtitle
Evaluating the Impacts of Red Light Camera Deployment on Intersection
Traffic Safety
5. Report Date
June 2018
6. Performing Organization Code
7. Author/s
Sung Yoon Park, Chien-Lun Lan, and Gang-Len Chang
8. Performing Organization Report No.
9. Performing Organization Name and Address
Department of Civil and Environmental Engineering
University of Maryland
College Park, MD 20742
10. Work Unit No. (TRAIS)
11. Contract or Grant No.
12. Sponsoring Organization Name and Address Maryland Department of Transportation
State Highway Administration
Office of Policy & Research
707 North Calvert Street
Baltimore MD 21202
13. Type of Report and Period Covered
Final Report
14. Sponsoring Agency Code
(7120) STMD - MDOT/SHA
15. Supplementary Notes
16. Abstract Red-light cameras (RLC) are a popular countermeasure to reduce red-light running and improve intersection safety.
Studies show that the reduction in side impact crashes at RLC intersections are often accompanied by no-change or an
increase in the number of rear-end collisions. Part I of the study used crash data to evaluate twenty-seven RLC locations
in Maryland. Part II conducted behavior observations at eight intersections to investigate if RLC impacts driver behavior,
especially their responses to a yellow light. The eight intersections, two three-intersection clusters and two individual
intersections, are in Montgomery and Prince George’s counties of Maryland. An intersection cluster includes a RLC
intersection, and an upstream and a downstream non-RLC intersections for control comparisons. Findings indicate that a
properly deployed RLC system can lead to the following impacts: (1) a reduction in side impact crashes; (2) changes in
rear-end collisions depending on the local driving populations, (3) a reduction in aggressive driving behavior at the RLC
and its downstream intersections; (4) more drivers reduce speeds when passing through a yellow phase, (5) more drivers
choose to stop when encountering a yellow phase; and (6) less red-light-running vehicles.
17. Key Words
Red-light camera, RLC, behavior
impacts, evaluation
18. Distribution Statement: No restrictions
This document is available from the Research Division upon request.
19. Security Classification (of this report)
None 20. Security Classification (of this page)
None 21. No. Of Pages
43 22. Price
Form DOT F 1700.7 (8-72) Reproduction of form and completed page is authorized.

iv
Table of Contents
1.1 Research Objectives ................................................................................................................. 1
1.2 Organization of this Report ..................................................................................................... 1
2.1 Introduction ............................................................................................................................... 3
2.2 Review of RLC Deployment Guidelines .............................................................................. 3
2.3 Summary of Existing Evaluation Reports of RLCs ............................................................. 8
2.4 Spillover Effects ....................................................................................................................... 9
2.5 Summary .................................................................................................................................. 10
3.1 Introduction ............................................................................................................................. 15
3.2 Procedures for Before-and-After Comparisons .................................................................. 16
3.3 Summary of the Before-and-After Comparison Results ................................................... 19
3.4 Summary .................................................................................................................................. 26
4.1 Design of Field Observation Plans ....................................................................................... 27
4.2 Empirical Findings Regarding the Effects of RLC Deployment ..................................... 28
4.3 Summary of RLC Deployment’s Effectiveness from Empirical Evidences .................. 36
5.1 Conclusion ............................................................................................................................... 38
5.2 Recommendations .................................................................................................................. 39

v
List of Figures
Figure 1 Geometric Features of The MD 355 @ Halpine Intersection ......................................19
Figure 2 Frequency Distribution of Side-Impact Crashes and Rear-End Collisions during the
Before-and-After Period at MD 355 @ Halpine Intersection ....................................17
Figure 3 Before-and-After Analysis of Crash Frequency at MD 355 @ Halpine Intersection
(using the data in the year before the rlc deployment as the basis for comparison) ..18
Figure 4 Before-and-After Analysis of Crash Frequency at MD 355 @ Halpine Intersection
(using the average of two years before the rlc deployment as the basis for
comparison) ................................................................................................................18
Figure 5 Before-and-After Analysis of Crash Frequency at MD 355 @ Halpine Intersection
(using the average of three years before the rlc deployment as the basis for
comparison) ................................................................................................................19
Figure 6 Graphical Illustration of Field Data Collected in Stage-I .............................................27
Figure 7 Overview of all Three Intersections in MD 650 and their Geographical Relationships
....................................................................................................................................28
Figure 8 A Graphical Illustration of Dilemma Zone ..................................................................39

vi
List of Tables Table 1: A Summary of Key Steps Shown in the Available RLC Deployment Guidelines .........5
Table 2: List of Cities/Counties/Papers where RLC is Effective on Both Rear-End and Side-
Impact Crashes ...........................................................................................................11
Table 3: List of Cities/Counties/Papers where RLC is Effective only on Side-Impact Crashes 12
Table 4: List of Cities/Papers Where RLC is Effective only on Rear-End Crashes ...................13
Table 5: List of Cities/Counties/Papers where RLC Shows no Effectiveness or Negative
Effects .........................................................................................................................14
Table 6: List of RLC Intersections from Montgomery, Prince George’s, and Howard Counties
for Before-and-After Comparison ..............................................................................15
Table 7: Before-and-After Analysis of the RLC’s Effects on the Crash Patterns Under Different
Periods ........................................................................................................................20
Table 8: Before-and-After Analysis of the RLC’s Effects on Side-Impact Crash Patterns by
Severity Level .............................................................................................................21
Table 9: Before-and-After Analysis of the RLC’s Effects on Rear-Collision Patterns by the
Severity Level .............................................................................................................22
Table 10: Before-and-After Comparisons of the Rear-End Collision Pattern at RLC and non-
RLC Legs ...................................................................................................................23
Table 11: Before-and-After Comparisons of the Side-Impact Crash Pattern at RLC And non-
RLC Legs ...................................................................................................................26
Table 12: Distribution of Approaching Speeds at MD 650, its Upstream and Downstream
Intersections ................................................................................................................29
Table 13: Distribution of Approaching Speeds at US 301, its Upstream, and Downstream
Intersections ................................................................................................................30
Table 14: Distribution of Approaching Speeds at US 450 .........................................................30
Table 15: Distribution of Approaching Speeds at MD 97 ..........................................................32
Table 16: Comparison of Speed Changes during the Yellow Phase: Moderate “Passing”
Drivers ........................................................................................................................33
Table 17: Comparison of Speed Changes during The Yellow Phase: Aggressive “Passing”
Drivers ........................................................................................................................33
Table 18: Percentage of Drivers who Decide to Stop at the Yellow Phase at MD 650 ..............34
Table 19: Comparison of Drivers who Decide to Stop at MD 650 and its Upstream
Intersections ................................................................................................................34
Table 20: Comparison of Drivers who Decide to Stop at the Downstream and Upstream of the
MD 650 Intersections .................................................................................................34
Table 21: Percentage of Drivers who Decide to Stop at the Yellow Phase at US 301 ...............35
Table 22: Comparison of Drivers who Decide to Stop at US 301 and its Upstream Intersections
....................................................................................................................................35
Table 23: Comparison of Drivers who Decide to Stop at the Downstream and Upstream of the
US 301 Intersections ..................................................................................................36
Table 24: Comparison of Drivers who make Inappropriate Decisions During the Yellow Phase
Between the MD 650 and US 301 Study Sites ...........................................................38
Table 25: Comparison of Drivers who Make Inappropriate Decisions During the Yellow Phase
Between the MD 450 and MD 97 Study Sites ...........................................................38

1
Introduction
Federal and state transportation agencies have devoted considerable resources over the past
decades to education, engineering, enforcement, and deployment of safety strategies. Red-light
cameras (RLC) are a popular countermeasure to reduce red-light running and improve
intersection safety. The reduction in side impact crashes at RLC intersections, however, is
sometimes accompanied by no-change or an increase in the number of rear-end collisions. In
addition, whether multiple deployments of RLC in a traffic network can change driving habits
(e.g., motorists drive less aggressively) remains to be determined. As transportation agencies
continue to extend the use of RLC, it is imperative to rigorously review the past deployment
results to identify effective designs at appropriate intersections and avoid undesirable effects.
1.1 Research Objectives
Previous research concluded that intersection crashes are the consequence of complex
interrelations between engineering designs, signal controls, and behavioral discrepancies of local
driving populations. Rather than generalize and be overly influenced by other research, it is
necessary to collect location-specific data to evaluate the benefits/effectiveness of any deployed
counter measure. The following objectives were set for this study:
- To assess the effectiveness of RLC systems in reducing various types of intersection
crashes using location-specific data.
- To understand the impact of RLC systems on driver behaviors, including their
approaching speeds and responses to the signal yellow phase.
1.2 Organization of this Report
The project consists of two parts. Part I evaluated the effectiveness of RLC deployments at 27
local intersections over the past decade, including a comparison with those findings in the
literature with respect to reducing rear-end collisions and side-impact crashes. Based on the
findings discussed in Part I, Part II investigated the impact that RLCs had on driver behaviors,
especially their responses to the yellow phase.
Empirical observations of drivers at the upstream and downstream intersections at two RLC
intersection clusters were conducted and potential differences in response to the presence of the
RLC at these intersections were analyzed. A comparison of results and critical findings on the
influence of the RLC on intersection safety constitutes the core of the project. The report is
organized as follows.
Section 2 presents a literature review on the safety impacts of a RLC system, analyzing state-of-
the-practice reports by public agencies and state-of-the-art publications in the research
community. Key factors identified in the study scope of each RLC report and the changes in
rear-end and side-impact crashes were given special attention.
The findings with respect to RLC’s effectiveness were classified into four categories: reduction
in both side-impact crashes and rear-end collisions; reduction in side-impact crashes only;
reduction in rear-end collisions only; and no influence or a minor increase in rear-end collisions.
Operational guidelines developed by both federal and state agencies were included in the review.
The findings on the “spillover effect” of RLC deployment were also included in this section.

2
Section 3 presents the before-and-after study conducted at 27 RLC intersections in Maryland,
which revealed similar inconsistent RLC effectiveness similar to what was reported in the
literature. A discussion on critical factors contributing to either a reduction or increase in crash
patterns was included.
Section 4 presents the results of field observations and the empirical analyses on the differences
in traffic characteristics and driver responses to the yellow phase at the RLC-effective and
ineffective intersections. Note that over 1,000 drivers were observed on their approaching
speeds, acceleration/deceleration rates, and responses to the yellow phase at the two RLC
intersection clusters and two additional individual RLC intersections. The comparison between
key variables observed at RLC intersections and those at the neighboring intersections shed light
on the inconsistent effects of the RLC program on traffic safety.
Section 5 summarizes the final research findings and some suggestions for additional traffic data
to be included in the pre-deployment assessment and the development of a deployment guideline.

3
Review of Red-Light Camera Related Studies
2.1 Introduction
In light of the large body of literature on red-light camera (RLC) related issues, this section
contains a review of primary studies on two pressing issues: guidelines for RLC deployment and
the evaluation of the RLC program’s effectiveness. The section first provides a concise
description of the state of the practice by most responsible agencies in decision making. A
summary of their implementation results follows, with a focus on the RLC program’s
effectiveness and potential outcomes. Suggested research on other critical issues is also covered
in this section.
The Federal Highway Administration’s (FHWA) RLC deployment guidelines serve as the basis
for analyzing the state of the practice. Other practices or guidelines adopted by various state
highway agencies or local jurisdictions are used to complement the FHWA guidelines. For
convenience of reporting, this study classifies reports into the following categories:
Type-1: reduction in both side-impact crashes and rear-end collisions;
Type-2: reduction in side-impact crashes but not rear-end collisions;
Type-3: reduction in rear-end collisions but not side-impact crashes;
Type-4: reduction in neither type.
The robustness of field evaluation findings and sampling biases, are discussed at the end of this
section.
2.2 Review of RLC Deployment Guidelines
Both FHWA and several states developed RLC deployment guidelines. Aside from some minor
variations, most guidelines are consistent in principle and share the following common key steps:
Step-1: Establish the Program Objectives
The first step is to define, as clearly as possible, the objectives of the RLC program. Nearly all
state guidelines require the the following tasks: collection of red-light-running data at a candidate
site, investigation of contributing factors, and evaluation of potential benefits from the RLC
installation. For example, poor signal visibility and insufficient yellow phase duration are often
the contributing factors to red-light running. Such guidelines call for a rigorous review of signal
and geometric designs first, and a comprehensive analysis of the driver compliance rate and
other safety performance measures should follow. Proper engineering countermeasures must first
be implemented, and the installation of RLCs is viewed as a last resort.
Step-2: Launch a Review Committee
After identifying a candidate RLC deployment site, the next step is to obtain approval from state
authorities to proceed with the installation. Most states require local authorities to submit
documents including crash counts at the proposed intersection and the results of an engineering
study. The latter requirement serves to identify the contributing factors to red-light running.
Step-3: Initiate a Public Awareness Campaign
Once the RLC installation is justified and approved, the next step is to enhance public awareness
of the RLC installation. A well-designed public awareness and information campaign helps
motorists understand the safety issues at the intersection.

4
Step-4: Installation of Red Light Cameras
The actual RLC installation includes the following considerations:
• Cameras must be stored in a box and located at the top of 15-foot poles to shield them from
environmental impacts and vandalism.
• One red-light camera can typically cover up to the three closest travel lanes.
• The RLC system includes a computer to process detected images, the induction-loop
triggers, and the traffic light circuit to monitor the traffic signal and triggers.
• The camera will not be activated unless the signal turns to a red phase. If a vehicle is in the
middle of the intersection when the signal turns red, the system shall not be activated.
• To activate the RLC system, the signal must be in the red phase, and a vehicle must cross
the induction-loop triggers over a preset speed threshold.
• If a vehicle passes over both induction loop triggers relatively quickly after the signal turns
to the red phase, the system will be activated, and the cameras shall take two photos of the
vehicle: one showing the vehicle entering the intersection and the other capturing the
vehicle in the middle of the intersection. The photos will clearly show the vehicle crossing
the stop line during the red phase and continuing through the intersection.
• If a picture of the driver is required, the RLC system can take an additional photo of the
vehicle from the front to capture an image of the driver.
Table 1 summarizes the key recommendations of the guidelines developed by federal and state
agencies, including necessary next steps.
Table 1: A Summary of Key Steps Shown in the Available RLC Deployment Guidelines
Agency Key steps
FHWA
(2005)
Step-1: Investigate intersection safety
Data may be obtained from the following sources:
- crash statistics and investigation records maintained by law enforcement
and traffic engineering agencies;
- crash statistics maintained by insurance companies, if available;
- counts of citations issued by law enforcement officers for red light
running;
- camera surveys of driver behavior at intersections, including counts of red
light violations;
- field observations of driver behavior at intersections, including speed
surveys, by trained personnel;
- complaints or other inputs from motorists and the general public.
Step-2: Execute an engineering study
An engineering study should be conducted to determine the factors contributing to
red-light running and to identify appropriate countermeasures, including:
- intersection engineering improvements;
- traffic operations and signal control;
- intersection geometry changes;
- education;
- traditional enforcement by law enforcement officers.

5
Agency Key steps
Step-3: Implement red light camera program if other countermeasures
are not effective on the sites
Key steps to successfully implement a red light camera system program include:
- early planning and startup;
- establish a steering committee;
- establish program objectives;
- identify the legal requirements;
- assess system procurement alternatives;
- establish a public awareness and information campaign;
- system planning such as building violations processing procedure;
- site selection based on accurate crash and red light violations data;
- install warning signs;
- establish traffic signal yellow times with Manual on Uniform Traffic
Control Devices for Streets and Highways (MUTCD);
- select system and technologies;
- engineering design of red light camera systems;
- prepare and sign the red light camera system installation plans by an
appropriately licensed engineer;
- red light camera system installation;
- on-going public information and education;
- operations and maintenance plan;
- on-going system assessment.
Alabama
(2015)
Step-1: Identify red-light running problem
Identify and confirm the red-light-running safety problem, including:
- conduct an engineering analysis to identify the factors that may cause the
problem;
- identify alternative countermeasures that could solve the problem
- select the most appropriate single or combined set of countermeasures;
- implement the countermeasures and monitor the solution to determine
their effectiveness.
Step-2: Implement red light running camera if other countermeasures are not
effective on the sites
All principal activities to be done at this step are identical to those specified in the
FHWA’s guidelines.
Step-3: Submit the evaluation reports every year
Colorado
(2016)
Step-1: Collect crash data over a minimum of (3) years of recent crash data
Step-2: Implementation of possible engineering countermeasures
Step-3: Provide optional supplemental information

6
Agency Key steps
Step-4: Analyze the supplemental red light violation data
Step-5: Summarize the final site selections for approval
Delaware
(2016)
Step-1: Identify all candidate intersections
Identify candidate intersections for RLC, in the following manner:
- rank all intersections (highest to lowest) by the total number of red-
light running crashes using the most recent five years of available crash
data;
- eliminate unqualified intersections where it is unfeasible to install RLC;
- improve all such intersections with signal reconstruction.
Step-2: Re-rank top-ranked intersections by approach based on a
review of police reports
Step-3: Evaluate if other types of engineering solutions are
feasible to install and operate the RLC equipment
Step-4: Submit the candidate locations for approval by the legislators
Iowa
(2013)
Step-1: Provide the department a justification report
Conduct the following steps:
- document existing traffic speeds, posted speed limits, traffic volumes, and
intersection or roadway geometry;
- document all applicable crash history, the primary crash types, crash
causes, crash severity, and traffic violations—only crashes attributable to
speeding or the running of a red light shall be included in this report;
- compare crash data with other similar locations within the local
jurisdiction, other jurisdictions, or larger metropolitan area;
- identify the critical traffic safety issue(s).
Step-2: Provide a comprehensive list of countermeasures that may address the
critical traffic safety issue(s), including documentation of the solutions or
safety countermeasures that have been implemented along with those that
have been considered but not implemented
Step-3: Document all discussions held and actions taken with partnering agencies
Include the following:
- those who have the resources to help reduce crashes attributable to
speeding or the running of a red light;
- report why the local jurisdiction believes automated enforcement is the
best solution to address the critical traffic safety issue(s).
Step-4: Submit a request and a justification report to the appropriate

7
Agency Key steps
district engineer department review
Take the following steps:
- notify the public and post the information on the department’s website;
- indicate the use of the automated enforcement to reduce red light running;
- set up the minimum requirements for automated traffic enforcement
systems;
- post the permanent signs in advance of the locations where enforcement
systems are in use.
Step-5: Perform periodic calibrations of automated traffic enforcement systems
Step-6: Evaluate the effectiveness of RLC after the installation
Florida
(1998)
Step-1: Site selection for installing the RLC
Selection based on:
- traffic crash data;
- traffic citation data;
- law enforcement officer observations;
- video surveys of violations.
Step-2: Execute a traffic engineering study (signed and sealed by a
Florida licensed Professional Engineer)
Step-3: Submit the request to FDOT for approval
Louisiana
(2010)
Step-1: Submit potential permit location request
Step-2: Submit engineering report
Step-3: Complete red light running countermeasures
Step-4: Implement red light running camera if other countermeasures
are not effective on the sites
Oregon
(2015)
Step-1: Provide the report to justify the RLC system, including a proper sight
distance, and design of speed zones consistent with the Manual on Uniform
Traffic Control Devices for Streets and Highways and ODOT’s “Traffic
Signal Policy and Guidelines”
Stept-2: Ensure that the yellow and red clearance intervals are consistent with
ODOT’s “Traffic Signal Policy and Guidelines” or other jurisdiction’s
adopted policy
Step-3: Ensure that the corridor progression timing does not contribute to red
light running
Step-4: Ensure the traffic signal timing is consistent with traffic volume, speed
and specific intersection design elements

8
Agency Key steps
Step-5: Implement the RLC system and concurrently provide a public
information campaign and sign to inform drivers
Step-6: Provide safety and operations reports, based on the crash history,
safety concerns, operations, and maintenance issues
Step-7: Initiate public information campaigns, and implement the RLC program
Step-8: Submit a biennial report to address the effect of using cameras on traffic
safety, the degree of public acceptance, and the process of administration
Virginia
(2008)
Step-1: Select the candidate intersections
Intersections should be based on:
- the crash rate for the intersection, the rate of red-light violations;
- the difficulty experienced by law-enforcement officers to apprehend
violators;
- the ability of law-enforcement officers to apprehend violators safely within
a reasonable distance from the violation.
Step-2: Complete an engineering safety analysis
Base analysis on intersection geometric and signal data, traffic data, and crash and
enforcement data.
Step-3: Submit the report for approval by the state department
Step-4: Conduct a public awareness program
Step-5: Provide public awareness campaigns and install a warning sign
Step-6: Evaluate the photo enforcement system on a monthly basis
2.3 Summary of Existing Evaluation Reports of RLCs
The review of RLC’s safety in this study covered 16 states, including AZ (2005), CA (2002), DL
(2015), FL (2014), IA (2007), LA (2010), MD (2007), NC (2004), NJ (2012), NY (2014), OR
(2005), TN (2009), TX (2015), VA (2010), WA (2007), and WI (2006). Some findings reported
in technical journals and studies conducted by cities were also included in this review. The safety
impacts of the RLC deployment were classified into the following categories:
Type-1: reduction in both rear-end collisions and side-impact crashes (see Table 2)
Type-2: reduction only in side-impact crashes but not in rear-end collisions (see Table 3)
Type-3: reduction only in rear-end collisions but not in side-impact crashes (see Table 4)
Type-4: no significant impacts (e.g., insignificant increase or reduction) in both side-
impact crashes and rear-end collisions (see Table 5)
It should be noted that the evaluation reports from WA (2007) and WI (2006) were not included
the tables because they documented only the reduction of 24% and 35% in the total number of

9
crashes respectively, without distinguishing the statistics between rear-end collisions and side-
impact crashes.
These evaluation results shown in the tables showed that RLC deployments reduced both rear-
end and side-impact crashes in 10 cities and one county, and only side-impact crashes in 28 cites,
5 counties and 10 papers. The reduction of only rear-end collisions were reported in one city by
Cunningham and Hummer (2010). Evaluation studies from 21 cities and three counties showed
no significant effect on reducing either type of intersection crash (Claros et al., 2017).
These inconsistencies in the literature on the RLC effectiveness are likely attributed to the
following factors:
- An inconsistent number of intersections selected for the evaluations: for example, the
RLC evaluation conducted in Suffolk, New York (Popolizio, 1995) covers 104
intersections; however, a similar study in Davie, Florida focuses on only one intersection
(Florida Department of Highway Safety and Motor Vehicles, 2014).
- An inconsistent number of years selected for the “before” and “after” periods for
statistical comparison of crash patterns.
- Inconsistent methodologies adopted for before-and-after comparisons, including, but not
limited to, Poisson regression, Empirical Bayesian, Naïve before-and-after tests, student
t-test, and E-tests.
- Any significant change in critical safety factors during the target “before-and-after”
periods.
- The behavioral discrepancies of the driving populations, especially with respect to their
responses to the yellow phase under different traffic conditions at RLC intersections.
Of all the factors listed, the behavior of driving populations is likely to be the most critical one.
Rigorous empirical studies to compare drivers’ responses to the yellow phase at RLC and non-
RLC intersections are essential to a better understanding of driver behavior.
2.4 Spillover Effects
When performing evaluations of RLC programs, this study took particular care in addressing two
major issues. The first is the regression to mean effect, which is used to reflect the random nature
of crashes. For example, an intersection experiencing a high crash frequency in one year, is more
likely to have fewer crashes in the following years. Failing to account for such an effect may
result in overestimating the actual RLC’s safety impacts.
The second is the so called “spillover” or “halo” effect, a widely recognized RLC safety
influence on nearby intersections by the traffic community. It is likely caused by jurisdiction-
wide publicity of the presence of cameras and the fact that the general public does not know the
exact RLC location (Persaud et al., 2005). Many studies (Retting et al., 1999a; Retting et al.,
1999b; Persaud et al., 2005; Hobeika and Yaungyai, 2006; Martinez and Porter, 2006; Høye,
2013) confirmed that the spillover effect is significant and needs to be included in RLC
performance evaluations.
For example, Persaud et al. (2005) adopted the empirical Bayesian method to estimate the
spillover effect by calculating the difference between the expected number of crashes and the

10
number of actual crashes reported in the after period at similar intersections without cameras
near the monitored RLC intersections. Høye (2013) used meta-analysis to evaluate the spillover
effect by comparing crash statistics from the non-RLC approaches of RLC intersections with
those from nearby non-RLC intersections. Such studies consistently agreed upon the existence of
the spillover effect.
2.5 Summary
Regardless of certain methodological deficiencies and potential poor data quality issues, the
following conclusions were observed from the existing RLC evaluation studies:
- RLC-deployment in most scenarios helped reduce side-impact crashes.
- The impact on rear-end collisions could be either positive or negative, and the underlying
reasons are yet to be investigated by the traffic community.
- For the RLC program to achieve the anticipated level of effectiveness, rigorous
guidelines must be developed.
- Both regression to mean and the spillover effects should be considered in evaluations.

11
Table 2: List of Cities/Counties/Papers where RLC is Effective on both Rear-End and Side-
Impact Crashes
Types
of
studies
City/County State Method
Before
Period
(Year)
After Period
(Year)
Total Period
(Year)
No.
of int.
Effectiveness
Side-
Impact
Left
Turn
Rear
End
Total (all
kinds of
crashes)
Reports
Brooksville
(2014) FL
Naïve
Before &
After Analysis
1 1 -- 7 Y -- Y Y
Clermont (2014)
FL
Naïve
Before & After
Analysis
1 1 -- 4 Y -- Y Y
Davie (2014)
FL
Naïve
Before & After
Analysis
1 1 -- 1 Y -- Y Y
Miami
(2014) FL
Naïve Before &
After
Analysis
1 1 -- 50 Y -- Y N
Pinecrest
(2014) FL
Naïve Before &
After
Analysis
1 1 -- 4 Y -- Y Y
Council
Bluffs
(2007)
IA Comparison and Control
3 1 -- 541 Y -- Y Y
Davenport
(2007) IA
Empirical
Bayesian 3 2 -- 451 Y -- Y Y
Comparison
and Control 3 2 -- 451 Y -- Y Y
Howard2
(2007) MD
Naïve
Before & After
Analysis
-- -- 10 25 Y -- Y Y
Portland
(2005) OR
Naïve Before &
After
Analysis
4 4 -- 5 Y -- Y Y
Knoxville
(2009) TN
Naïve
Before &
After Analysis
1 1 -- 15 Y -- Y Y
Austin
(2015) TX
Naïve
Before &
After Analysis
1.5 7 -- 11 Y Y Y Y
1 Control site 2 County

12
Table 3: List of Cities/Counties/Papers where RLC is Effective only on Side-Impact
Crashes
Types of
studies
Author/City
/County State Method
Before
Period
(Year)
After
Period
(Year)
Total
Period
(Year)
No.
of int.
Effectiveness
Side-
Impact
Left
Turn
Rear
End
Total (all kinds of
crashes)
Reports
Phoenix (2005)
AZ Empirical Bayesian
3 2 -- 10 Y N N N
Scottsdale
(2005) AZ
Empirical
Bayesian 6 to 13 1 to 6 -- 14 Y N N Y
San Diego
(2002) CA
Naïve Before & After
Analysis
3 3 -- 19 Y -- N N
New Castle1,
Sussex1, Newark,
Elsmere, Dover,
Seaford (2015)
DL Naïve Before
& After
Analysis
3 9 -- 30 Y -- N N
Apopka (2014) FL
Naïve Before
& After
Analysis
1 1 -- 4 Y -- N N
Boynton Beach
(2014) FL
Naïve Before & After
Analysis
1 1 -- 4 Y -- N N
Campbellton
(2014) FL
Naïve Before & After
Analysis
1 1 -- 1 Y -- N Y
Fort Lauderdale
(2014) FL
Naïve Before & After
Analysis
1 1 -- 14 Y -- N N
Manatee1 (2014) FL
Naïve Before
& After Analysis
1 1 -- 6 Y -- N N
New Port
Richey (2014) FL
Naïve Before
& After Analysis
1 1 -- 5 Y -- N N
Ocoee (2014) FL
Naïve Before
& After
Analysis
1 1 -- 2 Y -- N Y
Palatka (2014) FL
Naïve Before
& After
Analysis
1 1 -- 6 Y -- N N
Palm Beach1
(2014) FL
Naïve Before & After
Analysis
1 1 -- 5 Y -- N N
Sarasota (2014) FL Naïve Before
& After
Analysis
1 1 -- 8 Y -- N N
West Park
(2014) FL
Naïve Before
& After Analysis
1 1 -- 5 Y -- N Y
Lafayette (2010) LA E-test 1 1 -- 6 Y -- N -
Greensboro
(2004) NC
Comparison and control
2.4 2.3 -- 18
2852 Y Y N Y
Newark (2012) NJ
Naïve Before
& After Analysis
1 1 -- 24 Y -- N N
Suffolk1 (2014) NY
Naïve Before
& After
Analysis
3 0.16
to 3.33 -- 104 Y -- N Y
Amarillo (2015) TX
Naïve Before
& After
Analysis
1.5 6 -- 4 Y N N Y
Denton (2015) TX Naïve Before
& After
Analysis
1.5 6 -- 2 Y Y N Y

13
Diboll (2015) TX
Naïve Before
& After
Analysis
1.5 2 -- 4 Y N N N
Frisco (2015) TX
Naïve Before
& After Analysis
1.5 6 -- 4 Y Y N Y
Mesquite (2015) TX
Naïve Before
& After Analysis
1.5 6 -- 7 Y Y N Y
Port Lavaca (2015)
TX
Naïve Before
& After
Analysis
1.5 4 -- 6 Y Y N Y
Fairfax (2010) VA Empirical
Bayesian -- -- 7 5 Y -- N Y
Falls Church
(2010) VA
Empirical
Bayesian -- -- 7 3 Y -- N N
Vienna (2010) VA Empirical
Bayesian -- -- 7 3 Y -- N Y
Published
papers
Ahmed (2015) -- Empirical
Bayesian 3 3 -- 25 Y Y N --
Council (2005) -- Empirical
Bayesian -- -- 9 132 Y -- N --
Erke (2009) -- Meta-
analysis -- -- -- -- Y -- N N
Hadayeghi
(2007) --
Empirical
Bayesian -- -- 5 447 Y -- N --
Høye (2013) -- Meta-
analysis -- -- -- -- Y -- N N
Ko (2013) -- Empirical
Bayesian -- -- 1 to 4 254 Y -- N --
Ng (1997) -- Comparison and Control
3 3 -- 42 422
Y -- N Y
Radalj (2001) --
Naïve Before
& After
Analysis
-- -- 5 58 Y -- N Y
Retting (2002) -- Regression 2.5 2.5 -- 11 Y -- N Y
Shin (2007) -- Empirical
Bayesian -- -- --
60 to
156 Y -- N --
1 County 2Control site
Table 4: List of Cities/Papers where RLC is Effective only on Rear-End Crashes
Types of
studies Author/City State Method
Before Period
(Year)
After Period
(Year)
No.
of int.
Effectiveness
Side-
Impac
t
Rear End
Total
(all kinds of
crashes)
Reports Houston (2015)
TX Naïve Before & After Analysis
3 1 50 N Y N
Published
papers Cunningham --
Comparison and Control
5 4 14 N Y Y

14
Table 5: List of Cities/Counties/Papers where RLC Shows no Effectiveness or Negative
Effects
Types of
studies
Author/City
/County
Stat
e Method
Before
Period
(Year)
After
Period
(Year)
Total
Period
(Year)
No.
of
int.
Effectiveness
Side-
Impact
Left
Turn
Rear
End
Total (all
kinds of crashes)
Reports
Boca Raton (2014)
FL Naïve Before & After Analysis
1 1 -- 6 N -- N N
Clewiston
(2014) FL
Naïve Before &
After Analysis 1 1 -- 2 N -- N N
Jacksonville (2014)
FL Naïve Before & After Analysis
1 1 -- 23 N -- N N
Lakeland
(2014) FL
Naïve Before &
After Analysis 1 1 -- 5 N -- N N
Maitland (2014)
FL Naïve Before & After Analysis
1 1 -- 1 N -- N Y
Miami Beach
(2014) FL
Naïve Before &
After Analysis 1 1 -- 5 N -- N N
Miami Springs
(2014)
FL Naïve Before &
After Analysis 1 1 -- 1 N -- N N
Orange1
(2014) FL
Naïve Before &
After Analysis 1 1 -- 26 N -- N N
Orlando
(2014) FL
Naïve Before &
After Analysis 1 1 -- 5 N -- N N
Osceola1
(2014) FL
Naïve Before &
After Analysis 1 1 -- 11 N -- N N
Palm Coast
(2014) FL
Naïve Before &
After Analysis 1 1 -- 24 N -- N N
Sunrise (2014)
FL Naïve Before & After Analysis
1 1 -- 7 N -- N N
Tamarac
(2014) FL
Naïve Before &
After Analysis 1 1 -- 8 N -- N N
Tampa
(2014) FL
Naïve Before &
After Analysis 1 1 -- 8 N -- N N
West Miami
(2014) FL
Naïve Before &
After Analysis 1 1 -- 1 N -- N N
Bedford (2015)
TX Naïve Before & After Analysis
1.5 7 -- 3 N N N N
Cleveland
(2015) TX
Naïve Before &
After Analysis 1.5 6 -- 3 N Y N Y
Garland (2015)
TX Naïve Before & After Analysis
1.5 6 -- 4 N N N N
Haltom City
(2015) TX
Naïve Before &
After Analysis 1.5 5 -- 3 N N N N
Richland Hills (2015)
TX Naïve Before & After Analysis
1.5 4 -- 2 N N N N
University
Park (2015) TX
Naïve Before &
After Analysis 1.5 5 -- 2 N N N N
Willis (2015) TX Naïve Before & After Analysis
1.5 6 -- 3 N N N N
Arlington
(2010) VA
Empirical
Bayesian -- -- 7 1 N -- N N
Fairfax1
(2010) VA
Empirical Bayesian
-- -- 7 13 N -- N Y
Published
papers
Claros
(2017) --
Empirical
Bayesian 2 2 -- 24 N -- N N
1 County
15
Before-and-After Comparison of the RLC’s Effectiveness
3.1 Introduction
The purpose of the before-and-after comparison was to determine if the RLC deployments in
Maryland had the same effect on side-impact crashes and rear-end collisions as reported in the
literature and other states. Any discrepancy revealed may help traffic professionals to identify
potential contributing factors to undesirable RLC effects (e.g., increasing rear-end collisions),
and to design an effective intersection safety improvement program.
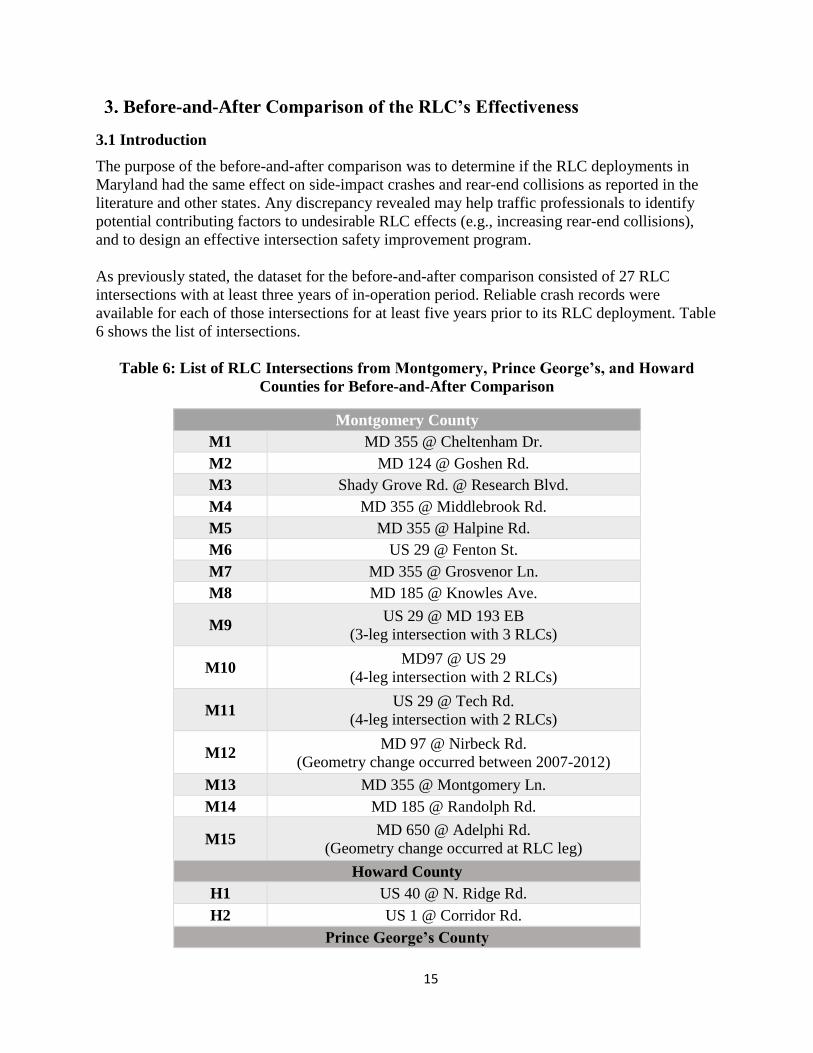
As previously stated, the dataset for the before-and-after comparison consisted of 27 RLC
intersections with at least three years of in-operation period. Reliable crash records were
available for each of those intersections for at least five years prior to its RLC deployment. Table
6 shows the list of intersections.
Table 6: List of RLC Intersections from Montgomery, Prince George’s, and Howard
Counties for Before-and-After Comparison
Montgomery County
M1 MD 355 @ Cheltenham Dr.
M2 MD 124 @ Goshen Rd.
M3 Shady Grove Rd. @ Research Blvd.
M4 MD 355 @ Middlebrook Rd.
M5 MD 355 @ Halpine Rd.
M6 US 29 @ Fenton St.
M7 MD 355 @ Grosvenor Ln.
M8 MD 185 @ Knowles Ave.
M9 US 29 @ MD 193 EB
(3-leg intersection with 3 RLCs)
M10 MD97 @ US 29
(4-leg intersection with 2 RLCs)
M11 US 29 @ Tech Rd.
(4-leg intersection with 2 RLCs)
M12 MD 97 @ Nirbeck Rd.
(Geometry change occurred between 2007-2012)
M13 MD 355 @ Montgomery Ln.
M14 MD 185 @ Randolph Rd.
M15 MD 650 @ Adelphi Rd.
(Geometry change occurred at RLC leg)
Howard County
H1 US 40 @ N. Ridge Rd.
H2 US 1 @ Corridor Rd.
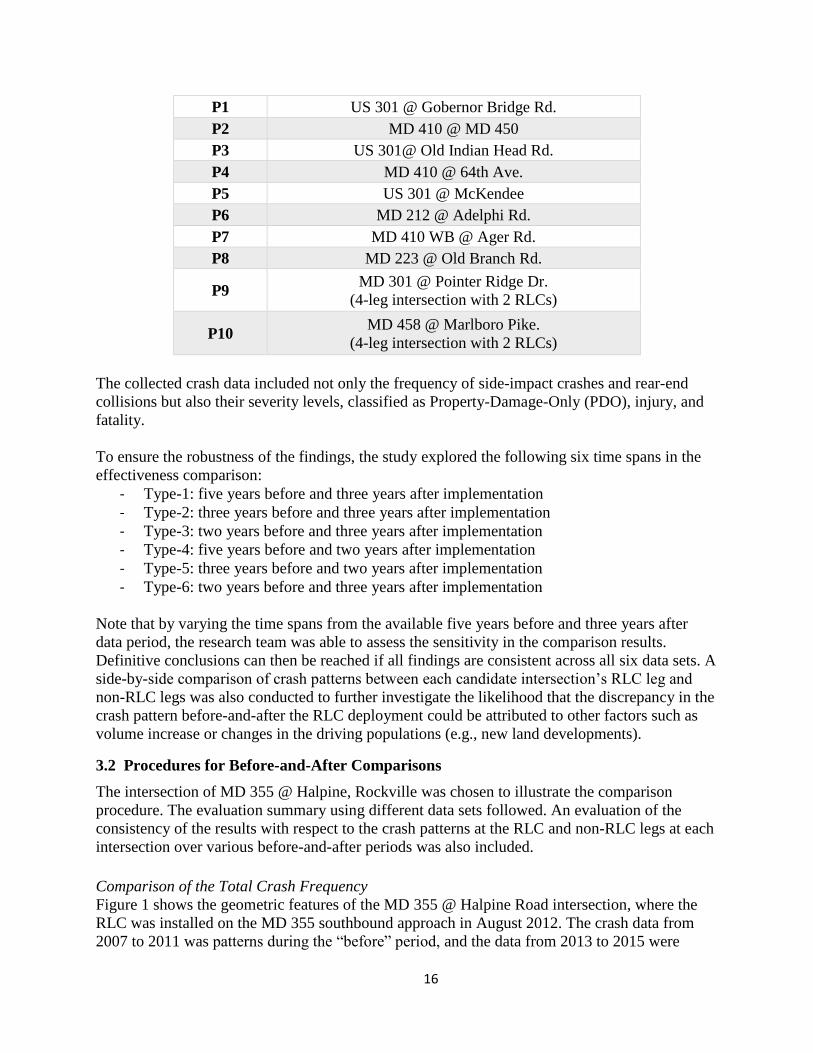
Prince George’s County
16
P1 US 301 @ Gobernor Bridge Rd.
P2 MD 410 @ MD 450
P3 US 301@ Old Indian Head Rd.
P4 MD 410 @ 64th Ave.
P5 US 301 @ McKendee
P6 MD 212 @ Adelphi Rd.
P7 MD 410 WB @ Ager Rd.
P8 MD 223 @ Old Branch Rd.
P9 MD 301 @ Pointer Ridge Dr.
(4-leg intersection with 2 RLCs)
P10 MD 458 @ Marlboro Pike.
(4-leg intersection with 2 RLCs)
The collected crash data included not only the frequency of side-impact crashes and rear-end
collisions but also their severity levels, classified as Property-Damage-Only (PDO), injury, and
fatality.
To ensure the robustness of the findings, the study explored the following six time spans in the
effectiveness comparison:
- Type-1: five years before and three years after implementation
- Type-2: three years before and three years after implementation
- Type-3: two years before and three years after implementation
- Type-4: five years before and two years after implementation
- Type-5: three years before and two years after implementation
- Type-6: two years before and three years after implementation
Note that by varying the time spans from the available five years before and three years after
data period, the research team was able to assess the sensitivity in the comparison results.
Definitive conclusions can then be reached if all findings are consistent across all six data sets. A
side-by-side comparison of crash patterns between each candidate intersection’s RLC leg and
non-RLC legs was also conducted to further investigate the likelihood that the discrepancy in the
crash pattern before-and-after the RLC deployment could be attributed to other factors such as
volume increase or changes in the driving populations (e.g., new land developments).
3.2 Procedures for Before-and-After Comparisons
The intersection of MD 355 @ Halpine, Rockville was chosen to illustrate the comparison
procedure. The evaluation summary using different data sets followed. An evaluation of the
consistency of the results with respect to the crash patterns at the RLC and non-RLC legs at each
intersection over various before-and-after periods was also included.
Comparison of the Total Crash Frequency
Figure 1 shows the geometric features of the MD 355 @ Halpine Road intersection, where the
RLC was installed on the MD 355 southbound approach in August 2012. The crash data from
2007 to 2011 was patterns during the “before” period, and the data from 2013 to 2015 were

17
considered the “after” period. The traffic volume was relatively stable over the selected before
and after periods.
Figure 1: Geometric Features of the MD355@Halpine Intersection
Figure 2 shows the crash data at the RLC and non-RLC approaches during the before and after
periods at the intersection of MD 355 @ Halpine Road using the actual annual frequency as the
baseline measurement. It is obvious from the displayed patterns that the average crash frequency
varied depending on the time span selected. For example, if the crash data from the two years
before period was used as the baseline to compare to the three-year crash data in the after period,
then the conclusion was either “no change” or “an increase” in the frequencies of side-impact
crashes. A quite different conclusion, however, was reached if the crash data from the five years
before period is used. For this reason, this study restructured the data from five years before and
three years after installation into the six time span combinations.
Figure 2: Frequency Distribution of Side-Impact Crashes and Rear-End Collisions during
the Before-and-After Period at MD 355 @ Halpine Intersection

18
Figure 3 illustrates the frequency distribution of such crash data at the RLC and non-RLC
approaches using the one year before period as the baseline. Figure 4 displays the same
frequency distribution using the two years before period as the baseline. Figure 5 presents three
years before period results.
Figure 3: Before-and-After Analysis of Crash Frequency at MD 355 @ Halpine
Intersection (using the data in the year before the RLC deployment as the basis for
comparison)
Figure 4: Before-and-After Analysis of Crash Frequency at MD 355 @ Halpine
Intersection (using the average of two years before the RLC deployment as the basis for
comparison)

19
Figure 5: Before-and-After Analysis of Crash Frequency at MD 355 @ Halpine
Intersection (using the average of three years before the RLC deployment as the basis for
comparison)
Comparison of the Frequency and Severity Levels
To further assess the impact of the RLC deployment on traffic safety, a before-and-after analysis
on the severity levels was performed. The analysis procedures were identical to the before-and-
after analysis on crash frequency. The crashes were classified as property-damage-only (PPO),
injury and fatality severity levels.
Comparison of the Crash Patterns at Each Intersection’s RLC and Non-RLC Approaches
Instead of using the total number of side-impact crashes or rear-end collisions at each
intersection during the before-and-after period, it was essential to determine if any detected
significant discrepancy was due to the presence of the RLC on the specific intersection approach.
To investigate this critical issue, this study took the following steps:
Step-1: classified the side-impact crashes and rear-end collisions at each intersection by
whether they were on the RLC-leg or non-RLC legs;
Step-2: conducted before-and-after comparison for the side-impact crashes on the RLC-leg;
Step-3: conducted before-and-after comparison for the side-impact crashes on the non-RLC-
legs;
Step-4: performed a consistency comparison between RLC and non-RLC legs;
Step-5: repeated the steps above to analyze the rear-end collision data and proceeded with the
consistency comparison.
It is possible one may not be able to definitively attribute the reduction in crash frequency to
RLC deployment if the data shows that the same changes in the crash patterns on both RLC and
non-RLC legs. In contrast, one may view the presence of RLC as having a positive effect on
reducing crashes if only the RLC-leg is shown to exhibit a statistically significant decreasing
pattern during the target period of comparison.
3.3 Summary of the Before-and-After Comparison Results
Table 7 shows the before-and-after comparison results. The results for both side-impact crashes
and rear-end collisions were consistent with those reported in the literature. At most intersections
(24 out of 27), a reduction in frequency of side-impact crashes occurred after RLCs were
deployed. Several intersections (i.e., three to nine, depending on the selected comparison time
period), showed an increase in such crash patterns during the “after” period. Note that none of

20
the existing studies offered any empirical evidence for such an inconsistency and most scholars
assumed that behaviors of the driving populations are likely to be the main contributing factor.
The most interesting finding in Table 7 is that a significant increase in rear-end collisions
occurred at 10 out of 27 of the intersections. Such negative effects were also observed in other
states and were recognized by researchers in the traffic community. However, well-accepted
hypotheses or behavioral theories to explain the inconsistencies have yet to be fully studied and
deserve further discussion.
Table 7: Before-and-After Analysis of the RLC’s Effects on the Crash Patterns under
Different Periods
Length
of
Before
| After
Summary for Side-Impact and Rear-End Crashes (RLC legs only)
Side-
Impact
Injury
Side-
Impact
PDO
Side-
Impact
Injury
Side-
Impact
PDO
Side-
Impact
Injury
Side-
Impact
PDO
Side-
Impact
Injury
Side-
Impact
PDO “Increase” “Increase” “Decrease” “Decrease” “Increase” “Decrease” “Decrease” “Increase”
B:5-yr|
A:3-yr
P3 H1AR, H2A, M1,
M2A, M5, M6,
M7, M8, M12, P2,
P4, P8
M13R, P10 M3, M4A, M11A,
M14, M15, P1, P5,
P6R, P7, P9R
B:3-yr|
A:3-yr
M3, P3, P10 H1R, H2, M1,
M2A, M5, M7,
M8, P1, P4
M6, M13R, P8 M4, M12, M14A,
M15, P2, P5, P6,
P7, P9,M11A
B:2-yr|
A:3-yr
M3, M5, P3, P10 H1, H2A, M2A,
M6, M8, M15,
P1R, P4
M1, M7, M12,
M13R, P8
M4R,
M14R,M11A,P2,
P5, P6, P7, P9R
B:5-yr|
A:2-yr
M9, P3 H1A, H2, M1,
M2A, M3, M5,
M6, M7, M8, P4A
M12, M13R, P8,
P10
M4A, M10, M14,
M15, P1, P2, P5,
P6, P7, P9,M11
B:3-yr|
A:2-yr
M9, M12, P3 H1, H2, M2A, M5,
M7, M8, P1, P4
M1, M3, M13R,
P8, P10
M4, M6, M10,
M14, M15, P2, P5,
P6, P7, P9, M11A
B:2-yr|
A:2-yr
M5, P3 H1, H2A, M2A,
M6, M8, P1, P4A
M1, M3, M7, M12,
M13R, P8, P10
M4R, M9, M10,
M14, M15, P2, P5,
P6, P7, P9, M11A A: Side-impact crashes significantly at the 90% confidence level R: Rear-End crashes significant at the 90% confidence level
AR: Both side-impact and rear-end crashes significant at the 90% confidence level.
Table 8 presents the results on the frequency of side-impact crashes classified by severity level.
Note that the category of fatalities was not included in the analysis due to issues with sample
size. The results showed that the deployment of a RLC had both positive and negative effects,
not only on the frequency of side-impact crashes but also on the severity level of such crashes.
For example, in the three years before and three years after comparison, there was a reduction in
side-impact crashes that resulted in injury and property damage only (PDO) at 17 out of 27
intersections. Four of 27 intersections had an increase in PDO side-impact crashes but a
reduction in injury side-impact crashes. Overall, the RLC deployment seems to have a positive

21
effect on reducing the severity level of side-impact crashes. The above findings are tentative in
nature and more empirical investigations on this issue should be conducted to reach more
definitive conclusions.
Table 8: Before-and-After Analysis of the RLC’s Effects on Side-Impact Crash Patterns by
Severity Level
Length
of
Before
| After
Summary for Side-Impact Crashes of Different Severity Levels (RLC legs only)
Side-
Impact
Injury
Side-
Impact
PDO
Side-
Impact
Injury
Side-Impact
PDO
Side-
Impact
Injury
Side-
Impact
PDO
Side-
Impact
Injury
Side-
Impact
PDO
“Increase” “Increase” “Decrease” “Decrease” “Increase
”
“Decrease
”
“Decrease
” “Increase”
B:5-yr|
A:3-yr P3
H1I, H2I, M1, M2IP,
M4I, M5, M8, M11I,
M15I, P1, P5P, P7, P9
M6, P6, P8, P10I
M3, M7, M12,
M13, M14, P2I,
P4
B:3-yr|
A:3-yr P3
H1, H2I, M1, M2, M4,
M5, M7, M8, M11I
M12, M14I, M15, P1,
P5, P6, P7, P9
M6, P8, P10I M3, M13, P2, P4
B:2-yr|
A:3-yr M1, M12, P3
H2IP, M2, M4, M8,
M11I, M14, M15P, P1,
P5, P7, P9
M5, M6, M7, P6,
P8, P10I
H1, M3, M13, P2,
P4
B:5-yr|
A:2-yr M9, M12, P3
H1I, H2, M2IP, M3,
M4I, M5, M8, M10,
M15, P5P, P9
M1, M6P, P1, P6,
P7, P8, P10I
M7, M11I , M13,
M14P, P2I, P4
B:3-yr|
A:2-yr M3, M9, P3
H1, H2, M2, M4, M5,
M10, M11I, M15, P5,
P7, P9
M1, M6, M8,
M12, P1, P6, P8,
P10I
M7, M13, M14I,
P2, P4
B:2-yr|
A:2-yr M1, M3, M12, P3
H2, M2, M4, M8, M9,
M10, M11I, M14, M15,
P1, P4, P5, P7, P9
M5, M6, M7, P6,
P8, P10I H1, M13, P2
I: Injury crashes significant at the 90% confidence level
P: PDO crashes significant at the 90% confidence level IP: Both injury and PDO crashes significant at the 90% confidence level
Table 9 shows the comparison results on the frequency of rear-end collisions classified by
severity level. Notably, all four categories of the before-and-after patterns contain approximately
the same number of intersections, reflecting the similar inconsistent effects of the presence of
RLC as in all the aforementioned analyses. For example, during the comparison period of five
years before and three years after deployment, an increase in rear-end collisions occurred at six
intersections, resulting in either PDO or injury, compared to a total of seven intersections that
had a significant reduction in frequency for both severity levels. Although a total of seven
intersections are classified in Table 9 as being associated with an increase in PDO, there was a
reduction in injury caused by rear-end collisions. No conclusion on the effect of RLC

22
deployment, either positively or negatively, on the frequency and severity of rear-end collisions
can be reached.
Table 9: Before-and-After Analysis of the RLC’s Effects on Rear-Collision Patterns by
Severity Level
Length
of
Before |
After
Summary for Rear-End Crashes of Different Severity Levels (RLC legs only)
Rear-
end.
Injury
Rear-
end.
PDO
Rear-
end.
Injury
Rear-
end.
PDO
Rear-
end.
Injury
Rear-
end.
PDO
Rear-
end.
Injury
Rear-
end.
PDO
“Increase” “Increase” “Decrease” “Decrease” “Increase” “Decrease” “Decrease” “Increase”
B:5-yr|
A:3-yr
M4, M11P, M14,
P3, P5, P7
H1I, M1, M2I, M5,
M6, M13, P8
H2P, M12, M15I,
P2, P4P
M3, M7, M8I, P1,
P6P, P9, P10
B:3-yr|
A:3-yr
M4, M11, M14,
P7, P10
H1I, M1, M2, M5,
M7, M8, M13, P1,
P8
H2P, M6, M12,
M15, P2, P3, P4 M3, P5, P6P, P9
B:2-yr|
A:3-yr
M4P, M14, P7,
P10
M1, M2, M7, M8,
M13, P1, P8
H2P,M5, M6,
M12, M15, P2, P3,
P4
H1, M3, M11P,P5,
P6, P9P
B:5-yr|
A:2-yr
M9, M10, M11,
M14, P5, P7
H1, M1, M2I, M3,
M13P, P4P, P8,
P10
H2P, M5, M6,
M12, M15P, P2
M4, M7, M8I, P1,
P3, P6, P9P
B:3-yr|
A:2-yr
M9, M10, M11,
M14, P2, P6, P7
H1, M1, M2, M3,
M13, P1, P4, P8
H2P, M5, M6,
M12, M15, P10
M4, M7, M8, P3,
P5, P9
B:2-yr|
A:2-yr
M9, M10, M14,
P2, P7
M1, M2, M3, M7,
M8, P1, P3, P4,
P8, P10
H2P, M5,
M6,M12, M15
H1, M4P, M11,
M13, P5, P6, P9
I: Injury crashes significant at the 90% confidence level
P: PDO crashes significant at the 90% confidence level
IP: Both injury and PDO crashes significant at the 90% confidence level
Comparison of the Crash Patterns at the RLC and non-RLC Legs
To further verify that the identified changes in the before-and-after comparison were most likely
due to the RLC deployment, as shown in Tables 10 and 11, this study investigated the side-by-
side patterns of the RLC and non-RLC legs using the same analyses over the same time periods.
In general, one may reasonably conclude that the RLC had a strong effect during the period of
interest when there was a significant change in side-impact crashes or rear-end collisions at RLC
legs only. Such a conclusion, however, must be subjected to further verification if the other
approaches, not deployed with the RLC, also experienced the same changes in frequency of
crash patterns.
Table 11 presents a side-by-side comparison of results for side-impact crashes at those
intersections in Howard, Montgomery, and Prince George counties. Based on the distribution of

23
positive and negative signs (which denote an increase or decrease from the before-and-after
comparison) among all table cells, there were 96 out of the 150 pairs (i.e., 25 intersections x 6
tests) of the before-and-after comparisons that were consistent with the previous evaluation
results of the RLC and non-RLC intersection legs.
Such empirical evidence appears to indicate that some factors, other than the RLC, were likely
contributors to the changing crash patterns. Another hypothesis is that the presence of a RLC in
one intersection approach may be causing a “spillover” effect for drivers from all other
approaches. This study was able to discern a similar pattern from the results shown in Table 10
for the same set of intersections with respect to rear-end collisions, where 78 out of the 150 pairs
of before-and-after analyses exhibit the consistent signs.
Table 10: Before-and-After Comparisons of the Rear-End Collision Pattern at RLC and
Non-RLC Legs
Site index
Summary for Rear-End Crash at RLC and Non-RLC Legs
Before |
After 5-yr | 3-yr
Before |
After 3-yr | 3-yr
Before |
After 2-yr | 3-yr
Before |
After 5-yr | 2-yr
Before |
After 3-yr | 2-yr
Before |
After 2-yr | 2-yr
H1 RLC - - - - - -
Non-RLC - - - - - -
H2 RLC - - - - - -
Non-RLC - - - - + -
M1 RLC - - - - - -
Non-RLC - - + - + +
M2 RLC - - - - - -
Non-RLC - - + + + +
M3 RLC + + + - - -
Non-RLC + + + + + +
M4 RLC + + + + + +
Non-RLC + - + - - +
M5 RLC - - + - - +
Non-RLC + + + - - -
M6 RLC - - + - + +
Non-RLC - - + + - +
M7 RLC - - - - - -
Non-RLC + + + - - -
M8 RLC - - - - - -
Non-RLC - - - - - -
M9c
RLC NAb NA
b NA
b + + +
Non-RLC NAb NA
b NA
b - - -
M10c
RLC NAb NA
b NA
b - + +
Non-RLC NAb NA
b NA
b + + +
M11d
RLC + + + + + +
Non-RLC NAa NA
a NA
a NA
a NA
a NA
a

24
M12 RLC - + - - + -
Non-RLC - - - - - -
M14 RLC + + + + + +
Non-RLC + + - + + -
M15 RLC + + - + + +
Non-RLC + + - - + +
P1 RLC + - - - - -
Non-RLC + + + + - +
P2 RLC - + + + + +
Non-RLC - - - - - -
P4 RLC - - - - - -
Non-RLC - - - - - -
P5 RLC + + + + + +
Non-RLC + + + + - -
P6 RLC + + + + + +
Non-RLC + + + - - -
P7 RLC + + + + + +
Non-RLC - - - - - -
P8 RLC - - - - - -
Non-RLC - - - - - -
P9d
RLC + + + + + + Non-RLC NA
a NA
a NA
a NA
a NA
a NA
a
1. “-” denotes the decreased crash rate after the RLC installation; “+” denotes the increased crash rate after the RLC installation; 2. “NAa” indicates the unavailability of crashes not involving vehicles from RLC legs (counted under “Non-RLC”);
3. “NAb” denotes the unavailability of such comparison since there are different number of RLCs in-service during the first 2 years of the “after”
and the 3rd year of the “after” (The crash data from the 3rd year of “after” need to use different comparison method);
4. “M9c / M10c” are the sites with multiple RLC installed but with different in-service date;
5. “M11d/ P9d” are the sites with no crashes observed from legs without RLC enforcement;
6. “RLC” summaries the crashes involving vehicles coming from the legs with RLC enforcement; 7. “Non-RLC” summaries the crashes not involving any vehicles coming from the legs with RLC enforcement;
8. Cells highlighted in yellow denotes the B/A difference significant at no less than 90% confidence level.
Table 11: Before-and-After Comparisons of the Side-Impact Crash Pattern at RLC and
Non-RLC Legs
Site index
Summary for Side-Impact Crash at RLC and Non-RLC Legs Before |
After 5-yr | 3-yr
Before |
After 3-yr | 3-yr
Before |
After 2-yr | 3-yr
Before |
After 5-yr | 2-yr
Before |
After 3-yr | 2-yr
Before |
After 2-yr | 2-yr
H1 RLC - - - - - - Non-RLC - - - - - -
H2 RLC - - - - - - Non-RLC - - - - - -
M1 RLC - - + - + + Non-RLC - - - - - -
M2 RLC - - - - - - Non-RLC - - + + - +
M3 RLC - + + - + +

25
Non-RLC - + + + - -
M4 RLC - - - - - - Non-RLC + - - + + -
M5 RLC - - + - - + Non-RLC - - + - - -
M6 RLC - + - - - - Non-RLC + + + - + +
M7 RLC - - + - - + Non-RLC + + + - - -
M8 RLC - - - - - - Non-RLC - - - - - -
M9c
RLC NAb NA
b NAb + + -
Non-RLC NAb NA
b NAb - + +
M10c
RLC NAb NA
b NAb - - -
Non-RLC NAb NA
b NAb - - -
M11d
RLC - - - - - - Non-RLC NA
a NAa NA
a NAa NA
a NAa
M12 RLC - - + + + + Non-RLC + + + + + +
M14 RLC - - - - - - Non-RLC - - + - - +
M15 RLC - - - - - -
Non-RLC - - + - - -
P1 RLC + - - - - -
Non-RLC + + + + - +
P2 RLC - + + + + +
Non-RLC - - - - - -
P4 RLC - - - - - -
Non-RLC - - - - - -
P5 RLC + + + + + +
Non-RLC + + + + - -
P6 RLC + + + + + +
Non-RLC + + + - - -
P7 RLC + + + + + +
Non-RLC - - - - - -
P8 RLC - - - - - -
Non-RLC - - - - - -
P9d
RLC + + + + + + Non-RLC NA
a NAa NA
a NAa NA
a NAa
1. “-” denotes the decreased crash rate after the RLC installation; “+” denotes the increased crash rate after the RLC installation; 2. “NAa” indicates the unavailability of crashes not involving vehicles from RLC legs (counted under “Non-RLC”);
3. “NAb” denotes the unavailability of such comparison since there are different number of RLCs in-service during the first 2 years of
the “after” and the 3rd year of the “after” (The crash data from the 3rd year of “after” need to use different comparison method);

26
4. “M9c / M10c” are the sites with multiple RLC installed but with different in-service date;
5. “M11d/ P9d” are the sites with no crashes observed from legs without RLC enforcement;
6. “RLC” summaries the crashes involving vehicles coming from the legs with RLC enforcement;
7. “Non-RLC” summaries the crashes not involving any vehicles coming from the legs with RLC enforcement; 8. Cells highlighted in yellow denotes the B/A difference significant at no less than 90% confidence level.
3.4 Summary
Section 3 presented the results of several before-and-after crash analyses of 27 RLC
intersections. Overall, the findings were consistent with those reported in the traffic literature,
which confirms that the presence of RLC at an intersection can either increase or decrease side-
impact crashes and rear-end collisions, depending on other contributing factors that have not yet
been empirically verified by the traffic safety community. Even though there were discrepancies
in the before-and-after evaluation results across 27 intersections, the general effects of the RLC
deployment on traffic safety can be summarized below.
- There were significant reductions in side-impact crashes at most RLC intersections.
- Approximately equal percentage of RLC intersections had an increase or decrease in the
rear-end collisions.
- A small percentage of RLC intersections seem to have an increase in both rear-end
collisions and side-impact crashes.
Conceivably, the concerns about the use of RLC and their potential negative effects can be
mitigated if the traffic safety community can identify those additional contributing factors that
cause more rear-end collisions at some intersections. Initial efforts from this project to address
this issue are presented in the next section.
27
Empirical Observations of Driver Characteristics at RLC-deployed
Intersections
4.1 Design of Field Observation Plans
As discussed in the previous section, the before-and-after analysis of crash frequency at 27
Maryland RLC intersections showed that the rear-end collisions or side-impact crashes may be
reduced, increased, or unchanged, despite the finding that fewer side-impact crashes and a slight
increase in rear-end collisions were reported at many such intersections.
Such discrepancies of the effectiveness of RLC clearly show the need to better understand the
influence of their presence on driving behaviors, such as driver responses when approaching the
intersection or encountering the yellow phase. Measures of effectiveness (MOE), other than
crash frequency, should also be considered when assessing the effectiveness of an RLC
deployment. Therefore, this study extended the scope to include a two-stage field observation:
Stage-I: observations of driver behaviors at two RLC intersection clusters. Each cluster
include a RLC intersection and its downstream and upstream intersections.
Stage-II: observations of driver behaviors at two additional RLC intersections to verify
any findings from Stage-1 results.
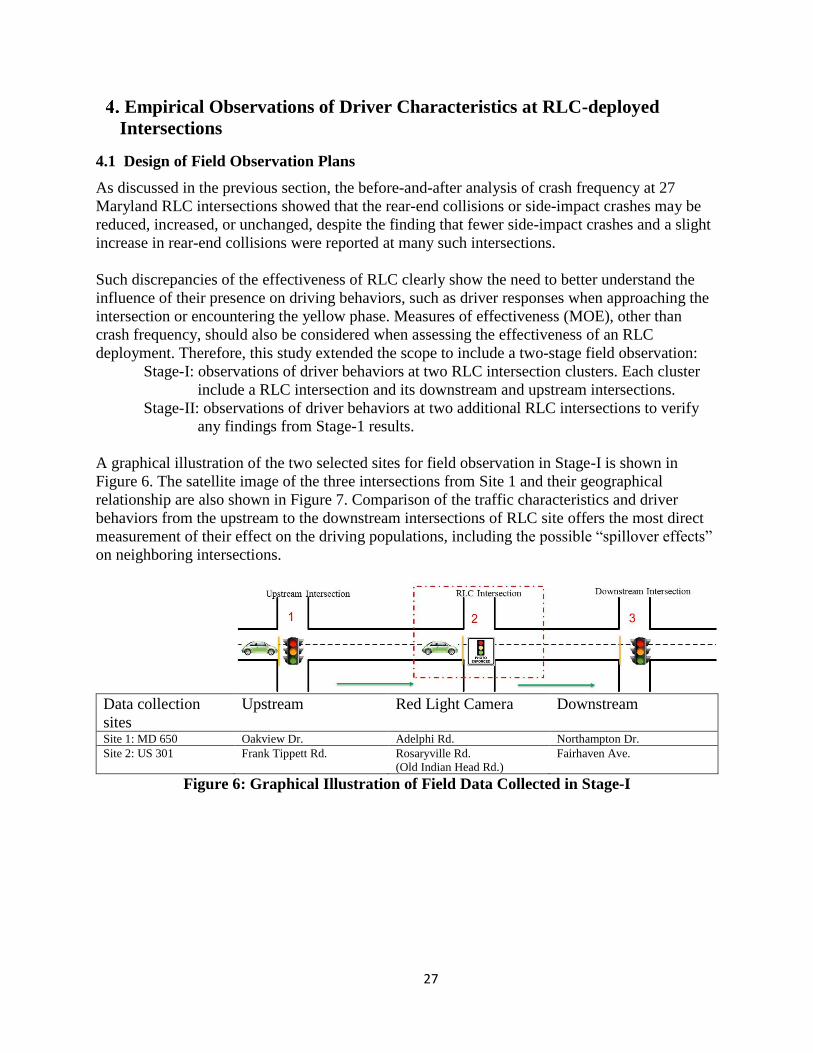
A graphical illustration of the two selected sites for field observation in Stage-I is shown in
Figure 6. The satellite image of the three intersections from Site 1 and their geographical
relationship are also shown in Figure 7. Comparison of the traffic characteristics and driver
behaviors from the upstream to the downstream intersections of RLC site offers the most direct
measurement of their effect on the driving populations, including the possible “spillover effects”
on neighboring intersections.
Data collection
sites
Upstream Red Light Camera Downstream
Site 1: MD 650 Oakview Dr. Adelphi Rd. Northampton Dr.
Site 2: US 301 Frank Tippett Rd. Rosaryville Rd.
(Old Indian Head Rd.)
Fairhaven Ave.
Figure 6: Graphical Illustration of Field Data Collected in Stage-I

28
Figure 7: Overview of all Three Intersections in MD650 and their Geographical
Relationships
Note that the Site 1 RLC intersection of MD 650 @ Adelphi Road was defined as “RLC-
effective” to reflect its reduction in side-impact crashes (see Table 7). The Site 2 RLC
intersection of US 301 @ Rosaryville Road (Old Indian Head Road) was defined as the “RLC-
ineffective” intersection (no change or even a minor increase in side-impact crashes). The
following is a list of key traffic characteristics and behavioral data collected from these two RLC
intersection clusters:
- the speed of approaching vehicles during the green and yellow phases;
- speed evolution of each individual vehicle at distances of 100, 250, 400, and 550 feet
from the intersection stop line;
- distance to the stop line when a driver decides to stop during a yellow phase;
- each individual driver’s decision to stop or pass during a yellow phase, given the detected
approaching speed and distance to the intersection;
- the speed, acceleration, or deceleration rate of each approaching vehicle when
encountering a yellow phase;
- The number of vehicles crossing the intersection during the all-red and/or the red phase
per cycle; and
- the time stamp during the yellow or the all-red/red phase when a “passing” vehicle
traverses the intersection stop line.
Stage-II included two individual RLC intersections: MD 410 @ MD 450 and MD 97 @ MD 28.
The former is a “RLC-effective” intersection experiencing a reduction in the side-impact crash
frequency after the RLC deployment, while the latter is a “RLC-ineffective” intersection
experiencing indiscernible changes in the pattern of side-impact crashes.
4.2 Empirical Findings Regarding the Effects of RLC Deployment
Although the collected driver behavioral data contained quite valuable information for various
traffic engineering studies, the results discussed below include only those findings which are
applicable to following vital questions:
- What are the likely effects of a RLC-deployment on traffic safety and driver behavior?
- Does the “spillover” effect from RLC-deployment actually exist?

29
- Is there a difference in traffic characteristics and driver responses to the yellow phase
between RLC-effective and RLC-ineffective intersections?
Approaching Speed Distributions
Tables 12 to 15 show the speed distributions of vehicles approaching the RLC intersections,
where aggressive drivers were defined as having an approaching speed of 10 mph over the
posted speed limit. The following empirical findings were observed on the percentage of
aggressive drivers:
- The percentage of aggressive drivers at the RLC-effective MD 650 intersection, 9.62%, is
much lower than the percentage of 39.81% at the RLC-ineffective US 301 intersection.
- Similar pattern was observed at the MD 410 intersection (RLC-effective, 6.37%) and the
MD 97 intersection (RLC-ineffective, 25.62%).
- The “spillover effect,” reflected in the reduced percentage of aggressive drivers, is
observed at the downstream intersections of both RLC-effective (i.e., from 9.62% to
7.77 % at the MD 650 intersection cluster) and RLC-ineffective sites (i.e., from 39.81%
to 6.41% at the US 301 intersection cluster).
- The presence of RLC seemed to have no effect on moderate and conservative drivers,
based on their percentages at the intersection clusters, as shown in Tables 12 and 13.
More observation is needed at additional RLC intersections to verify if the percentage of
aggressive drivers is a valuable proxy measure to the effectiveness of RLC on reducing side-
impact crashes.
Table 12: Distribution of Approaching Speeds at the MD 650 Intersection Cluster
MD 650 (effective in reducing side-impact crashes; speed limit: 40 MPH)
% of vehicle <40 mph 40 – 45 mph 45 – 50 mph >50 mph Average
Upstream
(N = 202) 71.29% 14.85% 12.87% 0.99% 35.3
RLC
(N = 104) 40.38% 36.54% 13.46% 9.62% 41.5
Downstream
(N = 103) 36.89% 33.98% 21.36% 7.77% 41.9
*The number in each parenthesis denotes the sample size.

30
Table 13: Distribution of Approaching Speeds at the US 301 Intersection Cluster
US 301 (Ineffective in reducing side-impact crashes; Speed limit: 55 MPH)
% of vehicle <55 mph 55 – 60 mph 60 – 65 mph >65 mph Average
Upstream
(N = 203) 25.12% 24.14% 30.54% 20.20% 59.1
RLC
(N = 206) 19.9% 16.02% 24.27% 39.81% 61.5
Downstream
(N = 457) 62.82% 19.23% 11.54% 6.41% 54.7
*The number in each parenthesis denotes the sample size.
Table 14: Distribution of Approaching Speeds at US 450
US 450 (effective in reducing side-impact crashes; speed limit: 45 MPH)
% of vehicle <45 mph 45 – 50 mph 50 – 55 mph >55 mph Average
RLC
(N = 157) 27.39% 33.12% 33.12% 6.37% 47.26
*The number in each parenthesis denotes the sample size.
Table 15: Distribution of approaching speeds at MD 97
MD 97 (ineffective in reducing side-impact crashes; speed limit: 50 MPH)
% of vehicle <50 mph 50 – 55 mph 55 – 60 mph >60 mph Average
RLC
(N = 203) 30.05% 22.66% 21.67% 25.62% 54.75
*The number in each parenthesis denotes the sample size.
Speed Change during the Yellow Phase
Table 16 presents the speed change statistics of moderate drivers when they progress through the
intersection clusters. By comparing the percentage of drivers with speed changes when
approaching the RLC and its downstream intersections, the following tentative conclusions can
be made:
- The percentage of moderate drivers who reduced their speeds when passing the
intersection during the yellow phase increased at the RLC intersections when comparing
to the one at downstream intersections (13% at MD 650 versus 7% at its downstream
intersection; 20% at US 301 versus 8% at its downstream intersection). It could be an
evidence of the RLC deployment’s spillover effect.

31
- The percentage of moderate drivers who accelerated when passing the intersection during
the yellow phase decreased at the RLC intersection when comparing to the one at
downstream intersections (12% at MD650 versus 36% at its downstream intersection; 5%
at US 301 versus 46% at its downstream intersection). It revealed the same empirical
evidence of the spillover effect.
- Most of the moderate drivers (57% at MD 650 and 46% at US 310) tended to maintain a
stable speed when passing an RLC-deployed intersection during the yellow phase, and
this percentage increased at the downstream intersections (75% at MD 650 and US 310).
Further comparison of the speed change statistics for aggressive drivers at these intersection
clusters revealed similar empirical evidence of the spillover effect at downstream intersections
(see Table 17).
Table 16: Speed Changes during the Yellow Phase: Moderate “Passing” Drivers
Site Intersection
Difference between the passing speed (at the stop line) and the
approaching speeds (700ft)
< -5mph Unchanged > 5mph
MD650
(Effective)
Upstream 46 % 43 % 11 %
RLC 7 % 57 % 36 %
Downstream 13 % 75 % 12 %
US310
(Ineffective)
Upstream 9 % 56 % 35 %
RLC 8 % 46 % 46 %
Downstream 20 % 75 % 5 %
Table 17: Speed Changes during the Yellow Phase: Aggressive “Passing” Drivers
Site Intersection
Difference between the passing speed (at the stop line) and the
approaching speeds (700ft)
< -10 mph Unchanged > 5mph
MD650
(Effective)
Upstream 6.7 % 20 % 10 %
RLC 29 % 36 % 7 %
Downstream 30 % 60 % 0 %
US310
(Ineffective)
Upstream 0 % 89 % 11 %
RLC 12 % 41 % 35 %
Downstream 40 % 20 % 0 %
Responses to the Yellow Phase
Aside from affecting the speed of approaching vehicles, RLC deployment can also have an
influence on a driver’s decision when encountering a yellow phase. Table 18 shows the
percentage of drivers who decided to stop based on their approaching speeds and distances from
the RLC effective MD 650 intersection. As expected, the percentage increased with the distance
from the intersection, but negatively correlated with the speed of approaching vehicles.
Table 19 presents a comparison between the RLC effective MD 650 intersection and its upstream
intersection. Table 20 shows the same comparison between its downstream and upstream
intersections.

32
Table 18: Percentage of Drivers Who Decide to Stop at the Yellow Phase at the MD 650
MD 650 Vehicle speed at the onset of Yellow (MPH)
RLC Intersection (N = 168) <35 35 ~ 45 45 ~ 55 >55
Vehicle’s distance-to-
stop-line at the onset of
yellow (feet)
<100 6% 0% 0% -
100 ~ 200 29% 14% 17% 0%
200 ~ 300 90% 76% 38% 0%
300 ~ 400 100% 100% 50% 0%
>400 100% - - -
Table 19: Comparison of Drivers Who Decide to Stop at MD 650 and its Upstream
Intersection
MD 650 Vehicle speed at the onset of Yellow (MPH)
% (RLC – Upstream) <35 35 ~ 45 45 ~ 55 >55
Vehicle’s distance-to-
stop-line at the onset
of yellow (feet)
<100 0% (14) 0% (14) 0% (4) -
100 ~ 200 50% (8) 13% (16) 10% (10) -
200 ~ 300 7% (15) 17% (6) -
300 ~ 400 0% (3) 0% (3) 17% (2) -
>400 - - - -
Table 20: Comparison of Drivers who Decide to Stop at the Downstream and Upstream
Intersections of the MD 650 Intersection
MD 650 Vehicle speed at the onset of Yellow (MPH)
% (Downstream – Upstream) <35 35 ~ 45 45 ~ 55 >55
Vehicle’s distance-to-
stop-line at the onset
of yellow (feet)
<100 7% (14) 0% (16) 0% (12) -
100 ~ 200 50% (2) -6% (7) 25% (4) -
200 ~ 300 - 13% (5) 33% (4) -
300 ~ 400 0% (3) 0% (2) 17% (2) -
>400 0% (1) 0% (8) 17% (6) 0% (2)
Findings from these three tables are summarized below:
- Statistics shown in Table 19 indicated that under identical scenarios more drivers would
likely stop when approaching an RLC intersection. For example, the percentage of
drivers who stopped when encountering a yellow phase at a speed of 35-45mph and a
distance of 100-200ft increased 13% from the upstream intersection to the RLC
intersection. It indicated that the presence of red-light cameras had a significant influence
on driving behavior.
- Statistics shown in Table 20 highlighted a similar pattern between the downstream and
upstream intersections, providing further evidence of “spillover effects” on driver
responses during a yellow phase. For example, the percentage of drivers who stopped
when encountering the yellow phase at a speed of 45-55mph and a distance of 200-300ft
increased 33% from the upstream intersection to the downstream intersection.

33
Tables 21 to 23 show the same statistics for the RLC-ineffective US 301 intersection, including
observations from both its upstream and downstream intersections. Some interesting results are
summarized below:
- Despite insignificant changes in the frequency of side-impact crashes after the RLC
deployment, there was a significant increase in the percentage of drivers who decided to
stop during the yellow phase at the RLC-intersection when compared to its upstream
intersection.
- The “spillover effect” was not observed at this RLC-ineffective intersection cluster.
- The inconsistent “spillover effect” observation between the RLC-effective and RLC-
ineffective cluster was likely due to localized driving behavioral differences: the RLC-
ineffective cluster had a much higher percentage of aggressive drivers who may less
likely be affected by the RLC deployment.
Table 21: Percentage of Drivers Who Decide to Stop at the Yellow Phase at US 301
US 301 Vehicle Speed at the Onset of Yellow (MPH)
RLC Intersection (N = 470) <35 35 ~ 45 45 ~ 55 55 ~ 65 65 ~ 75 75 ~ 85 >85
Vehicle’s
distance-to-
stop-line at the
onset of yellow
(feet)
<200 0% (2) 0% (1) 0% (3) 0% (10) 0% (14) 0% (2) 0% (1)
200 ~ 300 - 100% (1) 0% (4) 33% (6) 0% (10) - 0% (1)
300 ~ 400 - - 67% (3) 38% (13) 55% (11) 100% (1) 0% (1)
400 ~ 500 - - 89% (9) 79% (19) 63% (16) 100% (1) -
500 ~ 600 - - 85% (13) 100% (9) 100% (7) 100% (3) 50% (2)
600 ~ 700 - - 100% (4) 94% (18) 100%
(20) 100% (4) 100% (1)
>700 - - - 100% (9) 100% (8) 100% (2) -
* The number within the parenthesis is the sample size.
Table 22: Comparison of Drivers Who Decide to Stop at US 301 and its Upstream
Intersections
US 301 Vehicle Speed at the Onset of Yellow (MPH)
% (RLC – Upstream) <35 35 ~ 45 45 ~ 55 55 ~ 65 65 ~ 75 75 ~ 85 >85
Vehicle’s
distance-to-
stop-line at
the onset of
yellow (feet)
<200 - - - - - - -
200 ~ 300 - - -50% 33% - - -
300 ~ 400 - - 21% 25% 55% - -
400 ~ 500 - - 17% 8% 34% - -
500 ~ 600 - - -15% 0% 20% - -
600 ~ 700 - - 0% -6% 0% 0% -
>700 - - - 0% 0% 0% -

34
Table 23: Comparison of Drivers Who Decide to Stop at the Downstream and Upstream
Intersections of the US 301 Intersection
US 301 Vehicle Speed at the Onset of Yellow (MPH)
% (Downstream – Upstream) <35 35 ~ 45 45 ~ 55 55 ~ 65 65 ~ 75 75 ~ 85 >85
Vehicle’s
distance-to-
stop-line at
the onset of
yellow (feet)
<200 - - - - - - -
200 ~ 300 - - -50% 0% - - -
300 ~ 400 - - -14% 37% 0% - -
400 ~ 500 - 0% 29% -5% -29% - -
500 ~ 600 - 0% 0% -33% 20% - -
600 ~ 700 - - 0% 0% 0% 0% -
>700 - - - - - - -
Behavior of Aggressive Drivers during the All-Red and/or Red Phases
To better understand the effects of RLC on the behaviors of aggressive drivers, this study
analyzed the following statistics at the two intersection clusters:
- Percentage of drivers entering the intersection during the all-red or red phase:
o MD 650 cluster: 3.07% upstream, 2.69% at the RLC site, 2.74% downstream
o US 301 cluster: 9.21% upstream, 3.80% at the RLC site, 3.57% downstream
- Percentage of drivers entering the intersection one second before the all-red phase:
o MD 650 cluster: 17.18% upstream, 15.77% at the RLC site, 15.75% downstream
o US 301 cluster: 31.58% upstream, 15.19% at the RLC site, 17.86% downstream
From these statistics the following observations of RLC impacts can be made:
- The presence of a RLC indeed discouraged aggressive drivers from running a red light
(e.g., from 9.21% at upstream to 3.8% at the US 301 intersection).
- The “spillover effect” on red-light-running behavior did not extend to the downstream
intersection (the percentage remained steady there when compared to the RLC site). The
same pattern was found at the RLC-effective MD 650 intersection cluster.
- The observations on red-light-running reduction effect was further supported by the
percentage of drivers crossing over the stop line one second prior to the all-red phase at
both study sites (e.g., from 31.58% to 15.19% and 17.86% at the US301 cluster).
The total number of observed drivers who decided to pass when encountering a yellow phase
was 270 at the MD 650 cluster and 79 at the US 301 cluster.
Effects on the Dilemma Zone and Rear-End Collisions
According to both the literature and the before-and-after comparison of the 27 Maryland
intersections (see Section 3), a RLC deployment is likely to cause an increase in the frequency of
rear-end collisions. Researchers suspect that improper decisions made in the dilemma zones,
when the drivers notice the presence of the RLC, are likely to be a main contributor. This study
took the following steps to analyze this potential effect:
- Computed the changes in speeds and acceleration/deceleration rates of each vehicle
approaching during the yellow phase the two RLC intersection clusters;

35
- Estimated the spatial distribution of the dilemma zones within each approaching speed
category;
- Calculated the “must-go” and “must-stop” zones;
- Recorded the action of each observed driver and the vehicle’s distance from the stop line
when encountering the yellow phase;
- Calculated the percentages of drivers who decided to stop when they were within the
“must-go” zone and decided to pass when they were within the “must-stop” zone.
An illustration of the dilemma zone, the “must-go”, and the “must-stop” zones is shown in
Figure 8. Tables 24 and 25 show these distributions. Some findings are summarized below:
- The percentage of drivers who decided to stop when in the “must-go” zone was 12% at
the MD 650 intersection, 3.9% at the US 301 intersection, 10.1% at the MD 450
intersection, and 2.9% at the MD 97 intersection. Conceivably, this might cause rear-end
collisions.
- Only a relatively small percentage of drivers were observed to pass when in “must-stop”
zones. Such drivers, classified as aggressive driving populations, were at risk of causing
side-impact crashes.
- The percentage of drivers trapped in the dilemma zone at the RLC-ineffective US 301
intersection was much higher (37%) than the one at the RLC-effective MD 650
intersection (6.7%). A similar pattern was observed at the downstream intersections and
the two individual RLC intersections (13.5% at the RLC-effective MD 450 intersection
and 29.4% at RLC-ineffective MD 97 intersection).
-
Speed 50 mph
Must Stop Zone
Cannot Stop comfortably within 400 ft from stop lineCannot Clear the intersection safely
beyond 250 ft from stop line
Dilemma Zone
Must Go Zone
Figure 8: A Graphical Illustration of Dilemma Zone

36
Table 24: Comparison of Drivers who make Inappropriate Decisions during the Yellow
Phase between the MD 650 and US 301 Study Sites
Site Intersection
Choose to stop
within their
“must-go” zone
(rear-end
collision)
Choose to pass
within their
“must-stop” zone
(side-impact crash)
No. of
vehicles
trapped in
DZ
Total No. of
vehicles
encountering
the yellow
phase
MD 650
(Effective)
Upstream 0.4% (1) 5.9% (15) 23.7% (60) 253
RLC 12% (32) 0.7% (2) 6.7% (18) 267
Downstream 6.1% (12) 2.3% (5) 5.1% (10) 196
US 301
(Ineffective)
Upstream 0.5% (2) 0.9% (4) 30.1% (131) 435
RLC 3.9% (21) 1.3% (7) 37.4% (202) 540
Downstream 2.4% (7) 4.7% (14) 27.0% (80) 296 * The number within the parenthesis is the sample size.
Table 25: Comparison of Drivers who make Inappropriate Decisions during the Yellow
Phase between the MD 450 and MD 97 Study Sites
Site
Choose to stop within
their
“must-go” zone
(rear-end collision)
Choose to pass
within their
“must-stop” zone
(side-impact crash)
No. of vehicles
trapped in DZ
Total No. of
vehicles
encountering the
yellow phase
MD 450
(Effective) 10.11% (9) 1.12% (1) 13.48% (12) 89
MD 97
(Ineffective) 2.94% (4) 0.74% (1) 29.41% (40) 136
4.3 Summary of Empirical Evidences
The empirical findings associated with the effectiveness of RLC deployment were classified into
the following three categories:
Category-1: RLC Deployment’s Effectiveness and the Evidence of the Spillover Effect
In addition to RLC’s potential influence on crash frequency, the empirical studies revealed the
following positive effects on traffic safety:
- Reduction of aggressive driving at the RLC and its downstream intersections;
- Drivers were more inclined to reduce speed when passing the RLC and its downstream
intersections during the yellow phase;
- More drivers chose to stop when encountering the yellow phase at the RLC and its
downstream intersections;
- A decrease in the percentage of red-light-running and aggressive passing actions (i.e.,
entering the intersection one second ahead of the all-red phase) at the RLC and its
downstream intersections.

37
Category-2: Undesirable Effects of RLC Deployment
The following undesirable driver responses in the dilemma zones at the RLC intersections may
shed some light on the cause of a potential increase in rear-end collisions:
- Some drivers made improper decisions such as stopping in the “must-go” zone, or
passing in the “must-stop” zone;
- More drivers stop in the “must-go” zone at the RLC intersection when compared to the
upstream and downstream intersections.
Category-3: Characteristics of RLC-effective and Ineffective Intersections
The RLC-effective intersections differed from the RLC-ineffective intersections in the following
safety related statistics:
- A much lower percentage of aggressive driving populations (those who drove at 10 mph
over the posted speed limit);
- More drivers reduced their speeds when passing the RLC-effective intersection;
- An increase in the percentage of drivers who chose to stop when encountering a yellow
phase;
- A lower percentage of drivers trapped in their respective dilemma zones;
- A relatively lower percentage of drivers ran the light during the all-red and red phases.
These findings were based on observations of over 1,000 drivers at the eight intersections and a
video image processing tool was developed to extract and analyze the behavior data.

38
Conclusions and Recommendations
5.1 Conclusion
This study conducted a two-phase evaluation. Part I evaluated the effectiveness of RLC
deployments at 27 local intersections over the past decade, including a comparison with those
findings in the literature with respect to reducing rear-end collisions and side-impact crashes.
Based on the findings discussed in Part I, Part II investigated the impact that RLCs had on driver
behaviors, especially their responses to the yellow phase, based on field observations of more
than 1,000 drivers at two RLC intersection clusters (each includes an upstream, an RLC, and a
downstream intersection) and two individual RLC intersections.
Behavioral observations included drivers’ approaching speeds, acceleration/deceleration rates,
and their responses to a yellow phase. Findings confirmed the RLC deployment’s spillover effect
at the immediate downstream intersection. Evaluation results are summarized below:
- The literature review and Part I before-and-after studies confirmed that proper
implementation of the RLC program indeed reduced side-impact crashes, but not
rear-end collisions.
- Depending mostly on the characteristics of the local driving populations, the presence
of RLC may either increase or decrease the number of rear-end collisions.
- This program reduced the percentage of aggressive drivers at both the RLC and its
downstream intersections.
- A properly implemented RLC program has significant influence on driver behaviors.
For example, it was found that drivers were more likely to reduce their speed when
passing the RLC and its downstream intersections when encountering a yellow phase.
In addition, more drivers decided to stop when encountering a yellow phase.
- With an advanced warning sign placed at a proper distance ahead of the intersection,
RLC deployment was found to decrease the percentage of red-light-running vehicles
and drivers’ aggressive passing behaviors (i.e., entering the intersection one second
ahead of the all-red phase).
- RLCs were shown to have a spillover effect at the immediate downstream
intersections.
When implementing the RLC program, great care should be exercised to prevent some potential
negative effects on traffic safety. Failing to carefully follow the deployment guidelines such as
the one published by FHWA and only use the RLC as a last resort, such implementation may
cause some undesirable results. For example, the observed increase in stopping in a “must-go”
zone could potentially cause an increase in rear-end collisions. Overall, based on these findings
one can comfortably conclude that the positive effects from a properly implemented RLC
program generally outweigh any negatives.

39
5.2 Recommendations
Much remains to be done to ensure the success of the RLC program in different jurisdictions.
Some imperative tasks to be done first are listed below:
- Development of effective deployment guidelines that account for the behavioral
discrepancies among driving populations and locality-specific constraints.
- Observations of vehicle approaching speeds at a candidate RLC-intersection,
especially the percentage of aggressive drivers, should be analyzed along with the
intersection crash data before the deployment.
- For intersections with a high percentage of aggressive drivers, the responsible
transportation agency needs to implement certain safety strategies to reduce the
percentage of such drivers, to increase the probability of a successful RLC
deployment.
- Extensive field observations at both RLC and non-RLC intersections are essential for
the development of guidelines and design of control strategies.

40
References
1. Ahmed, Mohamed M., and M. Abdel-Aty. Evaluation and spatial analysis of automated red-
light running enforcement cameras. Transportation research part C: emerging technologies,
Vol. 50, 2015, pp. 130-140.
2. Maryland House of Delegates Commerce and Government Matters Committee. Automated
Enforcement Review: Red-Light Running Detection Camera Systems, Howard County,
MD., Annapolis, Jan. 2001.
3. Bochner, B., and T. Walden. Effectiveness of red light cameras. A Texas Transportation
Institute White Paper, 2010.
4. Bochner, B., and T. Walden. Effectiveness of Red-Light Cameras. Institute of
Transportation Engineers. ITE Journal, Vol. 80, No. 5, 2010, pp. 18-24.
5. Burchfield, R. M. Red Light Running Camera Program Biennial Report. City of Portland.
2005.
6. Burkey, M. L. and K. Obeng. A detailed investigation of crash risk reduction resulting from
red light cameras in small urban areas. Transportation Institute, North Carolina Agricultural
& Technical State University, 2004.
7. Burris, M. W., and R. Apparaju. Assessment of Automated Photo Enforcement Systems for
Polk County Signalized Intersection Safety Improvement Project. University of South
Florida, Center for Urban Transportation Research, 1998.
8. Chatterjee, A. and M. A. Cate. Issues and impact of red light camera and automated speed
enforcement. The University of Tennessee, Knoxville, 2009.
9. Claros, B., C. Sun, and P. Edara. Safety effectiveness and crash cost benefit of red light
cameras in Missouri. Traffic injury prevention, Vol. 18, No. 1, 2017, pp. 70-76.
10. Cohan, J. Electronic Red Light Safety Program Report for CY 2015. Delaware Department
of Transportation, 2015.
11. Council, F. M., B. N. Persaud, K. A. Eccles, C. Lyon, and M. S. Griffith. Safety evaluation
of red-light cameras. Publication FHWA-HRT-05-048. FHWA, U.S. Department of
Transportation, 2005.
12. Council, F., B. Persaud, C. Lyon, K. Eccles, M. Griffith, E. Zaloshnja, and T. Miller.
Implementing red light camera programs: guidance from economic analysis of safety
benefits. In Transportation Research Record: Journal of the Transportation Research Board,
No. 1922, Transportation Research Board of the National Academies, Washington, D.C.,
2005, pp. 38-43.
13. Cunningham, C. M., and J. E. Hummer. Evaluating the Use of Red Light Running
Photographic Enforcement Using Collisions and Red Light Running Violations. North
Carolina Governors Highway Safety Program, 2005.
14. Cunningham, C. M., and J. E. Hummer. Evaluating the Effectiveness of Red-Light Running
Camera Enforcement in Raleigh, North Carolina. Journal of Transportation Safety &
Security, Vol. 2, No. 4, 2010, pp.312-324.
15. Dahnke, R.A., Stevenson, B.C., Stein, R.M., and T. Lomax. Evaluation of the City of
Houston Digital Automated Red Light Camera Program, 2008.
16. Decina, L. E., L. Thomas, R. Srinivasan, and L. Staplin. Automated enforcement: A
compendium of worldwide evaluations of results. Publication HS-810 763. Washington,
DC: National Highway Traffic Safety Administration, 2007.
17. Delaware Department of Transportation. Electronic Red Light Safety Program Intersection
Selection Process, Jan. 2016.

41
18. Erke, A. Red light for red-light cameras? A meta-analysis of the effects of red-light cameras
on crashes. Accident Analysis & Prevention, Vol. 41, No.5, 2009, pp. 897-905.
19. Fitzsimmons, E. J., S. Hallmark, T. McDonald, M. Orellana, and D. Matulac. The
Effectiveness of Iowa's Automated Red Light Enforcement Program, Final Report. Center
for Transportation and Education, Iowa State University, 2007
20. Fitzsimmons, E. J., S. L. Hallmark, T. J. McDonald, M. Orellana, D. Matulac, and M.
Pawlovich. The Use of Statistical Evaluations to Investigate the Effectiveness of Iowa’s
Automated Red Light Running Programs. In ITE 2008 Technical Conference and Exhibit,
2008.
21. Fleck, J. and B. Smith. Can we make red-light runners stop? Red-light photo enforcement in
San Francisco, California. In Transportation Research Record: Journal of the Transportation
Research Board, No. 1693, Transportation Research Board of the National Academies,
Washington, D.C., 1999, pp. 46-49.
22. Florida Department of Highway Safety and Motor Vehicles. Red light camera summary
report, 2014.
23. Frangos, G.E. Automated enforcement: 10-year evaluation red light running detection:
Howard County, Maryland. 2007.
24. Garber, N. J., J. S. Miller, R. E. Abel, S. Eslambolchi, and S. K. Korukonda. The impact of
red light cameras (photo-red enforcement) on crashes in Virginia.
Publication FHWA/VTRC 07-R2, Virginia Transportation Research Council, 2007.
25. Golob, J. M., Cho, S., Curry, J. P. and T. F. Golob. November. Impacts of the San Diego
photo red light enforcement system on traffic safety. In Presented at the 82nd Annual
Meeting of the Transportation Research Board, 2002.
26. Hadayeghi, A., B. Malone, J. Suggett, and J. Reid. Identification of intersections with
promise for red light camera safety improvement: application of generalized estimating
equations and Empirical Bayes. In Transportation Research Record: Journal of the
Transportation Research Board, No. 2019, Transportation Research Board of the National
Academies, Washington, D.C., 2007, pp. 181-188.
27. Hallmark, S., M. Orellana, T. McDonald, E. Fitzsimmons, and D. Matulac. Red light
running in Iowa: Automated enforcement program evaluation with Bayesian analysis. In
Transportation Research Record: Journal of the Transportation Research Board, No. 2182,
Transportation Research Board of the National Academies, Washington, D.C., 2010, pp. 48-
54.
28. Hobeika, A. and N. Yaungyai. Evaluation update of the red light camera program in Fairfax
County, VA. IEEE Transactions on intelligent transportation systems, Vol. 7, No. 4, 2006,
pp. 588-596.
29. Høye, A. Still red light for red light cameras? An update. Accident Analysis &
Prevention, Vol. 55, 2013, pp. 77-89.
30. Hu, W., A. T. McCartt, and E. R. Teoh. Effects of red light camera enforcement on fatal
crashes in large US cities. Journal of safety research, Vol. 42, No.4, 2011, pp. 277-282.
31. Iowa Department of Transportation, Automated Traffic Enforcement on the Primary Road
System, Aug. 2014.
32. Jones S., E. Tedla, and J. Lindly. Red Light Running Camera Implementation Guide.
Alabama Department of Transportation, 2015.
33. Ko, M., S. Geedipally, and T. Walden. Effectiveness and site selection criteria for red light
camera systems. In Transportation Research Record: Journal of the Transportation Research

42
Board, No. 2327, Transportation Research Board of the National Academies, Washington,
D.C., 2013, pp. 53-60.
34. Kriz, K., C. Moran, and M. Regan. An analysis of a red-light camera program in the city of
Milwaukee. The City of Milwaukee, Budget and Management Division, Department of
Administration, 2006.
35. Langland-Orban, B., E. E. Pracht, J. T. Large, N. Zhang and J. T. Tepas. Explaining
differences in crash and injury crash outcomes in red light camera studies. Evaluation & the
health professions, Vol. 39, No. 2, 2016, pp. 226-244.
36. Lee, Y., Z. Li, S. Zhang, S., A. M. Roshandeh, H. Patel and Y. Liu. Safety impacts of red
light running photo enforcement at urban signalized intersections. Journal of Traffic and
Transportation Engineering (English Edition), Vol. 1, No. 5, 2014, pp. 309-324.
37. Louisiana Department of Transportation and Development. Traffic enforcement systems
guide for local governments, Dec. 2010.
38. Malone, B., J. Suggett, and D. Stewart. Evaluation of the red light camera enforcement pilot
project. In ITE 2005 Annual Meeting and Exhibit Compendium of Technical Papers, 2005.
39. Manual on Uniform Traffic Control Devices for Streets and Highways, 2003 Edition,
Federal Highway Administration, Washington, DC, 2003.
40. McFadden, J. and H. W. McGee. Synthesis and evaluation of red light running automated
enforcement programs in the United States. Publication FHWA-IF-00-004. FHWA, U.S.
Department of Transportation, 1999.
41. McGee, H. W. and K. A. Eccles. Impact of red light camera enforcement on crash
experience–a synthesis of highway practice, Synthesis 310 Transportation Research Board.
Washington, D.C., 2003.
42. Mohamedshah, Y. M., L. W. Chen, and F. M. Council. Association of selected intersection
factors with red-light-running crashes. US Department of Transportation, Federal Highway
Administration, Research, Development, and Technology, Turner-Fairbank Highway
Research Center, 2000.
43. New Jersey Department of Transportation. Report on Red-Light Traffic Control Signal
Mominoring Systems Second Annual Report, Nov. 2012.
44. Ng, C. H., Y. D. Wong, and K. M. Lum. The impact of red-light surveillance cameras on
road safety in Singapore. Road and transport research, Vol. 6, No. 2, 1997, pp. 72-81.
45. Oregon Department of Transportation and Oregon Traffic Control Devices Committee. Red
light running (RLR) camera guidelines for state highways, 2015.
46. Persaud, B., F. Council, C. Lyon, K. Eccles, and M. Griffith. Multijurisdictional safety
evaluation of red light cameras. In Transportation Research Record: Journal of the
Transportation Research Board, No. 1922, Transportation Research Board of the National
Academies, Washington, D.C., 2005, pp. 29-37.
47. Popolizio, R. E. New York City's Red Light Camera Demonstration Program. In Institute of
Transportation Engineers, Annual Compendium of Technical Papers, 1995.
48. Post-Activation Reports. Texas Department of Transportation, 2009-2015.
www.txdot.gov/driver/laws/red-light/reports.html. Accessed November 10, 2016
49. Pulugurtha, S. S. and R. Otturu. Effectiveness of red light running camera enforcement
program in reducing crashes: Evaluation using “before the installation”,“after the
installation”, and “after the termination” data. Accident Analysis & Prevention. Vol. 64,
2014, pp. 9-17.
43
50. Radalj, T. and M. R. W. Australia. Evaluation of effectiveness of red light camera
programme in Perth. In Communication. Road safety research: policy and education
conference, Monash University, 2001.
51. Red light camera systems operational guidelines. Washington, DC: U.S. Department of
Transportation, 2005.
52. Red Light Running Camera (Photo Enforcement) Engineering Safety Analysis Guidelines.
Virginia Department of Transportation, 2008.
53. Report on City of Seattle Traffic Safety Camera Pilot Project. Seattle Police Department,
2007.
54. Retting, R. A. and S. Y. Kyrychenko. Reductions in injury crashes associated with red light
camera enforcement in Oxnard, California. American journal of public health, Vol. 92, No.
11, 2002, pp. 1822-1825.
55. Retting, R.A., A.F. Williams, C.M. Farmer and A.F. Feldman. Evaluation of red light
camera enforcement in Oxnard, California. Accident Analysis & Prevention, Vol. 31, No. 3,
1999, pp. 169-174.
56. Ruby, D.E. and A.G. Hobeika. Assessment of red light running cameras in Fairfax County,
Virginia. Transportation Quarterly, Vol. 57, No. 3, 2003, pp. 33-48.
57. Schneider, H. Effectiveness of Red-light Cameras for Reducing the Number of Crashes at
Intersections in the City of Lafayette. La. Highway Safety Research Group, 2010.
58. Shin, K. and W. Simon. The impact of red light cameras on safety in Arizona. Accident
Analysis & Prevention, Vol. 39, No. 6, 2007, pp. 1212-1221.
59. Stevenson, M., S. Faruque, A. Almajil, M. Farhan, B. Fildes, and B. Lawrence. An
evaluation of the red-light camera programme in the city of Dammam, the Kingdom of
Saudi Arabia. International journal of injury control and safety promotion, 2016, pp. 1-5.
60. Suffolk County Traffic and Parking Violations Agency. Suffolk County Red Light Safety
Program-Annual report of red light safety program, 2014.
61. Texas Department of Transportation. Red Light Cameras - Annual Data Reports.
http://www.txdot.gov/driver/laws/red-light/reports.html. Accessed on 10 Jan. 2017.
62. Washington, S. and K. Shin. The impact of red light cameras (automated enforcement) on
safety in Arizona, Vol. 550, Arizona Department of Transportation, 2005.
63. Yang, C. Y. and W. G. Najm. Analysis of red light violation data collected from
intersections equipped with red light photo enforcement cameras. Publication DOT-
VNTSC-NHTSA-05-01. U.S. Volpe National Transportation Systems Center, 2006.


