
EVAL 6970: Meta-AnalysisFormulating a Problem, Coding the Literature, and Review of Research Designs
Dr. Chris L. S. CorynSpring 2011

Agenda
• Formulating a problem• Coding the literature• Review of research designs• In-class activity• Next meeting
Formulating a Problem
• Like any research, meta-analysis should begin with a careful statement of the topic to be investigated or the question to be answered
• This statement will guide study selection, coding of information, and data analysis
Formulating a Problem
• The problem statement needs to be straightforward and complete, but at this stage, need not be highly detailed
• The problem statement will become clearer and more concise when eligibility criteria are developed
Formulating a Problem
“How effective are challenge programs in reducing the subsequent antisocial behavior of juveniles with behavior problems? What are the characteristics of the least and most successful programs? Do these programs have favorable effects on other outcomes such as relations with peers, locus-of-control, and self-esteem?”
—Lipsey & Wilson (2001)

Formulating a Problem
• The statement of problem on the prior slide yields a preliminary specification of the research literature at issue (studies of the effects of challenge programs on juveniles with behavior problems), the major category of independent variables (program characteristics), and key dependent variables (antisocial behavior, interpersonal relationships, locus-of-control, and self-esteem)

Primary Coding Topics
• Eligibility criteria and screening form• Development of coding protocol• Hierarchical nature of data• Assessing reliability of coding• Training of coders• Common mistakes

Study Eligibility Criteria
• Flow from research question• Identify specifics of:
– Defining features of the program/policy/intervention
– Eligible designs and required methods– Key sample features– Required statistical data– Geographic/linguistic restrictions, if any– Time frame, if any
• Also explicitly states what is excluded

Screening Form
• Develop a screening form with clearly defined criteria
• Complete form for all studies retrieved as potentially eligible
• Modify criteria after examining sample of studies (controversial)
• Double-code eligibility• Maintain database on results for each
study screened
Development of Coding Protocol
• Goal of protocol– Describe studies– Differentiate studies– Extract findings (effect sizes if possible)
• Coding forms and manual– Both important

Development of Coding Protocol
• Types of information to code– Report identification– Study setting– Participants– Method– Treatment or experimental manipulation– Dependent measures– Effect sizes– Confidence ratings

Development of Coding Protocol
• Iterative nature of development• Structuring data
– Data hierarchical (findings within studies)– Coding protocol needs to allow for this
complexity– Analysis of effect sizes needs to respect
this structure– Flat file– Relational hierarchical file

Article Information
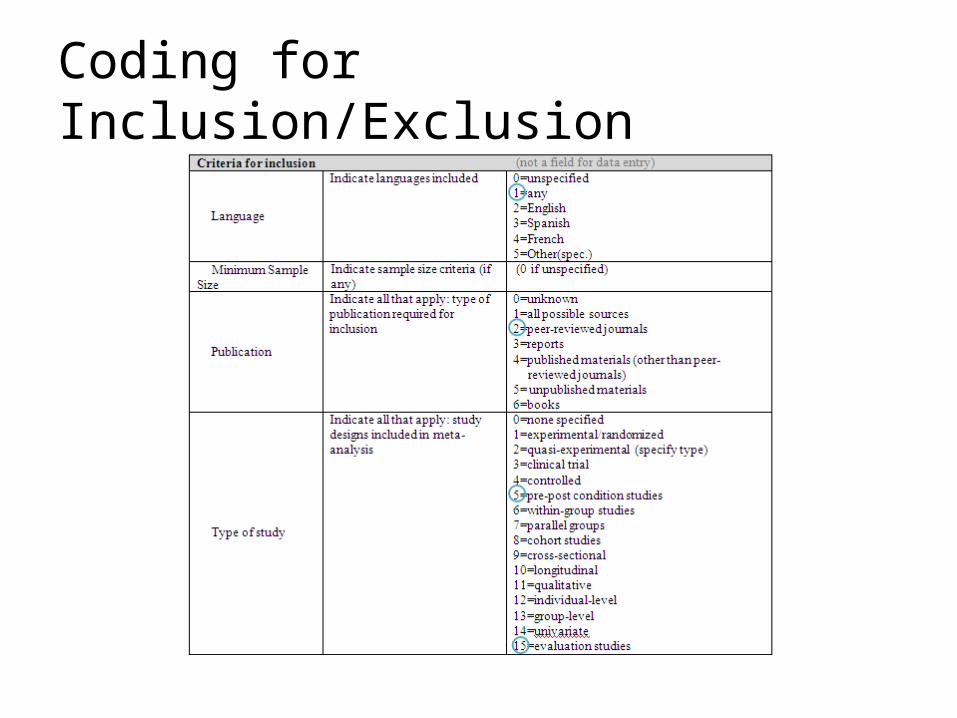
Coding for Inclusion/Exclusion
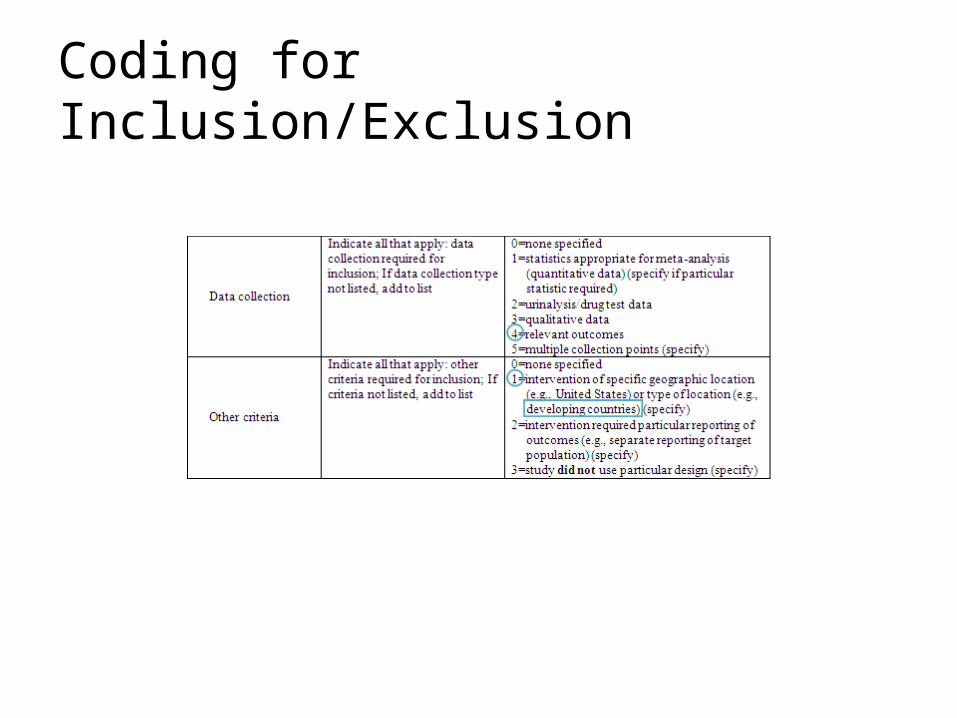
Coding for Inclusion/Exclusion

Coding Methodology
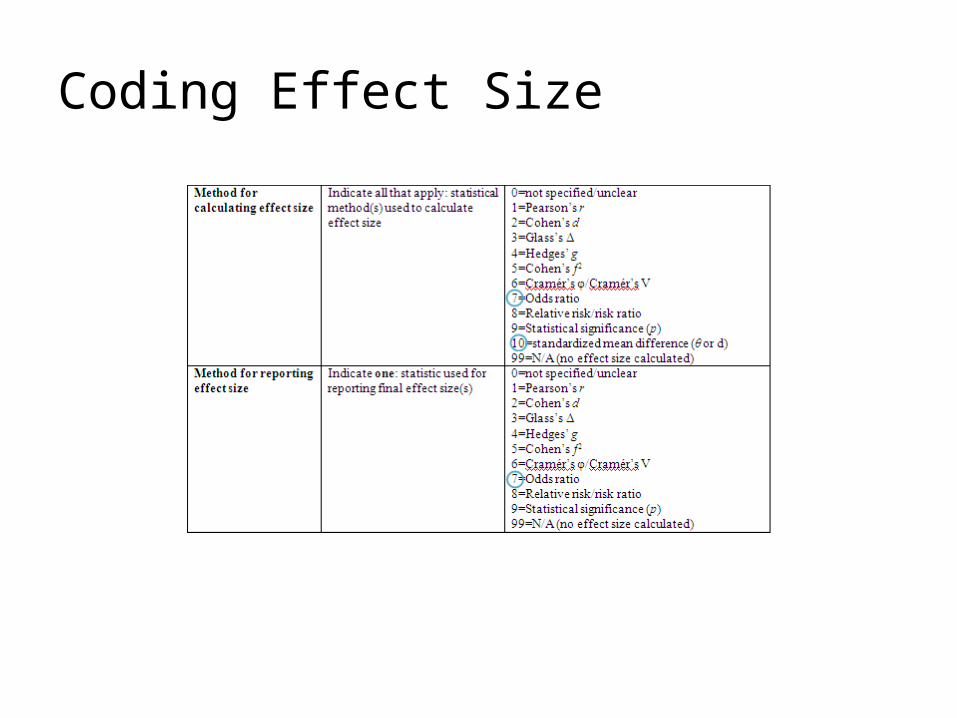
Coding Effect Size

Flat File Structure
ID Paradigm ES1 DV1 ES2 DV2 ES3 DV3 ES4 DV422 2 0.77 323 2 0.77 331 1 -0.1 5 -0.05 5 -0.2 1136 2 0.94 340 1 0.96 1182 1 0.29 11
185 1 0.65 5 0.58 5 0.48 5 0.068 5186 1 0.83 5204 2 0.88 3229 2 0.97 3246 2 0.91 3274 2 0.86 3 -0.31 3 0.79 3 1.17 3295 2 7.03 3 6.46 3 . 3 0.57 .626 1 0.87 3 -0.04 3 0.1 3 0.9 3
1366 2 0.5 3
Note that there is only one record (row) per study
Multiple effect sizes handled by having multiplevariables, one for each potential effect size
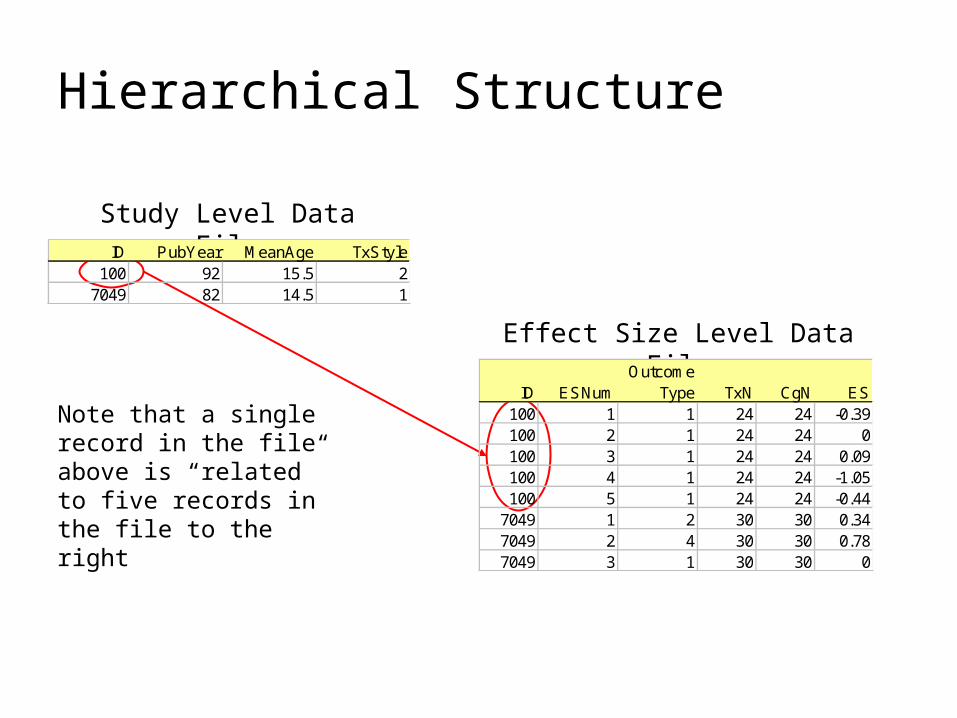
Hierarchical Structure
ID PubYear MeanAge TxStyle100 92 15.5 2
7049 82 14.5 1
OutcomeID ESNum Type TxN CgN ES
100 1 1 24 24 -0.39100 2 1 24 24 0100 3 1 24 24 0.09100 4 1 24 24 -1.05100 5 1 24 24 -0.44
7049 1 2 30 30 0.347049 2 4 30 30 0.787049 3 1 30 30 0
Note that a single record in the file above is “related” to five records in the file to the right
Study Level Data File
Effect Size Level Data File
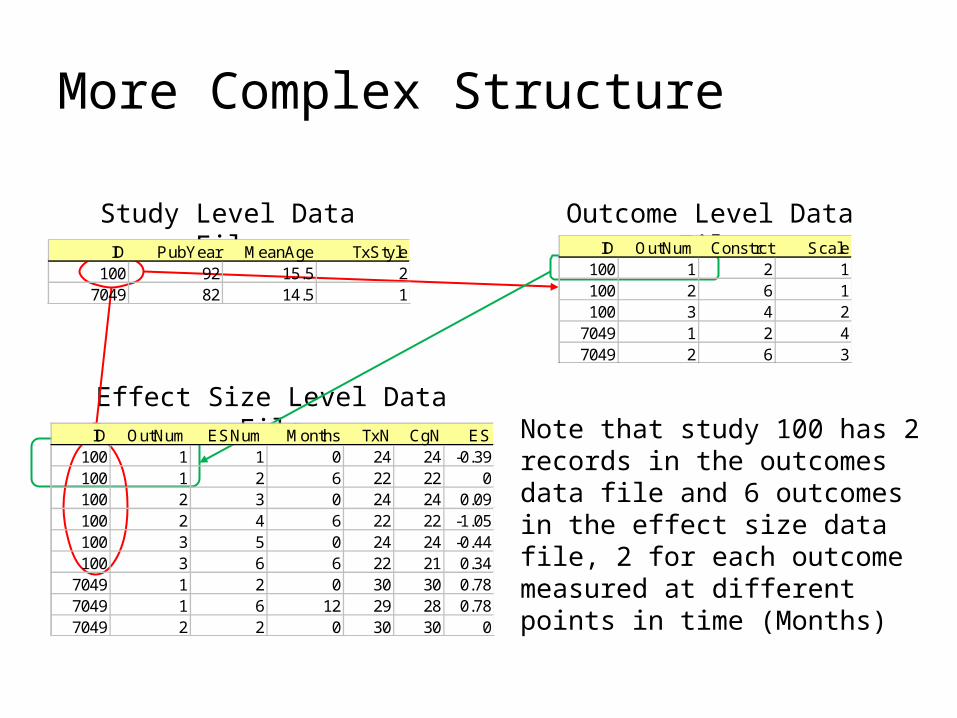
More Complex Structure
ID PubYear MeanAge TxStyle100 92 15.5 2
7049 82 14.5 1
Study Level Data File Outcome Level Data FileID OutNum Constrct Scale
100 1 2 1100 2 6 1100 3 4 2
7049 1 2 47049 2 6 3
ID OutNum ESNum Months TxN CgN ES100 1 1 0 24 24 -0.39100 1 2 6 22 22 0100 2 3 0 24 24 0.09100 2 4 6 22 22 -1.05100 3 5 0 24 24 -0.44100 3 6 6 22 21 0.34
7049 1 2 0 30 30 0.787049 1 6 12 29 28 0.787049 2 2 0 30 30 0
Effect Size Level Data FileNote that study 100 has 2 records in the outcomes data file and 6 outcomes in the effect size data file, 2 for each outcome measured at different points in time (Months)

Multiple Flat File Structure
• Advantages– Can “grow” to any number of effect sizes– Reduces coding task (faster coding)– Simplifies data cleanup– Smaller data files to manipulate
• Disadvantages– Complex to implement– Data must be manipulated prior to analysis– Must be able to select a single effect size per study
for any analysis
• When to use– Large number of effect sizes per study are possible

“Working” with Flat Files
Study Data File
Outcome Data File
Effect Size Data File
Composite Data File
Createcompositedata file
Select subset of effect sizes of interest to current analysis(e.g., a specific outcome atposttest)
Verify that there is only asingle effect size per study
yes
Working Analysis File
Permanent Data Files
Average effect sizes,further selectbased explicit criteria, orselect randomly
no

What About Sub-Samples?
• What if you are interested in coding effect sizes separately for different sub-samples, such as, boys and girls or high-risk and low-risk youth?– Just say “no”!
• Often not enough of such data for meaningful analysis• Complicates coding and data structure
– If you must, plan your data structure carefully• Include a full sample effect size for each dependent
measure of interest• Place sub-sample in a separate data file or use some
other method to reliably determine effect sizes that are statistically dependent
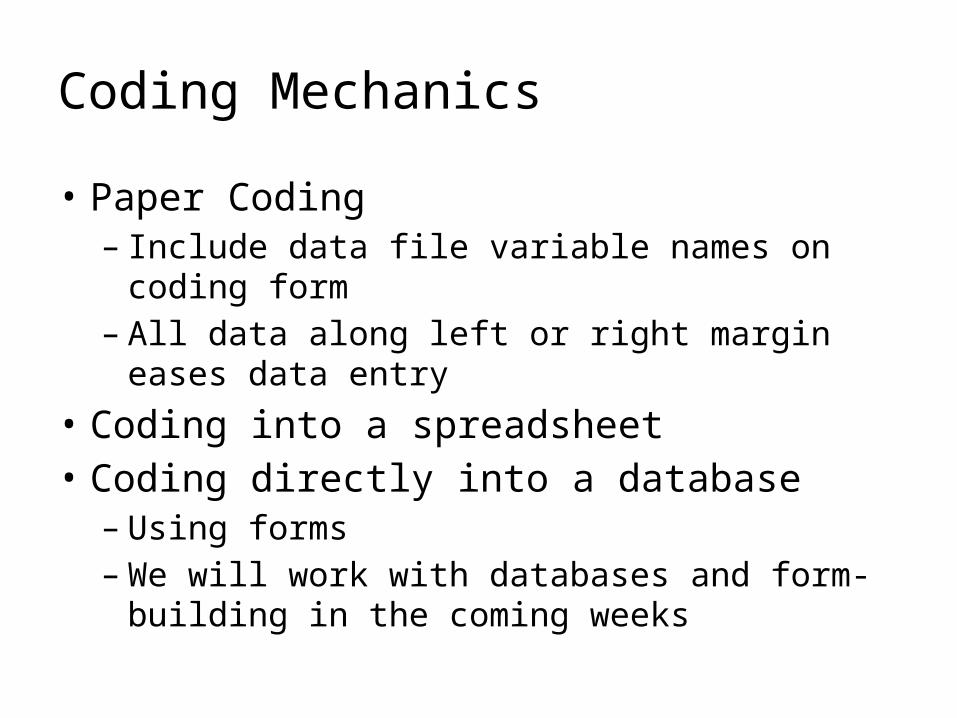
Coding Mechanics
• Paper Coding– Include data file variable names on coding
form– All data along left or right margin eases
data entry
• Coding into a spreadsheet• Coding directly into a database
– Using forms– We will work with databases and form-
building in the coming weeks

Coding Directly to Database
• Advantages– Avoids additional step of transferring data from
paper to computer– Easy access to data for data cleanup– Database can perform calculations during
coding process (e.g., calculation of effect sizes)– Faster coding– Can perform queries to extract relevant data
• Disadvantages– Can be time consuming to set up– Requires a higher level of computer skill
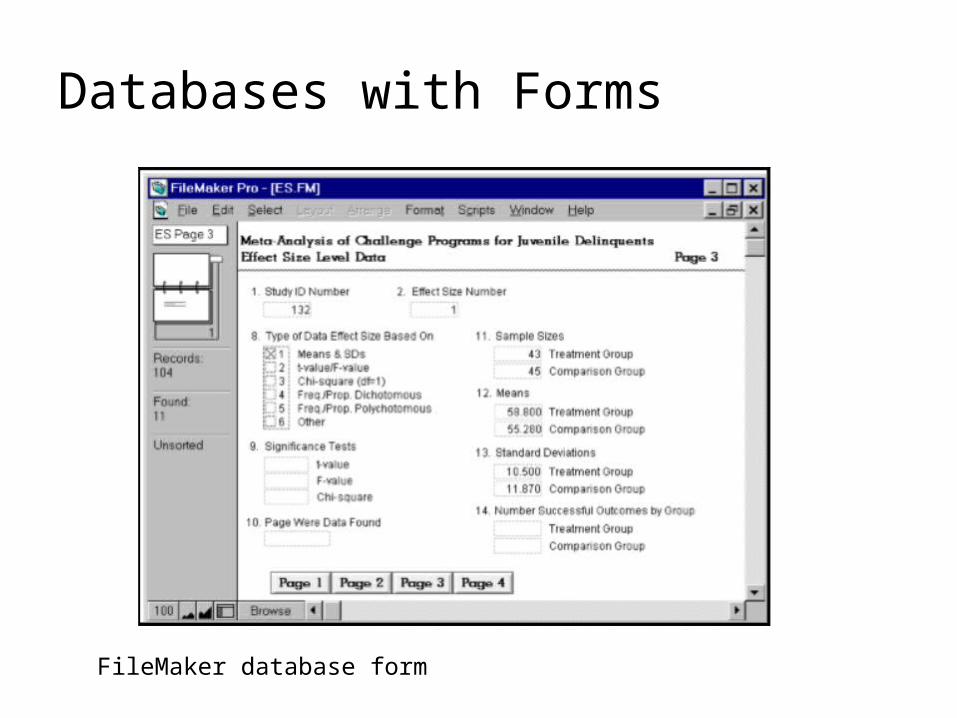
Databases with Forms
FileMaker database form

Databases with Forms
Access database form

Reliability of Coding
• At a minimum, 2 coders per study– Best if all coders code all studies (fully-
crossed as coder study)
• Interrater reliability– At a minimum
• Estimate observed agreement• Estimate agreement taking probability of chance
agreement into account• This should be done at several points (e.g., as a
test of the coding protocol, for decisions about inclusion/exclusion of studies)

Coefficient of Agreement
• The coefficient of observed agreement represents the total proportion of observations () on which there is agreement
• where c denotes the total number of cells, i denotes the ith row, and j denotes the jth column

Coefficient of Agreement
Coder 2
Characteristic Present ()
Characteristic Not Present ()
Row Total
Coder 1
Characteristic Present ()
Characteristic Not Present ()
Column Total )
𝑝o=∑𝑖=1
𝑐
∑𝑗=1
𝑐
𝑝𝑖𝑗=𝑐11+𝑐22𝑁

Coefficient of Agreement
𝑝o=∑𝑖=1
𝑐
∑𝑗=1
𝑐
𝑝𝑖𝑗=𝑐11+𝑐22𝑁
= 500+25500+1+2+25
=525528
= .9943
Coder 2
Characteristic Present ()
Characteristic Not Present ()
Row Total
Coder 1
Characteristic Present ()
500 1 501
Characteristic Not Present ()
2 25 27
Column Total 502 26 528
Cohen’s Kappa
• Cohen’s kappa () represents the extent of agreement exceeding that which would be expected purely by chance
• Where is expected agreements

Cohen’s Kappa
Coder 2Marginal Row Probabilities
Characteristic Present ()
Characteristic Not Present ()
Coder 1
Characteristic Present ()
Characteristic Not Present ()
Marginal Column Probabilities
)
𝑝e=∑𝑖=1
𝑐
∑𝑗=1
𝑐
𝑝𝑖 .𝑝 . 𝑗=𝑝 .1𝑝1.+𝑝 . 2𝑝2 .

Cohen’s Kappa
Coder 2Marginal Row Probabilities
Characteristic Present ()
Characteristic Not Present ()
Coder 1
Characteristic Present ()
500 1
Characteristic Not Present ()
2 25
Marginal Column Probabilities
𝑝e=∑𝑖=1
𝑐
∑𝑗=1
𝑐
𝑝𝑖 .𝑝 . 𝑗=𝑝 .1𝑝1.+𝑝 . 2𝑝2 .=.9507 ( .9488 )+ .0492 ( .0511 )=.9045
𝜅=𝑝 o−𝑝e1−𝑝e
= .9943−.90451− .9045
= .0898.0955
=.9043

Training and Calibrating Coders
• Start with a small sub-sample of representative studies (i.e., practice coding)– Assess interrater reliability– Identify areas of inconsistency/disagreement– Modify coding procedures, forms as necessary
(reassess after modification)
• Regular meetings (develop normative understandings)
• Use specialized coders (e.g., computing effect sizes by hand or using effect size calculators)
• In the end, a consensus procedure will be necessary for “disagreeing” codes

Common Mistakes
• Not understanding or planning the analysis prior to coding (e.g., failure to recognize hierarchical nature and statistical dependencies of some data)
• Underestimating time, effort, and technical/statistical demands– Plan on approximately 8 hours per study for coding
• Using a spreadsheet for managing a large review• Over-coding
– Trying to extract more detail than routinely reported

Managing the Bibliography
• Information you need to track– Source of reference (e.g., ERIC, PubMed)– Retrieval status
• Retrieved• Requested from interlibrary loan
– Eligibility status• Eligible• Not eligible• Relevant review article
– Coded status
• Word processor not up to the task• Spreadsheets are cumbersome• Use a database of some form

Research Design Review
• Basic designs that you are likely to encounter– Experimental designs
• Randomized controlled trial– Units are randomly assigned to two or more
conditions (typically a treatment and a control or comparison group)
– Most common design is between subjects (e.g., posttest-only design)
– Can also include a within subjects factor (e.g., a pretest-posttest design)

Research Design Review
• Basic designs that you are likely to encounter– Quasi-experimental designs
• Similar to randomized controlled trials, except that units are not assigned to conditions randomly
• One or more groups• One-group designs (within subjects) are often
in the form of a one-group pretest-posttest• Some types of single-subject designs fall in
this category as do case-control designs

Research Design Review
• Basic designs that you are likely to encounter– Everything else is generally nonexperimental
(in a very broad sense, though many designs that I consider quasi-experimental would be labeled as nonexperimental by others)• Cross-sectional, correlational (one point in time,
one group)• Intact, naturally occurring groups (e.g., males,
females) • Passive, naturalistic

Today’s In-Class Activity
• Individually, or in your working groups, calculate the coefficient of observed agreement (), expected agreement (), and Cohen’s kappa () for problems #1, #2, and #3 on the following slides
• How reliable is each in terms of observed agreement and taking chance agreements into account?

Problem #1
Coder 2
ExperimentalDesign
Other Type of Design
Coder 1
ExperimentalDesign
33 748
Other Type of Design
679 26

Problem #2
Coder 2
Effect Size Based on Means and Standard
Deviations
Effect Size Based on t-value or F-
value
Coder 1
Effect Size Based on Means and Standard Deviations
1,267 48
Effect Size Based on t-value or F-value
53 926
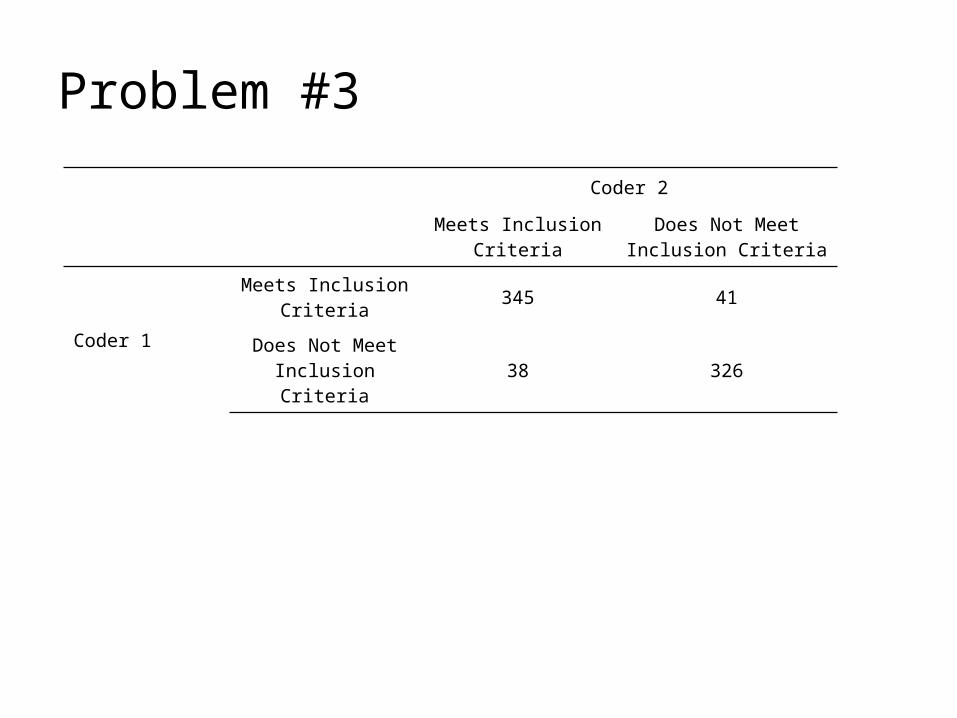
Problem #3
Coder 2
Meets Inclusion Criteria
Does Not Meet Inclusion Criteria
Coder 1
Meets Inclusion Criteria
345 41
Does Not Meet Inclusion Criteria
38 326


