
THIS REPORT CONTAINS ASSESSMENTS OF COMMODITY AND TRADE ISSUES MADE BY
USDA STAFF AND NOT NECESSARILY STATEMENTS OF OFFICIAL U.S. GOVERNMENT
POLICY
Date:
GAIN Report Number:
Approved By:
Prepared By:
Report Highlights:
The EU-27 is one of the world’s leading producers and consumers of apples, pears, table grapes,
and concentrated apples juice (CAJ). Due to unfavorable weather conditions in major EU
producing countries production of apples, pears, and table grapes is estimated to decline
significantly in MY 2010/11. The lower availability of fresh fruit is expected to raise prices for
apples, pears and, to a lesser extent, for table grapes. The smaller supply of apples will also lead
to decreased production of CAJ during the same period. The majority of fresh fruit trade occurs
within the EU-27. However, significant imports from non-EU countries, mainly the southern
hemisphere, take place during the off season. As a result of reduced domestic supply, imports in
MY 2010/11 are expected to increase for apples, pears, and table grapes. Commercial apple
production in MY 2010/11 is estimated at 9.8 MMT which is a decrease of 11 percent compared to
the previous marketing year; commercial pear production at 2.2 MMT, which is down by 14
percent. In MY 2010/11, table grape production is estimated to decline by 5.6 percent compared
to the previous MY and will reach 1.9 MMT.
Roswitha Krautgartner, Sabine Lieberz, Marcel Pinckaers,
Ferenc Nemes, Stefano Baldi, Tania DeBelder, and the group of
FAS fruit specialists in the EU
Paul Spencer
Smaller Supply and Rising Prices
Fresh Deciduous Fruit Annual
EU-27
E50067
11/2/2010
Required Report - public distribution

Executive Summary:
Introduction Disclaimer: This report presents the situation and outlook for apples, pears, concentrated apples
juice (CAJ), and table grapes in the EU-27. This report presents the views of the authors and does
not reflect the official views of the U.S. Department of Agriculture (USDA). The data are not
official USDA data. This report was a group effort of the following FAS analysts: Xavier Audran FAS/Paris covering France Stefano Baldi FAS/Rome covering Italy Ornella Bettini FAS/Rome covering Greece Mila Boshnakova FAS/Sofia covering Bulgaria Bettina Dahlbacka FAS/Stockholm covering Denmark, Finland, and Sweden Tania DeBelder USEU/FAS Brussels covering EU policy Monica Dobrescu FAS/Bucharest covering Romania Agata Kingsbury FAS/Warsaw covering Poland Roswitha Krautgartner FAS/Vienna covering Austria and Slovenia
Sabine Lieberz FAS/Berlin covering Germany Arantxa Medina FAS/Madrid covering Spain and Portugal Jana Mikulasova FAS/Prague covering the Czech Republic and Slovakia Ferenc Nemes FAS/Budapest covering Hungary
Marcel Pinckaers FAS/The Hague covering Belgium, Luxemburg and the Netherlands
Jennifer Wilson FAS/London covering the U.K. and Ireland The chapters were coordinated by: Overall coordination Roswitha Krautgartner Apples Sabine Lieberz Pears Marcel Pinckaers Concentrated Apple Juice Ferenc Nemes Table Grapes Stefano Baldi Policy Tania DeBelder
Abbreviations and definitions used in this report CAJ Concentrated Apple Juice CMO Common Market Organization EU European Union GTA Global Trade Atlas Ha hectare; 1 ha = 2.471 acres MT Metric ton = 1000 kg MMT Million metric tons MS EU member state(s) MY Marketing year Apples: July/June Pears: July/June CAJ: July/June Table Grapes: June/May

NMS New EU Member States
Bulgaria, Cyprus, Czech Republic, Estonia, Hungary, Latvia, Lithuania, Malta, Poland, Romania,
Slovakia, Slovenia USD U.S. Dollar WAPA World Apple and Pear Association Trade data cited in this report was derived using the following HS tariff codes: Apples: 0808 10 Pears: 0808 20 CAJ: 2009 79 Table grapes: 0806 10 10
Summary Coordinated by Roswitha Krautgartner/FAS Vienna
Apples In all EU member states (MS), apples are the most popular fruit. Commercial apple production in
MY 2010/11 is estimated at 9.8 MMT, which is a decrease of 11 percent compared to the previous
marketing year. The decrease is largely the result of cool and moist weather conditions during
blossoming. Fruit quality is expected to be good for the most part but fruit diameter is smaller
than usual. Non-commercial apple production in MY 2010/11 is forecast to be 11 percent higher
because of the rebound in production in Germany. Lower stocks, decreased domestic production,
and very low levels of CAJ stocks improved apple market conditions significantly compared to MY
2009/10. For MY 2010/11 EU-27 imports are estimated to rebound due to attractive prices within
the EU. Almost 90 percent of EU-27 apple imports come from southern hemisphere suppliers. Pears The EU-27 is the world’s second largest producer of pears after China. Overall commercial pear
production in MY 2010/11 is estimated at 2.2 MMT, which is down by 14 percent compared to the
previous marketing year. This is largely due to lower yields resulting from unfavorable weather
conditions. Only production in Spain is expected to be up, by 11 percent. Non-commercial
production in MY 2010/11 is expected to be 20 percent lower than in MY 2009/10 and will account
for 120,000 MT. Lower availability (reduced production and smaller stocks) of pears in MY
2010/11 is expected to influence prices positively and increase imports. Almost three quarters of
EU-27 pear imports come from Argentina and South Africa. Concentrated Apple Juice Poland, Germany, Italy, Hungary, Spain, Romania, and Austria account for over 95 percent of all
EU concentrated apple juice production (CAJ). In MY 2009/10, production decreased by 16 percent
to 436,000 MT due to high production costs, low juice concentrate prices, high stocks, and
declining demand. A further decrease in production, caused by a smaller apple crop, is expected in
MY 2010/11. In the past, the EU was one of the largest CAJ importers of the world. In MY
2008/09 and 2009/10, EU-27 imports of CAJ decreased considerably. Reduced demand for apple
juice and abundant stocks eroded CAJ prices in MY 2009/10. By the summer of 2010, tight stock
levels had started to improve the price situation of CAJ.

Table Grapes The EU-27 is a leader in table grape production. Italy, Spain, and Greece account for 90 percent of
EU production. After a dramatic drop over the past decade, EU table grape area continues to
decline, albeit at a slower pace. The main factors behind the decline are reduced profitability due
to increasing production costs and strong competition from other suppliers. In MY 2010/11, table
grape production is estimated to decline by 5.6 percent compared to last year and will reach 1.9
MMT. This is mainly due to unfavorable weather conditions and reduced yields in Greece and some
areas of Spain. The EU-27 is a net importer of fresh table grapes. As a consequence of reduced
domestic supply, imports into the EU in MY 2010/11 are likely to increase. South Africa and Chile
are the major external suppliers for the EU market.
Apples Coordinated by Sabine Lieberz/FAS Berlin Table 1: EU-27 PSD for Fresh Apples (in ha, trees, MT)
Apples, Fresh EU-27
2008 2009 2010 2008/2009 2009/2010 2010/2011
Market Year Begin: Jul 2008 Market Year Begin: Jul 2009 Market Year Begin: Jul 2010
USDA Official Data
Post Old Data
Post New Data
USDA Official Data
Post Old Data
Post New Data
Post New Data
Area Planted 536,010 536,010 530,844 530,500 530,500 534,145 528,930
Area Harvested
502,478 502,478 495,046 496,900 496,900 500,017 495,390
Bearing Trees
0 0 0 0 0 0
Non-Bearing Trees
0 0 0 0 0 0
Total Trees 0 0 0 0 0 0 0
Commercial Production
11,202,863
11,202,863
11,115,239
10,941,400
10,941,400
11,105,636
9,884,520
Non-Comm. Production
1,372,200 1,372,200 1,540,065 1,120,200 1,120,200 1,104,880 1,229,800
Production 12,575,063
12,575,063
12,655,304
12,061,600
12,061,600
12,210,516
11,174,320
Imports 778,900 778,527 780,136 700,000 750,000 589,569 740,000
Total Supply 13,353,963
13,353,590
13,435,440
12,761,600
12,811,600
12,800,085
11,854,320
Fresh Dom. Consumption
8,546,303 8,546,462 8,295,695 8,611,600 8,661,600 8,192,880 8,057,320
Exports 1,203,000 1,202,468 1,202,562 1,100,000 1,100,000 1,217,685 1,070,000
For Processing
3,604,660 3,604,660 3,937,183 3,050,000 3,050,000 3,389,520 2,727,000
Withdrawal From Market
0 0 0 0 0 0
Total Distribution
13,353,963
13,353,590
13,435,440
12,761,600
12,811,600
12,800,085
11,854,320
Note: Data for tree numbers is only available for few member states; therefore lines referring to
tree numbers are left blank. Source: FAS EU-27
Apples – Production Apples - Commercial Production

The EU-27 is one of the leading producers and consumers of apples in the world. Poland, Italy,
France, Germany, and Spain are the top five producing member states (MS) and together account
for 76 percent of the total EU commercial apple production. Some 25 varieties are produced
commercially in the EU in volumes exceeding 10,000 MT. Among these, Golden Delicious, Gala
types, and Jonagold are the dominant varieties. However, production patterns vary. While Golden
Delicious is the variety with the largest production in Italy, France, and Spain, Elstar is dominant in
Germany and the Netherlands; Idared and Jonathan are the number one varieties in Poland and
Hungary, respectively. However, new varieties, for example Pink Lady, Kanzi, Rubens, Tentation,
have increased their share of production in recent years. In the Netherlands “new” varieties
comprise 10 percent of total production. Commercial apple production in MY 2010/11 is estimated at 9.8 MMT. However, this estimate is
still provisional since the harvest is about two weeks behind schedule in major production regions.
The projected decrease of 11 percent compared to the previous MY 2009/10 is largely a result of
cool and moist weather during blossoming, which hindered pollination. In addition, summer
hailstorms (Austria, Hungary), continued cold (France, Germany) and wet weather (Poland,
Hungary) and lack of rain (France/early season, the Netherlands/July) further limited production.
With the exception of Greece, Bulgaria, Sweden and Finland, all EU MS show a reduction in
production compared to the previous MY. Fruit quality seems to be good for the most part, with
the exception of some local damage by hail in Austria and Hungary and russeting in France. Fruit
diameter is smaller than usual (Poland, Germany) because of late pollination and poor growing
conditions in the weeks prior to harvest. Table 2: EU-27 Commercial Apple Production by Country and Year in MT
COUNTRY 2008 2009 2010e Change
2010:2009 in
percent
Percent of
Total
Italy 2,210,130 2,326,090 2,200,000 -5% 22%
Poland 2,780,800 2,593,000 2,095,000 -19% 21%
France 1,702,000 1,730,000 1,670,000 -3% 17%
Germany 1,047,000 1,071,000 830,000 -23% 8%
Spain 661,700 595,000 663,700 12% 7%
Romania 329,178 379,284 344,020 -9% 3%
Netherlands 357,200 381,900 323,000 -15% 3%
Hungary 372,450 335,000 267,000 -20% 3%
Greece 231,000 224,000 260,000 16% 3%
Belgium 319,200 326,800 238,450 -27% 2%
Portugal 238,812 280,078 210,000 -25% 2%
United
Kingdom 205,000 212,000 208,000 -2% 2%
Austria 197,959 223,947 192,000 -14% 2%
Czech
Republic 156,697 144,993 117,850 -19% 1%
Slovenia 71,643 72,587 69,000 -5% 1%
Lithuania 74,000 60,000 60,000 0% 1%
Bulgaria 16,517 25,000 28,000 12% 0%
Latvia 34,000 25,000 25,000 0% 0%
Slovak
Republic 41,803 37,689 22,000 -42% 0%
Denmark 26,000 24,000 21,000 -13% 0%
Sweden 22,150 18,000 20,000 11% 0%
Ireland 16,000 16,000 16,000 0% 0%

Finland 4,000 4,268 4,500 5% 0%
TOTAL EU-
27 11,115,239 11,105,636 9,884,520 -11%
e= estimated Source: FAS/EU-27
Chart 1: Commercial Apple Production in the EU-27 by Variety and Year in 1,000 MT
Note: Category “Other” includes but is not limited to: Annurca, Ariane, Belgica, Boskoop, Bramley,
Cameo, Cortland, Cox Orange, Cripps Pink, Diwa, Fuji, Glockenapfel, Gloster, Gravensteiner,
Greenstar, Honey crunch, Ingrid Marie, James Grieve, Jazz, Jonathan, Junami, Kanzi, Lobo, Mariac,
Morgenduft, Pinova, Reinette Grise du Canada, Rubens, Tentation, Topaz, Wellant Source: FAS/EU-27, based on data from WAPA Apples - Non-commercial Production
Non-commercial production in MY 2010/11 is estimated at 1.2 MMT, which is 11 percent higher
than in MY 2009/10. This is largely a result of a substantial rebound in production in Germany that
is only partially offset by a decline in Hungary. However, most EU member states do not report estimates for non-commercial production (private
gardens and meadows). As a result, the production figure provided in table 1 is a very rough
estimate which is based on industry rather than official information. Non-commercial production
tends to alternate between good and poor crop years. (For background explanation please refer to
page 7 of E48163) Non-commercial production includes apples grown in house gardens and production in meadows.

Typically, non-commercial production is used for fresh consumption, apple juice and spirits
production, baking (cakes, tarts) or preserved foods (canned, dried, and cooked). The amount of
apples diverted to the different segments varies depending on the price for processing apples.
Higher processing apple prices generally result in a higher proportion of fruit entering juice
production. In general, non-commercial production is gradually decreasing in the EU-27 as hobby
farmers get older. Younger generations have simply not shown the same interest in small-scale
production. Instead, commercial production of higher acid apple varieties for processing is
expected to increase to meet demand from the CAJ industry. Apples – Market Situation Currently (October 2010) the table apple market looks significantly better than a year ago. This is
largely a result of three factors: 1) apple stocks on July 1, 2010 were 3 percent lower than in the
year before; 2) domestic commercial production is 11 percent lower than in 2009 (see section on
production); and, 3) in addition, stocks of concentrated apple juice (CAJ) are estimated to be at
very low levels. As a result of the higher prices for processing apples, the processing sector
absorbs comparatively large amounts of lower quality table apples. This takes pressure from the
table apple market and leads to higher prices in this segment, too. Apples - Stocks
According to WAPA, EU stocks of apples amounted to 550,600 MT on July 1, 2010, compared to
569,929 MT at the same time in 2009. Reporting of stocks varies by MS. In some MS the stock
number comprised apples stored at producer organizations (POs), in some MS stocks are at POs
and wholesalers. More important than the actual number is the year-on-year-change of stocks, as
end of MY stocks can have a detrimental effect on the prices for the new harvest. Stocks are
included in the “fresh domestic consumption” line in the PSD. Apples – Consumption Consumer preferences
Apples are the most popular fruit in all MS, followed by bananas and citrus. However, a closer look
within the apple segment does show differences in consumer preferences between MS. For
information on variety and size preferences by MS please refer to page 9 of E48163. The
movement to buy local and seasonal produce has gained a lot of traction in some MS such as the
UK, Belgium, and the Netherlands and to some extent in Germany. To the British, apples are
iconic local produce that conjure up nostalgia for traditional harvests and days gone by. UK
consumers are starting to question why apples and pears are imported during the British season.
The market is also responding to policy drivers on food security, climate change, and health.
Discussions on Carbon Footprint are also prompting Dutch and Belgian consumers to choose local
over imported product. In Germany, this behavior can be found with consumers who buy at
weekly and farmers markets. They tend to prefer local produce over products from other countries
and even over products from other regions in Germany. Processing
In MY 2010/11, processing use of apples is expected to decline compared to MY 2009/10 because
of lower commercial apple production especially in Poland, Hungary, Italy, and the Czech Republic. Processing uses for apples include, among others apple juice, concentrated apple juice (CAJ),
cider, wine/brandy, apple sauce, preserves, canning, apple chips, and peeled apples for bakeries.
The share of apples used for processing varies significantly from MS to MS; ranging from 2 percent
in France to well over 60 percent in Hungary. The processing share also varies from year to year.
The EU-27 average share of apples going into processing is forecast to amount to about 23

percent of total supply in MY 2010/11. Major MS with apple processing include Poland, Germany,
Hungary, Italy, Spain, the Netherlands, and the U.K. Apples – Trade The majority of trade occurs within the EU-27 countries. Over the past five years, on average
about 2.2 million MT of apples were traded between EU member states, while roughly 800,000 MT
were imported from outside the EU-27. In recent years imports contributed between 5 and 8
percent to the total apple supply on the EU market. EU-27 external trade
Imports
The decrease of imports in MY 2009/10 is largely a result of lower imports of apples from the
Southern Hemisphere. GTA data for Chinese apple trade suggests that Chinese exports increased
to Bangladesh, India, and Nepal at the expense of shipments to the EU. For MY2010/11 EU
imports are forecast to rebound due to attractive prices in the EU. Almost 90 percent of EU-27
apple imports originate from the top five suppliers, all of which are located in the southern
hemisphere and export mostly during the European off-season. The main importers of apples are
the Netherlands and the U.K., who together account for more than half of the EU-27 imports.
However, much of the volume entering the Netherlands will not be consumed there but eventually
be transshipped to other MS. U.S. apple exports to the EU-27 occur year-round; however, most arrive between November and
April. U.S. apples compete with domestically produced apples and with competitively priced
imports from China. For example, the average import price for U.S. apples in MY 2009/10 was
1,438 USD per MT, while Chinese apples were imported at 1,042 USD per MT (source: GTA). The
main importers of U.S. apples in MY 2009/10 were the U.K., Finland, Sweden, Ireland, and the
Netherlands. Table 3: EU-27 Imports of Apples in MT
Country of Origin MY 2007/08 MY 2008/09 MY 2009/10 Change
Chile 192,044 214,851 158,203 -26%
New Zealand 159,494 163,068 125,583 -23%
South Africa 154,687 170,193 121,227 -29%
Brazil 87,843 92,627 71,390 -23%
Argentina 79,083 63,110 45,681 -28%
United States 28,370 26,854 23,643 -12%
China 35,051 24,726 14,097 -43%
Macedonia 44,922 14,886 13,920 -6%
Croatia 16,411 2,524 6,008 138%
Serbia 41,214 218 2,198 908%
Moldova 7,255 210 1,972 839%
Uruguay 4,626 2,412 1,918 -20%
Canada 2,990 1,212 1,387 14%
Ukraine 19,921 756 735 -3%
Other 8,694 2,489 1,607 -35%
World Total 882,605 780,136 589,569 -24%
Thereof processing apples 62,461 7,924 11,273
Source: Global Trade Atlas (GTA)

Exports
The increase in total EU-27 apple exports in MY 2009/10 was largely a result of increased sales to
Northern Africa (Algeria, Libya, Morocco) and the Middle East (Saudi Arabia, U.A.E.). For MY
2010/11 exports are expected to decrease by about 12 percent. This is mainly a result of the
lower EU domestic production. The top destinations for EU-27 apples are Russia, Ukraine, and Algeria. The largest EU exporters
are Poland (mostly to Russia and Ukraine), France (mainly to Algeria, Russia, U.A.E., and Saudi
Arabia), and Italy (to Russia, Libya, Norway, and Saudi Arabia). In some large foreign markets, EU and U.S. suppliers compete, including: Russia: Poland, Italy, Belgium, France, and Germany U.A.E.: France, Italy Saudi Arabia: Italy, France Table 4: EU-27 Exports of Apples in MT
Country of Destination MY 2007/08 MY 2008/09 MY 2009/10 Change
Russia 331,753 587,669 524,463 -11%
Ukraine 90,946 258,994 256,059 -1%
Algeria 79,307 75,595 89,008 18%
Belarus 27,048 43,802 41,086 -6%
Norway 37,021 32,663 35,068 7%
Saudi Arabia 27,449 19,922 34,713 74%
Libya 18,995 23,905 34,383 44%
Kazakhstan 634 12,775 30,980 143%
United Arab Emirates 13,983 14,344 24,995 74%
Albania 15,840 11,920 15,149 27%
Morocco 5,237 8,235 12,748 55%
Bosnia & Herzegovina 7,330 15,087 10,663 -29%
Melilla 7,025 9,804 10,227 4%
Other 87,517 87,847 98,143 1%
World Total 750,085 1,202,562 1,217,685 12%
Source: Global Trade Atlas (GTA) Apples – Withdrawal from Market The reform of the EU common market organization for fruits and vegetables (see policy section)
also brought about a change in the intervention system (also called “withdrawal from market”).
Previously, a producer organization was allowed to dispose up to 8.5 percent of its marketed
volume of apples through intervention programs. However, unlike other commodities, these
volumes were not allowed to re-enter the market at a later stage. Instead, they had to be
permanently “withdrawn from the market”, for example by donation to charity or be destroyed. As of 2008, “withdrawal from market” is no longer available as a separate measure but will have to
be included as an emergency measure in the producer organizations’ operational program (OP).
This means, the system moves from being financed entirely by EU funds to a co-financing system
where producer organizations have to bear 50 percent of the costs.

As a consequence, starting in MY 2008/09, MS authorities began administering “withdrawals from
market” indirectly via approval of the OP. Thus, volume data is no longer available. Also, some
member states (for example Germany) have opted to do away with intervention for fruits and
vegetables altogether. Apples – Additional Information For information on tariffs, maximum residue levels, and labeling requirements please see the
respective sections at the end of the report.
Pears, Fresh Coordinated by Marcel Pinckaers/FAS The Hague Table 5: EU-27 PSD for fresh pears (in ha, trees, MT Pears, Fresh EU-27
2008/2009 2009/2010 2010/2011
Market Year Begin: Jul 2008 Market Year Begin: Jul 2009 Market Year
Begin: Jul 2010 USDA Official
Old Post
New Post
USDA Official
Old Post
New Post
New Post
Area Planted 139,191 139,191 136,750 139,000 139,000 135,930 136,241
Area Harvested 130,763 130,763 127,900 130,800 130,800 127,630 127,881
Bearing Trees 0 0 34,900 0 0 36,120 36,412
Non-Bearing Trees 0 0 5,430 0 0 5,560 5,751
Total Trees 0 0 40,330 0 0 41,680 42,163
Commercial Production 2,272,205
2,272,205
2,237,400
2,543,100
2,543,100
2,605,200
2,228,650
Non-Comm. Production 162,852 162,852 141,900 181,400 181,400 148,460 119,700
Production 2,435,057
2,435,057
2,379,300
2,724,500
2,724,500
2,753,660
2,348,350
Imports 392,100 385,293 423,990 345,000 355,100 289,110 363,283
Total Supply 2,827,157
2,820,350
2,803,290
3,069,500
3,079,600
3,042,770
2,711,633
Fresh Dom. Consumption 2,327,470
2,322,524
2,353,940
2,492,800
2,520,400
2,406,240
2,289,500
Exports 223,850 221,989 230,290 270,000 252,500 311,470 258,090
For Processing 275,837 275,837 219,060 306,700 306,700 325,060 164,043
Withdrawal From Market 0 0 0 0 0 0 0
Total Distribution 2,827,157
2,820,350
2,803,290
3,069,500
3,079,600
3,042,770
2,711,633
Source: FAS/EU-27
Pears – Production Pears – Commercial Production The EU-27 is, after China, the world’s largest producer of pears, followed by the United States and
Argentina. Italy, Spain, the Netherlands and Belgium are the top four producing MS and together
account for almost 75 percent of total EU-27 commercial pear production. France and Portugal are
the EU’s 5th and 6th largest pear producing countries, respectively. The most produced pear
variety continues to be Conference, mainly grown in the Netherlands, Belgium, Spain, and Italy.
Other popular varieties include Bartlett (Williams) (mainly grown in Italy, France and Spain), Abate

Fetel (grown in Italy) and Rocha (grown in Portugal). Chart 2: EU-27 Pear production for selected varieties in thousand MY
Source: WAPA Commercial pear production in MY 2010/11 is estimated to be 2.2 MMT, down 14%. This decrease
compared to MY 2009/10 is largely the result of an overall lower yield due to unfavorable weather
conditions. Italy had severe weather conditions (heavy rains and hail) during the fruit set period.
Also pear production in the Benelux countries faced bad weather conditions during and just after
blossoming in combination with a rather dry summer (especially the month of July). Production in
Spain however is expected to be up by 11% due to favorable weather conditions in leading pear
production areas Catalonia and Aragon. The overall quality is expected to be good. Table 6: EU-27 Commercial Pear Production by Country and Year
COUNTRY 2007 2008 2009 2010e Change
2010:2009
in percent
Percent
of Total
Italy 922,000 770,123 871,225 655,000 -25 29
Spain 551,800 538,700 434,200 483,300 11 22
Netherlands 242,250 163,400 285,950 258,990 -9 12
Belgium 272,650 161,500 291,650 221,160 -24 10
Portugal 141,210 195,090 249,109 175,000 -30 8
France 195,000 160,000 188,000 164,000 -13 7
Poland 25,000 65,500 75,000 58,000 -23 3
Greece 51,000 51,000 43,000 52,000 21 2
Germany 56,000 38,000 52,000 46,000 -12 2
Romania 22,564 19,725 24,000 34,000 42 2
Hungary 11,799 22,000 30,000 28,000 -7 1
United
Kingdom 26,000 29,000 30,000 27,000 -10 1
Other 13,279 23,384 31,064 26,200 -16 1
Total EU-27 2,530,552 2,237,422 2,605,198 2,228,650 -14 100
e= estimated
Source: FAS/EU-27 Pears – Non-Commercial Production Similar to the situation for apples, non-commercial production of pears includes pears grown in
gardens and meadows and mainly used for fresh consumption or small scale further processing.
Non-commercial production represents around 5% of total pear production and is gradually
decreasing in the European Union as hobby farmers as a group get older. Younger generations
have not shown the same interest in small-scale production. Non-commercial production in MY
2010/11 is estimated at 120,000 MT, 20 percent lower than last year. Pears – Consumption Pears are popular throughout the EU although apples, oranges and bananas continue to lead fresh
fruit consumption. The per capita consumption of pears is high in countries that have large
domestic production such as Italy, Spain, the Netherlands, Belgium, Portugal and France. The
Nordic (except for Denmark) and Central and Eastern European countries have, in general, lower
per capita consumption of pears. On MS level, the most popular pear varieties are those that are
locally or regionally grown. The Conference pear variety and to a lesser extent the Doyenne du
Comice variety still dominate pear consumption in Northwest Europe, while Bartlett (Williams) and
Abate Fetel are popular pears in Spain and Italy. The varieties that have a good storage life, e.g. Conference, are normally available year round.
Varieties with a somewhat shorter storage life like Doyenne du Comice are available after
harvesting but are supplemented by imports from Southern Hemisphere countries later in the
marketing year. Only for selected varieties and only for a few months, does the market depend on
imported pears. Health, variety and convenience have become important deciding factors for consumers when
buying products. Pear consumption is expected to benefit from this trend. In addition, pears are
increasingly used in salads, cooking and snacks. Finally, the market for organic pears continues to
grow slightly. Processing In MY 2010/11 it is expected that the volume of pears used for processing will be 164,000 MT, half
the volume of MY2009/10, mainly due to lower processing volumes in Italy and The Netherlands. Pears – Trade The majority of the pear trade occurs within the EU-27. Over the past 5 years, on average about
550,000 MT of pears were traded within the EU-27 between various MS, while roughly 350,000 MT
were imported from third countries. EU-27 external trade Imports MY 2010/11 imports are forecast to increase by a quarter over last year, due to lower estimated
production. Imports will however also depend on the availability of pears on international
markets. The main EU-27 importing countries continue to be The Netherlands and Italy, together

responsible for 60 percent of EU-27 pear imports. About 80 percent of the quantity entering The
Netherlands is shipped on to other countries in the EU. Table 7: EU-27 Imports of Pears in MT
Country of Origin: MY 2007/08 MY 2008/09 MY 2009/10
Argentina 156,765 164,216 101,878
South Africa 103,540 128,113 99,034
Chile 54,604 60,717 42,681
China 21,870 20,857 15,324
Turkey 4,711 8,651 5,042
Unites States 4,957 6,297 3,407
New Zealand 2,167 2,075 1,606
Uruguay 1,425 1,272 1,576
Other 1,654 1,371 1,292
World Total 351,693 393,569 271,840
Source: Global Trade Atlas Almost three quarter of the EU-27 pear imports come from Argentina and South Africa. Chile is
EU’s third largest supplier of pears. Trade with these 3 countries takes mainly place between
February and July. Other trade partners include China, Turkey and the United States, with trade
being concentrated September through March. U.S. pear exports to the EU-27 usually occur
between October and February. Industry contacts indicate good market prospects for U.S. pears
in January and February. In these months, they compete with domestically grown pears and
imports from China and Turkey. Consumer demand is strong for U.S. Anjou pears, especially in
the German market. Price however continues to be the main challenge in this price sensitive
market. The UK continues to be an important market for U.S. organic pears. Exports For MY 2010/11, EU pear exports are forecast to decrease by 17 percent compared to MY 2009/10.
This is due to the estimated lower availability resulting from decreased production in 2010. The
main EU-27 exporting countries continue to be Belgium and the Netherlands, who together account
for two-third of EU-27 pear exports. Other exporters include Portugal, Spain, Poland and
Lithuania. The leading export market for EU-27 pears is Russia, responsible for almost 70% of
total pear exports. Brazil and Norway are the EU’s 2nd and 3rd largest markets. Russia
traditionally is an important market for Belgium and the Netherlands (Conference pear) and to a
lesser extent for Poland and Lithuania. Brazil’s pear imports from the EU-27 mainly come from
Portugal (Rocha pear) while Norway’s suppliers are again the Netherlands and Belgium
(Conference pear). EU-27 exports start directly after harvesting and slow down by early spring. Table 8: EU-27 Exports of Pears in MT
Country of Origin: MY 2007/08 MY 2008/09 MY 2009/10
Russia 198,872 152,544 216,509
Brazil 10,113 9,798 25,578
Norway 24,740 21,238 20,846
Belarus 6,002 3,441 5,038
Algeria 788 932 4,777
Switzerland 4,151 7,760 4,595
Other 30,902 28,600 34,745

World Total 275,568 224,313 312,088
Source: Global Trade Atlas The restrictive phytosanitary requirements that were imposed by Russia last year are in general
being met by Dutch and Belgian traders. Pear shipments have to be accompanied by a Safety
Certificate. Until recently, China has been a closed market for EU pears. In October 2010,
Belgium and China signed a protocol which makes it possible for selected Belgian exporters to ship
pears to China. Pear production for China is only possible in areas without fire blight and where
control measures are in place against fruit worm. In the short term, China is expected to continue
to be a small market for EU pears and exports only totaled 34 MT in MY 2009/10. Exports to China
will grow as more regions within the EU become approved to ship. Pears - Prices Because of the estimated lower availability resulting from decreased production, combined with
small carry-over stocks, prices are expected to be somewhat higher this year. Pears – Withdrawal from market The situation is the same as with apples. Please refer to the respective paragraph in the apple’s
section of this report for detailed information. Pears – Additional Information For information on tariffs, maximum residue levels, labeling requirements please see the
respective sections at the end of the report. CAJ - Production Most EU concentrated apple juice (CAJ) production occurs September through November.
Production in the seven most important CAJ producing countries of the EU-27 (Poland, Germany,
Italy, Hungary, Spain, Romania, and Austria) is forecast to be 436,000 MT in MY 2009/10, 16
percent lower than in MY 2008/09. The combined output of these seven countries accounts for 95-
98 percent of the total EU-27 CAJ production. In MY 2009/10, decreased CAJ production was
attributed to high production costs, low juice concentrate prices, high stocks, and declining market
demand. In 2010/2011, low apple crop forecasts in main EU producer countries caused a further
decline in CAJ production. While industrial apple prices and CAJ prices increased as a result of
poor crop prospects, long term consumer trends show a declining market share for apple juice. It is difficult to separate the volume of apples used for CAJ production from other food industry
uses, such as non-concentrate apple juice, cider, preserves, wine/brandy, apple chips etc. A
detailed breakdown is not available in most countries. For some of the leading producers (Poland,
Hungary, Romania), large volumes of industrial apples are available and there are limited
alternative marketing channels, which keep CAJ production relatively stable. In other MS, CAJ
production is mainly a way to deal with surplus apple crops or to exploit high CAJ prices. Total CAJ
production continues to decline in the EU. Processing capacity, often located in nearby countries
such as Moldova or Ukraine, is increasing. EU-27 is not running at full capacity. CAJ - Quality A large portion of the raw material for CAJ production in Europe consists of high acid apples. This

is partly because of the climate, as apples grown under cooler temperature develop higher acid
content. The variety mix of the New Member States still contains a high percentage of old
varieties such as Jonathan and Idared. During the past several years, the EU food additive directive has given EU producers permission to
use natural ingredients (citric acid) in order to achieve the tart taste preferred by customers. At
the same time, increased imports of cheaper but sweeter CAJ from China have gained a significant
share of consumption. Nonetheless, the high acid European apple juice remains essential for the
fruit juice industry for blending the sweeter Chinese CAJ, and the increasingly popular multi-fruit
juice mixes. Apples and grapes are close substitutes for multi-fruit and sparkling juices. Apple juice concentrate
prices fluctuate with the level of apple juice concentrate imports and the availability of grape juice
concentrate in the market. Quality issues, such as added sugar or high iron content, surface from time to time but have not
resulted in serious trade disruptions. For CAJ imported from China laboratory findings frequently
show the presence of added non-fruit sugar. CAJ - Consumption Main user of CAJ is the fruit juice industry in apple or blended soft drinks. Consumption of fruit and vegetable juices is decreasing in most Western European countries as the
market has become saturated with competition from soft drinks. Some New Members however still
are seeing growth due to lower initial per capita consumption levels. In Germany and Austria the share of apple juice relative to other all fruit juices is 44 and 40
percent, respectively. (See the changes of fruit juice consumption in Germany between 2000-
2009 at Table 9.) Apple juices are also an important component of overall juice consumption in
the The Netherlands (28 percent) and the UK (24.5 percent). According to Euromonitor, Italy and
Spain are strong producers and net exporters of CAJ but apple juice was only 5.7 percent of all
fruit juices and 4.0 percent of the pure fruit juice sales in 2007. Table 9: Per Capita Consumption of Selected Juices and Fruit Drinks in Germany 2000-
2009 (in liter)
Per Capita Consumption of Selected Juices and Fruit Drinks in Germany 2000-2009 (in
liter)
2000 2005 2006 2007 2008 2009p % Change
Apple Juice 12.20 12.42 12.02 11.35 9.25 8.50 -8.1%
Orange Juice 9.53 8.93 8.92 8.32 8.00 9.00 12.5%
Grape Juice 1.32 1.29 1.28 1.25 1.00 1.00 0.0%
Grapefruit Juice 0.39 0.36 0.36 0.36 0.30 0.30 0.0%
Pear Juice 0.18 0.25 0.25 0.26 0.25 0.20 -20.0%
Vegetable Juice 0.96 1.35 1.36 1.35 1.20 1.20 0.0%
Citrus Nectar 7.75 7.26 7.30 7.20 8.00 6.50 -18.8%
Other Juice/Nectar 8.31 8.18 8.34 8.21 9.40 10.30 9.6%
Total 40.64 40.04 39.83 38.30 37.40 37.00 -1.1%

p= preliminary
Source: VdF, Association of the German Fruit Juice Industry, Annual Report 2009, page 45. In the premium segment (100 percent juice) CAJ utilization is reduced by the growth of “non
reconstituted” (NR) or “not from concentrate” juices made directly from fresh fruit. According to
Euromonitor, sales of NR showed double digit growth rate in the most quality conscious countries
(Germany, Netherlands, UK, and Austria) while the consumption of fruit/vegetable juices as a
whole declined. Home pressed fruit juice is increasingly popular. Sales of juice extractors
increased 10 percent in 2009 in spite of an economic downturn as by reported Euromonitor
International. Health conscious consumption trends are behind the success of fresh juice and
smoothie bars in recent years as well. According to fruit juice association estimates, about 20
percent of German apple juice production is bottled directly, while 80 percent is further processed
into CAJ. The non-juice use of CAJ is increasing. Cider is competing for fresh apples and, increasingly, CAJ.
The UK’s cider industry uses 6,000-7,000 MT of imported CAJ annually. In MY 2007/08, Polish
cider makers also substituted fresh apples with CAJ; however, this product is traditionally made
from fresh apples in smaller facilities. Other food processing industries such as baking, ice cream,
and dairy are growing consumers of CAJ, as well as the cosmetics and wellness industry. CAJ - Trade In past years, the EU was one of the largest apple juice concentrate importers. In 2008 and 2009,
EU imports of CAJ decreased to the extent that the United States became the biggest single import
market for apple juice concentrate. Of the EU-27 countries Germany, the Netherlands, and Austria
were the biggest buyers in MY 2009/10, accounting for 41 percent, 23 percent, and 14 percent, of
total EU-27 imports. (See Chart 3). Chart 3: EU-27 CAJ imports by country

Source: FAS Budapest based on GTA data
China remained the dominant origin for EU-27 CAJ imports in MY 2009/10. While exports
originating from China to the EU dropped by about 44 percent the past year, Turkey, Ukraine, and
Moldova sold more CAJ on the (shrinking) EU market. Industry expects decreased CAJ production
in the EU in 2010/11. Exports from China to the EU keep declining due to low exportable supplies.
Only a few smaller suppliers, especially Turkey, forecast increased sales to the EU.
Table 10: CAJ Trade of the EU-27
Concentrated Apple Juice Imports of the EU-27
MY 2008/09 MY 2009/10
Country MT US$ MT US$
China 156,537 159,777,076 88,755 67,619,758
Turkey 27,681 36,456,498 35,048 34,834,038
Ukraine 22,188 17,483,838 31,448 16,132,576
Switzerland 15,041 15,332,471 12,054 6,726,451
Moldova 12,656 12,354,885 17,255 11,717,516
Iran 2,286 2,877,557 8,596 5,774,762
Serbia 1,204 2,453,865 1,980 2,363,220
Brazil 1,036 1,442,453 2,387 1,553,586
Georgia 796 1,329,431 3,895 2,886,883

Other Countries 3,862 6,861,087 3,665 4,947,003
Total Imports 243,287 256,369,161 205,083 154,555,847
Concentrated Apple Juice Exports of the EU-27
MY 2008/09 MY 2009/10
Country MT US$ MT US$
Norway 9,458 6,237,480 7,671 9,597,170
Saudi Arabia 7,666 7,807,868 6,421 8,873,049
Japan 7,326 10,256,482 7,494 9,934,556
U.A. Emirates 2,211 1,454,463 2,389 2,919,126
Russia 1,770 1,015,652 1,317 1,753,934
Switzerland 1,629 693,639 845 1,010,051
Nigeria 1,130 1,683,135 954 1,923,344
Other Countries 9,989 7,996,312 10,178 14,614,324
Total Exports 41,179 37,145,031 37,269 50,625,554
Source: Global Trade Atlas
In MY 2009/10, EU exports continued their downwards trend and CAJ export sales were 10 percent
lower than the MY 2008/09 results. Major destinations for EU exports remained Norway, Saudi
Arabia, Japan, and the UAE. (see table 10). Sales to non-traditional CAJ export destinations
increased most. Industry attributes this to the increased demand in the cheap fruit drink segment
in some emerging Asian markets. EU apple juice exports to the United States fell to only a few
hundred MT in MY 2009/10.
CAJ – Prices
Reduced demand for apple juice and abundant stocks eroded CAJ prices through MY 2009/10 (see
Table 11). Producer prices for industrial apples were depressed in the previous season (in
Germany 4-6 € per 100 kg; in Hungary 6-8 € per 100 kg; in Poland 5-7 € per 100 kg reportedly)
which made farmers leave a part of the crop unharvested in many countries.
Table 11: Prices for Exported CAJ in Germany, Hungary and Poland 2008-2010 (in
$/MT)
Prices for Exported CAJ in Germany, Hungary and Poland 2008-2010 (in $/MT)
Year/Month Nov-08 Jan-09 Jun-09 Nov-09 Jan-10 Jun-10
Germany
1,818
1,579
1,445
1,838
1,456
1,035
Hungary 924
1,065
1,025 997 984 811
Poland 959
1,120
1,151
1,017
1,032 872

Source: GTA
By the summer of 2010, the situation started to change. Although there is no official data
available on CAJ stocks levels, industry sources reported that beginning stocks in MY 2010/11
became tight, not only in the crucial German market but in many other countries in the EU.
Currently, producer prices for crushing apples are in a range of 10-15 € per 100 kg in Germany
and prices similarly increased more than two fold in Poland and Hungary in response to poor
harvest prospects.
Table Grapes Coordinated by Stefano Baldi/FAS Rome Table 12: EU-27 PSD for Table Grapes (in ha, MT)
Fresh Table Grapes EU-
27
2008 2009 2010 2008/2009 2009/2010 2010/2011
MY Begin: Jun 2008 MY Begin: Jun 2009 MY Begin: Jun
2010 USDA
Official Data
Post Old Data
Post New Data
USDA Official Data
Post Old Data
Post New Data
Post New Data
Area Planted 126,100 126,100 125,779 125,300 125,300 122,818 121,494 Area Harvested 122,800 122,800 118,688 122,500 122,500 115,695 114,553
Commercial production 2,011,000 1,978,008 1,968,000 1,990,342 1,878,482
Non-commercial production
0 10,352 0 15,444 14,300
Production 2,011,000 2,011,000 1,988,360 2,000,000 1,968,000 2,005,786 1,892,782
Imports 636,992 635,920 640,298 622,000 600,000 563,556 590,000 Total Supply
2,647,992
2,646,920
2,628,658
2,622,000
2,568,000
2,569,342
2,482,782
Fresh Dom. Consumption 2,486,434 2,485,339 2,467,219 2,502,000 2,418,000 2,454,946 2,362,782
Exports 161,558 161,581 161,439 120,000 150,000 114,396 120,000 For processing 0 0 0 0 0 0 0
Withdrawal From Market 0 0 0 0 0 0 0
Total Distribution
2,647,992
2,646,920
2,628,658
2,622,000
2,568,000
2,569,342
2,482,782
Source: FAS EU-27 Table grapes – Production The European Union is a world leader in table grape production, together with China (4.9 MMT)
and Iran (1.8 MMT). At the same time, the EU is an importer of table grapes for fresh use. Most
production is concentrated in Italy, Spain and Greece. These three together on average account
for 90 percent of the total EU-27 production. After a dramatic drop in the past decade, EU table
grape area continues to decline albeit at a slower pace. Reduced profitability due to increasing
production costs, and strong competition from other suppliers are the main factors behind the
decline.

Table 13 – EU-27 Table Grapes Production by Country and Year (‘000 MT)
2008 2009 2010
Italy 1,368 1,341 1,260
Spain 278 278 278
Greece 150 193 165
Other EU MSs 192 193 190
Total 1,988 2,006 1,893
Source: FAS EU-27 EU-27 table grape production Total EU-27 table grape production in MY 2010/11 is estimated at 1.9MMT, which is lower than last
year. The drop is mainly due to falling production in Italy and Greece, two of the EU’s main
producers. Table grape prices have started to raise again due to reduced supplies, even though
demand is not recovering as expected. In MY 2010/2011, table grapes production in Italy is forecast down 8.3 percent to less than 1.3
MMT. In general, the harvest – still ongoing for some varieties – has been decent. Both white and
red seedless varieties (Sugraone and Summer Royal) harvested in July, at the beginning of the MY,
had high yields. Prices were also high, in part due to short Egyptian production. However, the
Victoria table grape variety experienced a -20/-25 percent drop in production due to bad weather
during flowering. Italia and Red Globe varieties harvested so far show good color, sugar content
and grape size. Prices are a bit higher than last year due to recovering demand. Farmers
producing early table grape varieties earned good profits thanks to higher prices in June and July. Chart 5: Average farm gate prices table grapes in Italy (Euro/kg)

In Spain, according to the latest forecast published by the Ministry of Environment and Rural and
Marine Affairs (MARM), table grape production for MY 2010/11 is expected to be 278,000 MT,
similar to last year. Despite adverse weather conditions in some production areas, weather has
been generally favorable. The main producing region, Murcia, is reporting very similar production
levels as last year, 155,000 MT. In the case of Alicante, a slight decrease is expected in total
production compared to last year - 84,000 MT for current MY compared to 90,000 MT in MY
2009/10. The main producing regions are the Murcia Region, the Comunidad Valenciana, and
Andalusia. In particular, Murcia and Alicante have 70 percent of the production area in Spain,
although each of these provinces produces different varieties at different times of the year. In Spain, over 50 varieties of table grapes are commercialized. Some of the most popular
traditional varieties are Aledo, Ideal, Muscatel, Dominga, and Napoleon. Seedless grapes show
and increasing share of production and currently, roughly 30 percent of total production is seedless
varieties whereas 70 percent is traditional varieties with seeds. Seedless varieties are mainly
produced in Murcia, where the total area planted to table grapes amounts to 6,150 hectares with
a production in MY 2009/10 of 155,000 MT, (85,000MT are seedless). Virtually, the same level of
production is expected for MY 2010/11. Around 80 percent of seedless table grapes produced in
Murcia are exported to the UK.
According to industry estimates, Greek table grapes current season is just over and has been a
very poor one, due to unfavorable weather conditions throughout the growing period. Harvesting
has finished and exports will continue for a couple more weeks. Greece had a very bad crop in
terms of both quality and quantity, particularly for seedless variety (fresh Sultana) representing
about two-thirds of total table grape production. According to industry estimates, there are
approximately 5,800 hectares of cultivated table grapes. The main producing areas include the
prefectures of Corinth in Peloponnese; Kavala in Macedonia; Heraklion on the island of Crete;
Sultana (Thompson Seedless) and Victoria. Source: ISMEA, Agricultural Marketing Center.
Table Grapes - Consumption Total EU-27 fresh grape consumption has been rather stable in recent years and stands at about
2.3-2.4 MMT. In MY 2009/2010, the economic crisis hurt EU household purchasing power and
slightly reduced EU table grape demand. The decline was more pronounced in Northern European
countries such as the UK and Germany. In MY 2010/2011, consumption is expected to continue to
decrease. Imports from third countries, normally coming in the first half of the calendar year from
the Southern hemisphere, represent approximately 30 percent of total consumption. Starting in
June with the Spanish and Greek harvests, and throughout the end of the year with the Italian
one, EU grape consumption is mostly met by domestic production. Italy is not only the main table
grape producer but also the main consumer in the EU, with almost one-third of the total
consumption, still predominantly the traditional seeded varieties (Italia variety). Following behind
Italy, the main consumers of table grapes are Germany, the UK and France. Despite the fact that
seeded grapes are still appreciated in Germany and France, experts claim seedless table grapes
are increasingly being demanded by EU consumers. Table Grapes - Trade The EU-27 is a net importer of fresh table grapes and imports into for MY 2010/2011 are likely to

increase as a consequence of reduced domestic supply. In MY 2009/2010 EU-27 table grapes
imports decline by approximately 80,000 MT and exports decrease by almost 50,000 MT. The
import value on the contrary increased to $1.4 billion. Table 14 – EU-27 Table Grapes trade Balance (MY June-May)
1000 Tons mil $
2007/200
8
2008/200
9
2009/201
0
2007/200
8
2008/200
9
2009/201
0
Import 644 640 564 1,520 1,272 1,396
Export 136 161 114 236 272 206
Balanc
e -508 -479 -449 -1,285 -999 -1,191
Source: GTA. The major suppliers into the European market come from the southern hemisphere, where
production is counter-seasonal to the EU and where seedless table grapes are widespread, with
South Africa and Chile the leading suppliers. Imports from the U.S. have grown but are still below
2 percent of total and are mainly directed to the UK market. The largest EU importing countries
are Germany, the UK and the Netherlands, but while the first two countries are also the largest
consumers (behind Italy) the Netherlands mainly serves as a trans-shipping point. Table grape exports outside the EU dramatically fell in MY 2009/2010 (-29.1 percent), but are
expected to recover slightly in MY 2010/2011. The EU mainly exports table grapes to Russia and
Switzerland. However, in MY 2009/2010 Russia suffered from the effects of global recession and
significantly cutting table grapes purchases from the EU. Chart 6: EU-27 main table grapes import partners (‘000 MT, MY June-May)
Source: GTA. Chart 7: EU-27 main table grapes export partners (‘000 MT, MY June-May)

Source: GTA.
Policy Coordinated by Tania DeBelder/USEU/FAS Brussels Common Market Organization for Fruits and Vegetables The EU Common Market Organization for Fruits and Vegetables (CMO) was reformed in 2007. The
aim was to bring the F&V sector in line with other agricultural sectors that were already reformed
under the Common Agricultural Policy (CAP). Council Regulation 1234/2007 established a single
common market organization (CMO) for all agricultural products and replaced 21 existing
CMOs. The policy changes agreed in the context of the CMO reforms for fruit and vegetables were
incorporated in the single CMO by Council Regulation 361/2008. The old-style production-linked
payments have been replaced by decoupled payments. The shift from production support to direct
aid to producers was designed to improve the competitiveness, market orientation and
sustainability of the sector. Producer Organizations (PO's) are the key elements in the EU's CMO for fruit and vegetables. PO's
are legal entities established by producers to market commodities within the following categories:
fruits and vegetables, citrus fruit, nuts, mushrooms, products intended for processing, and some
cross-commodities. EU subsidies are not paid to individual producers but are channeled through PO's. In order to
qualify for EU subsidies, PO's must submit an operational program financed through an operational
fund. The EU's financial contribution is paid directly into the PO's operational fund. The implementing rules for the reform of the F&V sector are laid down in Commission Regulation
1580/2007. It was last amended by Regulation 687/2010 on new EU rules for aid to fruit and
vegetable POs introducing a list of fixed coefficients to calculate the Value of the Marketed
Production (VMP) of POs. EU support to POs is calculated as a percentage of the Value of the
Marketed Production (VMP) and a lack of clarity resulted in some POs including the value of
marketing, processing & packaging of the final produce in their definition of the VMP. The new
rules stipulate that 73 percent of the final "invoiced value" of concentrated fruit juices should be
used when calculating the VMP of POs, i.e. a co-efficient of 73 percent.

An “Overview of the implementation of direct payments under the CAP in Member States” can be
found at: http://ec.europa.eu/agriculture/markets/sfp/pdf/ms_en.pdf Fruit School Scheme A key objective of the reform of the Fruit and Vegetable regime was to reverse the declining
consumption of fruit and vegetables. The European School Fruit Scheme (SFS) is one measure to
combat child obesity. Commission Regulation 288/2009 is laying down the rules for applying Council Regulation
1234/2007 as regards Community aid for supplying fruit and vegetables, processed fruit and
vegetables and banana products to children in educational establishments, in the framework of a
School Fruit Scheme. All schemes would consequently include three elements: free distribution of
fruit (and/or vegetables) in schools, a series of accompanying measures (for example information
campaigns on healthy eating habits), and monitoring and evaluation. The scheme aims to provide
fruit & vegetables to school children from the start of the school year. The SFS makes €90 million of EU funds available to provide fruit and vegetables to school children
to be matched by national and private funds and the system will be reviewed after 3 years. The
scheme began at the start of the 2009/2010 school year. Besides Finland and Sweden, 25 of the
27 Member States have opted to participate in the second year of the scheme. The main
beneficiaries of the scheme According to the definitive allocation of €90m in Community financing
for the 2010/2011 school year are Italy (€21 million), Germany (€10 million), Romania (€9.6
million) and Poland (€9.2 million). The SFS also requires participating Member States to engage in educational & awareness-raising
initiatives on healthy eating, as well as the sharing of best practice. Commission figures reveal that
some 22 million children in the EU are overweight, with more than 5 million of these classified as
obese, a figure that is expected to rise by 400 000 every year. Information and documents on the
School Fruit Scheme are available on internet at:
http://ec.europa.eu/agriculture/markets/fruitveg/sfs/index_en.htm . Import Licenses To ensure a timely transmission of statistical data on EU apple imports, particularly for imports
originating from the Southern Hemisphere, the EU requires imported apples to have an import
license. For details on the system please refer to report E36009, which can be accessed at:
http://www.fas.usda.gov/gainfiles/200601/146176623.pdf
Maximum Residue Levels for Fruits Maximum Residue Levels (MRLs) for pesticides are harmonized throughout the EU. New legislation
on the approval of pesticides entered into force at the end of 2009 and will become fully applicable
as from June 14, 2011. How this will affect MRLs can only be determined after the new legislation
is fully implemented. For detailed up-to-date information please visit:
http://www.fas.usda.gov/posthome/useu/pesticides.html. As a marketing tool, some retail chains in the EU exceed the EU regulations and require their

suppliers to adhere to stricter company policies that limit the maximum residues to 30, 50 or 70
percent of the respective EU MRL (or so-called private standards). EU-Russian MRLs harmonized Fruit and vegetables are the largest EU agricultural export to Russia. The Russian Federation
aligned some of its MRLs with the EU and with international standards. EU and Russian Federation
scientific bodies have reached a common understanding concerning pesticide residues for fruit and
vegetables, as some of the Russian MRLs were excessively strict. The amended Russian law
entered into force in early June 2010. The development provides more favorable conditions for EU exporters of vegetables and fruit, such
as apples and pears, grapes, citrus fruits and stone fruits (peaches, apricots, etc.). Fruit and
vegetables are the largest EU agricultural product category exported to the Russian market and
exports are expected to grow during the 2010/11 season. The value of trade of these products was
€ 2.3 billion in 2009, mainly exports from the EU to the Russian Federation. The dialogue on harmonization of Russian norms with EU and international food safety standards
will continue, on residues in veterinary medicinal products in the areas of meat and dairy products,
on standards in the areas of plant health, veterinary inspection, contaminants, microbiological
standards in foodstuffs, etc. Certification of Fruit Shipments Plant products need a phytosanitary certificate to be exported to the EU. Phytosanitary certificates
issued by an APHIS inspector are required to accompany fruit, vegetable and nut shipments.
APHIS issues phytosanitary certificates in accordance with international regulations established by
the International Plant Protection Convention of the Food and Agriculture Organization of the
United Nations. This standard-setting body coordinates cooperation between nations to control
plant and plant product pests and to prevent their spread. An overview of EU mandatory and voluntary certificates can be found at:
http://www.fas.usda.gov/posthome/useu/certificates-overview.html Council Directive 2000/29/EC contains provisions concerning compulsory plant health checks. The
checks consist of documentary, identity and physical plant health checks to verify compliance with
EU import requirements. More information can be accessed on DG Health & Consumer Protection's
website: http://ec.europa.eu/food/plant/organisms/imports/inspection_en.htm . Commission Regulation 1756/2004 provides for plant health checks to be carried out at reduced
frequency where this can be justified. According to the updated list (updated July 7, 2010) of
products recommended for plant health checks at reduced levels, the frequency of inspections on
imports of U.S. apples is going up to 50 percent instead of 25 percent for the Malus species. An overview of EU mandatory and voluntary certificates can be found at:
http://www.fas.usda.gov/posthome/useu/certificates-overview.html. Tariffs Imports of fresh fruit and vegetables are subject to the Entry Price System (EPS) which has been
in place in its current form since the Uruguay Round. It is a complex tariff system that provides a
high level of protection to EU producers. In this system fruits and vegetables imported at or above
an established entry price are charged an ad valorem duty only. Produce valued below the entry
price are charged a tariff equivalent in addition to the ad valorem duty. The tariff equivalent is
graduated for products valued between 92 and 100 percent of the entry price. The ad valorem
duty and the full tariff equivalent are levied on imports valued at less than 92 percent of the entry
price. Whether or not the EU will maintain the EPS will be discussed in the context of the Doha Round
trade talks. The EPS is not necessarily discriminatory for U.S. exporters. The U.S. tends to sell
high quality products, which are usually relatively high priced and do not face any additional duty.
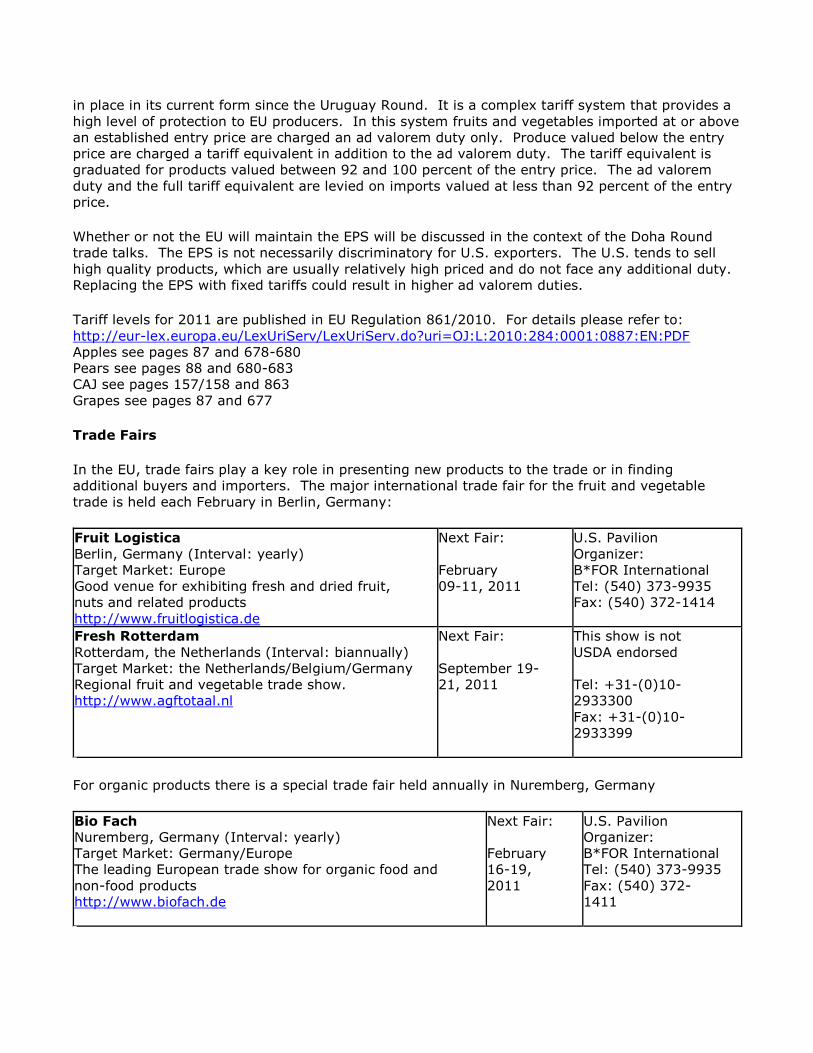
Replacing the EPS with fixed tariffs could result in higher ad valorem duties. Tariff levels for 2011 are published in EU Regulation 861/2010. For details please refer to: http://eur-lex.europa.eu/LexUriServ/LexUriServ.do?uri=OJ:L:2010:284:0001:0887:EN:PDF Apples see pages 87 and 678-680 Pears see pages 88 and 680-683 CAJ see pages 157/158 and 863 Grapes see pages 87 and 677 Trade Fairs In the EU, trade fairs play a key role in presenting new products to the trade or in finding
additional buyers and importers. The major international trade fair for the fruit and vegetable
trade is held each February in Berlin, Germany:
Fruit Logistica
Berlin, Germany (Interval: yearly)
Target Market: Europe
Good venue for exhibiting fresh and dried fruit,
nuts and related products
http://www.fruitlogistica.de
Next Fair:
February
09-11, 2011
U.S. Pavilion
Organizer:
B*FOR International
Tel: (540) 373-9935
Fax: (540) 372-1414
Fresh Rotterdam
Rotterdam, the Netherlands (Interval: biannually)
Target Market: the Netherlands/Belgium/Germany
Regional fruit and vegetable trade show.
http://www.agftotaal.nl
Next Fair:
September 19-
21, 2011
This show is not
USDA endorsed
Tel: +31-(0)10-
2933300
Fax: +31-(0)10-
2933399
For organic products there is a special trade fair held annually in Nuremberg, Germany
Bio Fach
Nuremberg, Germany (Interval: yearly)
Target Market: Germany/Europe
The leading European trade show for organic food and
non-food products
http://www.biofach.de
Next Fair:
February
16-19,
2011
U.S. Pavilion
Organizer:
B*FOR International
Tel: (540) 373-9935
Fax: (540) 372-
1411

Related Reports
Country
Report Nr.
Date Title
EU27 - 49048 08/07/2009 Food and Agricultural Import Regulations and Standards
EU27 – 49082 11/16/2009 Fresh Deciduous Fruit Annual 2009
EU27 – E49013 11/26/2008 Fruits & Vegetables: EU Marketing Standards
EU27 – E48101 09/29/2008 EU Certification Guide - Update
Commodities:
Select


