1
Environmentally Significant Behavior: The Role of Social Capital
Seong-gin Moon, Ph.D. Associate Professor
Department of Public Administration Inha University
Ki-Whan Kim, Ph.D. Associate Professor
Seoul National University of Science and Technology [email protected]
Environmentally significant behavior (ESB) describes individuals’ voluntary and proactive efforts to allocate and consume environmental resources in socially sustainable manner. It confronts collective action problems since it incurs personal costs and yet its resulted benefits are shared by everyone and therefore encourages free rides on the efforts of others. This paper empirically examines how social capital can play role into facilitating two primary private-sphere ESBs associated with global climate change: personal environmental constraints and green consumerism. Using the National Survey of Public Environmental Behavior of Koreans, this paper constructs ordinary square regression models to estimate such effects. The empirical results show that social capital and pro-social behavior are the strongest predictors of ESBs. In addition, ESB is strongly influenced by socio-demographic characteristics, including age, gender, and education, and environmental cognition and knowledge.
Introduction
The continual expansion of the economy development has produced explosive population
growth and raised our consumption. In the absence of serious and collective environmental
endeavor, it will end in collision with the limit of the natural system (Brown and Mitchell,
1991; Hart, 1995; Ostrom, 2009). Such conflict is manifested in all forms of environmental
problems, including air/water pollution, aquifer depletion, and climate disruption. These
problems challenge the way humans live and demand their serious actions for lessening
human impacts on the environment and building an environmentally sustainable economy.
To deal with these environmental challenges and furthermore progress toward
sustainability, government has undertaken serious policy measures that can intervene in
2
polluting behavior and policy mechanisms that can create incentives for innovative
environmental technologies. These government efforts would be important but not sufficient;
they would be undermined without individuals’ voluntary and cooperative environmental
actions. It is essential for individuals to be aware of their own environmental responsibilities
and transforming their everyday “private” practices unsustainable to sustainable ones.
Recently, an individual’s environmentally significant behavior (ESB)1 has been
slowly incorporated into everyday life and gradually transforms the economic system into
one more environmentally sustainable (Pfeffer and Stycos, 2002). Individual constraints on
consumption and purchase of products with few environmental impacts are good examples.
This private action involving change in ordinary practices and lifestyles would produce the
important public consequence of the environment on sustainability.
Despite the significant implications of ESB on sustainability, this voluntary
contribution never provides the adequate level of what is necessary for meaningful
environmental impacts. Insufficient supply of ESB is related to “collective action problems”
(Hardin, 1968; Olson, 1971; Ostrom, 1990) or “social dilemma” (Dawes, 1980; Yamagish,
1994). Self-seeking and rational individuals want to merely enjoy the environmental benefits
from ESB without contributing their portion for the benefits (Olson, 1971). Such benefits as
reduction in CO2 are non-excludable without adversely affecting others’ access to them.
Therefore, free-ride on the efforts of others is more likely. This opportunistic behavior
prohibits realization of collective beneficial choice, in this case, undertaking ESB.
The important question is how we can facilitate ESB? Despite collective action
problems, why some individuals undertake such collective behavior? What would be the
1 It is also referred to as pro-environmental behavior, environment friendly behavior, environmentally responsible behavior, ecological behavior, and conservation behavior.
3
proper role of government in promoting it? To draw on meaningful environmental impacts, it
is important to increase the number of environmentally conscious individuals and achieve the
network effects.
This paper pays special attention to the role of “social capital” in promoting two
primary areas of ESBs: (1) personal environmental constraints on consumption and (2)
personal green consumerism. Social capital is known to be the important antecedent for
voluntary and cooperative actions for collectivities (Coleman, 1990; Fukuyama, 1995;
Putnam, 1993). Based on the National Survey of Public Environmental Behavior, we
construct ordinary square regression models to estimate the impacts of social capital on ESB
in South Korea.
This paper contributes to existing literature for several reasons. First, it empirically
tests theoretical links between social capital and voluntary behavior by focusing on ESB. We
expect that our finding can provide the significant addition to the literature on pro-
environmental behavior. In addition, existing studies on this area are predominantly
undertaken to examine behavior by westerners, not by Asians. Our study examining Koreans’
environmental behavior can provide valuable information to compare and contrast with that
of other western people. Finally, literature on this area mainly focuses on psychological
factors and demographical characteristics. It lacks paying attention to the social context in
which individuals interact and communicate, a social process by which social capital is
developed.
ESB: Definition and types
ESB involves individuals’ voluntary and proactive behavior toward allocating and
managing environmental resources in socially sustainable manners. ESB goes beyond extant
4
regulatory requirements and can play an important role in promoting environmental
sustainability. Recently, ESB gains growing attention from scholars as a feasible and
practical complement to dealing with non-traditional environmental issues like global climate
change; these issues are characterized by weak regulatory regimes and environmental
leaderships, largely due to disagreement over the level and methods of addressing them
(Bruner and Klein,??MORE).
ESB is defined by both its impact and intention (Stern, 2000). The former describes
the level to which individual environmental behavior is altered to environmental change
either directly or indirectly. The direct environmental impacts that individuals make would be
introduced by practicing sustainability through their everyday life, including reduction in
material consumption and pollution-causing activities. Also, environmental change can be
achieved indirectly by shaping the context in which decision are made that affect the
environment (Stern, 1997, 2000). Individuals can influence public policies that are directly or
indirectly associated with the environment by participation in the political process. For
example, policies related to local transport and waste management infrastructure can affect
the pattern of behavior such as personal travel and waste disposal (Peattie, 2001). Similarly,
market provisioning systems can influence individual’s consumption. In addition, ESB is
undertaken with the intention to affect the environment. This environmental intent is one that
triggers environmental actions. It does not necessarily lead to the actions that result in
environmental impacts (Stern, 2000). For example, individuals report their willingness to
make “green” purchasing and other related pro-environmental behavior, which often fails to
translate into the actual behavior. Discrepancy between environmental intention and behavior
is widely discussed in the literature (Jobber, 2000; Stern et al., 2000; for theoretical
discussions, see Ajzen, 2005).
5
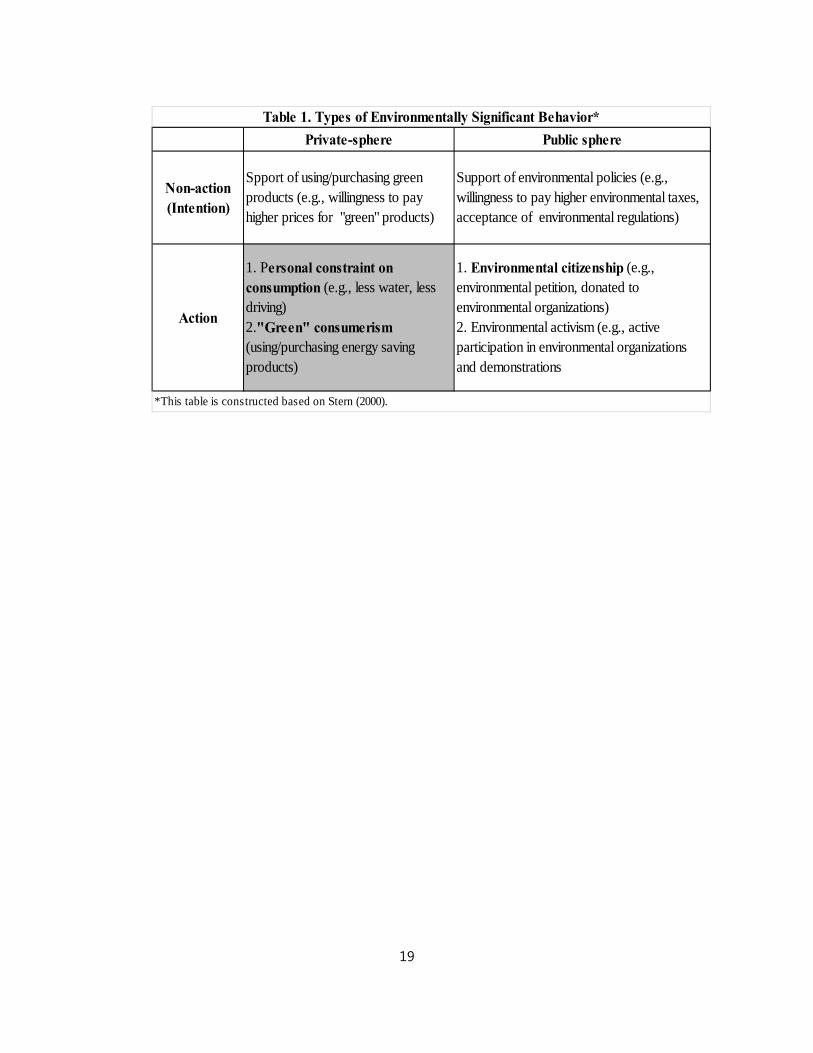
[Table 1 about here]
Building upon the definition of ESB, it can be classified into four coherent subtypes
by the two-by-two table2. The vertical dimension provides distinction of behavior between
inactive that describes environmental intention and active that leads to actions causing
environmental impacts. The horizontal dimension focuses on domains where individual
environmental behavior occurs, ranging from private to public. First, private-sphere behavior
involves actions causing environmental impacts directly by shifting in personal lifestyle that
practices “voluntary simplicity,” either dramatically or incrementally. It entails personal
curtailment of consumption (e.g., water, meat) and the use/purchase of environmentally
friendly products (Olsen, 1981, Stern, 2000). Second, public-sphere behavior involves actions
causing environmental impacts indirectly through public domain, participating in public
policy-making processes via various means, including environmental protest, environmental
petition, and donation to environmental organizations (Stern, 2000).To put both dimensions
together, we categorized four types of ESB, including non-active private sphere, non-active
public sphere, active private-sphere, and active public-sphere. This paper pays special
attention to active private-sphere ESBs, including personal constraints on consumption and
green consumerism. Recently, they are obtaining much attention from both policy-makers
and scholars as important areas for environmental sustainability. Without drawing on
individuals’ voluntary efforts to change their unsustainable level of consumption, any
initiatives involving policies and technology will be in vain.
[some statistics about Korean ESB]
ESB and Collective Action Problems
2It is constructed based on the typology suggested by Stern (2000).
6
Facilitating ESB would be challenging since it confronts collective action problems (CAPs).
Individuals who pursue their private interests are less likely to bear the costs of ESBs for the
sake of promoting others’ environmental welfare, unless there are significant incentives for
them to do so (Olson, 1965). The individuals want to enjoy the benefits of collective
outcomes resulting from ESB such as improved environmental quality without paying their
own due for the benefits. Basically, they want to free-ride on others’ environmental efforts.
This challenge is well studied by scholars with their discussions about the tragedy commons
(Hardin, 1968), the prisoner’s dilemma game (Axelrod, 1984), and the logic of collective
action (Olson, 1965). It is typical and primary issue in the governance of the common good
(Ostrom, 1990, 2000; Pretty, 2003). Even with this challenge, some individuals undertake
voluntary and progressive efforts toward environmental sustainability, e.g., consuming less,
driving less, and buying green products. Why? What can foster these cooperative and
collective behaviors? We pay special attention to the role of social capital in promoting them
in the face of collective action problems.
The Role of Social capital
Social capital is generally understood as social goodwill and resources such as trust and
reciprocity, a positive by-product of the accumulation of social relations and interactions
(Adler and Kwon 2002; Lin 1999; Putnam 1995, 2000). Scholars in sociology, economics,
and political science employ social capital as a crucial means to promote voluntary and
cooperative behavior toward common purposes (Coleman, 1990; Fukuyama, 1995; Putnam,
1993). Higher levels of social capital appear to play a positive and significant role in the areas
where coordinated actions are needed to produce collective outcomes, including economic
development, democratic governance, low crime rates (Adler and Kwon 2002; Fukuyama,
7
1995;Putnam 1995), environmental sustainability (Pretty, 2003), and environmental
governance (Brondizio, Ostrom, and Young, 2009).
The literature suggests different types of social relations and mechanisms that give rise to
social capital. First, “generalized (or thin) trust” is built upon social relations beyond their
own groups. People in this social relation are willing to look outward and contact with people
different from themselves (Fukuyama, 1995; Putnam, 2000; Uslner, 2002). Second, some
scholars look at trust toward public institutions and officials as indicators of social capital,
arguing that such trust is “part of the complex attitudes and behavior that makes up social
capital” (Stolle and Rochon, 1998, p. 51) and a “specific instance of trust in mankind” (Lane
1959, 164). Third, public trust in civic society organizations (CSOs) can be a good source of
social capital, which represents “a network of moral communities that are critical to engender
social solidarity and wider trust in society” (Durkheim, 1957; Fukuyama, 1995, p. 309).
Public trust in CSOs can lead an active civic participation in the organizations, through which
individuals can learn about and understand issues requiring their attention and also promote
interpersonal relations and cooperative behavior.
Social capital can help individuals deal with collective action problems and free-riding.
Positively, it can promote public cooperative and collective actions, including environmental
protection. This is because social capital can create personal expectation that other people and
institutions will do the similar collective actions beneficial to them sometime in the future
(Putnam, 2000).
It is reported that social capital in South Korea is low; according to Samsung Economic
Research Institute (2009), South Korea ranked in 25th out of 72countries and 22th out of 29
OECD countries. Also, World Value research survey (2005-2006) indicated that 3 out of 10
Koreans responded positively to the question asking their trust toward general people. This
8
response is lower than other Asian countries, including China (5.2) and Vietnam (5.2).
Similarly, this survey result indicated the low level of trust toward government institutions
(congress, government, political parties, and the police) and social institutions (religious
organizations, business, NGOs).
Research Methods
Data
This study employed data from the National Survey of Public Environmental Behavior
conducted in South Korea during spring of 2012. The survey data was gathered from a
random sample of 5,000 residents drawn from a National Survey Panel developed by a
national survey company. The panel proportionally represents the population of major cities.
Questionnaires with cover letters addressed to the name listed in the panel directory were
mailed to each of the household. Out of 5,000 mails sent out for survey, we received 1085
responses after deleting 60 incomplete responses. A response rate was about 21.7%.
Variable measures
The following is the variable measures included in our empirical model. Details about the
coding schemes for these variables are provided in Table 1.
Dependent variables
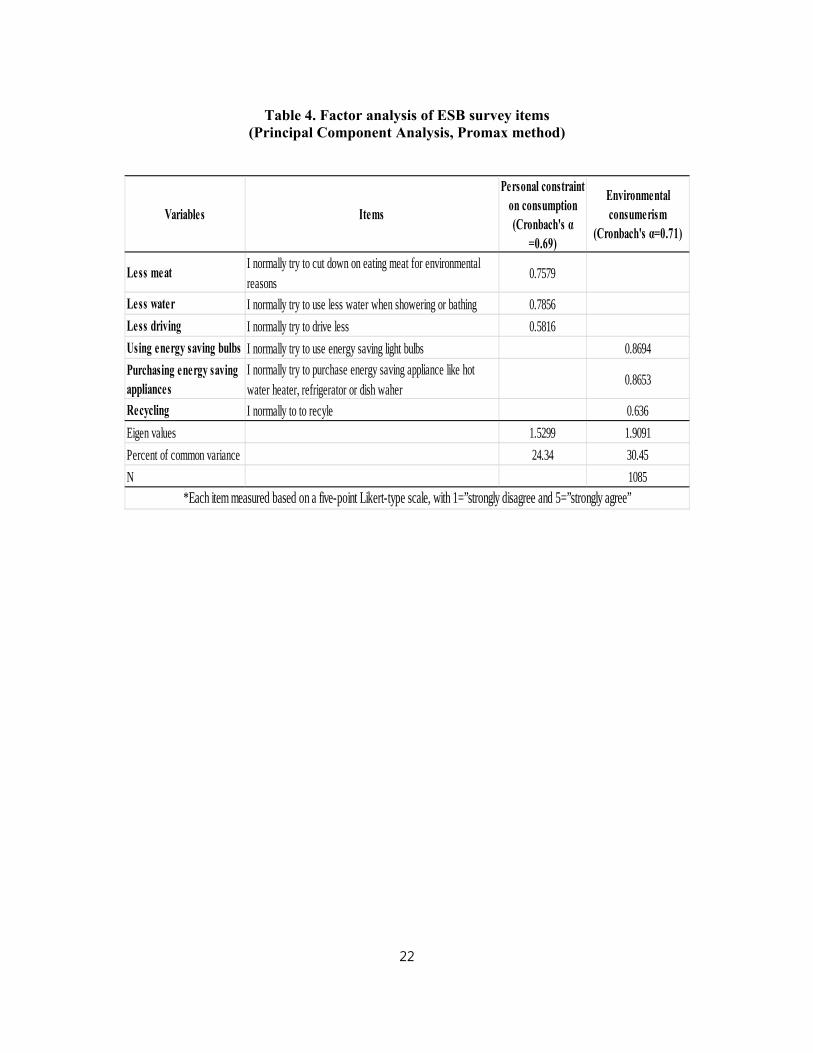
Private-sphere ESB is measured in two different ways. First, it is measured by separate
measures of two dimensions: (1) personal constraint on consumption (i.e., less meat, less
water, less driving) and (2) personal green consumerism (i.e., energy efficient bulb use,
energy efficient electronic device use, and recycling). Second, measures in each dimension
9
are combined into a single factor by using a principal component analysis (PCA). These
combined indexes are reliable and accurately represents an underlying dimension associated
with personal constraint on consumption (Cronbach’s alpha= 0.69) and personal green
consumerism (Cronbach’s alpha= 0.71). Each measure is measured based on five-point
Likert-type scale, with 1 representing “strongly disagree” and 5 “strongly agree.” Pffefer and
Stycos (2002) used the similar measures to estimate ESB. Details are summarized in Table 4.
Independent variable
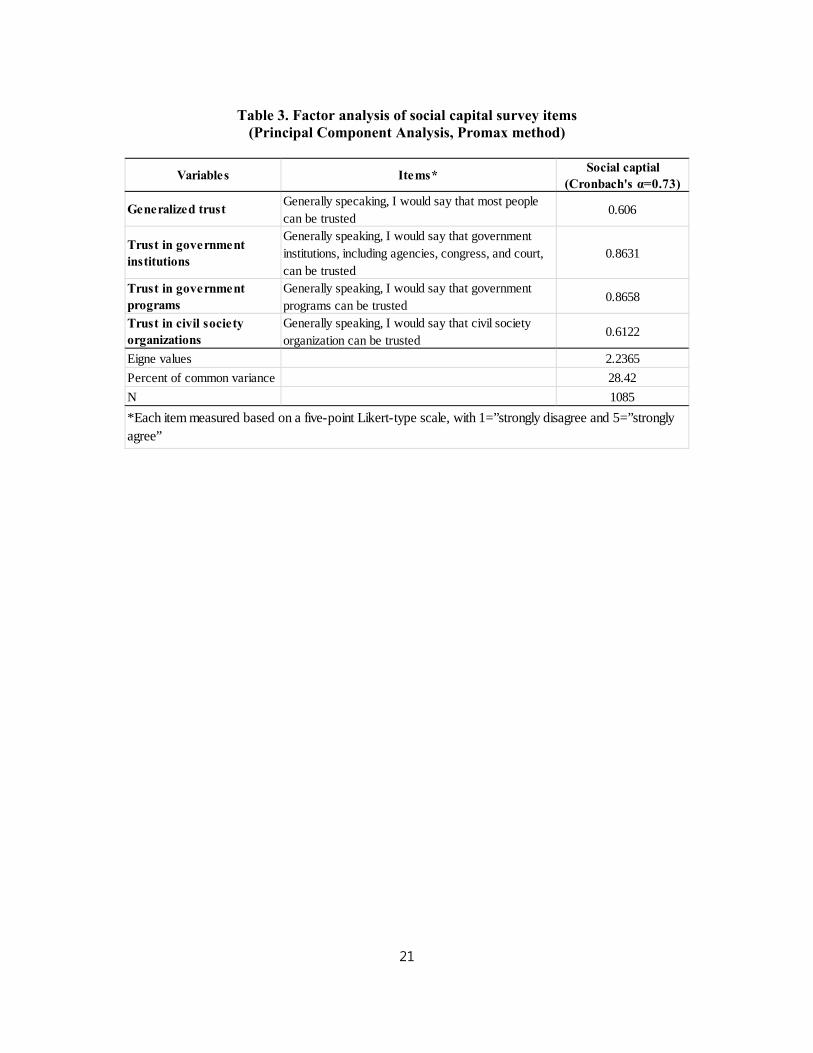
Social capital is measured by an additive index of multiple modes of trust: generalized
trust, trust in government institutions, and trust in government programs, and trust in civil
society organizations.” Generalized trust is measured by asking respondents to respond to the
statement (General Social Survey, 1994): “Generally speaking, I would say that most people
can be trusted.” Similarly, trust in government institutions is measured by the response to the
statement: “Generally speaking, I would say that government institutions, including
government agencies, congress, and court, can be trusted.” Finally, trust in government
programs and civic society organizations are measured in similarly ways. These measures are
evaluated by using five Likert scale with a range between “strongly disagree” and “strongly
agree.” Details about these measures are found in Table 3.
Control variables
New environmental paradigm (values) (NEP) is underlying worldview and mindset that
people have toward the environment. It emphasizes harmonious interaction between humans
and nature (Catton and Dunlap, 1980; Dunlap and Van Leire, 1978; Schwartz, 1992). This
world view is typically captured by “spaceship earth metaphor,” suggesting that the earth can
10
support only the limited number of people with its limited resources. It reflects people’s shift
in their environmental worldview from the so-called “dominant social paradigm,” suggesting
human dominance and control over the environment and nature resources and thus the
support of unlimited industrial growth (Dunlap and Van Leire, 1978). The effects of NEP on
ESB vary; they range from nonexistent (Smit et al., 1994) to weak (Dunlap and Van Liere,
1978; Midden and Titsema, 1983; Scott and Willits, 1994) to fairly moderate (Hines et al.,
1986) [from Kaiser et al., 1999]
To measure NEP, we adopted the items used by Dunlap and Van Liere’s (1978) and
Dunlap et al. (2000): (1) “The balance of nature is very delicate and easily upset by human
activities”; (2) “The earth is like a spaceship with only limited room and resources”; and (3)
“we are approaching the limit of the number of people the earth can endure”. Three items are
combined into a single factor by using a principal component analysis. This combined index
of NEP was reliable and accurately represents an underlying dimension associated with NEP
(Cronbach’s alpha= 0.73). The items were measured based on five-point Likert-type scale,
with 1 representing “strongly disagree” and 5 “strongly agree.”
Environment-economy trade-off (EET) is concerned with people’s perception toward the
negative relationship between environmental protection and economic development. It is
measured by the respondents’ responses to three statements (O’Connor et al., 2002) : (1)
“environmental regulations have a negative impact on economy”; (2) “environmental
regulations have a negative impact on employment”; and (3) “individuals are worse off by
environmental regulations.” Their responses were assessed based on five-point Likert-type
scale, with 1 representing “strongly disagree” and 5 “strongly agree. Three items are
combined into a single factor and this additive index was reliable and accurately represents an
underlying dimension associated with EET (Cronbach’s alpha= 0.86).”
11
Environmental knowledge indicates the level of knowledge that people have of causes of
a major environmental issue like global warming. It is measured by a combined index of five
measures to assess respondents’ knowledge about primary causes of global warming,
including (1) pollution from companies, (2) car driving, (3) usage of fossil fuels, (4) usage of
electronic appliances, and (5) destruction of tropical forests. We adopted these items from
O’Connor et al. (2002). The Cronbach’s alpha of 0.86 indicates the reliability of the index
and represents an underlying dimension associated with environmental awareness. Each item
were measured on five-point Likert scales ranged from 1 (not a cause at all) to5 (primary
cause).
Literature generally confirmed the significant and positive impact of environmental
knowledge on progressive environmental behavior of individuals (Barr, 2007; Hines et al.,
1987; Schahn and Holzer, 1990; Tarrant et al., 1997).Basically, these result suggest cognitive
factors like environmental knowledge as important prerequisites for the development of
environmental behavior (Bamberg and Moser, 2007).
Prosocial behavior is measured by an additive index of three measures designed to
reflect the level of respondents’ prosocial behavior. Respondents were asked to respond to the
following statements: (1) “sometimes I give changes to pandhandlers,” (2) “from time to time
I contribute money to charity,” and (3) “from time to time I volunteer to community.” Each
response ranges from 1 (strongly disagree) to 5 (strongly agree). The Cronbach’s alpha of
0.78 indicates the reliability of the index and represents an underlying dimension associated
with prosocial behavior. Each item were measured on five-point Likert scales ranged from 1
(not a cause at all) to5 (primary cause).
Age is an ordinal variable. This variable is not designed as a continuous variable since
asking people’s age can be culturally sensitive and even considered as inappropriate to some
12
people, particularly among females and the elders. This direct asking can make this question
unanswered. As for the coding schemes, respondents who indicated their age below 18 years
old were coded as one, those with an age between 19 and 24 were coded as two, those with
an age between 25 and 34 were coded as three, those with an age between 35 and 44 were
coded as four, those with an age between 45 and 54 were coded as five, and those with above
55 were coded as six. About 97% of the respondents were between 19 and 44 years old.
Gender is a nominal variable. Males were coded as one, and females were coded as zero.
Approximately 48% and 52% of the respondents were males and females, respectively.
Household income is an ordinal variable and is measured using the total gross household
income before taxes for 2009. Respondents who indicated their income to be below $35,000
were coded as one, those with an income between $35,000 and $70,000 were coded as two,
and those with above $70,000 were coded as three. About 34% and 42% of the respondents
indicated the first and second income category respectively.
Home ownership is a nominal variable. The homeowners were coded as one; otherwise,
zero. 44% of the respondents indicated owing their home.
Marital status is a nominal variable. Married people were coded as one; otherwise, zero.
About 80% of the respondents indicated the married.
Educational attainment level is an ordinal variable. The respondents were asked their
highest level of education completed in Korea as of 2009. Respondents who completed
middle school education were one, the high school graduates were two, the college graduates
were three, and those with graduate degree or higher were four. More than 81% indicated
holding college degree or higher.
Religiosity is an ordinal variable measured by the frequency of attending religious
services. Respondents attending religious services more than once a week were coded as four,
13
approximately once a week as three, approximately once a month as two, only on major
religious holidays coded as one, and those immigrants who did not attend religious services
were coded as zero. About 43% and 22% indicated attending religious services more than
once a week and once a week respectively.
Finally, we use a dummy for controlling residents in Seoul metropolitan area, including
Seoul, Incheon, and Kyungki province. More than 50% of the population and cultural-social-
economic functions (e.g., industry, businesses, hospitals, universities, Museums) are
concentrated in this area (reference). Because of that, environmental problems are generally
severe than any other areas in South Korea. We coded Seoul metropolitan area residents as
one and otherwise zero.
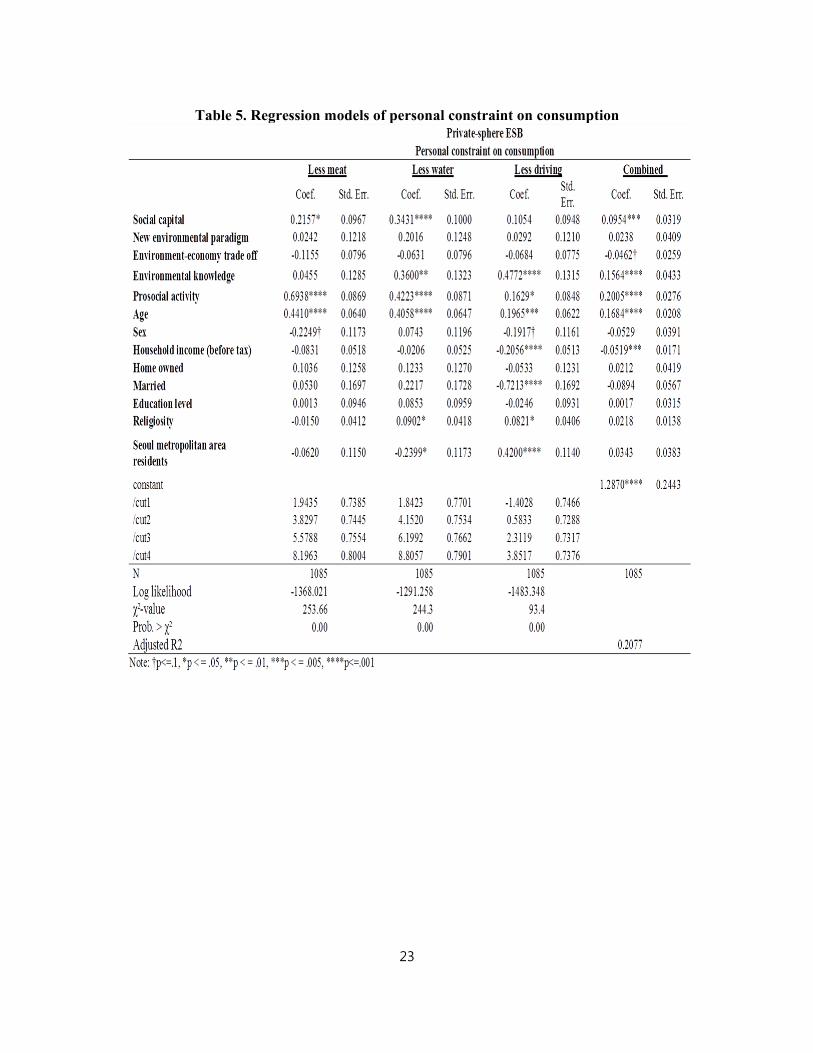
Empirical Analyses
Table 2 offers descriptive statistics. Table 5 and 6 provide regression models of two
areas of private-sphere ESBs: (1) personal constraints on consumption (PCC) and (2)
personal green consumerism (PGC). We constructed both ordered logit regression models
(OLRMs) and a linear function of the ordinary least squares (OLSs) regression models.
OLRMs are adopted to evaluate discrete behavior of PCC (i.e., energy saving bulb
use, energy saving appliance purchases, and recycling) and PGC (i.e., meat consumption,
water use, and driving) that are ordinal dependent variables (Long, 1997). A Wald test held
the parallel assumption, indicating that slope coefficients of probability curves of each level
of pro-environmental undertaking are close or identical. When violating the assumption, the
model can introduce potential bias (Long, 1997). In terms of the model fit, the chi-squire
statistics indicated the goodness of fit for the models (see, a discrete area of ESBs in table 5
and 6).
14
OLS regression models are to estimate a combined index (ratio) of PCC and PGC.
We performed Cook and Weisberg’s test to check if these models violate the assumption of
homoscedasticity (constant error variance of y-hat). Also, we calculated variance inflation
factors and auxiliary regressions to detect if these models have muticollinearity problems
violating the assumption of independence between a subset of the independent variables. Our
test results indicate no sign of violation for these assumptions. Adjusted R-squares for both
PCC and PGC (.21 and .20 respectively) indicate the goodness of fit for the models (see,
combined index of ESBs in table 5 and 6).
Overall, the regression results show that social capital plays a positive and significant
role in promoting such behaviors, although the level of its significance is not the same
between PCC and PGC; social capital is more effective to fostering PCC than PGC. In
addition, both areas of ESB are positively and significantly influenced by environmental
knowledge, pro-social activity, and age. The following discussion details the empirical results
for PCC and PGC.
Empirical results for PCC
As shown in Table 5, social capital plays a positive and significant role in promoting
PCC (p<.005). Predicted mean PCC ratios increase by 0.095 points, with each one-point
increase in the level of social capital, if other independent variables do not change. As to the
discrete behavior of PCC, social capital is effective for individual constraint of water use
(p<.001) and meat consumption (p<.05), while having no effect on driving.
In terms of environmental knowledge, it is positively and significantly related to
PCC (P<.001). Predicted mean PCC ratios increase by 0.156 points, with each one-point
increase in the level of environmental knowledge, if other independent variables do not
15
change. For separate behavior of PCC, environmental knowledge is effective to fostering
individual constraint of water use (p<.01) and of driving (p<.001).
Also, individuals who have practiced pro-social behavior are more likely to show
PCC than those who have not (p<.001). One-point increase in pro-social behavior increases
predicted mean ratios of PCC by 0.2 points, if other independent variables do not change.
When looking at separate behavior of PCC, pro-social behavior is the strong indicator of
individual constraints of meat consumption (p<.001), of water use (p<.001), and driving
(p<.05).
As to socio-demographic factors, age and household income are significant in
estimating PCC. First, age is the positive and significant predictor of PCC (p<.001). One-
point increase in age increases predicted mean ratios of PCC by 0.168 points, if other
independent variables do not change. The older are more likely to consume less meat
(p<.001), less water (p<.001), and drive less (p<.005). Second, household income is
negatively and significantly related to PCC (p<.005). Predicted mean PCC ratios decline by
0.052points, with each one-point increase in household income, if other independent
variables do not change. For discrete behavior of PCC, household income is negatively
related to individual constraint on driving (p<.001).
Other variables, including marital status, religiosity, and Seoul metropolitan area
residency, show statistical significance for only separate area of PCC. The married are less
likely to constrain their driving than the single (p<.001); Those with a higher level of
religiosity are more likely to constrain water consumption (p<.05) and driving (p<.05); Seoul
metropolitan residents are less likely to reduce their water consumption but more likely to
restrain their driving than those who are not (p<.05, p<.001 respectively).
16
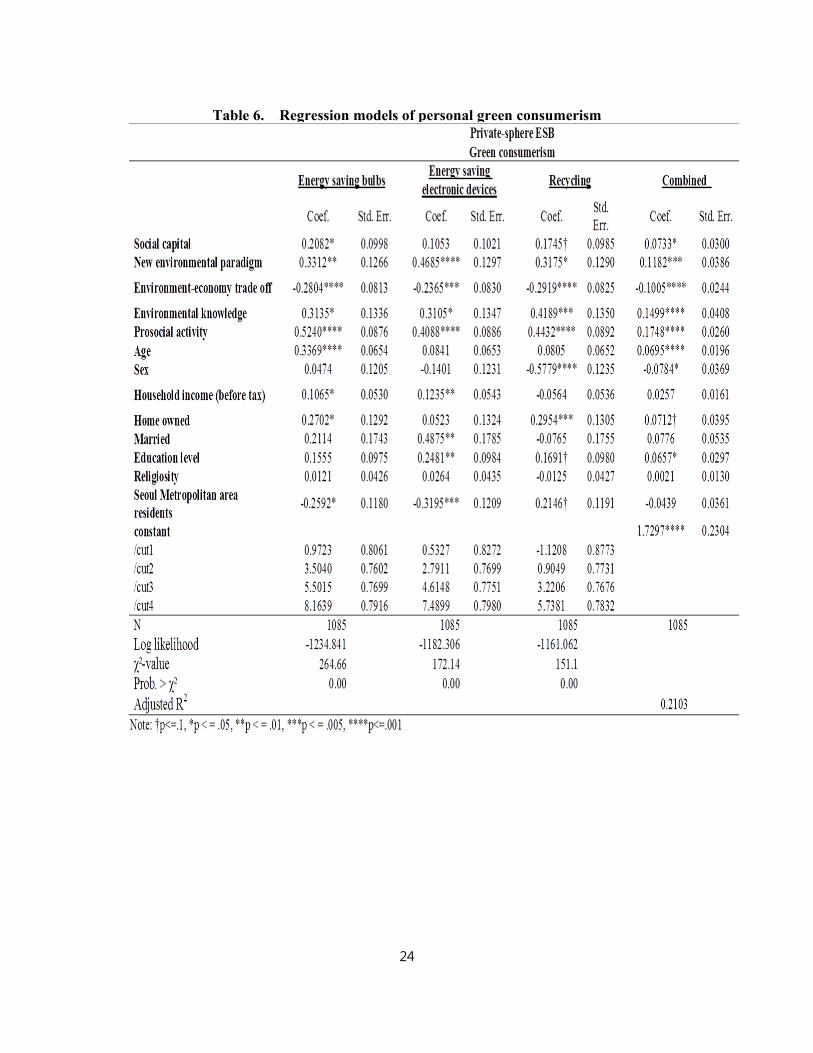
Empirical results for PGC
As shown in Table 6, social capital is positively and moderately related to PGC
(p<.05). Predicted mean PGC ratios increase by 0.073 points, with each one-point increase in
the level of social capital, if other independent variables hold constant. As to the discrete
behavior of PGC, social capital provides a moderate effect on fostering individuals’ uses of
energy saving bulbs at their houses (p<.5) and no significant effect on other types of green
consumerism, including purchasing energy saving electronic devices and recycling.
NEP is the positive and strong predictor of PGC (p<.005). One-point increase in NEP
increases predicted mean ratios of PGC by 0.118 points, if other independent variables do not
change. For discrete practice of PGC, NEP is effective to promoting the uses of energy
saving bulbs (p<.01), the purchases of energy saving electronic devices (p<.001), and
recycling (p<.05).
In terms of individual perception toward EET, it negatively and significantly affects
PGC (P<.001). Predicted mean PGC ratios decreases by 0.1 points, with each one-point
increase in the level of EET, if other independent variables do not change. For discrete
practice of PCC, EET negatively influence the use of energy saving bulbs (p<.001), the
purchase of energy saving electronic devices (p<.005), and recycling (p<.001).
Environmental knowledge are the positive and strong indicator of PGC (p<.001).
One-point increase in environmental knowledge increases predicted mean ratios of PGC by
0.149 points, if other independent variables do not change. In terms of separate practices of
PCC, environmental knowledge matters significantly in terms of promoting such practices,
including the use of energy saving bulbs (p<.05), the purchase of energy saving electronic
devices (p<.05), and recycling (p<.001).
17
Pro-social activity is the positive and strong predictor of PGC (p<.001). Predicted
mean PGC ratios increases by 0.174 points, with each one-point increase in the level of pro-
social activity, if other independent variables do not change. Similarly, pro-social activity is
significant in terms of estimating all the discrete practices of PGC indicated above (p<.001).
In terms of socio-demographic factors, age is among the strongest predictor of PGC
(p<.001). One-point increase in age increases predicted mean ratios of PGC by 0.069 points,
if other independent variables hold constant. Specifically, the older are more likely to use
energy saving bulbs (p<.001) but age does not affect other areas of PGC, including energy
saving electronic device purchases. Other variables, including sex (female) and education, are
positively and significantly related to PGC (p<.05). Predicted mean PGC ratios increases by
0.078 points and 0.065 points respectively, with each one-point increase in being a female
and the level of education, if other independent variables do not change.
Conclusion
Individual consumption patterns and choices are at the center of the sustainable
development discussion; they are considered pivotal to deliver sustainability.
Environmental technologies, policies, and social initiatives are all important for sustainable
development strategy but their roles will be undermined without facilitating sustainable
lifestyles of individuals (Peattie, 2010). Drawing on individual sustainable behavior is a
complex matter influenced by multiple factors associated with it. Among the factors, this
study pays special attention to the role of social capital in coordinating the patterns and
choices of individual consumption toward sustainable development, namely private-sphere
ESBs, with two primary foci: PCC and PGC.
18
This empirical study confirmed the important role that social capital can play in
arranging sustainable consumption choices and lifestyles in the face of collective problems.
Social capital in this case functions as a glue that hold individuals together and work toward
common environmental goals such as sustainability. It can promote ensemble of norms
necessary to expedite sustainable lifestyles. This finding gives rise to the following important
question. How best can we garner social capital? What would be the role of government in
promoting it? It is generally understood that low trust societies such as Korea, China, and
Italy are more likely to face obstacles of coordinating collective behavior such as ESBs than
high trust societies such as Germany and Japan (Fukuyama, 1995). Also, low trust can
engender and aggravate social division and conflicts.
The development of social capital is influenced by both vertical social networks
(Coleman, 1998) and horizontal social networks (Putnam, 1993; Coleman, 1998). Compared
to the latter facilitated by networks of civil engagement and social norms, the former
underlying trust in public institutions and legal frameworks requires short-time horizons. The
role of government would be effective to develop vertical social relationships; the
government can create policies that provide formal and equitable arrangements for
facilitating cooperation between government institutions and members of the society. This
active role of government is important for countries like South Korea to foster vertical social
relationships as it was to develop the enabling environment for macro-economic performance
(Serageldin and Grootaert, 1996). In addition, it is important to promote horizontal social
relationships by building interpersonal norms and social context that encourage face-to-face
interaction and communication and mutual interdependence (Stern, 2005).
19
Private-sphere Public sphere
Non-action(Intention)
Spport of using/purchasing greenproducts (e.g., willingness to payhigher prices for "green" products)
Support of environmental policies (e.g.,willingness to pay higher environmental taxes,acceptance of environmental regulations)
Action
1. Personal constraint onconsumption (e.g., less water, lessdriving)2."Green" consumerism(using/purchasing energy savingproducts)
1. Environmental citizenship (e.g.,environmental petition, donated toenvironmental organizations)2. Environmental activism (e.g., activeparticipation in environmental organizationsand demonstrations
Table 1. Types of Environmentally Significant Behavior*
*This table is constructed based on Stern (2000).
20
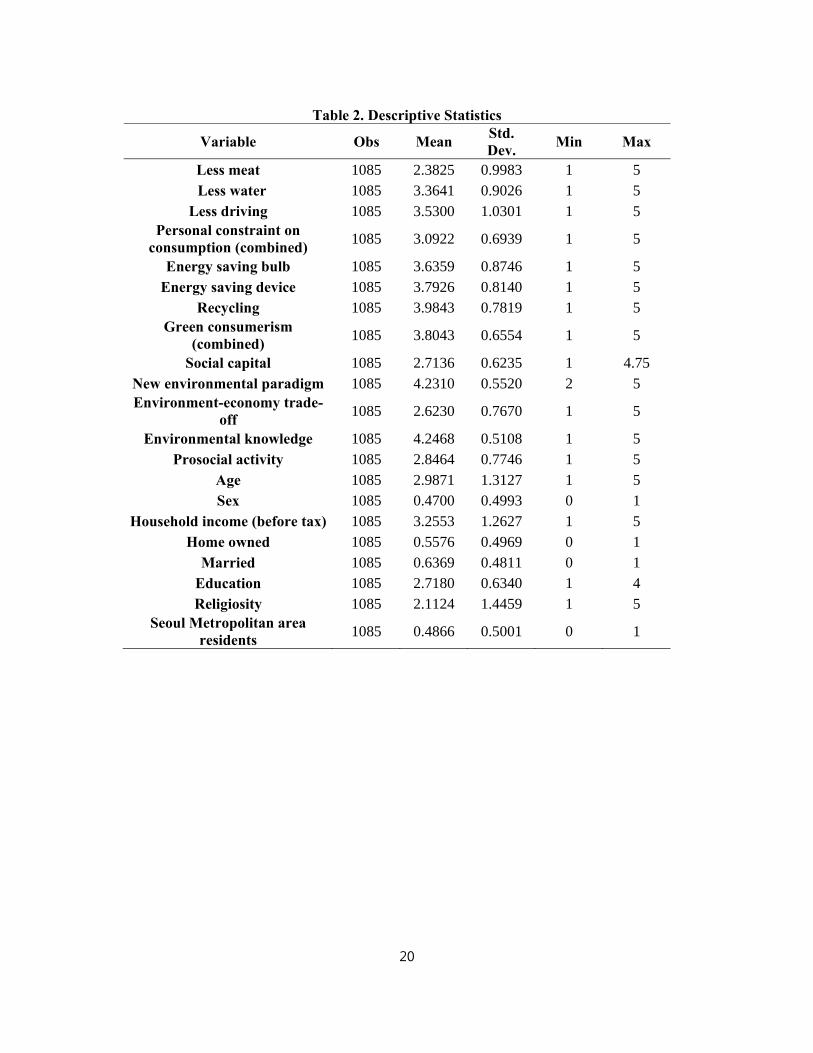
Table 2. Descriptive Statistics
Variable Obs Mean Std. Dev.
Min Max
Less meat 1085 2.3825 0.9983 1 5 Less water 1085 3.3641 0.9026 1 5 Less driving 1085 3.5300 1.0301 1 5
Personal constraint on consumption (combined)
1085 3.0922 0.6939 1 5
Energy saving bulb 1085 3.6359 0.8746 1 5 Energy saving device 1085 3.7926 0.8140 1 5
Recycling 1085 3.9843 0.7819 1 5 Green consumerism
(combined) 1085 3.8043 0.6554 1 5
Social capital 1085 2.7136 0.6235 1 4.75 New environmental paradigm 1085 4.2310 0.5520 2 5 Environment-economy trade-
off 1085 2.6230 0.7670 1 5
Environmental knowledge 1085 4.2468 0.5108 1 5 Prosocial activity 1085 2.8464 0.7746 1 5
Age 1085 2.9871 1.3127 1 5 Sex 1085 0.4700 0.4993 0 1
Household income (before tax) 1085 3.2553 1.2627 1 5 Home owned 1085 0.5576 0.4969 0 1
Married 1085 0.6369 0.4811 0 1 Education 1085 2.7180 0.6340 1 4 Religiosity 1085 2.1124 1.4459 1 5
Seoul Metropolitan area residents
1085 0.4866 0.5001 0 1
21
Table 3. Factor analysis of social capital survey items (Principal Component Analysis, Promax method)
Variables Items*Social captial
(Cronbach's α=0.73)
Generalized trustGenerally specaking, I would say that most peoplecan be trusted
0.606
Trust in governmentinstitutions
Generally speaking, I would say that governmentinstitutions, including agencies, congress, and court,can be trusted
0.8631
Trust in governmentprograms
Generally speaking, I would say that governmentprograms can be trusted
0.8658
Trust in civil societyorganizations
Generally speaking, I would say that civil societyorganization can be trusted
0.6122
Eigne values 2.2365
Percent of common variance 28.42
N 1085
*Each item measured based on a five-point Likert-type scale, with 1=”strongly disagree and 5=”stronglyagree”
22
Table 4. Factor analysis of ESB survey items (Principal Component Analysis, Promax method)
Variables Items
Personal constrainton consumption(Cronbach's α
=0.69)
Environmentalconsumerism
(Cronbach's α=0.71)
Less meatI normally try to cut down on eating meat for environmentalreasons
0.7579
Less water I normally try to use less water when showering or bathing 0.7856
Less driving I normally try to drive less 0.5816
Using energy saving bulbs I normally try to use energy saving light bulbs 0.8694
Purchasing energy savingappliances
I normally try to purchase energy saving appliance like hotwater heater, refrigerator or dish waher
0.8653
Recycling I normally to to recyle 0.636
Eigen values 1.5299 1.9091
Percent of common variance 24.34 30.45
N 1085
*Each item measured based on a five-point Likert-type scale, with 1=”strongly disagree and 5=”strongly agree”
23
Table 5. Regression models of personal constraint on consumption
24
Table 6. Regression models of personal green consumerism


