
March 2015 ENERGY STAR Score for Supermarkets and Food Stores in Canada Page 1
Technical Reference
ENERGY STAR Score for Supermarkets and Food Stores in Canada
OVERVIEW
The ENERGY STAR Score for Supermarket and Food Stores in Canada applies to supermarkets, grocery stores, food sales and convenience stores with or without gas stations. The objective of the ENERGY STAR score is to provide a fair assessment of the energy performance of a property, relative to its peers, taking into account the climate, weather, and business activities at the property. A statistical analysis of the peer building population is performed to identify the aspects of building activity that are significant drivers of energy use and then to normalize for those factors. The result of this analysis is an equation that predicts the energy use of a property, based on its experienced business activities. The energy use prediction for a building is compared to its actual energy use to yield a 1 to 100 percentile ranking of performance, relative to the national population.
Property types. The ENERGY STAR score for supermarkets and food stores applies to
supermarkets/grocery stores, food sales and convenience stores with or without gas stations but does not apply to restaurants. The ENERGY STAR score applies to individual buildings only and is not available for campuses.
Reference data. The analysis for supermarkets and food stores in Canada is based on data from the
Survey on Commercial and Institutional Energy Use (SCIEU), which was commissioned by Natural Resources Canada (NRCan) and carried out by Statistics Canada, and represents the energy consumption year 2009.
Adjustments for weather and business activity. The analysis includes adjustments for:
Building size
Number of cash registers
Number of computers
Number of workers on the main shift
Length of refrigerated/frozen food display cases
Weather and climate (using heating degree days, retrieved based on postal code)
Release date. The ENERGY STAR score for Supermarkets and Food Stores in Canada was first released
in March 2015.
This document presents details on the development of the 1 – 100 ENERGY STAR score for supermarkets and food stores properties. More information on the overall approach to develop ENERGY STAR scores is covered in our Technical Reference for the ENERGY STAR Score, available at http://www.energystar.gov/ENERGYSTARScore. The subsequent sections of this document offer specific details on the development of the ENERGY STAR score for supermarkets/food sales.
OVERVIEW .......................................................................................................................................1 REFERENCE DATA & FILTERS .......................................................................................................2 VARIABLES ANALYZED ...................................................................................................................3 REGRESSION EQUATION RESULTS ..............................................................................................7 ENERGY STAR SCORE LOOKUP TABLE .......................................................................................8 EXAMPLE CALCULATION ..............................................................................................................11

March 2015 ENERGY STAR Score for Supermarkets and Food Stores in Canada Page 2
Technical Reference
REFERENCE DATA & FILTERS
The ENERGY STAR score for supermarkets and food stores in Canada applies to facilities that are used for the retail sale of food and beverage products; this category does not include restaurants. The reference data used to establish the peer building population is based on data from the Survey on Commercial and Institutional Energy Use (SCIEU), which was commissioned by Natural Resources Canada and carried out by Statistics Canada in late 2010 and early 2011. The energy data for the survey was from the calendar year 2009. The raw collected data file for this survey is not publically available, but a report providing summary results is available on Natural Resources Canada’s website at http://oee.nrcan.gc.ca/publications/statistics/scieu09/scieu_e.pdf. To analyze the building energy and operating characteristics in this survey data, four types of filters are applied to define the peer group for comparison and to overcome any technical limitations in the data: Building Type Filters, Program Filters, Data Limitation Filters, and Analytical Filters. A complete description of each of these categories is provided in our Technical Reference for the ENERGY STAR Score, at www.energystar.gov/ENERGYSTARScore. Figure 1 presents a summary of each filter applied in the development of the ENERGY STAR score for supermarkets and the rationale behind the filter. After all filters are applied, the remaining data set has 163 observations. Due to the confidentiality of the survey data, we are not able to identify the number of cases after each filter.
Figure 1 – Summary of Filters for the ENERGY STAR Score for Supermarkets and food stores
Condition for Including an Observation in the Analysis
Rationale
Defined as category 8 in SCIEU – Food and Beverage Stores
The SCIEU survey covered the commercial and institutional sector and included buildings of all types. For this model, only the observations identified as main activity being food stores are used.
Building must be at least 70% supermarket Building Type Filter – In order to be considered part of the supermarket and food stores peer group, more than 70% of the building must be supermarket/food stores.
Must have electric energy data Program Filter – Basic requirement to be considered a functioning supermarket or food store is that it requires electrical energy. Electricity can be grid-purchased or produced on site.
Must operate at least 10 months per year Program Filter – Basic requirement to be considered as full time operation for this building type.
Must operate at least 30 hours per week Program Filter – Basic requirement to be considered as full time operation.
Must have at least 1 worker Program Filter – Basic requirement for a functioning supermarket or food store, there must be at least one worker during the main shift.
Must have at least 1 computer or cash register
Program Filter – Basic requirement for a functioning supermarket or food store, it must have at least one computer or cash register.
Must be built in 2008 or earlier Data Limitation Filter – The survey reported the energy for calendar year 2009. Therefore, if the building was being built in 2009, a full year of energy data would not be available.
Must not use any “other” fuels for which the energy is not reported
Data Limitation Filter – No data collected on this energy. The survey asked if additional energy consumption occurred in the building that was not reported. In those occurrences, the cases were removed from the analysis.

March 2015 ENERGY STAR Score for Supermarkets and Food Stores in Canada Page 3
Technical Reference
Condition for Including an Observation in the Analysis
Rationale
Must be at least 400 m2 Analytical Filter – The analysis could not model behavior of buildings smaller than 400m².
Must have source EUI that is greater than 0.3 and less than 12 GJ/m2
Analytical Filter – Values determined to be outliers based on analysis of the data. Outliers are typically clearly outside normal operating parameters for a building of this type.
Must have a worker density (Workers per 100 m2) that is less than or equal to 20
Analytical Filter – Values determined to be outliers based on analysis of the data. Outliers are typically clearly outside normal operating parameters for a building of this type.
Must have a refrigerated/freezer food display cases density (length of cases in meters per 100m2) that is less than or equal to 25
Analytical Filter – Values determined to be outliers based on analysis of the data. Outliers are typically clearly outside normal operating parameters for a building of this type.
Of the filters applied to the reference data, some result in constraints on calculating a score in Portfolio Manager, and others do not. Building Type and Program Filters are used to limit the reference data to include only properties that are eligible to receive a score in Portfolio Manager, and are therefore related to eligibility requirements. In contrast, Data Limitation Filters account for limitations in the data available during the analysis, but do not apply in Portfolio Manager. Analytical Filters are used to eliminate outlier data points or different subsets of data, and may or may not affect eligibility. In some cases, a subset of the data has a different behaviour from the rest of the properties (e.g., supermarkets that are smaller than 400 m2 do not behave the same way as larger buildings), in which case an Analytical Filter is used to determine eligibility in Portfolio Manager. In other cases, Analytical Filters exclude a small number of outliers with extreme values that skew the analysis, but do not affect eligibility requirements. A full description of the criteria you must meet to get a score in Portfolio Manager is available at www.energystar.gov/EligibilityCriteria. Related to the filters and eligibility criteria described above, another consideration is how Portfolio Manager treats properties that are situated on a campus. The main unit for benchmarking in Portfolio Manager is the property, which may be used to describe either a single building or a campus of buildings. The applicability of the ENERGY STAR score depends on the type of property. For this property type the score is available to an individual store and not to a campus of buildings or stores. To receive an ENERGY STAR score, a supermarket/food store must be at least 400 square meter. Eligible store configurations include: free standing stores; stores located in open air or strip centers (a collection of attached stores with common areas that are not enclosed); and mall anchors. Restaurants are not considered food stores and therefore are not eligible to receive a score.
VARIABLES ANALYZED
To normalize for differences in business activity, we performed a statistical analysis to understand what aspects of building activity are significant with respect to energy use. The filtered reference data set, described in the previous section, was analyzed using a weighted ordinary least squares regression, which evaluated energy use relative to business activity (e.g. number of workers, number of cash registers, and climate). This linear regression yielded an equation that is used to compute energy use (also called the dependent variable) based on a series of characteristics that describe the business activities (also called independent variables). This section details the variables used in the statistical analysis for supermarkets and food stores.

March 2015 ENERGY STAR Score for Supermarkets and Food Stores in Canada Page 4
Technical Reference
Dependent Variable
The dependent variable is what we try to predict with the regression equation. For the supermarket/food stores analysis, the dependent variable is energy consumption expressed in source energy use intensity (source EUI). This is equal to the total source energy use of the property divided by the gross floor area. The regression analyzes the key drivers of source EUI – those factors that explain the variation in source energy use per square meter in supermarket/food stores. The unit for source EUI in the Canadian model is the Gigajoule per Square Meter (GJ/m2)
Independent Variables The SCIEU data contains numerous building property operation questions that NRCan identified as potentially important for supermarket/food stores. Based on a review of the available variables in the SCIEU data, in accordance with the criteria for inclusion,1 NRCan initially analyzed the following variables in the regression analysis:
Gross building area (m²)
Number of workers during the main shift
Weekly hours of operation
Months in operation in 2009
Number of computers and computer servers
Number of vending machines
Number of cash registers
Length of closed refrigerated food display cases
Length of open refrigerated food display cases
Length of closed frozen food display cases
Length of open frozen food display cases
Presence of commercial food preparation area (y/n)
Floor space dedicated to commercial cooking area
Whether the grocery store was a standalone structure, part of a strip mall or part of an enclosed mall
Number of floors
Number of elevators
Number of escalators
Heating degree days (HDD)
Cooling degree days (CDD)
Average outdoor temperature (°C)
Percentage of floor space that is heated
Percentage of floor space that is cooled
NRCan and EPA performed extensive review on all of these operational characteristics. In addition to reviewing each characteristic individually, characteristics were reviewed in combination with each other (e.g., Heating Degree Days times Percent Heated). As part of the analysis, some variables were reformatted to reflect the physical relationships of building components. For example, the number of workers on the main shift can be evaluated in a density format. The number of workers per square meter (as opposed to the gross number of workers) could be expected to be correlated with the energy use per square meter. Also, based on analytical results and residual plots, variables were
1 For a complete explanation of these criteria, refer to our Technical Reference for the ENERGY STAR Score, at www.energystar.gov/ENERGYSTARScore.

March 2015 ENERGY STAR Score for Supermarkets and Food Stores in Canada Page 5
Technical Reference
examined using different transformations (such as the natural logarithm, abbreviated as Ln). The analysis consists of multiple regression formulations. These analyses are structured to find the combination of statistically significant
operating characteristics that explained the greatest amount of variance in the dependent variable: source EUI. The final regression equation includes the following variables:
Number of workers per 100m2 during main shift
Number of cash registers per 100m²
Number of computers per 100m²
Building floor area
Total length (in meters) of all refrigerated/frozen food display cases per 100m²
Number of heating degree days (HDD) These variables are used together to compute the predicted source EUI for supermarket/food stores. The predicted source EUI is the mean EUI for a hypothetical population of buildings that share the same values for each of these characteristics. That is, the mean energy for buildings that operate like your building.
Climate (HDD and CDD) The analysis looked at the Heating Degree Days (HDD), the Cooling Degree Days (CDD) and the average outdoor temperature. There was a strong correlation between the energy intensity of the building and the HDD observed by the building. This variable is included in the model. An in-depth analysis was performed on a number of variations of the CDD variables and it was found that the variables were not significant with the supermarket dataset. It is hypothesised that this may be due to the relatively small variations in the number of CDD and the fact that other variables have a much larger impact on the energy consumption than the number of CDD. For example, the total length of refrigerated display cases is a better predictor on the consumption of the buildings compared to relatively small variations in the number of CDD. In addition, CDD values are typically closely correlated to HDD. As a result, CDD or variations of the CDD variable are not included in the model. The weather data for the Canadian model was taken from the US National Climatic Data Center sources which has 152 Canadian weather stations. This source is also the source of weather data for Portfolio Manager. The weather data is associated to the building using the closest Canadian weather station location based on the postal code of the building.
Property Floor Area Several variables that were related to the size of the building were evaluated during the analysis. They included the area and the natural logarithm of area. The variable that was consistently significant was area. It was also noticed that small buildings did not behave the same way as larger ones. After testing various thresholds, it was determined that the source EUI patterns no longer changed with respect to size for buildings over 2,500 m2. Buildings over this threshold are identified as 2,500m² for the area variable before being used as a regressor in the model. However, it is important to note that the actual building size is still used when calculating density variables such as the number of workers per 100m² and energy use intensities.

March 2015 ENERGY STAR Score for Supermarkets and Food Stores in Canada Page 6
Technical Reference
Length of refrigerated food and frozen food display cases One of the important predictors of energy consumption in food sales buildings is the presence and quantity of refrigerated/frozen food display cases. There were four data points available for evaluation, length of closed refrigerated, length of open refrigerated, length of closed frozen and length of open frozen food cases. These were evaluated individually, combined as either open/closed or refrigerated/frozen or to include the total length of all refrigerated/frozen food case types. In addition, these were also evaluated as a density in terms of meter length of cases per 100m². It was noticed that there was usually a correlation between the different types of cases for specific buildings. For example, buildings that had a larger amount of refrigerated cases will typically also have a larger amount of frozen cases. As such the regression that yielded the best result was the one that included all types of food cases into one variable. The variable that is included in the model is total refrigerated/frozen food case density which is the total length of food cases in meters per 100m² of floor space.
Cash registers and computers It was noted that energy consumption was typically correlated with the number of cash registers and the number of computers. NRCan analyzed several combinations of variables using cash registers and computers including: number of cash registers per 100 m² and number of computers per 100 m². The most appropriate equation was deemed to have both the number of cash registers per 100 m² and the number of computers per 100 m². It is important to note that there a minimum requirement for a supermarket/retail food sale building to have at least one computer OR one cash register to be eligible to receive a score.
Number of workers The worker density (occupants/100m²) was always highly significant during the development of supermarket/food stores model. It is hypothesised that the number of workers during the main shift is a good indicator of activity levels and energy consumption in the building. It was also noticed that there was a significant range in worker density which was typically due to the wide range of building sizes since smaller buildings tend to have higher worker density and vice-versa. As a result of this very large range of values, it was necessary to apply a floor and a ceiling for the worker density calculations. The range has been selected as the ones between the 10th and 90th percentile of the population. As an example, if a building has a very high worker density, that building will be attributed a maximum worker density value. Similarly, a building with very low worker density will be attributed a minimum worker density when calculating the score. The floor and ceiling values are 0.4490 workers/100m² and 3.687 workers/100m² respectively. As was the case with the area variables, the limits are applied to the worker density values before being used as regressor in the model.
Testing
Finally, NRCan further analyzed the regression equation using actual data that has been entered in Portfolio Manager. This provided another set of buildings to examine, in addition to the SCIEU data, to see the ENERGY STAR scores and distributions, and to assess the impacts and adjustments. While Portfolio Manager did not capture some of the new variables required for the Canadian score, and default values were used in their place, this analysis provided a second level of verification to ensure that there was a good distribution of scores. It is important to reiterate that the final regression equation is based on a nationally representative reference data, not on data previously entered into Portfolio Manager.
March 2015 ENERGY STAR Score for Supermarkets and Food Stores in Canada Page 7
Technical Reference
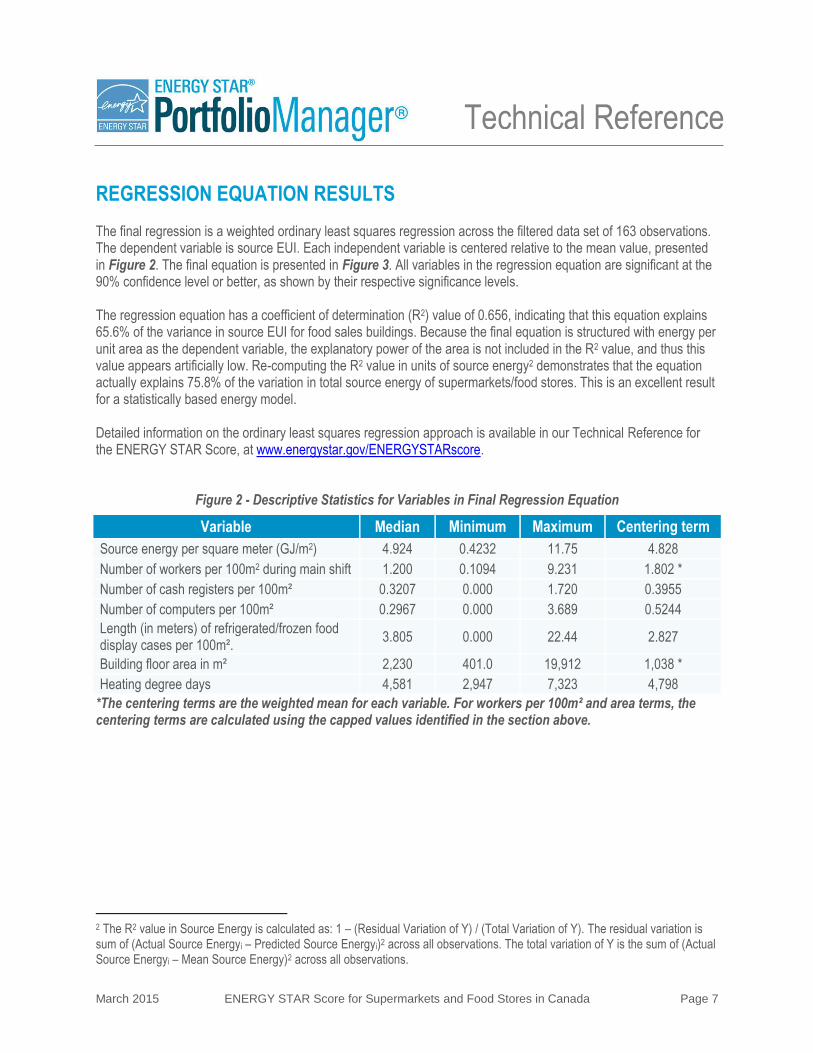
REGRESSION EQUATION RESULTS The final regression is a weighted ordinary least squares regression across the filtered data set of 163 observations. The dependent variable is source EUI. Each independent variable is centered relative to the mean value, presented in Figure 2. The final equation is presented in Figure 3. All variables in the regression equation are significant at the 90% confidence level or better, as shown by their respective significance levels. The regression equation has a coefficient of determination (R2) value of 0.656, indicating that this equation explains 65.6% of the variance in source EUI for food sales buildings. Because the final equation is structured with energy per unit area as the dependent variable, the explanatory power of the area is not included in the R2 value, and thus this value appears artificially low. Re-computing the R2 value in units of source energy2 demonstrates that the equation actually explains 75.8% of the variation in total source energy of supermarkets/food stores. This is an excellent result for a statistically based energy model. Detailed information on the ordinary least squares regression approach is available in our Technical Reference for the ENERGY STAR Score, at www.energystar.gov/ENERGYSTARscore.
Figure 2 - Descriptive Statistics for Variables in Final Regression Equation
Variable Median Minimum Maximum Centering term
Source energy per square meter (GJ/m2) 4.924 0.4232 11.75 4.828
Number of workers per 100m2 during main shift 1.200 0.1094 9.231 1.802 *
Number of cash registers per 100m² 0.3207 0.000 1.720 0.3955
Number of computers per 100m² 0.2967 0.000 3.689 0.5244
Length (in meters) of refrigerated/frozen food display cases per 100m².
3.805 0.000 22.44 2.827
Building floor area in m² 2,230 401.0 19,912 1,038 *
Heating degree days 4,581 2,947 7,323 4,798
*The centering terms are the weighted mean for each variable. For workers per 100m² and area terms, the centering terms are calculated using the capped values identified in the section above.
2 The R2 value in Source Energy is calculated as: 1 – (Residual Variation of Y) / (Total Variation of Y). The residual variation is sum of (Actual Source Energyi – Predicted Source Energyi)2 across all observations. The total variation of Y is the sum of (Actual Source Energyi – Mean Source Energy)2 across all observations.

March 2015 ENERGY STAR Score for Supermarkets and Food Stores in Canada Page 8
Technical Reference
Figure 3 - Final Regression Results
Summary
Dependent variable Source energy intensity (GJ/m2)
Number of observations in analysis 163
R2 value 0.656
Adjusted R² value 0.642
F statistic 49.49
Significance (p-level) 0.0000
Unstandardized
Coefficients Standard
Error T value
Significance (p-level)
Constant 4.828 0.133 36.298 <0.0001
C_Number of workers per 100m2 during main shift
1.612 0.129 12.525 <0.0001
C_Number of cash registers per 100m² 1.350 0.458 2.947 0.0037
C_Number of computers per 100m² 0.6980 0.312 2.238 0.0266
C_Length (in meters) of refrigerated/frozen food display cases per 100m²
0.08314 0.050 1.678 0.0953
C_Building floor area in m² 0.001342 0.0002 6.439 <0.0001
C_Heating degree days 0.0004642 0.0001 3.460 <0.0007
- Notes: - The regression is a weighted ordinary least squares regression, weighted by the SCIEU variable “WTBS.” - The prefix C_ on each variable indicates that it is centered. The centered variable is equal to difference between the actual
value and the observed mean. The observed mean values are presented in Figure 2. - The Area variable is limited at a maximum value of 2,500 m² for calculation of the predicted EUI - The Worker Density variable is limited at a minimum of 0.4490 wrk/100m² and a maximum of 3.687 wrk/100m² for the
calculation of predicted EUI - The heating degree days are sourced from Canadian weather stations included in the U.S. National Climatic Data Center
systems
ENERGY STAR SCORE LOOKUP TABLE
The final regression equation (presented in Figure 3) yields a prediction of source EUI based on a building’s operating characteristics. Some buildings in the SCIEU data sample use more energy than predicted by the regression equation, while others use less. The actual source EUI of each reference data observation is divided by its predicted source EUI to calculate an energy efficiency ratio:
𝐸𝑛𝑒𝑟𝑔𝑦 𝐸𝑓𝑓𝑖𝑐𝑖𝑒𝑛𝑐𝑦 𝑅𝑎𝑡𝑖𝑜 = 𝐴𝑐𝑡𝑢𝑎𝑙 𝑆𝑜𝑢𝑟𝑐𝑒 𝐸𝑈𝐼
𝑃𝑟𝑒𝑑𝑖𝑐𝑡𝑒𝑑 𝑆𝑜𝑢𝑟𝑐𝑒 𝐸𝑈𝐼 𝐸𝑛𝑒𝑟𝑔𝑦 𝐸𝑓𝑓𝑖𝑐𝑖𝑒𝑛𝑐𝑦 𝑅𝑎𝑡𝑖𝑜 =
𝐴𝑐𝑡𝑢𝑎𝑙 𝑆𝑜𝑢𝑟𝑐𝑒 𝐸𝑛𝑒𝑟𝑔𝑦 𝐼𝑛𝑡𝑒𝑛𝑠𝑖𝑡𝑦
𝑃𝑟𝑒𝑑𝑖𝑐𝑡𝑒𝑑 𝑆𝑜𝑢𝑟𝑐𝑒 𝐸𝑛𝑒𝑟𝑔𝑦 𝐼𝑛𝑡𝑒𝑛𝑠𝑖𝑡𝑦
An efficiency ratio lower than one indicates that a building uses less energy than predicted, and consequently is more efficient. A higher efficiency ratio indicates the opposite.

March 2015 ENERGY STAR Score for Supermarkets and Food Stores in Canada Page 9
Technical Reference
The efficiency ratios are sorted from smallest to largest, and the cumulative percent of the population at each ratio is computed using the individual observation weights from the reference data set. Figure 4 presents a plot of this cumulative distribution. A smooth curve (shown in orange) is fitted to the data using a two-parameter gamma distribution. The fit is performed in order to minimize the sum of squared differences between each building’s actual percent rank in the population and each building’s percent rank with the gamma solution. The final fit for the gamma curve yielded a shape parameter (alpha) of 7.774 and a scale parameter (beta) of 0.1311. For this fit, the sum of the squared error is 0.3037.
Figure 4 – Distribution for Supermarkets
The final gamma shape and scale parameters are used to calculate the efficiency ratio at each percentile (1 to 100) along the curve. For example, the ratio on the gamma curve at 1% corresponds to a score of 99; only 1% of the population has a ratio this small or smaller. The ratio on the gamma curve at the value of 25% corresponds to the ratio for a score of 75; only 25% of the population has a ratio this small or smaller. The complete score lookup table is presented in Figure 5.
0%
10%
20%
30%
40%
50%
60%
70%
80%
90%
100%
0.0 0.5 1.0 1.5 2.0 2.5 3.0
Cu
mu
lati
ve P
erce
nt
Efficiency Ratio (Source EUI / Predicted EUI)
Fitted curve
Reference data

March 2015 ENERGY STAR Score for Supermarkets and Food Stores in Canada Page 10
Technical Reference
Figure 5 – ENERGY STAR Score Lookup Table for Supermarkets and Food Stores ENERGY
STAR Score Cumulative
Percent Energy Efficiency Ratio ENERGY STAR
Score Cumulative
Percent Energy Efficiency Ratio
> = < >= < 100 0% 0.0000 0.3637 50 50% 0.9761 0.9851 99 1% 0.3637 0.4149 49 51% 0.9851 0.9941 98 2% 0.4149 0.4500 48 52% 0.9941 1.0032 97 3% 0.4500 0.4778 47 53% 1.0032 1.0124 96 4% 0.4778 0.5012 46 54% 1.0124 1.0216 95 5% 0.5012 0.5218 45 55% 1.0216 1.0309 94 6% 0.5218 0.5403 44 56% 1.0309 1.0404 93 7% 0.5403 0.5573 43 57% 1.0404 1.0499 92 8% 0.5573 0.5731 42 58% 1.0499 1.0595 91 9% 0.5731 0.5879 41 59% 1.0595 1.0692 90 10% 0.5879 0.6018 40 60% 1.0692 1.0791 89 11% 0.6018 0.6151 39 61% 1.0791 1.0891 88 12% 0.6151 0.6279 38 62% 1.0891 1.0993 87 13% 0.6279 0.6401 37 63% 1.0993 1.1095 86 14% 0.6401 0.6519 36 64% 1.1095 1.1200 85 15% 0.6519 0.6633 35 65% 1.1200 1.1306 84 16% 0.6633 0.6745 34 66% 1.1306 1.1415 83 17% 0.6745 0.6853 33 67% 1.1415 1.1525 82 18% 0.6853 0.6958 32 68% 1.1525 1.1637 81 19% 0.6958 0.7062 31 69% 1.1637 1.1752 80 20% 0.7062 0.7163 30 70% 1.1752 1.1869 79 21% 0.7163 0.7262 29 71% 1.1869 1.1989 78 22% 0.7262 0.7360 28 72% 1.1989 1.2112 77 23% 0.7360 0.7456 27 73% 1.2112 1.2238 76 24% 0.7456 0.7551 26 74% 1.2238 1.2368 75 25% 0.7551 0.7645 25 75% 1.2368 1.2501 74 26% 0.7645 0.7737 24 76% 1.2501 1.2638 73 27% 0.7737 0.7829 23 77% 1.2638 1.2779 72 28% 0.7829 0.7920 22 78% 1.2779 1.2926 71 29% 0.7920 0.8010 21 79% 1.2926 1.3077 70 30% 0.8010 0.8099 20 80% 1.3077 1.3235 69 31% 0.8099 0.8188 19 81% 1.3235 1.3399 68 32% 0.8188 0.8276 18 82% 1.3399 1.3570 67 33% 0.8276 0.8364 17 83% 1.3570 1.3749 66 34% 0.8364 0.8452 16 84% 1.3749 1.3938 65 35% 0.8452 0.8539 15 85% 1.3938 1.4136 64 36% 0.8539 0.8626 14 86% 1.4136 1.4347 63 37% 0.8626 0.8713 13 87% 1.4347 1.4571 62 38% 0.8713 0.8799 12 88% 1.4571 1.4812 61 39% 0.8799 0.8886 11 89% 1.4812 1.5071 60 40% 0.8886 0.8973 10 90% 1.5071 1.5354 59 41% 0.8973 0.9059 9 91% 1.5354 1.5664 58 42% 0.9059 0.9146 8 92% 1.5664 1.6011 57 43% 0.9146 0.9233 7 93% 1.6011 1.6403 56 44% 0.9233 0.9320 6 94% 1.6403 1.6858 55 45% 0.9320 0.9408 5 95% 1.6858 1.7403 54 46% 0.9408 0.9495 4 96% 1.7403 1.8088 53 47% 0.9495 0.9584 3 97% 1.8088 1.9025 52 48% 0.9584 0.9672 2 98% 1.9025 2.0562 51 49% 0.9672 0.9761 1 99% 2.0562 >2.0562

March 2015 ENERGY STAR Score for Supermarkets and Food Stores in Canada Page 11
Technical Reference
EXAMPLE CALCULATION
As detailed in our Technical Reference for the ENERGY STAR Score, at www.energystar.gov/ENERGYSTARScore, there are five steps to compute a score. The following is a specific example for the score for Supermarkets.
1
User enters building data into Portfolio Manager
12 months of energy use information for all energy types (annual values, entered in monthly meter entries)
Physical building information (size, location, etc.) and use details describing building activity (hours, etc.)
Energy Data Value
Electricity 950,000 kWh
Natural gas 80,000 m3
Property Use Details Value
Gross floor area (m2) 3,000
Weekly operating hours 84
Workers on main shift3 35
Number of cash registers 7
Number of computers 10
Total length of refrigerated/frozen food display cases (m) 100
HDD (provided by Portfolio Manager, based on postal code) 4300
2
Portfolio Manager computes the actual source EUI
Total energy consumption for each fuel is converted from billing units into site energy and source energy.
Source energy values are added across all fuel types.
Source energy is divided by gross floor area to determine actual source EUI.
Computing Actual Source EUI
Fuel Billing Units
Site GJ Multiplier
Site GJ Source
Multiplier Source GJ
Electricity 950,000 kWh 0.0036 3,420 2.05 7,011
Natural gas 80,000 m3 0.03843 3,074 1.02 3,136
Total Source Energy (GJ) 10,147
Source EUI (GJ/m2) 3.382
3 This represents typical peak staffing level during the main shift. For example, in a supermarket, if there are two daily 6-hour shifts of 25 workers each, the Workers on main shift value is 25.

March 2015 ENERGY STAR Score for Supermarkets and Food Stores in Canada Page 12
Technical Reference
3
Portfolio Manager computes the predicted source EUI
Using the property use details from Step 1, Portfolio Manager computes each building variable value in the regression equation (determining the density as necessary).
The centering values are subtracted to compute the centered variable for each operating parameter.
The centered variables are multiplied by the coefficients from the Supermarket regression equation to obtain a predicted source EUI.
Computing Predicted Source EUI
Variable Actual
Building Value
Reference Centering
Value
Building Centered Variable
Coefficient Coefficient x Centered
Variable
Constant - - - 4.828 4.828
Number of workers per 100m2 during main shift *
1.167 1.802 -0.635 1.612 -1.024
Number of cash registers per 100m² 0.2333 0.3955 -0.1622 1.350 -0.2190
Number of computers per 100m² 0.3333 0.5244 -0.1911 0.6980 -0.1334
Length (in meters) of refrigerated/frozen food display cases per 100m²
3.333 2.827 0.506 0.08314 0.0421
Building floor area in m² * 2,500 1,038 1,462 0.001342 1.962
Heating degree days 4,300 4,798 -498 0.0004642 -0.2312
Predicted Source EUI (GJ/m2) 5.225
*The number of workers per 100m² value is subject to floor or ceiling values if applicable. The maximum value for floor area is 2,500m². If the building is larger than 2,500m², that value is used.
4
Portfolio Manager computes the energy efficiency ratio
The ratio equals the actual source EUI (Step 2) divided by predicted source EUI (Step 3).
Ratio = 3.382 / 5.225 = 0.6473
5
Portfolio Manager uses the efficiency ratio to assign a score via a lookup table
The ratio from Step 4 is used to identify the score from the lookup table.
A ratio of 0.6473 is less than 0.6519 (requirement for 86) but greater than 0.6401 (requirement for 86).
The ENERGY STAR score is 85.


