
Eindhoven University of Technology
MASTER
Designing an integrated evaluation tool for training and development programs atVanderlande
Dahlia Dewanti Priyananda, X.
Award date:2016
DisclaimerThis document contains a student thesis (bachelor's or master's), as authored by a student at Eindhoven University of Technology. Studenttheses are made available in the TU/e repository upon obtaining the required degree. The grade received is not published on the documentas presented in the repository. The required complexity or quality of research of student theses may vary by program, and the requiredminimum study period may vary in duration.
General rightsCopyright and moral rights for the publications made accessible in the public portal are retained by the authors and/or other copyright ownersand it is a condition of accessing publications that users recognise and abide by the legal requirements associated with these rights.
• Users may download and print one copy of any publication from the public portal for the purpose of private study or research. • You may not further distribute the material or use it for any profit-making activity or commercial gain
Take down policyIf you believe that this document breaches copyright please contact us providing details, and we will remove access to the work immediatelyand investigate your claim.
Download date: 17. Jun. 2018

0
MASTER THESIS REPORT
Designing an Integrated Evaluation Tool for Training and
Development Programs at Vanderlande
by Dahlia Dewanti Priyananda
BSc Industrial Engineering – Bandung Institute of Technology Student Identity Number 0923829
In partial fulfilment of the requirements for the degree of Master of Science
In Operations Management and Logistics
Supervisors: Dr. ir. P.A.M. Kleingeld, TU/e, HPM Dr. S. Rispens, TU/e, HPM Drs. D.J. Verheijden, (Manager) Vanderlande Academy

1
TUE. School of Industrial Engineering.
Series Master Thesis Operations Management and Logistics.
Subject Headings: Training and development evaluation, Learning, Transfer of Training, Questionnaire development, Survey analysis and evaluation.

I
ABSTRACT
Training and development programs has been regular activities that are provided by
organizations to facilitate the improvement of knowledge and skills of their employees. With
the investment of time and cost that the organizations have put into conducting the training
and development programs, it becomes crucial for organizations to be able to evaluate the
effectiveness of the programs. Currently, there are various types of interventions that have been
developed to deliver the materials of training and development programs. This master thesis
project presents the process and results of five-and-a-half-month graduation project at
Vanderlande Industries, Veghel, The Netherlands.
The main objective of this master thesis project was to design a parsimonious integrated training
and development programs evaluation tool that can fulfill the following requirement from
Vanderlande, which are:
1. It should be valid and reliable
2. It should be applicable across different types of training and development interventions.
3. It should have an overall score that is based on weighted mean scores of factors related
to the training and development programs, taking into account the possibility that the
weights may vary across different types of interventions.
The development of integrated evaluation tool included the literature study, interview to
training and development experts at Vanderlande, and Confirmatory Factor analysis of the
current training evaluation tool used by Vanderlande. The new design of evaluation tool was
then tested by a pilot study. All the research questions were successfully answered based on the
result of the pilot study. Recommendations for the implementation of the evaluation tool were
proposed to improve the effectiveness of the evaluation of training and development programs
at Vanderlande.

II
PREFACE
This Master Thesis marks the completion of the master thesis program that I have been going
through for the past two years. I would like to thank the people who had given me the support
I need to complete this Master Thesis.
First of All, I would like to thank my university supervisor, Ad Kleingeld, who had been very
supportive during this master thesis project. I am very grateful for his excellent guidance and
feedback during the project. I would also thank Sonja Rispens for the insights and feedback
during the crucial stages of the project. Furthermore, I would like to thank all members of
Vanderlande Academy for all the support and help during the project. Special thanks to Dirk-
Jan Verheijden and Els Hettinga for the feedback, insights, and for giving me the opportunity to
complete my master thesis project at Vanderlande.
I also would like to express my gratitude towards Indonesia Endowment Fund for Education for
opening the opportunity for me to pursue my master degree education. May this valuable
experience be a start of many more wonderful opportunities to come.
My thanks also go to my fellow students and friends Zaskya Mansur, Oleksandra Dynnik,
Gabriela Guttierez, and Amalia Hasnida, for the fun and struggling time we’ve been through
together. Special thanks to Arbella Delianti and Hani who helped me in dealing with the training
evaluation data. And many thanks to Nanda Erian, for everything.
Last but not least, thank you to my parents and my brother for the endless support and
unconditional love.
Dahlia Dewanti Priyananda
Eindhoven, 2016

III
MANAGEMENT SUMMARY
Research Background
Vanderlande aims to evaluate and keep track of the quality of all training and development
programs that are conducted for its employees. Vanderlande currently already has a training
evaluation tool developed by Radhakrishnan (2015) based on classroom training. After the
operation of this evaluation tool for several months, VA found two problems based on the result
of the evaluation tool. The first one is a relatively smaller problem related to the emergence of
trainees who did not complete filling in the evaluation. Vanderlande suspected that this may
relate to the number of questions that were considered to be too large and the presence of
similar questions that are asked couple of times in the evaluation. Therefore, Vanderlande
wanted to have an analysis of possibilities of reduction in number of questions. The second,
more serious problem related to the non-applicability of the current evaluation tool for some
types of different training and development interventions. Therefore, Vanderlande would like
to develop an evaluation tool that is applicable for various types of interventions used at
Vanderlande.
Research Objectives
The main objective of this master thesis project is to design a parsimonious training and
development programs evaluation tool that can fulfill the following requirement from
Vanderlande, which are:
1. It should be valid and reliable
2. It should be applicable across different types of training and development interventions.
3. It should have an overall score that is based on weighted mean scores of factors related
to the training and development programs, taking into account the possibility that the
weights may vary across different types of interventions.
To achieve the objective, this master thesis project is driven by 6 research questions:
1. Which training and development interventions are available and used at Vanderlande?
2. What types of intervention methods are usually used together in a training or development
program?
3. How does Vanderlande currently evaluate learning and transfer of training across training
and development programs?
4. Taking into account the general and special characteristics of training and development
interventions, which characteristics are the key factors that may affect the learning and
transfer of training & development performance at Vanderlande?
5. What is the most parsimonious integrated training and development evaluation tool that
can be developed at Vanderlande, taking into account the criteria for reliability, validity,
and completeness?
6. Based on the collected data from the pilot study, which factors affect the learning and
transfer of training that happens due to training and development program at Vanderlande?

IV
Data Analysis and Results
Research Question 1
Based on interview sessions with the Managers of Vanderlande Academy and Talent
Development, it was found that currently there are six types of training and development
interventions used at Vanderlande :
1. Classroom Training
2. E-learning
3. Coaching
4. Peer Group Counseling
5. Outdoor Program
6. Business Case
Research Question 2
This research question was answered based on interview sessions with the Managers of
Vanderlande Academy and Talent Development. There are 7 types of classification in using the
interventions for training and development programs at Vanderlande. The first two are the use
of only Classroom training or E-learning intervention in the programs. The other five types
consist of integration of at least two interventions in a program as shown in Table M1.
Table M1. Integration of Interventions
No Name of Training/Development
Program
Intervention(s) used in the program
1 Blended Learning Classroom Training and E-learning.
2 Pit-Stop Classroom Training and Business Case
3 Authentic Leadership Classroom Training, Peer Group Counseling, Outdoor Program
4 Leadership I Classroom Training, Coaching, Peer Group Counseling
5 Personal Leadership Classroom Training, Coaching, Peer Group Counseling, Outdoor Program
Research Queastion 3
Vanderlande currently did not directly evaluate the learning and transfer of training across its
training and development program. The evaluation tool that Vanderlande uses at this moment
(Radhakrishnan, 2015) measures the factors that potentially can affect learning and transfer of
training. This research extended the evaluation tool by adding the elements of perceived
learning and transfer of training measurement to the newly designed evaluation tool.
Research Question 4
The answer of this research question was based on the literature study and interview with five
training and development experts at Vanderlande. Table M2 shows the key characteristics
(factors) that may affect learning and transfer of training at Vanderlande. The factors shown in
the table are divided based on the general factors, special factors for each intervention and the
transfer of training factors. These factors then become the base for designing the integrated
evaluation tool.

V
Table M2. Key Characteristics Affecting Learning and Transfer of Training
General Factors Classroom Training E-learning
Motivation to Learn
Learning goal orientation
Perceived utility
Cognitive Ability
Voluntary Participation
Content relevance
Clear goals
Behavioral Modeling
Feedback & Practice
Motivation to transfer
Trainer communication & support
Interesting lecturing method
Transfer effort
Fellow Trainee communication & support
Trainee Technology attitude
Content quality & organization
Quality of user interface
Quality of Technical system
Trainee control
Coaching Outdoor program & Business Case
Work environment
Experience & competence of the Coach
Trust in Coach
Coach Commitment
Fidelity
Reflection/feedback after the program
Transfer Design
Transfer climate
Opportunity to perform
Supervisor support
Peer Support
Research Question 5
The initial design of the integrated evaluation tool was developed based on the factors stated in
Chapter 3.6. The variables that construct the factors were based on validated scales from past
research such as LTSI (2000) and Grohmann & Kauffeld (2013), and also based on Confirmatory
Factor Analysis of the current evaluation tool. A pilot study was then carried out to get the data
for testing the validity and reliability of the initial design. Based on the data gathered, there
were different factor analysis done to the sets of factors. CFA was done to the sets of factors that
had more than 200 responses: General Factors, Classroom Training Factors, and Transfer of
Training Factors. Partial Exploratory Factor Analysis was done to the sets of factors that had
about 20 responses: E-learning Intervention Factors and Business Case Factors. Factor analysis
was not done for Coaching Intervention Factors, Outdoor Program Intervention Factors, and
Peer Group Counseling Intervention Factors due to limited number of data.
This project resulted in two types of evaluation survey. The first one is the evaluation survey to
be answered by participants right after the training programs. This evaluation survey consists
of General Factors, special factors related to the interventions, and three other general questions
about trainee’s overall judgements regarding the program. The most parsimonious integrated
training and development evaluation tool that can be developed at Vanderlande, taking into
account the criteria for reliability, validity, and completeness consists of different number of
variables for different types of training or development program. The number of variables for
the first type of evaluation tool can be seen in Table M3. The second evaluation survey is the
evaluation survey to be answered by participants after allowing some time for transfer of
training to happen. This evaluation survey consists of thirteen variables related to the Transfer
of Training Factors.

VI
Table M3. Number of Variables in Final Structure
No Name of Training/Development Program No. of Variables
1 Classroom Training 21
2 E-Learning 19
3 Blended Learning (Classroom Training and E-learning) 29
4 Pit-Stop (Classroom Training and Business Case) 28
5 Authentic Leadership (Classroom Training, Peer Group Counseling, Outdoor Program)
34
6 Leadership I (Classroom Training, Coaching, Peer Group Counseling) 41
7 Personal Leadership (Classroom Training, Coaching, Peer Group Counseling, Outdoor Program)
46
Research Question 6
Research Question 6 was answered by measuring the predictive validity of the factors towards
output Learning and Opportunity and Implementation of Transfer. The predictive validity was
measured by multiple regression and additional mediation analysis due to the emergence of
mediator factor Motivation to Transfer. The multiple regression analysis was done to the
dataset of Classroom Training Program, Blended Learning Program, and Pit-Stop that had
sufficient data to produce significant relation between factors and desired output. Table M4
shows the summary of predictive effects between factors and the training or development
program. In the table, factors that were found to have effects on Rate are defined as "R", factors
that were found to have effects on learning are defined as "L", and factors that were found to
have effects on Opportunity and Implementation of Transfer of Training through mediation of
Motivation to Transfer are defined as "TM”. Motivation to Transfer was defined as the mediator
of the other factors to Opportunity and Implementation of Transfer of Training (T). Number
beside the factors’ name describe the number of variables that construct the respective factor.
As an addition, the weights for each factor is also mentioned in Table M4. This weight only
applied to the factors of the evaluation survey that needs to be answered right after the training
or development program. The detail results of multiple regression and process for determining
the weights can be seen in chapter 4.3.

VII
Table M4. Summary of Predictive Validity and Weights
No Factors Hard Skill Classroom Training
Soft Skill Classroom Training
Blended Learning Pit-Stop Program
Predictive Validity
Weight Predictive Validity
Weight Predictive Validity
Weight Predictive Validity
Weight
General Factors
1 Motivation & Relevance (4) R, L, TM 37% R, TM 41% R, L, TM 41% TM 31%
2 Clear Goals (2) R, TM 13% TM 14% 5% TM 7%
3 Learning (2) TM 19% TM 18% TM 14% TM 15%
Classroom Intervention Factors
4 Trainer Knowledge & Experience (2) R, L, TM 15% R, L 11% R 6% R 8%
5 Support, Feedback & Practice (4) R, TM 16% 16% 5% L 8%
6 Motivation to Transfer (4) Mediator to T Mediator to T Mediator to T Mediator to T
E-Learning Intervention Factors
7 Content Quality (3) TM 19%
8 Technical System Quality (2) 5%
9 Trainee's Control (3) 5%
Business Case Intervention factors
10 Fidelity of Design (5) TM 26%
11 Feedback & Practice (2) 5%
Transfer of Training Factors
12 Transfer Resource Availability (2) TM TM TM
13 Supervisor Support (5) TM TM TM TM
14 Colleague Support (2) TM TM TM TM

VIII
Recommendations for Practical Implementation of New Evaluation Tool
Key recommendations for the implementation of new evaluation tool are:
1. Send personalized invitation and follow up e-mail that addressed to a specific participant
to increase the response rate
2. Develop a report that can generate the required data such as:
1) The average score of each variables
2) The average score of each factors, including the factors of outputs: Rating, Learning
3) The weighted overall rating based on weighted score of the factors
4) The average scores of no 1, 2, and 3 of all training programs that uses the same
interventions with the program that is being evaluated
5) Remarks on which factors scores fall below average of all programs or below the
minimum score that is determined by Vanderlande
The illustration for this report can be seen in Appendix 4
Beside the above key recommendations, there are also some detail practical recommendations:
1. In the implementation, there are two different times that are required to fill in the survey.
The first one, is right after the training program and the second one is some time after the
training or development program to allow the transfer of training to happen.
2. Placing several questions in one page, with separation of pages for the variable of General
Factors and each type of Intervention factors.
3. Vanderlande should be able to use the different set of variables templates depending on
the interventions used in a training or development program that has been found in this
research.
4. Utilize the result of Training and Development Evaluation to get more insights on the
implementation and outcomes of training and development program. With the result,
Vanderlande can see which factors should be improved and who is the parties to discuss
the improvement with (i.e. the managers, the trainers, or the organizer of the program)
5. Pay attention to the aspects of motivation to learn and relevancy of training and
development program content to the participants’ required competency.
Possible Improvements for Future Research
With some limitations of this research, there are some recommendations for future research:
1. Gather more data for analyzing the structure of Coaching Intervention Factors, Outdoor
Program Intervention Factors, and Peer Group Counseling Intervention Factors. Analysis
of the predictive validity of the other programs that had not been analyzed in this research
due to data limitation should also be analyzed.
2. When more data is available, do the analysis for defining the most important factors to be
put in an evaluation tool when the program consists of many interventions
3. Measure the learning and transfer of training performance based on objective assessment
by the participants’ supervisor/manager or subordinate that works alongside the
participants daily.

IX
GLOSSARY
Term Definitions
Commitment The extent to which an individual feels the psychological and emotional attachment to a task(occupation), relationship, goal, or organization (Landy & Conte, 2013)
Competency Skill, ability, or personal characteristics that are possessed by an individual that are required to achieve the desired outcomes (Landy & Conte, 2013)
Fidelity The extent to which the content of the training (i.e. material, practice) is similar to the real condition of the job (Landy & Conte, 2013)
Learning The extent to which an individual gains the knowledge and skills provided in the training program (Noe, 1986)
Mediation The intervention of a third variable/factor between two other related factors (Hair et. al., 2010)
Motivation to Learn
Desire of the trainees to gain the knowledge and skills that are presented in the training program (Noe, 1986)
Motivation to Transfer
Desire of the trainees to implement the knowledge and skills they gained from the training program in the job (Noe, 1986)
Opportunity to Perform
The extent to which trainees are provided with the resources which enable them to implement the knowledge gained from training on the job (Holton, Bates, & Ruona, 2000).
Peer Support The extent to which trainee’s peers encourage and provide support to implement the knowledge and skills from training on the job (Holton et al., 2000).
Reliability The extent to which a set of variables able to measure what it is expected to measure consistently.
Self-efficacy The extent to which an individual belief in the ability to reach a goal or perform a task (Landy & Conte, 2013)
Supervisor Support The extent to which trainee’s manager/supervisor encourage and provide support to implement the knowledge and skills from training on the job (Holton et al., 2000).
Talent Development
Strategically aligned program in which organizations plan, select, and implement development strategies for their employees to supply the organization with current and future talent (Garavan, Carbery, & Rock, 2012)
Technical System Quality
Trainee’s believe in the reliability, ease of use, and response time of the web-based learning system. (Chiu, Chiu, & Chang, 2007)
Transfer Design The extent to which the training program are designed to provide the trainees the ability to transfer the knowledge to the job with the use of training instruction that match the requirements of the job (Holton et al., 2000).
Transfer of Training
The extent to which trainees implement the skills and knowledge that they have gained from training or development programs are called the transfer of training (Goldstein & Ford, 2002).
Trainee’s Control The control that trainees’ have regarding the pace, sequence, or content of web-based training (Karim & Behrend, 2013)
Training Acquisition of skills, concepts, or behavior that marks the improvement of performance (Goldstein & Ford, 2002)

X
Trust The extent of an individual’s belief in how a person acts based on previous cooperation with that person (Ferrin, Dirks, & Shah, 2006)
Validity The extent to which a set of measures represents the concept that is being studied correctly (Hair et. al., 2010)

1
Table of Contents ABSTRACT ........................................................................................................................................ I
PREFACE .........................................................................................................................................II
MANAGEMENT SUMMARY ........................................................................................................ III
GLOSSARY..................................................................................................................................... IX
Table of Contents ............................................................................................................................. 1
CHAPTER 1 ...................................................................................................................................... 3
INTRODUCTION ............................................................................................................................ 3
1.1 General information about the company .............................................................................. 3
1.1.1 Vanderlande Industries .................................................................................................... 3
1.1.2 Vanderlande Academy and Talent Development .......................................................... 4
1.2 Problem statement ................................................................................................................. 4
1.3 Objectives and Research Questions ...................................................................................... 5
1.3.1 Objectives of the master thesis project ........................................................................... 5
1.3.2 Research Questions ......................................................................................................... 6
1.4 Research scope ....................................................................................................................... 7
1.5 Outline of the report .............................................................................................................. 7
CHAPTER 2 ..................................................................................................................................... 8
SUMMARY OF LITERATURE REVIEW ......................................................................................... 8
2.1 Training and development programs .................................................................................... 8
2.2 Training and development interventions ............................................................................. 8
2.3 Training evaluation .............................................................................................................. 10
2.4 Transfer of training .............................................................................................................. 10
2.5 Factors related to effectiveness of training & development programs ................................ 11
CHAPTER 3..................................................................................................................................... 14
EVALUATION TOOL DESIGN ...................................................................................................... 14
3.1 Research Structure ................................................................................................................ 14
3.2 Research Methods for Evaluation Tool Design ................................................................... 14
3.2.1 Problem Definition ........................................................................................................ 14
3.2.2 Analysis and Diagnosis .................................................................................................. 15
3.3 Interview Result .................................................................................................................... 16
3.4 Research Methods for Structuring the New Evaluation Tool ............................................. 19
3.5 Confirmatory Factor Analysis (CFA) of Current Evaluation Tool ...................................... 21
3.6 Defining the New Evaluation Tool Structure ..................................................................... 24
CHAPTER 4 ................................................................................................................................... 27
IMPLEMENTATION AND RESULT OF PILOT STUDY .............................................................. 27
4.1 Research Methods to Implement and Evaluate Pilot Study ............................................... 27
4.1.1 Intervention ................................................................................................................... 27
4.1.2 Evaluation...................................................................................................................... 28
4.2 Data Result and Analysis .................................................................................................... 28
4.2.1 Confirmatory Factor Analysis (CFA) Based on Pilot Survey Data .............................. 29
4.2.2 Exploratory Factor Analysis (EFA) Based on Pilot Survey Data ..................................37
4.2.3 Sets of Factors and Variables Without Factor Analysis .............................................. 40
4.3 Predictive Validity Analysis ................................................................................................. 41
4.3.1 Classroom Training Analysis ......................................................................................... 41
4.3.2 Blended Training Analysis ........................................................................................... 49

2
4.3.3 Pit-Stop Development Program Analysis .................................................................... 50
4.4 Summary of Predictive Validity ........................................................................................... 51
CHAPTER 5 .................................................................................................................................... 53
DISCUSSION .................................................................................................................................. 53
5.1 Summary of Research Findings ............................................................................................ 53
5.1.1 Validity and Reliability of Evaluation Tool .................................................................... 53
5.1.2 Structure Parsimony and Weighted Overall Rating .................................................... 55
5.1.3 Limitation of the Project ............................................................................................... 56
5.2 Recommendations for Practical Implementation of New Evaluation Tool ...................... 57
5.3 Possible Improvements for Future Research ...................................................................... 60
5.4 Conclusion ........................................................................................................................... 60
References ....................................................................................................................................... 61
APPENDIX ..................................................................................................................................... 64
Appendix 1 – Detailed Information of CFA of Current Evaluation Tool ................................. 64
A1.1 Path Diagram Initial Structure of Current Evaluation Tool ......................................... 64
A1.2 Path Diagram Structure of Current Evaluation Tool after CFA .................................. 66
Appendix 2 – Detailed Information of CFA of New Design of Evaluation Tool ..................... 67
A2.1 Factor Analysis General Factors Constructs ................................................................. 67
Appendix 3 - Detailed Information of Regression Analysis of New Design of Evaluation Tool
................................................................................................................................................... 70
A3.1 EFA of Learning and Opportunity and Implementation of Transfer .......................... 70
A3.2 Mediation Effect of Motivation to Transfer in Hard Skill Classroom Training .......... 71
A3.3 Mediation Effect of Motivation to Transfer in Soft Skill Classroom Training ........... 72
A3.4 Mediation Effect of Motivation to Transfer in Blended Learning ...............................73
A3.5 Mediation Effect of Motivation to Transfer in Pit-Stop Program ............................... 74
A3.6 Correlation Matrix of Soft Skill Classroom Training ................................................... 75
A3.7 Correlation Matrix of Blended Learning ...................................................................... 76
A3.8 Correlation Matrix of Pit-Stop Program ...................................................................... 77
Appendix 4 – Adjustment of scales .......................................................................................... 78
Appendix 5 – Example Illustration of Recommended Evaluation Report .............................. 79

3
CHAPTER 1
INTRODUCTION
With the increase of competitiveness in the global economy era, it is getting more important
for organizations to excel in terms of the knowledge and skills of their employees (Aguinis &
Kraiger, 2009). Training and development programs have been regularly done by organizations
to facilitate the improvement of knowledge and skills of their employees. With the investment
of time and cost that the organizations have put into conducting the training and development
programs, it becomes crucial to know the effectiveness of the programs and how the programs
affect their employees. The programs will become beneficial for employees and organization
when employees are actually able to learn and gain knowledge and skills from the program, and
are able to implement those knowledge and skills into on-the-job behavior and improve their
working performance. The extent of implementation of knowledge into actual jobs and
maintaining it can also be called as transfer of training (Baldwin & Ford, 1988).
With the fast development of technology in the past years and continuous research on training
and development methods, currently various types of training and development interventions
exist and have advanced beyond the traditional methods of training such as classroom teaching
interventions. Research investigating outcomes of some types of training and development
interventions showed that different media that are used to deliver knowledge may have different
effects on the outcomes of training and development (Piccoli, Ahmad, & Ives, 2001; Arthur Jr. et
al., 2003).
This master thesis report will present a thorough explanation of the project related to the
evaluation of training and development programs at Vanderlande Industries B. V
(Vanderlande). The main objective of the thesis assignment is to design an evaluation tool that
can measure the effectiveness of training and development programs at Vanderlande, taking
into account the different methods used to enhance participants’ knowledge and skills.
1.1 General information about the company
1.1.1 Vanderlande Industries
Vanderlande is a company that engages in the logistic business by providing automated material
handling systems and the accompanying services to maintain, optimize, and enhance those
systems. The company was established in 1949 in The Netherlands and is currently executing
projects in over 100 countries. Vanderlande provides goods handling in airport baggage
handling systems, distribution centers, and parcel sortation facilities. The company manages
the material handling system from local sorting depots to airports and large facilities, in the
Netherlands and all around the world. To be able to provide complete service to the clients from
initial analysis to total life-cycle support, Vanderlande is equipped with the core competencies
in all relevant disciplines, from system design and engineering to project management and
customer services. (Vanderlande, 2015)
The company’s mission is to optimize its customers’ business processes and competitive
positions by working closely to improve the logistics and operations performance of the
customers throughout the entire system life cycle (Vanderlande, 2016). To carry out the mission,

4
Vanderlande has more than 3.900 employees worldwide who are deployed to the businesses on
all locations of Vanderlande projects (Vanderlande, 2015). Over one-third of the employees work
in the Netherlands, while the rest are located around the world. Vanderlande has been rapidly
expanding its organization and one of the core values that Vanderlande holds is to continuously
learn, develop, and innovate. In relation to the core values and internationalization that is
happening at Vanderlande, various types of training and development programs for employees
are provided to enable employees to enhance their skills and knowledge to contribute more to
the accomplishment of the company’s goals. Vanderlande has set up its branches to be able to
work closer to customers across Europe, North and South America, and Asia (Vanderlande,
2015). With regard to this expansion, the relevant skills and knowledge that are required are
developed within local teams with the help of the more experienced office branches in
Netherlands, Germany, the United Kingdom, and Spain (Vanderlande, 2015).
1.1.2 Vanderlande Academy and Talent Development
Vanderlande Academy (VA) was founded in 2008 as a response to the increase of demand for
education within Vanderlande (Vanderlande Academy, 2016). VA provides courses to all
national and international employees. VA provides training on general competency, software
applications, technical, and service trainings. Training programs are provided by in-house
trainers and also external organizers. The core activities of VA include developing courses for
Vanderlande’s internal learning process, organizing all training courses, managing the
administration of courses and employees who participate in the courses, setting up the training
programs for Vanderlande’s subsidiaries worldwide, managing the competence registration,
managing the education of certified trainers, and managing collaboration with schools and
universities.
Talent Development is a part of the Human Resource Department at Vanderlande
(Vanderlande, 2016). The Talent Development programs aim to stimulate and facilitate
employees’ personal development which relate to the accomplishment of organizational goals.
Compared to VA’s education and training programs which focus on specific content, including
hard and soft skills, Talent Development programs have broader and more holistic development
goals, for example development to be a better leader and the development of personal
capabilities to make a career step. There are several main ambitions of Talent Development
including designing and executing the development programs for different target groups locally
and globally and facilitating the development of solid international succession planning to
acquire insights into talents, key positions, and key players. Other ambitions are ensuring that
the right people are placed at the right places, and facilitating the operation of the development
program for Vanderlande employees.
1.2 Problem statement
Vanderlande aims to evaluate and keep track of the quality of all training and development
programs that are conducted for its employees. Currently, the tool that is used by Vanderlande
to evaluate its training and development programs is a tool that was developed by Radakrishnan
(2015). This tool was developed based on classroom trainings for soft skill and hard skill
generally. The evaluation tool is presented in a form of an online questionnaire in which trainees
have to fill in ratings for 28 questions related to trainee characteristics, training design
characteristics, trainer characteristics, and also three other general questions about trainee’s
overall judgements regarding the training program. The complete content of the current

5
evaluation tool can be seen in Chapter 3.4. The information that is gained from the trainees
about the implementation of training and development programs was intended to be used by
Vanderlande to analyze and improve the programs that are provided by both internal and
external parties.
After the operation of this evaluation tool for several months, VA found two problems based on
the result of the evaluation tool. The first one is a relatively smaller problem related to the
emergence of trainees who did not complete filling in the evaluation. Vanderlande had the
impression that there are a lot of trainees that did not complete the evaluation tool after filling
in few numbers. From the data of training evaluation during February to early May 2016, it
turned out that only about 4% of the employee did not continue completing the evaluation after
answering a few numbers of questions. Vanderlande suspected that this may relate to the
number of questions that were considered to be too large and the presence of similar questions
that are asked couple of times in the evaluation. Therefore, Vanderlande wanted to have an
analysis of possibilities of reduction in number of questions.
The second, more serious problem related to the non-applicability of the current evaluation tool
for some types of different training and development interventions. As the current evaluation
tool was designed on the basis of a traditional classroom environment, not all questions in the
evaluation tool were considered applicable for all types of training and development
interventions. For example, in the self-study training program, questions related to
communication with other participants are not applicable. This may also be the reason why the
trainees do not complete the questionnaire, and/or questioning the applicability of the
questions. In the current implementation of the tool, every question needs to be answered to
continue to the next question. When the participants thus still answer a question even if it is
not applicable to the program, the result of the evaluation tool may be inaccurate and not
representing the real situation of the training. Another issue that was brought up by
Vanderlande was that in the current evaluation tool, the overall rating of the training and
development programs were measured subjectively from only one general self-reported rating
that the trainees provide with no relation to the rating of other factors mentioned in the
questionnaire. Rather than having this self-reported overall rating, Vanderlande would like to
investigate an alternative way to estimate the quality of programs with the use of weighted score
of relevant factors of the training and development program.
1.3 Objectives and Research Questions
1.3.1 Objectives of the master thesis project
Based on the problems mentioned in 1.2, the main objective of this master thesis project is to
design a parsimonious training and development programs evaluation tool that can fulfill the
following requirement from Vanderlande, which are:
1. It should be valid and reliable
2. It should be applicable across different types of training and development interventions.
3. It should have an overall score that is based on weighted mean scores of factors related
to the training and development programs, taking into account the possibility that the
weights may vary across different types of interventions.

6
1.3.2 Research Questions
To achieve the objective, this master thesis project is driven by 6 research questions:
1. Which training and development interventions are available and used at
Vanderlande?
2. What types of intervention methods are usually used together in a training or
development program?
The above two questions were required to understand the actual implementation of various
training and development interventions at Vanderlande. In each training and development
program, it is possible to use more than one type of training intervention. Therefore, it was also
important to know what kind of training interventions are used together to design the
integrated evaluation tool.
3. How does Vanderlande currently evaluate learning and transfer of training across
training and development programs?
In evaluating training and development programs, there are four levels of evaluation criteria
that can be achieved, which are reaction, learning, behavior, and results (Kirkpatrick, 1996). The
aim of this question was to understand how extensively Vanderlande evaluates its training and
development at the moment (i.e. which of the four levels are included in the evaluation). From
this information, improvement could be made by extending the level of criteria included in the
evaluation tool, so that it would give a deeper understanding about the situation during the
training programs and its aftereffect.
4. Taking into account the general and special characteristics of training and
development interventions, which characteristics are the key factors that may affect
the learning and transfer of training & development performance at Vanderlande?
As learning and transfer of training are important outcomes that should be achieved by the
training and development programs, it was essential to know the factors that may affect the
achievement of those outcomes. The characteristics would then be included as factors that are
measured in the evaluation tool, so that insights on the actual implementation of the programs
could be drawn from the participants’ response towards those factors.
5. What is the most parsimonious integrated training and development evaluation
tool that can be developed at Vanderlande, taking into account the criteria for
reliability, validity, and completeness?
In designing the new evaluation tool, some requirements were needed to be fulfilled, such as
that the evaluation tool had to be valid, reliable, and complete in the sense that it included not
only general factors of training, but also special factors that related to different types of training
and development interventions. These factors were to be identified via a literature study.
However, if all potentially relevant factors were included in the survey, it would in all likelihood
result in too many questions for trainees to answer. Therefore, when the key factors of training
and development interventions that may affect the learning and transfer of training
performance had been found, it would be beneficial if the evaluation tool fulfilled Vanderlande’s
requirement to be a parsimonious evaluation tool without compromising the special criteria of
different interventions.

7
6. Based on the collected data from the pilot study, which factors affect the learning
and transfer of training that happens due to training and development program at
Vanderlande?
As part of this project, after the new evaluation tool was designed a pilot study was held to test
the reliability and validity of the tool as explained in Chapter 4. The result of this analysis
determined the final recommendation for the design of the integrated training and
development evaluation tool for Vanderlande, including which factors and variables to include
in the tool and whether a weighted factor system could be used as part of the evaluation tool.
1.4 Research scope
This research explored and analyzed the factors that are related to the training and development
interventions available and used at Vanderlande. Interventions types that were not used in
carrying out training and development programs at Vanderlande at this moment, and were not
expected to be used in the foreseeable future were not included in this research.
At Vanderlande, the training programs available at this moment consist of 53 types of soft-skill
programs, more than 80 types of hard-skill programs, 31 types of health & safety programs, and
dozens of other miscellaneous training programs (Vanderlande Academy, 2016). This research
included all types of training and development programs that were carried out during the first
half of 2016, and will be classified based on the type of interventions used in the program.
1.5 Outline of the report
This chapter contained the introduction of the project at Vanderlande including the problem
definition and the research questions that guided the research. Summary findings from a
literature study by Priyananda (2016) that was done as the base of this research is presented in
Chapter 2. Chapter 3 will explain the methodology used to design the evaluation tool and the
process to get the design. This Chapter also includes the result of the interview process and
analysis of the structure of the current evaluation tool. Chapter 4 explains the method for the
implementation and evaluation of the new design in a pilot study. This chapter also includes
the results of the pilot study and the statistical analysis of the data gathered on each
intervention. Chapter 5 presents the summary findings and recommendations for practical
implementation of the new design of evaluation tool. Limitations and suggestions for future
research are also described in this Chapter. The outline of this report is shown in Figure 1.
Introduction:-Problem Definition-Research Questions
Design of Evaluation Tool
Literature Review
Interview
CFA of Current Tool
Result and Recommendation
for New Design
Pilot Study
Factor Analysis
Multiple Regression
Chapter 1
Chapter 2
Chapter 3
Chapter 3
Chapter 3
Chapter 4
Chapter 4
Chapter 4
Chapter 4 & 5
Figure 1 Outline of Master Thesis Report

8
CHAPTER 2
SUMMARY OF LITERATURE REVIEW
This chapter includes the main findings of the literature review related to the research problems
as the basis of this master thesis project. This chapter includes a general overview of training
and development, the definition of different types of training and development interventions, a
general explanation of evaluation for training and development programs, and the
characteristics that were found to be affecting learning and transfer of training.
2.1 Training and development programs
Training and development are two types of program that are used to facilitate the teaching
process for required knowledge and skills. Participation in training is expected to improve the
work performance of the participants (Goldstein & Ford, 2002). Beside training, organizations
also provide development programs for their employees. Talent development is a strategically
aligned program in which organizations plan, select, and implement development strategies for
their employees to supply the organization with current and future talent (Garavan, Carbery, &
Rock, 2012). The talent here can be seen as a limited number of employees who have unique
competencies in the leadership and management aspects (Garavan et al, 2012).
While both training and development programs are done with the aim to improve skills and
knowledge, there are some similarities and differences between them. The differences lie in the
duration and content of the programs. Training typically is a short-term focused program for
trainees to gain the skills and knowledge of the tasks that are required at the present by trainees
to be able to succeed in their current position (Fitzgerald, 1992). In contrast, development has
a long-term focus where trainees participate in activities to gain skills and knowledge that can
be implemented for contributions in their organization, in the present or the future (Fitzgerald,
1992). In terms of content, the focus of training program can be on hard or soft skill aspects that
are needed for the employees’ current jobs (Laker & Powell, 2011). On the other hand,
development programs, as they are done to prepare the employees for future higher level
positions which frequently require management skills such as leadership and communication
ability, development programs have a strong focus on the improvement of soft-skill aspects for
their trainees. Though there are differences, training and development are also similar in terms
of the methods and approaches they use in formal delivery of materials. For example, both
training and development use classroom intervention as one of the ways to deliver the materials
to the participants.
2.2 Training and development interventions
In implementing training and development programs, there are several types of methods, here
called interventions, that can be used to deliver the material to participants. For training, the
interventions can be divided into on-site training programs which include having trainees being
placed into a particular job to learn from more experienced workers, and off-site training
programs that are done outside the real work environment. Table 1 shows the types and
explanation of training interventions and their characteristics.

9
Table 1 Training Interventions
Training Interventions Characteristics
On-site training programs
1 Apprenticeship Training program that usually consists of a formal training process and implementing the learned skill into the work alongside more experienced employees who the trainees can learn from (Chatzimouratidis, Theotokas, & Lagoudis, 2011)
2 Job Rotation This program includes learning the skills and knowledge by moving to various departments in the company or doing various jobs in a department (Landy & Conte, 2013).
Off-site training programs
3 Traditional classroom lectures
This is the traditional method of training where trainees get lectures from the trainer in the classroom (Landy & Conte, 2013).
4 Multimedia-based training Consists of:
a) Programmed Instruction
Self-paced training program that gives trainees instruction via written or computer-based materials (Landy & Conte, 2013).
b) Simulators The learning process uses a system that adapts the important characteristic of the relevant work in real life (Landy & Conte, 2013).
c) Computer-based training
This training method uses computers to transfer the knowledge and skills for the jobs to trainees (Brown & Ford, 2002 in Landy & Conte, 2013). Landy & Conte (2013) stated that this type of training method can be done when trainees are present in one location or can be done in the term of distance learning. Computer based training includes the organizations' intranets, multimedia learning environment, and e-learning (including Virtual learning environment and Massive On-line Open Course (MOOC).
5 Blended learning The use of various types of interventions (i.e. a combination of intervention 1-4) during the whole process of one training (Singh, 2003)
For development programs, the interventions that can be used are listed in Table 2.
Table 2 Development Interventions
Development Intervention
Explanation
1 Formal Education
This type of approach includes on site and off site lecture programs that are designed specifically for the employee, and can be carried out by an internal or external organizer (Noe, Employee Training and Development, 2010). This on-site and off-site program methods are similar to the training program method explained in Table 1.
2 Assessment This refers to the activities where information regarding relevant skills or behavior of employees is collected from themselves and also from their peers, manager, and/or subordinates, as a basis for feedback (Noe, Employee Training and Development, 2010). This method can be included in employee development program as a tool to identify employees who have potential in managerial aspect or to measure the strength and weaknesses of current managers (Noe, Employee Training and Development, 2010)

10
Development Intervention
Explanation
3 Interpersonal Relationship (Mentoring & Coaching)
This approach includes mentoring and coaching. In mentoring, mentors are usually more senior or experienced employees who will help the trainees who are less experienced in the relevant areas (Noe, Employee Training and Development, 2010), while coaching process can be managed by a trained internal or external coach, but also can be done in term of peer coaching (Berg & Karlsen, 2012). Mentoring is often associated with broader development for career progress while coaching is often done regarding a specific aspect of employees’ jobs (Clutterbuck, 2008)
4 Outdoor Management Development
For this development approach, activities are conducted in outdoor environment and demand some kind of physical effort from the trainees (Jones & Oswick, 2007)
5 Business Games
This type of development activity is usually done for management skills development to simulate the nature of competitiveness in the business world (Noe, Employee Training and Development, 2010).
2.3 Training evaluation
The design of training evaluation in this master thesis project was based on Kirkpatrick’s level
of criteria framework. This framework has been used in many research about training since its
publication in 1959 (Goldstein & Ford, 2002). The criteria levels consist of reaction, learning,
behavior, and results. Evaluation of reaction is related to the extent to which the trainee likes
the training (Kirkpatrick, 1996). Learning evaluation examines the level of knowledge and skills
that were attained by trainees from the training process (Kirkpatrick, 1996). Evaluation of
behavior measures the changes that happen to trainee's on-the-job behavior which are related
to training content. Result evaluation assesses the outcomes of training in terms of tangible
measures such as production quantity, quality, or cost (Kirkpatrick, 1996). Philips (2012)
expanded Kirkpatrick's model by adding the fifth level for evaluation of Return on investment,
which examines the financial benefits of training programs. A taxonomy that was made by
Alliger et al. (1997) explained the 4 criteria of training evaluation by Kirkpatrick (explained in
1.3) and their respective evaluation framework as shown in Table 3.
Table 3 Training Evaluation Criteria Taxonomies
Kirkpatrick's Taxonomy Augmented framework
Level 1: Reactions Reactions Affective reactions Utility Judgements
Level 2: Learning Learning Immediate knowledge Knowledge retention Behavior/Skill demonstration
Level 3: Behavior Transfer
Level 4: Results Results
2.4 Transfer of training
Organizations provide training and development programs for their employees with the aim to
improve their skills and knowledge, and to enable them to implement the skill and knowledge
to their on-the-job behavior. The extent to which trainees implement the skills and knowledge
11
that they have gained from training or development programs are called the transfer of training
(Goldstein & Ford, 2002). The extent of learning that occurs from participating in the training
program was considered as an important predictor of training transfer (Kraiger, Ford, & Salas,
1993).
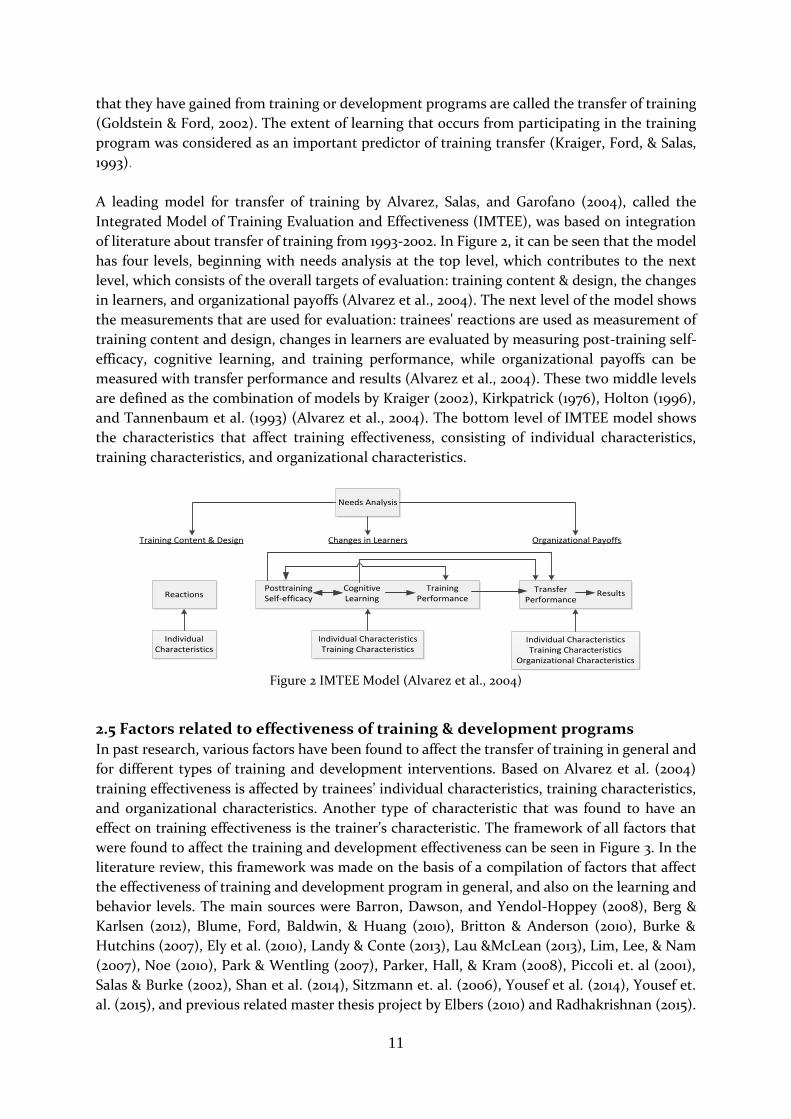
A leading model for transfer of training by Alvarez, Salas, and Garofano (2004), called the
Integrated Model of Training Evaluation and Effectiveness (IMTEE), was based on integration
of literature about transfer of training from 1993-2002. In Figure 2, it can be seen that the model
has four levels, beginning with needs analysis at the top level, which contributes to the next
level, which consists of the overall targets of evaluation: training content & design, the changes
in learners, and organizational payoffs (Alvarez et al., 2004). The next level of the model shows
the measurements that are used for evaluation: trainees' reactions are used as measurement of
training content and design, changes in learners are evaluated by measuring post-training self-
efficacy, cognitive learning, and training performance, while organizational payoffs can be
measured with transfer performance and results (Alvarez et al., 2004). These two middle levels
are defined as the combination of models by Kraiger (2002), Kirkpatrick (1976), Holton (1996),
and Tannenbaum et al. (1993) (Alvarez et al., 2004). The bottom level of IMTEE model shows
the characteristics that affect training effectiveness, consisting of individual characteristics,
training characteristics, and organizational characteristics.
Needs Analysis
Reactions
Individual Characteristics
Training Content & Design Changes in Learners Organizational Payoffs
Posttraining Self-efficacy
Cognitive Learning
Training Performance
Individual CharacteristicsTraining Characteristics
Individual CharacteristicsTraining Characteristics
Organizational Characteristics
Transfer Performance
Results
Figure 2 IMTEE Model (Alvarez et al., 2004)
2.5 Factors related to effectiveness of training & development programs
In past research, various factors have been found to affect the transfer of training in general and
for different types of training and development interventions. Based on Alvarez et al. (2004)
training effectiveness is affected by trainees’ individual characteristics, training characteristics,
and organizational characteristics. Another type of characteristic that was found to have an
effect on training effectiveness is the trainer’s characteristic. The framework of all factors that
were found to affect the training and development effectiveness can be seen in Figure 3. In the
literature review, this framework was made on the basis of a compilation of factors that affect
the effectiveness of training and development program in general, and also on the learning and
behavior levels. The main sources were Barron, Dawson, and Yendol-Hoppey (2008), Berg &
Karlsen (2012), Blume, Ford, Baldwin, & Huang (2010), Britton & Anderson (2010), Burke &
Hutchins (2007), Ely et al. (2010), Landy & Conte (2013), Lau &McLean (2013), Lim, Lee, & Nam
(2007), Noe (2010), Park & Wentling (2007), Parker, Hall, & Kram (2008), Piccoli et. al (2001),
Salas & Burke (2002), Shan et al. (2014), Sitzmann et. al. (2006), Yousef et al. (2014), Yousef et.
al. (2015), and previous related master thesis project by Elbers (2010) and Radhakrishnan (2015).
12
In the framework, the general characteristics that affect transfer of training are shown in the
top boxes, followed by the distinct characteristics of each type of interventions below them. The
framework in Figure 3 was the basis of the characteristics to be explored in the master thesis
project. Factors that are related to the general description of effectiveness (i.e. where it is unclear
to which level this effectiveness refer) are defined as "E", factors that are related to learning level
are defined as "L", and factors that are related to behavior level are defined as "B". As for the
factors that were found from empirical or meta-analysis studies, the code “EMA” was added, as
well as “EO” for expert opinion and “WO” for self-assessment by Priyananda (2016). Example of
a way to interpret Figure 3 is as follows: For evaluating classroom training, it is important to
take into account characteristics in general factors that affect transfer of training and also to
add extra characteristics of trainer & fellow trainee communication & support, motivation to
transfer, transfer effort, and interesting lecture method. In contrast, for peer coaching
intervention, besides including the general factors, it is also important to look at the
characteristic of fellow trainee communication & support and trust in the coach. From the
framework, it can be seen that each type of intervention has different characteristics that affect
its effectiveness. Thus, it is important to take into account these differences in designing the
evaluation tools rather than having same questions for all types of training and development
interventions.

13
Cognitive Ability
Conscientiousness
Voluntary Participation
Neuroticism
Self Efficacy
Motivation to Learn
Learning Goal Orientation
AnxietyOpen to ExperiencePerceived Utility
Career Planning
Organizational Commitment
Apprenticeship
Job Rotation
Classroom Training
Programmed Instruction
Simulator
Computer-basedGeneral e-Learning
Computer-basedMOOC
Mentoring & Coaching
Peer Coaching
Assessment
Outdoor Management Development
Business Games
Trainee s technology attitude – L,B (EMA)
Readiness – E (EO)
Trainee Characteristics Training Design Characteristics
Clear GoalsContent Relevance
PracticeFeedback
Behavioral Modeling
Error-based examples
Modeling – E (EO)
Evaluation – E (EO)
Fellow Trainee Communication &
Support – L, B (EMA)
Evaluation – E (EO)
Fidelity – E (EO)
Content Qual. & Org. – B (EO)Fellow Comm. & Support – B
(EO)Quality of technical system –
B (EO)Trainee s control – L (EMA)Easiness to Access system –
L (EMA)
Quality of User Interface – L (EMA)
Use of Intl. Lang & Time - EContent Quality & Organization – E (EO)
Time Allocation for Program – L (EMA)
Fellow Trainee Communication & Support – L (EMA)
Time Allocation for Program – B (EMA)
Transfer Design – B (EMA)
Fulfillment Expectation – B (EMA)
Content Qual. & Org. – E (EO)
Fidelity – E (EO)
Work Environment Characteristics
Transfer ClimateSupervisor support
Peer Support
Opportunity to Perform
Trainer s Characteristics
Interesting Lecture Method – L (EMA)
Trainer s technology attitude – B (EO)
Trainer s Competency, Credibility, Experience – E
(EO)Trust to Coach/Mentor –
E (EO)Coach/Mentor s
Commitment – E (EO)
Trust to Coach/Mentor – E (EO)
GENERAL FACTORS AFFECTING TRANSFER OF TRAINING – B (EMA)
Expectation to Program
Content Qual. & Org. – L (EMA)
Fellow Comm. & Support – L (EMA)
Quality of technical system – L (EMA)
Trainee s control – L (EMA)
Use of Intl. Language & time – L (EMA)
Motivation to Transfer – B (EMA)
Transfer Effort - B (EMA)Trainer s Comm. &
Support – L, B (EMA)
Trainer s Comm. & Support – L (EMA), B (EO
Trainer s Comm. & Support – L (EMA)
Trainer s Comm. & Support – L (EMA)
Figure 3 Integrated factors affecting training effectiveness

14
CHAPTER 3
EVALUATION TOOL DESIGN
This chapter aims to explain the methods that were used to design the new evaluation tool and
the initial design of the new evaluation tool. The chapter starts with the explanation of the
research structure which then continues to the detail description of that structure in relation
with the design process of the new evaluation tool. The implementation of the design process
is then described and followed by the result.
3.1 Research Structure
This research was structured based on the problem solving cycle by Van Aken, Berends, and
Van der Bij (2012). This structure was chosen due to the compatibility between the objective of
this research and the focus of problem solving cycle, which is on the fulfillment of emerging
requirements related to business problems of an organization (Van Aken et al., 2012). The
problem solving cycle consists of problem definition, analysis and diagnosis, solution design,
intervention, and learning/evaluation as depicted in Figure 4.
Learning and Evaluation
Intervention
Solution Design
Analysis and Diagnosis
Problem Definition
Problem Mess
Figure 4 Problem solving cycle (Van Aken et. al.,2012)
Following the problem solving cycle, there were quantitative and qualitative methods were used
during this research to answer the research questions. To answer research questions 1, 2, 3, and
4, Problem Definition, Analysis and Diagnosis and Solution Design were carried out. The details
of these steps are explained in this Chapter 3. Research questions 5 and 6 were answered by
implementing steps the Intervention and Evaluation, which will be explained in Chapter 4.
3.2 Research Methods for Evaluation Tool Design
3.2.1 Problem Definition
This research started with the identification and formulation of clear business problems related
to training and development evaluation at Vanderlande. The research questions for the research
were also defined at this stage. A literature review was done based on previous training and
development evaluation studies and documents from Vanderlande. Information from the
manager of Vanderlande Academy (VA) and Training Development (TD) was also used in this
15
stage. The information that was gathered was put into documents of literature study and
research proposal by Priyananda (2016).
3.2.2 Analysis and Diagnosis
After defining the main problems and research questions, the next step was to analyze the
problem and its context. For this step, series of interview series was conducted and
Vanderlande’s training and development documentations were examined.
To get started, interviews with the manager of VA and TD were done in order to answer research
questions 1, 2, and 3 below:
1. Which training and development interventions are available and used at Vanderlande?
2. What types of intervention methods are usually used together in a training or development
program?
3. How does Vanderlande currently evaluate learning and transfer of training across training
and development programs?
With the information that was extracted from the interviews, the researcher proceeded to
answer research question 4: Taking into account the general and special characteristics of
training and development interventions, which characteristics are the key factors that may affect
the learning and transfer of training & development performance at Vanderlande? The answer to
this research question was defined based on literature review by Priyananda (2016) and sets of
interviews with the training and development experts at Vanderlande.
As explained in the summary of the literature review in Chapter 2, there are general and distinct
characteristics (factors) that can affect the effectiveness of training and development programs,
be it in terms of general effectiveness, or more specifically at the learning level and the behavior
level. However, based on Goldstein & Ford (2002), the criteria’s relevancy and reliability are
important aspects to be considered in defining criteria for training evaluation. Based on Kasunic
(2005), conducting in-depth interview with experts on the related subject prior to designing a
survey instrument is valuable to do as the interviewee can help the researcher to define the
relevant survey questions and give feedback to the researcher about the survey items. The
experts can also help to categorize the items and select the highest priority items in the survey
(Kasunic, 2005). Therefore, sets of interviews with the managers and training and development
experts at Vanderlande were conducted to define which factors on each intervention were
relevant to be explored in this research. The experts that were interviewed were the employees
who work at the VA and Human Resources department, and were directly involved in the
managing and implementation of training and development programs at Vanderlande. The
interviews were conducted with 5 respondents: the VA Manager, the TD manager, two learning
consultants from VA, and one Human Resources Manager with previous experience as TD
Manager. Besides the interviews, documents related to the training and development
interventions at Vanderlande were also analyzed.
The interviews were done as a face-to-face interview with each of the respondents. The way to
deliver the questions was based on semi-structured interview method. Using open-ended type
of question is likely the most popular in the interview used in research studies due to its nature
that allows the respondents to express their point of view and experience fully (Turner, 2010).
Semi-structured interview method could be used to understand relationships between variables
(Saunders, Lewis, & Thornhill, 2009). The latter was aligned with the objective of this interview

16
process, which was to know which characteristics are related to learning and transfer of training
of various training and development interventions at Vanderlande. In the interview, the
researcher used an interview guideline, including the questions that were intended to be asked.
Respondents were asked the same key questions, but quite flexible in the sense that when the
respondents did not understand the question, the researcher could explain the question further
to the respondent, and further questions apart from the pre-determined questions but still
relevant to the research were also asked when needed. During the interview, participants were
asked about the characteristics of trainee, trainer, training design, and work environment at
Vanderlande that could affect the learning and transfer of training process based on their own
opinion and also their opinion about the characteristics that were found from the literature.
Participants were also asked about which characteristics they would recommend to include in
the new design for evaluation tool.
3.3 Interview Result Two different interview sessions were held at Vanderlande. The first one was interview sessions
to the Managers of Vanderlande Academy and Talent Development to answer the research
questions 1, 2, and 3. After that, the second interview sessions were held with 5 participants
mentioned in 3.2.2. The literature review, combined with the result of this interview was used
to find the answer of Research question 4. This section will explain the result of the interviews
in detail.
1. Which training and development interventions are available and used at Vanderlande?
The interview session with the Managers of Vanderlande Academy and Talent Development
revealed that six types of training and development interventions were used. Table 4 shows
the information about those training interventions.
Table 4 Training & Development Interventions at Vanderlande
No Intervention Explanation
1 Classroom Training This is the most common type of intervention which is used in almost all training and development program at Vanderlande. The only program that does not involve this intervention is the pure E-learning training program. Classroom training is used for both hard and soft-skill programs.
2 E-learning (Web-based Training)
This type of training involves the use of computer and internet network for delivering the material. This is usually a program where the trainees learn by themselves without the physical presence of trainer and other trainees.
3 Coaching This is a part of development program in which Vanderlande assigns a coach to the participants of the program. The coach can be an external professional coach or an internal employee with a higher level position at Vanderlande who has been trained to be a coach.
4 Peer Group Counseling In this type of development intervention, participants are instructed to learn and support or help each other as a group. There are also trainers who accompany the groups and support the group by giving counseling and feedback to the group members.

17
No Intervention Explanation
5 Outdoor Program Outdoor program is part of development interventions. In this intervention, participants engage in a program that is conducted in an outdoor environment with the content related to the topic of the development program they follow (e.g. rafting program for teamwork training).
6 Business Case Participants of Business Case are given examples of problem case related to the topic of the development program that can happen in a company. The participants are then asked to analyze and find solutions to the problem.
2. What types of intervention methods are usually used together in a training or development
program?
Based on the six interventions mentioned in the answer of research question 1, there are
seven types of classification in using the interventions for training and development
programs at Vanderlande. The first two are the use of only Classroom training or E-learning
intervention in the programs. During the first half of 2016, there were more than 100
classroom training programs were held with more than 400 participants, and ten e-learning
programs with about 30 participants. The other five types consist of integration of at least
two interventions in a program as shown in Table 5. The table shows the name of the
programs and the interventions used during the implementation of those programs.
Table 5 Integration of Interventions
No Name of Training/Development
Program
Intervention(s) used in the program and number of programs and participants during the
first half of 2016
1 Blended Learning Classroom Training and E-learning. There were four programs with about forty participants.
2 Pit-Stop Classroom Training and Business Case There were three programs with about sixty participants.
3 Authentic Leadership Classroom Training, Peer Group Counseling, Outdoor Program There was one program with fifteen participants.
4 Leadership I Classroom Training, Coaching, Peer Group Counseling There was one program with fourteen participants.
5 Personal Leadership Classroom Training, Coaching, Peer Group Counseling, Outdoor Program There was one program with twelve participants.
3. How does Vanderlande currently evaluate learning and transfer of training across training
and development programs?
Vanderlande currently did not directly evaluate the learning and transfer of training across
its training and development program. The evaluation tool that Vanderlande uses at this
moment (Radhakrishnan, 2015) measures the factors that potentially can affect learning and
transfer of training. This research extended the evaluation tool by adding the elements of
perceived learning and transfer of training measurement to the newly designed evaluation
tool. This addition of new elements was important to verify whether the factors included in
the new design of evaluation tool indeed predicted learning or transfer of training at
Vanderlande.

18
4. Taking into account the general and special characteristics of training and development
interventions, which characteristics are the key factors that may affect the learning and
transfer of training & development performance at Vanderlande?
Interview with experts in Training and Development program at Vanderlande were done
with five interviewees in the form of face-to-face interview in the period between 15-24 June
2016. The purpose was to get insights on which of the characteristics mentioned in the
literature review were relevant as the characteristics that may affect the learning and
transfer of training at Vanderlande, and whether there were also other relevant
characteristics that were not mentioned in the literature review.
In this interview process, the interviewees were asked about their own opinions of the
characters that can affect learning and transfer of training, and also their opinions on the
characters that were found in the literature study. Opinion about the special characters were
only asked to the interviewees who had managed the respective programs. During the
interview, almost all general and special characters shown in Figure 3 were mentioned by at
least one interviewee as the factor that may affect the learning and transfer of training. The
personal opinion of the interviewees that were not shown in Figure 3 were also mentioned
such as the reflection and feedback after outdoor program and business case. To narrow
down the choices to define which factors to put in the new evaluation tool, the interviewees
were also asked which characteristics between all the characteristics that had been
mentioned were thought to be the key characteristics that may affect learning and transfer
of training at Vanderlande and recommended to be put in the evaluation tool. Table 6
describes the characteristics of training and development programs that were
recommended to be put in the evaluation tool by at least 1 interviewee and/or were thought
to affect learning or transfer of training at least by two interviewees (i.e. The special
characteristics of interventions that are used in development programs were only asked to
HR manager and TD manager). This set of characters became the guide to structure the new
evaluation tool. In the final initial structure of new evaluation tool, not all of these
characteristics were included due to practicality reasons that will be explained in 3.5.
Table 6 Key Characteristics Affecting Learning and Transfer of Training
General Factors Classroom Training E-learning
Motivation to Learn
Learning goal orientation
Perceived utility
Cognitive Ability
Voluntary Participation
Content relevance
Clear goals
Behavioral Modeling
Feedback & Practice
Motivation to transfer
Trainer communication & support
Interesting lecturing method
Transfer effort
Fellow Trainee communication & support
Trainee Technology attitude
Content quality & organization
Quality of user interface
Quality of Technical system
Trainee control
Coaching Outdoor program & Business Case
Work environment
Experience & competence of the Coach
Trust in Coach
Coach Commitment
Fidelity
Reflection/feedback after the program
Transfer Design
Transfer climate
Opportunity to perform
Supervisor support
Peer Support

19
3.4 Research Methods for Structuring the New Evaluation Tool
This part was based on the solution design step. The solution design step was the first step to
answer research question 5: What is the most parsimonious integrated training and development
evaluation tool that is possible to be developed at Vanderlande?. In this step, the design of the
evaluation tool was determined, including the choice of the set of variables related to the
relevant factors that had been found as the answer of research question 4, and the structure of
the variables in the evaluation tool. This step included studying literatures related to the
relevant characteristics to obtain validated scales for all factors and also allocating the
characteristics to either of general factors or the specialized factors of each intervention.
The current evaluation tool that Vanderlande uses was based on research by Radhakrishnan
(2015), in which its validity had been determined by Exploratory Factor Analysis (EFA) on
relatively small sample. As it also includes general characteristics that may be explored in this
project, a confirmatory factor analysis (CFA) was done with larger sample of 509 data that were
gathered from the employees who filled in the evaluation tool in February until early May 2016
to verify whether the structure of the questions in each characteristic is still applicable to be
used in the new design of the evaluation tool. This analysis was also done in order to find the
most parsimonious valid set of variables that can construct a factor. The result of this CFA was
subsequently used when the factors were defined to be part of the new design of the evaluation
tool. The theory used in the statistical analysis was based on Hair et al (2010) and some other
sources mentioned in the following explanations. Table 7 explains the measurements that were
done during CFA.
Table 7 Measurements for CFA
Terms Explanation
Absolute Fit Indices Direct measure of how well the model that was specified by the researcher reproduces the observed data
Normed Chi-square (χ2)
The ratio of χ2 to the degrees of freedom of a model. The ratio of χ2:df on the order of 3:1 or less are associated with better fitting model.
Root Mean Square Error of Approximation (RMSEA)
Lower RMSEA value shows better model-fit. The cutoff value for RMSEA is 0.05 or 0.08 or lower
Incremental Fit Indices Assess how well the estimated model fits relative to some alternative baseline model.
Comparative Fit Index (CFI)
The value of CFI ranges from 0 to 1, the closer the value to 1, the better-fit the model. CFI values of more than 0.90 or 0.95 are typically associated with good-fit model.
Parsimony Fit Indices This set of indices show which model is the best based on its fit relative to its complexity.
Parsimony Normed Fit Index (PNFI)
PNFI is an adjusted Normed Fit Index (NFI) The value of PNFI ranges from 0 to 1, the closer the value to 1, the better-fit the model
Construct validity The extent to which the measured variables actually represent the theoretical latent construct those variables are designed to measure.
Convergent validity The extent to which the measured variables of a construct share a high proportion of variance in common. The measure of convergent validity can be seen from the value of factor loadings, average variance extracted, and construct reliability.

20
Terms Explanation
Factor loadings All factor loadings should be statistically significant and standardized loading estimates should be 0.5 or higher, and ideally 0.7 or higher. In CFA, variables with low loadings become candidates for deletion.
Average variance extracted (AVE)
The average percentage of variation among the variables of a construct. It is a measurement of convergence among a set of variables that represent a latent construct. AVE measurement is required for each latent construct. AVE should be 0.5 or higher to suggest adequate convergent validity.
Construct reliability
The measurement of reliability and internal consistency of the measured variables that represent a latent construct. CR value of 0.7 or higher suggests good reliability.
Discriminant validity The extent to which a construct is really distinct from the other constructs in terms of how much it correlates to the other constructs and how distinct its measured variables represent only this single construct.
Maximum Shared Squared Variance (MSV)
Indicates how well a factor is explained by variables of other factors. (Hariri & Roberts, 2015) The value of MSV is measured for each construct. The value can be measured by squaring the biggest value of correlation between a construct with other constructs.
Average Squared Variance (ASV)
Indicates how much, on average, a factor is explained by the variables of other factors. (Hariri & Roberts, 2015) The value can be measured by calculating the average value of the square of correlations between a construct with other constructs.
Modification Indices (MI) When a relation between variables, factors, or error terms in a model shows modification indices value of 4.0 or greater, it suggests that the fit of the model could be improved by making a modification to the corresponding relation.
The relationship of factors (latent constructs) and their variables are shown in the form of path
diagram. In path diagram, latent constructs are shown as ellipses, and the measured variables
are represented by rectangles. Each measured variable has an error term which depicts the
extent to which the latent factor does not explain the measured variable. This error term is
shown as a rectangle in the path diagram. The relationship between latent constructs and
between latent constructs and their measured variables are shown with the arrows. An example
of path diagram is shown in Appendix A1.1.
Beside CFA, Exploratory Factor Analysis (EFA) was also done in some parts to give a clearer
understanding of the model’s structure. The EFA was done with Principal Component Analysis
due to the research focus on finding the minimum number of factors required to represent the
maximum portion of total variance shown in the original set of variables. Along with that,
Oblique rotation was chosen because it is considered as more accurate for social or human
behavior study due to its nature that allows correlation between variables was chosen (Osborne
& Costello, 2009). As part of oblique rotation, Promax rotation was used in the analysis as it has
been shown to be effective in statistical studies and popular in practice (Finch, 2013). To check
the reliability of the scale, reliability coefficient Cronbach’s alpha is the most widely used
measure. The lower limit of acceptable Cronbach’s alpha is 0.70, or 0.60 in exploratory research.
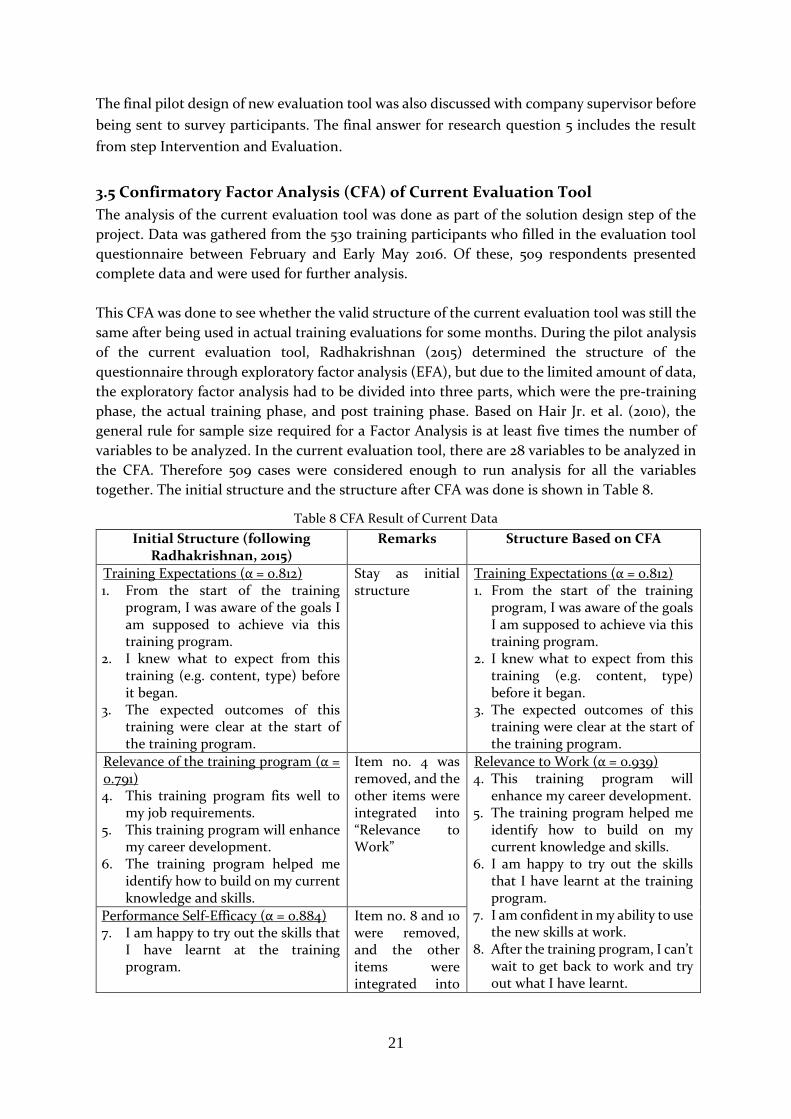
21
The final pilot design of new evaluation tool was also discussed with company supervisor before
being sent to survey participants. The final answer for research question 5 includes the result
from step Intervention and Evaluation.
3.5 Confirmatory Factor Analysis (CFA) of Current Evaluation Tool
The analysis of the current evaluation tool was done as part of the solution design step of the
project. Data was gathered from the 530 training participants who filled in the evaluation tool
questionnaire between February and Early May 2016. Of these, 509 respondents presented
complete data and were used for further analysis.
This CFA was done to see whether the valid structure of the current evaluation tool was still the
same after being used in actual training evaluations for some months. During the pilot analysis
of the current evaluation tool, Radhakrishnan (2015) determined the structure of the
questionnaire through exploratory factor analysis (EFA), but due to the limited amount of data,
the exploratory factor analysis had to be divided into three parts, which were the pre-training
phase, the actual training phase, and post training phase. Based on Hair Jr. et al. (2010), the
general rule for sample size required for a Factor Analysis is at least five times the number of
variables to be analyzed. In the current evaluation tool, there are 28 variables to be analyzed in
the CFA. Therefore 509 cases were considered enough to run analysis for all the variables
together. The initial structure and the structure after CFA was done is shown in Table 8.
Table 8 CFA Result of Current Data
Initial Structure (following Radhakrishnan, 2015)
Remarks Structure Based on CFA
Training Expectations (α = 0.812) 1. From the start of the training
program, I was aware of the goals I am supposed to achieve via this training program.
2. I knew what to expect from this training (e.g. content, type) before it began.
3. The expected outcomes of this training were clear at the start of the training program.
Stay as initial structure
Training Expectations (α = 0.812) 1. From the start of the training
program, I was aware of the goals I am supposed to achieve via this training program.
2. I knew what to expect from this training (e.g. content, type) before it began.
3. The expected outcomes of this training were clear at the start of the training program.
Relevance of the training program (α = 0.791) 4. This training program fits well to
my job requirements. 5. This training program will enhance
my career development. 6. The training program helped me
identify how to build on my current knowledge and skills.
Item no. 4 was removed, and the other items were integrated into “Relevance to Work”
Relevance to Work (α = 0.939) 4. This training program will
enhance my career development. 5. The training program helped me
identify how to build on my current knowledge and skills.
6. I am happy to try out the skills that I have learnt at the training program.
7. I am confident in my ability to use the new skills at work.
8. After the training program, I can’t wait to get back to work and try out what I have learnt.
Performance Self-Efficacy (α = 0.884) 7. I am happy to try out the skills that
I have learnt at the training program.
Item no. 8 and 10 were removed, and the other items were integrated into

22
Initial Structure (following Radhakrishnan, 2015)
Remarks Structure Based on CFA
8. I am curious to see the outcomes when I employ my learnt skills at work.
9. I am confident in my ability to use the new skills at work.
10. At work, I feel very confident using what I have learnt in this training program even in the face of difficult situations.
11. After the training program, I can’t wait to get back to work and try out what I have learnt.
“Relevance to Work”
9. The training will influence my performance on the job.
10. The training meets my job related development goals.
11. My training performance will have a direct impact on my results at my job.
12. This training program will increase my personal productivity.
13. I believe that this training program will help me do my current job better. Fulfilment expectations (α = 0.843)
12. The training will influence my performance on the job.
13. The training meets my job related development goals.
14. The content of the training program fits to my training needs.
Item no. 14 was removed, and the other items were integrated into “Relevance to Work”
Impact on work performance (α = 0.888) 15. My training performance will have
a direct impact on my results at my job.
16. This training program will increase my personal productivity.
17. I believe that this training program will help me do my current job better.
All items were integrated into “Relevance to Work”
Practice and Feedback (α = 0.836) 18. During the training, I got feedback
from the trainer about the way I was applying the new knowledge and skills.
19. After the training, the trainer made clear that I did or did not meet the formulated requirements.
20. There were sufficient exercises during the training to properly understand how I must apply the learned knowledge and skills into practice.
21. During the training, I received feedback from other participants about the way I was applying the new knowledge and skills.
22. During the training, I got enough instructions from the trainer about how to apply the new knowledge and skills of the training.
Items no. 19 and 22 were removed.
Practice and Feedback (α = 0.783) 14. During the training, I got
feedback from the trainer about the way I was applying the new knowledge and skills.
15. There were sufficient exercises during the training to properly understand how I must apply the learned knowledge and skills into practice.
16. During the training, I received feedback from other participants about the way I was applying the new knowledge and skills.

23
Initial Structure (following Radhakrishnan, 2015)
Remarks Structure Based on CFA
Goal Clarity (α = 0.797) 23. I had specific, clear training goals to
aim for during this training program.
24. I knew which of the goals I want to accomplish were the most important.
Stay as initial structure
Goal Clarity (α = 0.797) 17. I had specific, clear training goals
to aim for during this training program.
18. I knew which of the goals I want to accomplish were the most important.
Trainer support (α = 0.897) 25. The trainer had sufficient
experience about the topics covered during the training.
26. The trainer had sufficient knowledge about the topics covered during the training.
Stay as initial structure
Trainer support (α = 0.897) 19. The trainer had sufficient
experience about the topics covered during the training.
20. The trainer had sufficient knowledge about the topics covered during the training.
Up-to-date content (α = 0.839) 27. The content of the training
program was up to date. 28. The trainer used up-to-date
equipment/ training materials
Stay as initial structure
Up-to-date content (α = 0.839) 21. The content of the training
program was up to date. 22. The trainer used up-to-date
equipment/ training materials.
During the process, six variables were removed from the initial structure and four factors were
integrated into one factor. The changes were made through several Models to increase the
Model-fit and validity of the construct. Table 9 shows the summary explanation of the changes
made to the structure during the CFA. The measurements mentioned in the explanation were
based on the result from SPSS and SPSS AMOS.
Table 9 Changes Made During CFA
Changes in Structure Explanation
1) Deletion of “At work, I feel very confident using what I have learnt in this training program even in the face of difficult situations.”
Value of standardized loading estimates lower than 0.7, and its error term had high Modification Indices (MI) with the error term of variable “I am confident in my ability to use the new skills at work.” (MI value: 106.67). As mentioned in Table 7, value of MI above 4 shows that the fit value of the model can be improved by modifying the respective relation. As including covariance between the error terms were considered as a threat to construct validity (Hair et. al, 2010), then it was chosen to delete one of the factors related to the correlated error terms that has factor loading lower than 0.7.
2) Deletion of “This training program fits well to my job requirements.”
Value of standardized loading estimates lower than 0.7.
3) Deletion of “After the training, the trainer made clear that I did or did not meet the formulated requirements.”
Value of standardized loading estimates lower than 0.7.
4) Deletion of “During the training, I got enough instructions from the trainer about how to apply the new knowledge and skills of the training.”
Had high Modification Indices (MI) with construct Trainer Support.
5) Deletion of “The content of the training program fits to my training needs.”
Value of standardized loading estimates lower than 0.7.
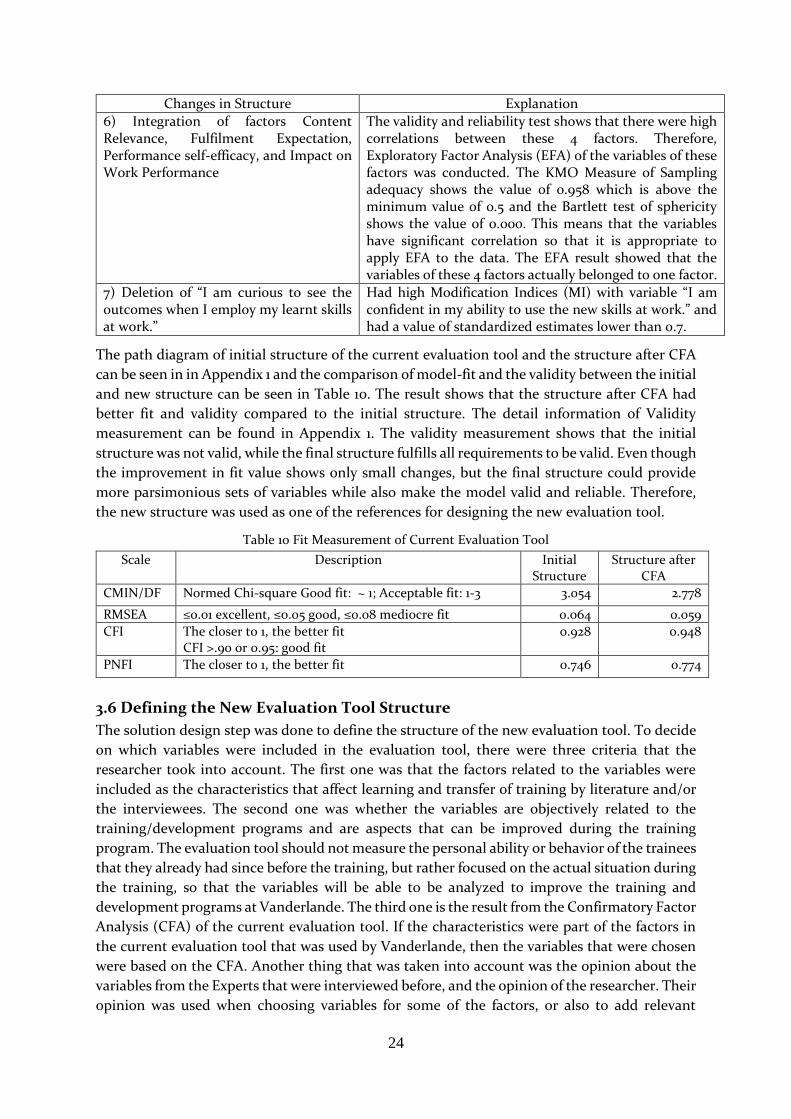
24
Changes in Structure Explanation
6) Integration of factors Content Relevance, Fulfilment Expectation, Performance self-efficacy, and Impact on Work Performance
The validity and reliability test shows that there were high correlations between these 4 factors. Therefore, Exploratory Factor Analysis (EFA) of the variables of these factors was conducted. The KMO Measure of Sampling adequacy shows the value of 0.958 which is above the minimum value of 0.5 and the Bartlett test of sphericity shows the value of 0.000. This means that the variables have significant correlation so that it is appropriate to apply EFA to the data. The EFA result showed that the variables of these 4 factors actually belonged to one factor.
7) Deletion of “I am curious to see the outcomes when I employ my learnt skills at work.”
Had high Modification Indices (MI) with variable “I am confident in my ability to use the new skills at work.” and had a value of standardized estimates lower than 0.7.
The path diagram of initial structure of the current evaluation tool and the structure after CFA
can be seen in in Appendix 1 and the comparison of model-fit and the validity between the initial
and new structure can be seen in Table 10. The result shows that the structure after CFA had
better fit and validity compared to the initial structure. The detail information of Validity
measurement can be found in Appendix 1. The validity measurement shows that the initial
structure was not valid, while the final structure fulfills all requirements to be valid. Even though
the improvement in fit value shows only small changes, but the final structure could provide
more parsimonious sets of variables while also make the model valid and reliable. Therefore,
the new structure was used as one of the references for designing the new evaluation tool.
Table 10 Fit Measurement of Current Evaluation Tool
Scale Description Initial Structure
Structure after CFA
CMIN/DF Normed Chi-square Good fit: ~ 1; Acceptable fit: 1-3 3.054 2.778
RMSEA ≤0.01 excellent, ≤0.05 good, ≤0.08 mediocre fit 0.064 0.059
CFI The closer to 1, the better fit CFI >.90 or 0.95: good fit
0.928 0.948
PNFI The closer to 1, the better fit 0.746 0.774
3.6 Defining the New Evaluation Tool Structure
The solution design step was done to define the structure of the new evaluation tool. To decide
on which variables were included in the evaluation tool, there were three criteria that the
researcher took into account. The first one was that the factors related to the variables were
included as the characteristics that affect learning and transfer of training by literature and/or
the interviewees. The second one was whether the variables are objectively related to the
training/development programs and are aspects that can be improved during the training
program. The evaluation tool should not measure the personal ability or behavior of the trainees
that they already had since before the training, but rather focused on the actual situation during
the training, so that the variables will be able to be analyzed to improve the training and
development programs at Vanderlande. The third one is the result from the Confirmatory Factor
Analysis (CFA) of the current evaluation tool. If the characteristics were part of the factors in
the current evaluation tool that was used by Vanderlande, then the variables that were chosen
were based on the CFA. Another thing that was taken into account was the opinion about the
variables from the Experts that were interviewed before, and the opinion of the researcher. Their
opinion was used when choosing variables for some of the factors, or also to add relevant

25
variables to some factors. The variables that were used were based on validated scales from
previous studies related to training and development. The next part will explain the chosen
factors to be put in the new evaluation tool and the variables that constructed the factors.
Table 11 Validated Scale for Evaluation Tool Design
Scale Literature reference Remarks
General Factors
Motivation to Learn (3 items)
Noe & Schmidt (1986) in Tharenou (2001) α=0.81
The new design of evaluation tool focused on the characteristics that are able to be changed during and after the training. Therefore, the trainee characteristics were not included in the initial design of new evaluation tool, except motivation to learn and motivation to transfer (for classroom training), as those characteristics were considered important by majority of the interviewees, recommended to be part of the evaluation tool, had validated variables that are related to the training programs rather than purely the trainee’s personality and were not similar to other characteristics.
Content relevance (2 items)
Giangreco et al (2009) in Radhakrishnan (2015)
Based on CFA Result α=0.939 (Relevance to Work)
Clear goals (2 items) Lee et al (1991) Based on CFA Result α=0.737
Classroom Training
Trainer knowledge & Experience (2 items)
Giangreco et al (2009) in Radhakrishnan (2015)
Based on CFA Result α=0.897 (Trainer Communication & Support)
Fellow Trainee communication & support (3 items)
Paechter (2010) and LTSI (2000) - CFA α = 0.783 (Practice & Feedback)
Feedback & Practice (3 items)
LTSI (2000) Due to different requirements of each intervention (e.g. the e-learning program is a program where the trainees do individual learning without a trainer), the Feedback & Practice scale was moved from the general factors to become part of the particular training interventions factor. Based on CFA Result α=0.783
Motivation to transfer (5 items)
LTSI (2000) Based on CFA Result α=0.939 (Relevance to Work)
Additional remarks regarding Classroom Training Factors:
Variables related to Interesting Lecture Method had been tested in the research by Radhakrishnan (2015) and was found to be a cross-loading variable. Therefore, this characteristic was excluded from the new design.
Variables related to Transfer Effort were similar to variables of Motivation to Transfer. Therefore, this characteristic was excluded.
E-Learning
Content quality (2 items)
Giangreco et al (2009) in Radhakrishnan (2015)
The variables were also based on CFA Result α=0.839 (Up-to-date Content)
Quality of Technical system (3 items)
Chiu (2007) α=0.9
The validated scale also included a variable related to Quality of user interface
Trainee control (3 items)
Paechter (2010)

26
Scale Literature reference Remarks
Coaching
Experience & competence of the Coach (2 items)
Giangreco et al (2009) in Radhakrishnan (2015)
Based on CFA Result α=0.897
Trust in Coach (3 items)
Gan & Chong (2013) α=0.92
Trust in coach and Coach commitment were not mentioned as the factors recommended to be put in the evaluation tool, but both HR Manager and TD Manager stated that Trust in coach and Coach commitment were important for mentoring & coaching programs. Therefore, the researcher decided to include these factors in the pilot study to see whether these actually affect learning and transfer of training at Vanderlande.
Coach Commitment (3 items)
Gan & Chong (2013) α=0.904
Feedback & Practice (4items)
LTSI (2000) The variables were adjusted by taking into account the opinion of the Talent Development Manager.
Peer Group Counseling
Trust to Peer (3 items)
Gan & Chong (2013) α=0.92
Feedback & Practice (5 items)
LTSI (2000)
Outdoor Program
Transfer Design (3 items)
LTSI (2000) α=0.85
Feedback & Practice (2 items)
LTSI (2000)
Business Case
Transfer Design (3 items)
LTSI (2000) α=0.85
Feedback & Practice (2 items)
LTSI (2000)
Fidelity (2 items) LTSI (2000) α=0.84
Transfer of Training
Opportunity to perform (3 items)
LTSI (2000) α=0.70
Supervisor support (5 items)
LTSI (2000) α=0.91 The factor Transfer Climate had a very similar scale to Supervisor Support and Peer Support, and thus was excluded from the new design.
Peer Support (3 items)
LTSI (2000) α=0.83
Outcome Constructs
Learning (2 items) Grohmann & Kauffeld (2013) α=0.91
Transfer of Training (2 items)
Grohmann & Kauffeld (2013) α=0.90 Xiao (1996) in Zumrah (2014)

27
CHAPTER 4
IMPLEMENTATION AND RESULT OF PILOT STUDY
The pilot study was done to answer research question 5: What is the most parsimonious
integrated training and development evaluation tool that is possible to be developed at
Vanderlande, taking into account the criteria for reliability, validity, and completeness? And
also to answer research question 6: Based on the collected data from the pilot study, which
factors affect the learning and transfer of training that happens due to training and development
program at Vanderlande? This chapter will explain the methods used to find the answer of those
research questions and the data result and analysis from the pilot study.
4.1 Research Methods to Implement and Evaluate Pilot Study
4.1.1 Intervention
To answer question 5 and 6, intervention step of the problem solving cycle was done by
executing a pilot study to check the evaluation tool. With respect to the time dimension, there
were three types of criteria in training evaluation based on Goldstein & Ford (2002): immediate
criteria for which measures are available during the training program, proximal criteria for
which measures can be obtained shortly after the training ends, and distal criteria for which
measures can only be obtained after providing some considerable time after training to allow
transfer of training. Due to time restrictions in this project, a longitudinal study to test the
evaluation tool in each of those three time dimensions was not possible. Therefore, a cross-
sectional study was used to carry out the pilot study, with data on all measures collected in the
same questionnaire.
4.1.1.1 Participants selection
The pilot survey for the current project was not only measuring the perceived learning and
transfer of training, but also the characteristics that are thought to affect the transfer of training.
Therefore, it was also important that the training and development period of the target was not
straying too far from the time when the target participants took part in the programs, but also
allowing some time for transfer of training to happen. Therefore, to compromise between the
participant’s memory of condition during the actual implementation of the program and to
allow some time for the on-the-job implementation to happen, the researcher targeted
participants of training and development programs that had finished in the first half of 2016.
The invitation to join the study was first sent to participants on July 11th, 2016 and participation
was opened for 3 weeks.
4.1.1.2 Operationalization of the pilot survey
During the first six months of 2016, seven types of training programs had been conducted with
different sets of interventions used to deliver the material. The total number of questions that
the participants needed to answer depended on the interventions used in the program they
followed.
28
The participants of the pilot study were asked to fill in ratings for variable items that were
related to the training and development interventions that they followed previously and to their
work environment. Furthermore, they were also asked to rate their perceived learning and
transfer of training performance after the programs ended. Matell & Jacoby (1971) stated that
optimal reliability is obtained with a 7-point scale, and therefore the rating scale used in the
pilot study was in the form of 7-point scale ranging from Strongly Disagree to Strongly Agree.
The pilot survey was implemented in an online system and the participants received the link to
the online survey in the personalized invitations that were sent by e-mail. Each of the seven
types of training and development program had its own link to the online survey. The variables
included in the survey were based on the variables mentioned in 3.5 with the addition of 3
general questions mandatory at Vanderlande:
1. Would you recommend this training program to your colleagues?
2. How would you rate this training program considering all its aspects? (Rating from 1-10)
3. Suggestions/ Further Remarks?
4.1.2 Evaluation
The final step was the evaluation step to answer research questions 5 and 6. In this step, the
data that are gathered from the pilot survey were analyzed statistically to define its validity and
reliability using multivariate analysis. Books by Hair Jr, et al. (2010) was the basis theory of the
statistical method in this research. In evaluating the data, first of all, the obtained data were
examined to exclude the missing data and outliers from the overall data set, and also to prevent
the violations of assumptions underlying the statistical technique. Then, confirmatory factor
analysis (CFA) and/or Exploratory Factor Analysis (EFA) was done to check whether the
structure among variables that was used matched the basic theory that was used to design the
questionnaire. The reliability of the scales was checked from the value of Cronbach’s Alpha (α)
for each factor. Measurements that were used in CFA was as explained in 3.2.2.
Furthermore, to answer research question 6, predictive validity was examined to test which
factors were the predictors of learning and/or transfer of training performance at Vanderlande.
For this part, correlation analysis and multiple regression analysis were done to analyze the
relationship of training & development intervention characteristics with learning and transfer
of training performance. Trainee characteristics, training design characteristics, and trainer
characteristics were included in the analysis related to learning performance, and work
environment characteristics were included in the analysis related to transfer of training
performance. The regression coefficients represent the type of relationship (negative or
positive) and the strength of the relationship with the learning and transfer of training
performance. Based on the regression coefficient, the researcher also did an analysis to define
the weight of each factor to construct the overall rate of the training or development program.
4.2 Data Result and Analysis
There were 298 employees participated in the pilot survey. During this period, personal
reminders were sent weekly via e-mail to participants who had not completed filling in the pilot

29
survey. From the gathered data, 259 responses were deemed to be complete and used further in
the analysis. The detail number of data used in the analysis is shown in Table 14.
Table 12 Number of Complete Data from Pilot Study
Training subject Number of complete surveys
Percentage of the total invited participants
Based on Whole Training/Development Program
Classroom Training 182 41%
E-learning 6 19%
Blended Classroom and E-Learning 25 63%
Personal Leadership (Classroom, Coaching, Peer group counseling, Outdoor training)
7 58%
Leadership I (Classroom, Coaching, Peer group counseling) 6 43%
Authentic leadership (Classroom, Peer group counseling, Outdoor training)
5 33%
Pit-Stop (Classroom, Business Case) 28 44%
Total 259 42%
Based on Questionnaire Section
General Factors 259
Classroom Intervention Factors 253
E-Learning Intervention Factors 31
Coaching Intervention Factors 13
Peer Group Counseling Intervention Factors 18
Outdoor Program Intervention Factors 12
Business Case Intervention Factors 28
Transfer of Training Factors 259
For further analysis, the overall responses were divided into some parts as shown in Table 14.
The first division was based on the questionnaire sections to define the final structure of the
recommended evaluation tool. The second one was based on the whole training program types
for measuring the effect of characteristics to the learning and transfer of training.
4.2.1 Confirmatory Factor Analysis (CFA) Based on Pilot Survey Data
The factor analysis was done for every set of Factors. It was not conducted for the whole
variables together due to the division of General Factors, Special Factors, and Transfer of
Training Factors. CFA was done for the General Factors, Classroom Training Factors, and
Transfer of Training Factors. The CFA process was carried out using SPSS AMOS, while the
accompanying EFA was done using SPSS. The full procedure will be explained for the CFA
of General Factors to show the exact analysis. The report for other CFA will only mention the
key outcomes of the process. The objective of this process was to find the most parsimonious
factor structures that could fulfill the validity and reliability requirements.
4.2.1.1 CFA of General Factors
The CFA for General Factors was done based on the data of 259 participants. The initial
variables and Factors used in the analysis are as follows:

30
Motivation to Learn 1. This training motivated me to learn as much as I can (MOT1) 2. This training made me willing to invest effort to improve job skills & competencies (MOT2) 3. Taking this training was a high priority for me (MOT3)
Content Relevance 4. This training program will enhance my career development. (RLV1) 5. The training program helped me identify how to build on my current knowledge and skills. (RLV2)
Clear Goals 6. I had specific, clear training goals to aim for during this training program. (GOAL1) 7. I knew which of the goals I wanted to accomplish were the most important (GOAL2)
Learning 8. After this training, I know substantially more about the training contents than before. (LEARN1) 9. I learned a lot of new things in the training (LEARN2)
From the initial structure, some changes were made in the model as explained in Table 13. The
changes include integration of two factors and removal of a variable.
Table 13 Changes in CFA General Factors
Changes Explanation
1) Integration of Content Relevance and Motivation to Learn into “Motivation and Relevance”
Constructs Content Relevance and Motivation to Learn did not achieve Discriminant validity, i.e. the constructs are not distinct enough from each other. To check whether the variables of these two factors belonged to the same construct, an EFA was done to the variables of these two constructs. The result showed that the variables of Content Relevance and Motivation to Learn belonged to one factor. Detail result of EFA is presented in Appendix A2.1.1
2) Removal of variable “Taking this training was a high priority for me” (MOT3)
Standardized loading estimate much lower than 0.7, (0.56)
The path diagram of the initial and final structure after CFA can be seen in Figure 5. The
standardized loading estimates of each variable are shown on the arrows from the factors. In
the path diagrams, it can be seen how the changes in the structure could affect the value of
factor loadings and correlation value between factors. For example, in the initial structure, there
was a high correlation of 0.86 between Motivation to Learn and Content Relevance, and in the
path diagram of the final structure, there was no more correlation above 0.8, and the
standardized loading estimates of the variables related to Motivation and Relevance changed.
From the fit measurements in Table 14, it can be seen that the final model has slightly better fit-
value than the initial model. However, the final model could fulfill the requirements of valid
and reliable model as shown in Table 15, while also contributed to shorten the number of
variables. The explanation of validity measurements in Table 15 was based on Table 16 and 17
which sequentially shows the value of measurements required for defining the validity of a
model as mentioned in Table 7. In Table 16, the value that did not fulfill the requirements are
noted by the yellow highlights.

31
Initial Model Final Model
Figure 5 Path Diagram of CFA General Factors
Table 14 Fit-measurement for General Factors
Scale Description Initial Final
CMIN/DF Normed Chi-square Good fit: ~ 1; Acceptable fit: 1-3 2.232 1.928
RMSEA ≤0.01 excellent, ≤0.05 good, ≤0.08 mediocre fit 0.069 0.060
CFI The closer to 1, the better fit CFI >.95: good fit
0.969 0.979
PNFI The closer to 1, the better fit 0.552 0.581

32
Table 15 Validity Measurements CFA General Factors
Convergent Validity, consists of:
Initial Model (Based on Figure 5 & Table 16)
Final Model (Based on Figure 5 & Table 17)
Standardized Loading Estimates: Ideally 0.7 or higher
Variables that have standardized loading less than 0.7 are MOT3 (0.56) and RLV2(0.69)
Variables that have standardized loading less than 0.7 RLV1 (0.69) and RLV2 (0.65) ~ approximately 0.7
AVE: Value for adequate convergent validity: 0.5 or higher
All constructs show adequate value of AVE for convergent validity
All constructs show adequate value of AVE for convergent validity
CR: Value for good reliability: 0.7 or higher
Motivation to Learn: 0.748 Clear Goals: 0.791 Content Relevance: 0.696 Learning: 0.773
Motivation & Relevance: 0.811 Clear Goals: 0.791 Learning: 0.773
Discriminant Validity, consists of:
AVE > MSV
AVEs of Motivation to learn and Content Relevance are less than their MSVs
All construct’s AVE are more than their MSV
AVE >ASV AVE of all constructs are more than their ASV
All construct’s AVE are more than their ASV
√𝐴𝑉𝐸 > inter-construct correlation.
√𝐴𝑉𝐸s of Motivation to learn and Content Relevance are lower than correlation between them
All construct’s √𝐴𝑉𝐸 are more than correlation between constructs.
Table 16 Validity & Reliability Measurement General Factors - Initial Model
Cronbach’s Alpha CR AVE MSV ASV
Clear Goals
Motivation to Learn
Content Relevance Learning
Clear Goals
0.791 0.791 0.655 0.218 0.153 0.809
Motivation to Learn
0.724 0.748 0.503 0.745 0.476 0.467 0.709
Content Relevance
0.694 0.696 0.534 0.745 0.452 0.345 0.863 0.731
Learning 0.772 0.773 0.630 0.493 0.360 0.348 0.682 0.702 0.794
Table 17 Validity & Reliability Measurement General Factors - Final Model
Cronbach’s Alpha CR AVE MSV ASV
Clear Goals
Motivation & Relevance Learning
Clear Goals 0.791 0.791 0.655 0.169 0.336 0.809
Motivation & Relevance
0.810 0.811 0.519 0.503 0.145 0.411 0.720
Learning 0.772 0.773 0.631 0.503 0.311 0.348 0.709 0.794
Color code:
Green: Correlation between constructs (factors) ; Blue: Square root of AVE (√𝐴𝑉𝐸)

33
The final structure of the General Factors consists of the below factors and variables:
Motivation & Relevance 1. This training motivated me to learn as much as I can 2. This training made me willing to invest effort to improve job skills & competencies 3. This training program will enhance my career development. 4. The training program helped me identify how to build on my current knowledge and skills.
Clear Goals 5. I had specific, clear training goals to aim for during this training program. 6. I knew which of the goals I wanted to accomplish were the most important
Learning 7. After this training, I know substantially more about the training contents than before. 8. I learned a lot of new things in the training
4.2.1.2 CFA of Classroom Intervention Factors
The CFA for Classroom Intervention Factors was done based on the data of 253 participants.
The initial variables and variables after CFA are shown in Table 18.
Table 18 Initial and Final Structure CFA Classroom Training
Initial Structure Remarks Structure after CFA
Trainer Knowledge & Experience (α=0.923) 1. The trainer had sufficient
experience with the topics covered during the training (TRAIN1)
2. The trainer had sufficient knowledge about the topics covered during the training. (TRAIN2)
Stay as initial structure.
Trainer Knowledge & Experience (α=0.923) 1. The trainer had sufficient
experience with the topics covered during the training (TRAIN1)
2. The trainer had sufficient knowledge about the topics covered during the training. (TRAIN2)
Fellow Trainee Support (α=0.668) 3. I could exchange knowledge easily
and quickly with other course participants (FELLOW1)
4. Learning in groups and cooperation with other trainees were fostered in the course (e.g., by group activities, discussions etc.) (FELLOW2)
5. During the training, I got feedback from other training participants about the way I was applying the new knowledge and skills. (FELLOW3)
Item no. 3 was removed, and the other items were integrated into “Support, Feedback & Practice”
Support, Feedback & Practice (α=0.838) 3. Learning in groups and
cooperation with other trainees were fostered in the course (e.g., by group activities, discussions etc.) (FELLOW2)
4. During the training, I got feedback from other training participants about the way I was applying the new knowledge and skills. (FELLOW3)
5. During the training, I got feedback from the trainer about the way I was applying the new knowledge and skills (FEEDPRA1)
6. There were sufficient exercises during the training to properly understand how I must apply the learned knowledge and skills into practice. (FEEDPRA2)
Feedback & Practice (α=0.377) 6. During the training, I got feedback
from the trainer about the way I was applying the new knowledge and skills (FEEDPRA1)
7. There were sufficient exercises during the training to properly understand how I must apply the learned knowledge and skills into practice. (FEEDPRA2)
Item no. 8 was removed, and the other items were integrated into “Support, Feedback & Practice”

34
Initial Structure Remarks Structure after CFA
8. The trainer(s) used lots of examples that showed me how I could use my learning on the job (FEEDPRA3)
Motivation to Transfer (α=0.896) 9. I am happy to try out the skills that
I have learnt at the training program (MTRANS1)
10. I am confident in my ability to use the new skills at work. (MTRANS2)
11. My training performance will have a direct impact on my results at my job. (MTRANS3)
12. This training program will increase my personal productivity. (MTRANS4)
13. I believe that this training program will help me do my current job better. (MTRANS5)
Item no. 10 was removed, and the other items stayed in this factor.
Motivation to Transfer (α=0.897) 7. I am happy to try out the skills
that I have learnt at the training program (MTRANS1)
8. My training performance will have a direct impact on my results at my job. (MTRANS3)
9. This training program will increase my personal productivity. (MTRANS4)
10. I believe that this training program will help me do my current job better. (MTRANS5)
From the initial structure, some changes were made in the model as explained in Table 19. The
changes were made through four models to increase the model-fit and validity of the construct.
Table 19 Changes in CFA Classroom Intervention Factors
Changes Explanation
1) Integration of Feedback & Practice and Fellow Trainee Support
The constructs Feedback & Practice and Fellow Trainee Support did not achieve sufficient discriminant validity. An EFA was done to the variables of these two constructs. The result showed that the variables of Feedback & Practice and Fellow Trainee Support belonged to one factor. Detailed results of EFA are presented in Appendix A2.1.4
2) Removal of variable “I could exchange knowledge easily and quickly with other course participants” (FELLOW1)
Has cross loading value Based on EFA in Appendix A2.1.4
3) Removal of variable “The trainer(s) used lots of examples that showed me how I could use my learning on the job” (FEEDPRA3)
Based on EFA it belongs to its own factor. But since it is not possible to have only one item in a latent construct (factor), FEEDPRA3 was also removed from the structure.
4) Removal of variable “I am confident in my ability to use the new skills at work” (MTRANS2)
Has standardized loading estimates less than 0.7 and less related to the context of motivation. More related to self-efficacy. Variable related to self-efficacy also has been represented by MTRANS1 which was not overpowered by the other variables
Table 20 Fit-measurement for Classroom Intervention Factors
Scale Description Initial Model
Final Model
CMIN/DF Normed Chi-square Good fit: ~ 1; Acceptable fit: 1-3 1.957 1.741
RMSEA ≤0.01 excellent, ≤0.05 good, ≤0.08 mediocre fit 0.062 0.054
CFI The closer to 1, the better fit CFI >.95: good fit
0.966 0.983
PNFI The closer to 1, the better fit 0.718 0.706

35
The result in Table 20 shows that the final model had better fit-value except for PNFI. Based on
Hair Jr, et al (2010), simpler model (i.e. model with fewer number of parameters to estimate) is
expected to have higher PNFI, but in this case, the PNFI of the final model was slightly lower
than the initial structure. The researcher considered that this may happen due to the integration
of the variables of two factors that had low reliability (Cronbach Alpha’s value) into one factor,
thus increasing the complexity of the new integrated factor as part of the final model. This may
also happen because the final model had low degrees of freedom (df), because PNFI value was
measured by using the ratio of df used by a model to the total available df. In the CFA of General
Factors and Transfer of Training Factors, the final structure also had lower df compared to the
initial model, but the difference was small. In the final model of Classroom Training Factors,
the df was reduced almost half from the initial model. However, the value of PNFI still fulfills
the minimum acceptable value of 0.5 (Chen, Yen, & Hwang, 2012). The final model increased
the Cronbach Alpha’s value for every constructs to become acceptable. The validity test of the
initial and final model in Appendix 2 showed that the final model improved the model by
changing the non-valid model to become a valid model as it fulfills all validity requirements.
The final structure also succeeded in removing three variables.
4.2.1.3 CFA of Transfer of Training Factors
The CFA for Transfer of Training Factors was done based on the data of 259 participants. The
initial variables and variables after CFA are shown in Table 21.
Table 21 Initial and Final Structure CFA Transfer of Training Factors
Initial Structure Remark Structure after CFA
Opportunity to perform (α=0.736) 1. I got opportunities to use this training
in my job (OPPOR1) 2. I had access to the resources I need to
apply the training. (OPPOR2) 3. There are sufficient resources available
to allow me to use the skills that I acquired in training (OPPOR3)
Item no. 1 was moved to “Opportunity and Implementation of Transfer”
Transfer Resource Availability (α=0.770) 1. I had access to the resources I need
to apply the training. (OPPOR2) 2. There are sufficient resources
available to allow me to use the skills that I acquired in training (OPPOR3)
Supervisor support (α=0.925) 4. My supervisor met me to discuss ways
to apply training on the job (SPV1) 5. My supervisor met me regularly to
work on problems I may be having in trying to use my training. (SPV2)
6. My supervisor set goals for me that encourage me to apply my training on the job. (SPV3)
7. My supervisor let me know I am doing a good job when I use my training. (SPV4)
8. My supervisor helped me to set realistic goals for my work performance based on my training (SPV5)
Stay as initial structure.
Supervisor support (α=0.925) 3. My supervisor met me to discuss
ways to apply training on the job (SPV1)
4. My supervisor met me regularly to work on problems I may be having in trying to use my training. (SPV2)
5. My supervisor set goals for me that encourage me to apply my training on the job. (SPV3)
6. My supervisor let me know I am doing a good job when I use my training. (SPV4)
7. My supervisor helped me to set realistic goals for my work performance based on my training (SPV5)

36
Colleague Support (α=0.828) 9. My colleagues appreciate me using
new skills I have learned in training (CLG1)
10. My colleagues encourage me to use the skills I have learned in training (CLG2)
11. My colleagues are patient with me when I try out new skills or techniques at work. (CLG3)
Item 11 was removed.
Colleague Support (α=0.864) 8. My colleagues appreciate me using
new skills I have learned in training (CLG1)
9. My colleagues encourage me to use the skills I have learned in training (CLG2)
Transfer of training (α=0.919) 12. I successfully manage to apply the
training contents in my everyday work (TOT1)
13. In my everyday work, I often use the knowledge I gained in the training. (TOT2)
14. I can accomplish the job tasks better using new knowledge and skills acquired from the training course. (TOT3
Item “I got opportunities to use this training in my job” from previously factor Opportunity to Perform was added.
Opportunity & Implementation of Transfer (α=0.905) 10. I got opportunities to use this
training in my job (OPPOR1) 11. I successfully manage to apply the
training contents in my everyday work (TOT1)
12. In my everyday work, I often use the knowledge I gained in the training. (TOT2)
13. I can accomplish the job tasks better using new knowledge and skills acquired from the training course. (TOT3
From the initial structure, some final changes were made in the model as explained in Table
22. The changes were made through five models to increase the model-fit and validity of the
construct. Table 22 Changes in CFA Transfer of Training Factors
Changes Explanation
1) Integration of Opportunity to Perform and Transfer of Training
Constructs Opportunity to Perform and Transfer of Training did not achieve sufficient Discriminant validity. The result of an EFA showed that variable OPPOR1 and variables of Transfer of Training belonged to one factor. Detailed results of EFA are presented in Appendix A2.1.7
2) Removal of variable “My colleagues are patient with me when I try out new skills or techniques at work.” (CLG3)
Has standardized loading estimates less than 0.7
Table 23 Fit-measurement for Transfer of Training Factors
Scale Description Initial Model Final Model
CMIN/DF Acceptable fit: 1-3 3.080 2.521
RMSEA ≤0.01excellent, ≤0.05 good, ≤0.08 mediocre fit 0.090 0.077
CFI CFI >.95: good fit 0.943 0.964
PNFI The closer to 1, the better fit 0.716 0.712
The result in Table 23 shows that the final model had slightly better fit value compared to the
initial model. The bigger improvement that the final model had was that it fulfilled all the
validity requirements as mentioned in Appendix 2, while the initial model was lacking in
convergent and discriminant validity. The reliability of the factors in the final model which was
shown by the Cronbach Alpha’s values were acceptable, while also succeeded in removing one
variable from the structure.

37
4.2.2 Exploratory Factor Analysis (EFA) Based on Pilot Survey Data
There were only 31 and 28 responses for E-learning Factors and Business Case Factors. CFA
should be done to the whole structure to see all the correlations and fit of the whole model. CFA
also could not show which variables are cross-loading to determine the structure. Therefore,
EFA was done for E-learning Factors and Business Case Factors. Based on Hair Jr. et al. (2010),
the general rule for number of sample size required for a Factor Analysis is at least five times
the number of variables to be analyzed. So, in E-learning factors and Business Case Factors, the
EFA was done per two factors.
4.2.2.1 EFA of E-learning Factors
The EFA was done based on 31 cases, with the initial and final structures shown in Table 24
Table 24 Initial and Final Structure EFA E-learning Factors
Initial Structure Remark Structure After EFA
Content Quality (α=0.697) 1. The content of the training
program was up-to-date. (CQUAL1)
2. The equipment/training material used in this training was up-to-date (CQUAL2)
Addition of variable “The user interface (e.g., navigation, layout, font style and color) of the e-learning site is well designed”
Content Quality (α=0.744) 1. The content of the training program
was up-to-date. (CQUAL1) 2. The equipment/training material
used in this training was up-to-date (CQUAL2)
3. The user interface (e.g., navigation, layout, font style and color) of the e-learning site is well designed (TECH1)
Technical System Quality (α=0.578) 3. The user interface (e.g., navigation,
layout, font style and color) of the e-learning site is well designed (TECH1)
4. The e-learning site could quickly load all the texts and graphics/videos (TECH2)
5. The e-learning site functioned well all the time (TECH3)
Item 3 was moved to Content Quality
Technical System Quality (α=0.804) 4. The e-learning site could quickly
load all the texts and graphics/videos (TECH2)
5. The e-learning site functioned well all the time (TECH3)
Trainee’s control (α=772) 6. The e-learning program let me
decide on my own at what times and where I am learning (e.g., at the office, at home) (CONTROL1)
7. The e-learning program let me decide on my own about the pace of learning and the use of learning strategies (CONTROL2)
8. The e-learning offered opportunities to increase my knowledge and to monitor my success (e.g., via tests, exercise) (CONTROL3)
Stay as initial structure
Trainee’s control (α=772) 6. The e-learning program let me
decide on my own at what times and where I am learning (e.g., at the office, at home) (CONTROL1)
7. The e-learning program let me decide on my own about the pace of learning and the use of learning strategies (CONTROL2)
8. The e-learning offered opportunities to increase my knowledge and to monitor my success (e.g., via tests, exercise) (CONTROL3)

38
EFA Content Quality and Technical System Quality
Variables
Factor Loadings
Content Quality
Technical System Quality
1) The content of the training program was up-to-date .923
2) The equipment/training material used in this training was up-to-date .714
3) The user interface (e.g., navigation, layout, font style and color) of the e-learning site is well designed
.822
4)The e-learning site could quickly load all the texts and graphics/videos .872
5)The e-learning site functioned well all the time .948
KMO and Bartlett's Test Remarks
Kaiser-Meyer-Olkin Measure of Sampling Adequacy. .506 Above 0.5
Bartlett's Test of Sphericity Sig. .000 Significant
EFA Content Quality and Trainee’s control
Variables
Factor Loadings
Trainee’s Control
Content Quality
1) The content of the training program was up-to-date .788
2) The equipment/training material used in this training was up-to-date .954
3) The e-learning program let me decide on my own at what times and where I am learning (e.g., at the office, at home)
.686
4) The e-learning program let me decide on my own about the pace of learning and the use of learning strategies
.953
5) The e-learning offered opportunities to increase my knowledge and to monitor my success (e.g., via tests, exercise)
.823
KMO and Bartlett's Test Remarks
Kaiser-Meyer-Olkin Measure of Sampling Adequacy. .626 Above 0.5
Bartlett's Test of Sphericity Sig. .000 Significant
EFA Technical System Quality and Trainee’s control
Factor Loadings
Trainee’s Control
Technical System Quality
1) The e-learning program let me decide on my own at what times and where I am learning (e.g., at the office, at home)
.655
2) The e-learning program let me decide on my own about the pace of learning and the use of learning strategies
.823
3) The e-learning offered opportunities to increase my knowledge and to monitor my success (e.g., via tests, exercise)
.904
4) The user interface (e.g., navigation, layout, font style and color) of the e-learning site is well designed
.697
5)The e-learning site could quickly load all the texts and graphics/videos .923
6)The e-learning site functioned well all the time .900
KMO and Bartlett's Test Remarks
Kaiser-Meyer-Olkin Measure of Sampling Adequacy. .592 Above 0.5
Bartlett's Test of Sphericity Sig. .000 Significant

39
From the results, it can be seen that variable “The user interface (e.g., navigation, layout, font
style and color) of the e-learning site is well designed” (TECH1) loaded in Trainee’s control and
Content Quality rather than on Technical System Quality. Therefore, TECH1 is a potential
candidate to be restructured. Moving TECH1 from Technical System Quality to Content Quality
where it had the highest loading value increased the reliability of both constructs. In terms of
content, the researcher also considered that the context of TECH1 was more matched to Content
Quality than Trainee’s Control.
4.2.2.2 EFA of Business Case Factors
The EFA was done based on 28 cases. The process was similar to the EFA in 4.2.2.1. The initial
and final structure are as follow:
Initial Structure Remarks Structure after CFA
Transfer design (α=0.828) 1. The activities and exercises
the trainers used helped me to know how to apply my learning on the job (TDESIGNB1)
2. It is clear to me that the people conducting the training understand how I will use what I learn. (TDESIGNB2)
3. The way the trainer(s) taught the material made me feel more confident I could apply it. (TDESIGNB3)
Integrated with Fidelity to become “Fidelity of Design”
Fidelity of Design (α=0.850) 1. The activities and exercises
the trainers used helped me to know how to apply my learning on the job (TDESIGNB1)
2. It is clear to me that the people conducting the training understand how I will use what I learn. (TDESIGNB2)
3. The way the trainer(s) taught the material made me feel more confident I could apply it. (TDESIGNB3)
4. The methods used in training are very similar to how we do it on the job (FIDEL1)
5. The situations used in training are very similar to those I encounter on my job (FIDEL2)
Fidelity (α=0.787) 4. The methods used in training
are very similar to how we do it on the job (FIDEL1)
5. The situations used in training are very similar to those I encounter on my job (FIDEL2)
Feedback & Practice (α=0.190) 6. During the training, I got
feedback from the trainer about the way I was applying the new knowledge and skills (FPBUSS1)
7. The trainer(s) used lots of examples that showed me how I could use my learning on the job (FPBUSS2)
Feedback & Practice (α=0.190) 6. During the training, I got
feedback from the trainer about the way I was applying the new knowledge and skills (FPBUSS1)
7. The trainer(s) used lots of examples that showed me how I could use my learning on the job (FPBUSS2)
From the EFA result, it was found that Transfer design and Fidelity belonged to 1 factor. Then
the possible modification for this construct was to merge Transfer Design and Fidelity into one
factor. Looking at the content of those two factors, the researcher considered that the variables
are all related to how the design of the training program can give insights to the participants

40
about the implementation of the knowledge to the job. Therefore, the variables of Transfer
Design and Fidelity was recommended to be integrated to one factor “Fidelity of Design”.
Feedback & Practice had a very low Cronbach’s alpha of 0.190, but was not cross-loading to any
other factors. Following the result from Classroom Training’s CFA, removal of FPBUSS2 was also
a candidate for modification. However, a construct can not only consist of 1 variable. Therefore,
a modification or development of new variables to construct Feedback & Practice can also be
another option to do in future research. Since there were only limited data available for this
analysis, it will be better to do re-analysis when more sufficient data are available.
4.2.3 Sets of Factors and Variables Without Factor Analysis
Interventions Coaching, Outdoor Program, and Peer Group Counseling did not have enough
data to enable Factor Analysis (number of responses respectively: 13, 12, 18). Thus, until more
data become available, the final structure of those factors would follow its initial structure based
on Literature Review and Interviews as follows:
Coaching Intervention Factors Coach Support 1. The coach had sufficient experience with the topics covered during the mentoring/coaching process. (COACH1) 2. The coach had sufficient knowledge about the topics covered during the mentoring/coaching process. (COACH2)
Trust to coach 3. I believed my coach would keep what we discuss in the strictest confidence (TRUSTC1) 4. I trusted my coach (TRUSTC2) 5. Open and honest communication was emphasized between my coach and me (TRUSTC3)
Coach commitment 6. My coach was dedicated to perform the coaching process (COMMIT1) 7. My coach was fully present for each coaching session (COMMIT2) 8. My coach was fully engaged in the coaching assignment (COMMIT3)
Feedback & Practice 9. During the coaching, I got feedback from the coach about the way I was applying the new knowledge and skills (FPCOACH1) 10. My coach used lots of examples that showed me how I could use my learning on the job (FPCOACH2) 11. My coach helped me to improve my effectiveness in daily practice (FPCOACH3) 12. My coach stimulated my learning process. (FPCOACH4)
Outdoor Program Intervention Factors Transfer design 1. The activities and exercises the trainers used helped me to know how to apply my learning on the job (TDESIGN1) 2. It is clear to me that the people conducting the training understand how I will use what I learn. (TDESIGN2) 3. The way the trainer(s) taught the material made me feel more confident I could apply it. (TDESIGN3) Feedback & Practice 4. During the training, I got feedback from the trainer about the way I was applying the new knowledge and skills (FPOUT1) 5. The trainer(s) used lots of examples that showed me how I could use my learning on the job (FPOUT2)

41
Peer Group Counseling Intervention Factors Trust to peer 1. I believed my peer group member(s) would keep what we discuss in the strictest confidence (TRUSTP1) 2. I trusted my peer group member(s) (TRUSTP2) 3. Open and honest communication was emphasized between my peer group member(s) and me (TRUSTP3)
Feedback & Practice 4. During the training, I got feedback from my peer group member(s) about the way I was applying the new knowledge and skills (FPPEER1) 5. My peer group member(s) helped me to improve my effectiveness in daily practice. (FPPEER2) 6. My peer group member(s) stimulated my learning process. (FPPEER3) 7. My peer group member(s) used lots of examples that showed me how I could use my learning on the job. (FPPEER4) 8. During the training, I got feedback from the trainer about the way I was applying the new knowledge and skills (FPPEER5)
4.3 Predictive Validity Analysis This section described the result of multiple regression analysis for Classroom Training, Blended
Learning, and Pit-Stop Development Program. This part serves as the answer of Research
Question no. 6. The multiple regression was done for three programs that were considered to
have quite sufficient data to be analyzed (number of responses respectively: 182, 25, 28).
4.3.1 Classroom Training Analysis
Three Dependent Variables (DVs) that were analyzed: Rate (“How would you rate this training
program considering all its aspects?”), Learning, and Opportunity and Implementation of
Transfer. The independent variables (IVs) that were included for each dependent variable based
on previous studies. The IVs for Rate were similar to the variables used in regression analysis
for DV Rate in the research by Radhakrishnan (2015). Based on Literature review by Priyananda
(2016), the factors that relate to Learning were only Trainer Knowledge & Experience and
Support, Feedback & Practice. However, the other factors that were also used as IVs in
measuring Rate were also included to see whether there was relation between Learning and all
factors that are related to the situation during the training and development programs. Based
on Holton (1996), Learning (Level 2 of Kirkpatrick) is the antecedent of Motivation to Transfer,
therefore, Motivation to Transfer is excluded from the IVs of Rate (Level 1 of Kirkpatrick) and
Learning, but will be included for predicting Opportunity and Implementation of Transfer
(Level 3 Kirkpatrick). For Opportunity and Implementation of Transfer of Training, all factors
were included.
Table 25 Dependent and Independent Variables for Classroom Training
Dependent Variable Independent Variables
Rate (Level 1 Kirkpatrick) Motivation & Relevance; Clear Goals; Trainer Knowledge & Experience; Support, Feedback & Practice;
Learn (Level 2 Kirkpatrick) Motivation & Relevance; Clear Goals; Trainer Knowledge & Experience; Support, Feedback & Practice;
Opportunity and Implementation of Transfer (Level 3 Kirkpatrick)
Motivation & Relevance; Clear Goals; Trainer Knowledge & Experience; Support, Feedback & Practice; Motivation to Transfer; Learning; Transfer Resource Availability; Supervisor Support; Peer Support

42
Before starting the multiple regression analysis, an EFA was done to the variables of outcome
construct Learning and Opportunity & Implementation of Transfer. The result showed that
those variables were indeed belonged to 2 different construct: 1) Learning and 2) Opportunity
and Implementation of Transfer of Training. The details can be seen in Appendix A3.1. The
multiple regression will be divided into two sections, for hard and soft skill programs.
4.3.1.1 Analysis for Hard Skill Classroom Training Program
A correlation analysis was first done with the result shown in Table 26. The result showed
significant correlation for almost all variables, and all Independent Variables had significant
correlations to the three Dependent Variables. The Cronbach Alpha’s value also showed that all
variables were reliable with all value higher than 0.6.
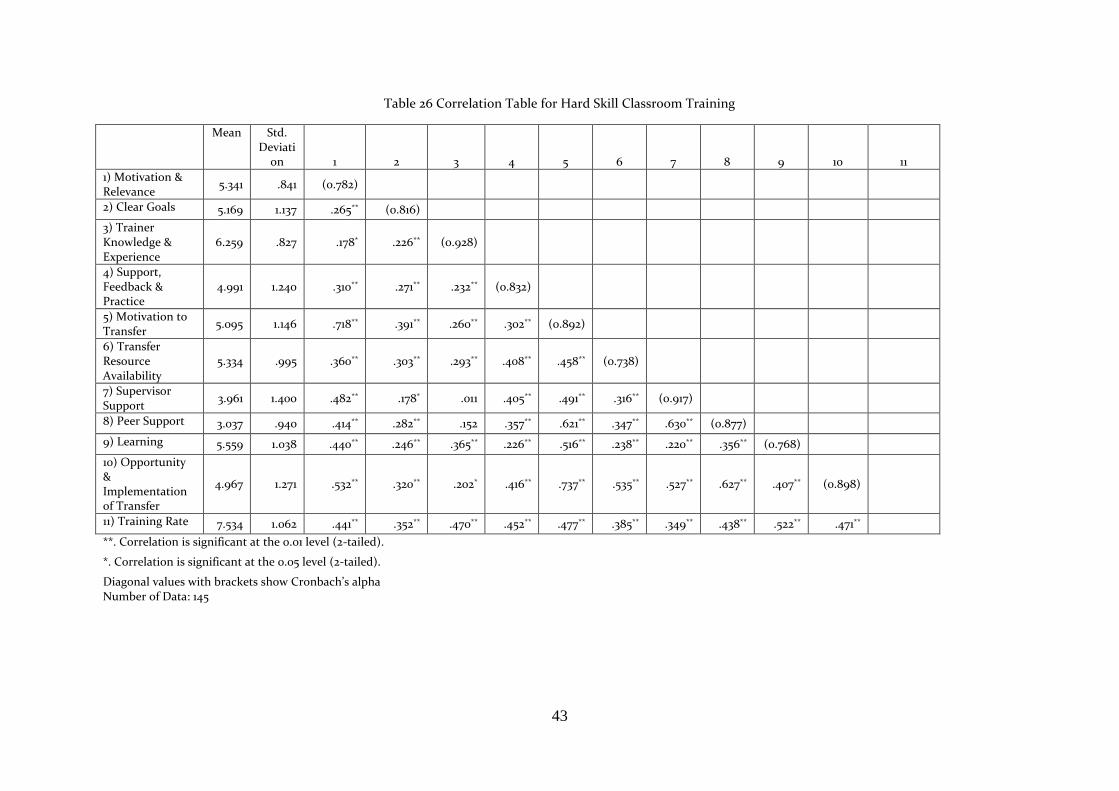
43
Table 26 Correlation Table for Hard Skill Classroom Training
Mean Std. Deviati
on 1 2 3 4 5 6 7 8 9 10 11
1) Motivation & Relevance
5.341 .841 (0.782)
2) Clear Goals 5.169 1.137 .265** (0.816)
3) Trainer Knowledge & Experience
6.259 .827 .178* .226** (0.928)
4) Support, Feedback & Practice
4.991 1.240 .310** .271** .232** (0.832)
5) Motivation to Transfer
5.095 1.146 .718** .391** .260** .302** (0.892)
6) Transfer Resource Availability
5.334 .995 .360** .303** .293** .408** .458** (0.738)
7) Supervisor Support
3.961 1.400 .482** .178* .011 .405** .491** .316** (0.917)
8) Peer Support 3.037 .940 .414** .282** .152 .357** .621** .347** .630** (0.877)
9) Learning 5.559 1.038 .440** .246** .365** .226** .516** .238** .220** .356** (0.768)
10) Opportunity & Implementation of Transfer
4.967 1.271 .532** .320** .202* .416** .737** .535** .527** .627** .407** (0.898)
11) Training Rate 7.534 1.062 .441** .352** .470** .452** .477** .385** .349** .438** .522** .471**
**. Correlation is significant at the 0.01 level (2-tailed).
*. Correlation is significant at the 0.05 level (2-tailed).
Diagonal values with brackets show Cronbach’s alpha Number of Data: 145

44
After the correlation analysis, multiple regression analysis was done based on 145 complete data.
Table 27 Multiple Regression Hard Skill Classroom Training - DV: Rate
Unstandardized
Coefficients
Standardized
Coefficients Sig.
Collinearity
Statistics
B
Std.
Error Beta
Tolerance VIF
(Constant) 1.612 .605 .009
1) Motivation & Relevance .298** .090 .236** .001 .764 1.308
2) Clear Goals .163** .062 .174** .010 .887 1.127
3) Trainer Knowledge & Experience .392** .088 .305** .000 .833 1.200
4) Support, Feedback & Practice .208** .063 .243** .001 .730 1.369
R2 value :45% ; Note: ** for p<0.01; * for p<0.05
Table 28 Multiple Regression Hard Skill Classroom Training - DV: Learning
Unstandardized
Coefficients
Standardized
Coefficients Sig.
Collinearity
Statistics
B
Std.
Error Beta
Tolerance VIF
(Constant) .155 .631 .806
1) Motivation & Relevance .579** .094 .469** .000 .764 1.308
2) Clear Goals .072 .065 .079 .270 .887 1.127
3) Trainer Knowledge & Experience .336** .092 .268** .000 .833 1.200
4) Support, Feedback & Practice -.033 .065 -.040 .612 .730 1.369
R2 value: 37.5% ; Note: ** for p<0.01; * for p<0.05
Table 29 Multiple Regression Hard Skill Classroom Training - DV: OIT
Unstandardized
Coefficients
Standardized
Coefficients Sig.
Collinearity
Statistics
B
Std.
Error Beta
Tolerance VIF
(Constant) .138 .540 .798
1) Motivation & Relevance -.061 .113 -.040 .592 .369 2.708
2) Clear Goals -.085 .058 -.076 .148 .764 1.309
3) Trainer Knowledge & Experience -.099 .084 -.064 .243 .690 1.449
4) Support, Feedback & Practice .078 .060 .076 .195 .612 1.635
5) Motivation to Transfer .730** .097 .658** .000 .269 3.716
6) Learning -.017 .076 -.014 .821 .535 1.869
7) Transfer Resource Availability .264** .072 .207** .000 .663 1.509
8) Supervisor Support .059 .060 .065 .327 .481 2.078
9) Peer Support .184* .093 .136* .050 .436 2.292
R2 value: 72% ; Note: ** for p<0.01; * for p<0.05
From the above result, it can be seen that all four variables had significant regression effects on
Rate, together explained 45% of the variance. Motivation & Relevance and Trainer Knowledge
& Experience had a significant effect on Learning, explaining 37.5% of the variance.

45
Furthermore, Opportunity and Implementation of Transfer (OIT) was only significantly
affected by Motivation to Transfer and the work environment factors Transfer Resource
Availability and Peer Support. Motivation to Transfer had a very high value of regression
coefficient, however, its VIF value was also quite high (3.716). Variance Inflation Factor (VIF) is
a coefficient that shows how severe the multicollinearity in the model. The high value of VIF of
Motivation to Transfer showed that it is highly correlated with other independent variables.
Based on literature study by Burke & Hutchins (2007), Motivation to transfer was a significant
predictor of positive transfer of training, and was influenced by motivation to learn, self-efficacy,
utility reaction, and transfer climate (work environment characteristics). Given this concept, it
was decided to test whether there was a mediation effect of Motivation to Transfer between the
relation of other factors and OIT. A mediation effect happens when a third construct (factor)
intervenes between the IV and DV (Hair et.al., 2010). This effect will create an indirect effect
(shown by arrow a and b in Figure 6) as an addition to direct effect (arrow c’ in Figure 6).
The mediation effect was then tested using PROCESS add-ins by Hayes (2016). The illustration
of the mediation effect can be seen in Figure 6. The result showed that Motivation to Transfer
was indeed a mediator between other IVs to DV Opportunity and Implementation of Transfer.
It had partial mediation effects (i.e. the case when direct effect is reduced after addition of
mediator) for IV Supervisor Support, Peer Support, Transfer Resource Availability, and Support,
Feedback & Practice. The complete mediation effects (i.e. the case when direct effect no longer
available after addition of mediator) applied to Motivation & Relevance, Clear Goals, Learning,
and Trainer Knowledge & Experience. The complete mediation results can be seen in Appendix
A3.2. Due to the emergence of Motivation to transfer as mediator, another regression analysis
between IVs to OIT was done by excluding Motivation to Transfer, and the summary result can
be seen in Table 29.
X:Motivation & RelevanceClear GoalsTrainer Knowledge & ExperienceSupport, Feedback & Practice LearningTransfer Resource Availability Supervisor Support Peer Support
Y:Opportunity and
Implementation of Transfer
M:Motivation To Transfer
ab
c'
Figure 6 Mediation of Motivation to Transfer in Hard Skill Classroom Training
Table 29 summarized the factors that were significantly related to the dependent variables.
There are four types of regression effects that are mentioned in Table 29: direct effects of IVs to
Rate, direct effects of IVs to Learn, direct effects of IVs to Opportunity and Implementation of
Transfer (OIT), and the total effect of each IV to OIT via mediation of Motivation to Transfer
(Total effect = direct effect (c’) + mediation effect (ab)). The total effects via mediation was taken
from a mediation analysis which included only one IV, one DV, and one Mediator because the
mediation effect could only be measured for every single IV. The mediation analysis was done
one by one to each IVs. Figure 7 illustrates the above regression effects scheme.

46
Rate
Learning
Motivation to Transfer (MTT)
Opportunity and Implementation of
Transfer (OIT)
Total Effect of GSF, WEF, and Learning to OIT via MTT
mediation
Direct Effect of GSF (Except MTT) to Rate
General and Special Factors
(GSF)
Work Environment
Factors (WEF)
Direct Effect of GSF (Except MTT) to Learning
Direct Effect of GSF (Except MTT), WEF, and
Learning to OIT
Figure 7 Regression Effects
Summary of factors significantly related to Dependent variables:
Table 30 Summary Significant Factors of Hard Skill Classroom Training
Dependent Variable Significant Independent
Variable(s)
B
Direct effect to Rate 1) Motivation & Relevance 0.298
2) Clear Goals 0.163
3) Trainer Knowledge & Experience 0.392
4) Support, Feedback, & Practice 0.208
Direct effect to Learn 1) Motivation & Relevance 0.579
2) Trainer Knowledge & Experience 0.336
Direct effect to OIT 1) Motivation & Relevance 0.387
2) Transfer Resource Availability 0.327
3) Peer Support 0.420
Total Effect to OIT through Mediation
via Motivation to Transfer
1) Motivation & Relevance 0.935
2) Clear Goals 0.356
3) Trainer Knowledge & Experience 0.299
4) Support, Feedback & Practice 0.401
6) Learning 0.569
7) Transfer Resource Availability 0.415
8) Supervisor Support 0.522
9) Peer Support 0.870
To define the weighted overall training program rating, below is the proposed structure:
The factors that would be included here were the factors that related directly to training
program implementation in General Factors and Classroom Training Factors which excluded
variables from Transfer of Training Factors. For the Transfer of Training Factors, the researcher
recommended to see the average score of each factor to analyze which factors should be
improved. Factor Motivation to Transfer was also excluded because it was a mediating variable
which shows that this factor was a result from other factors rather than something that related
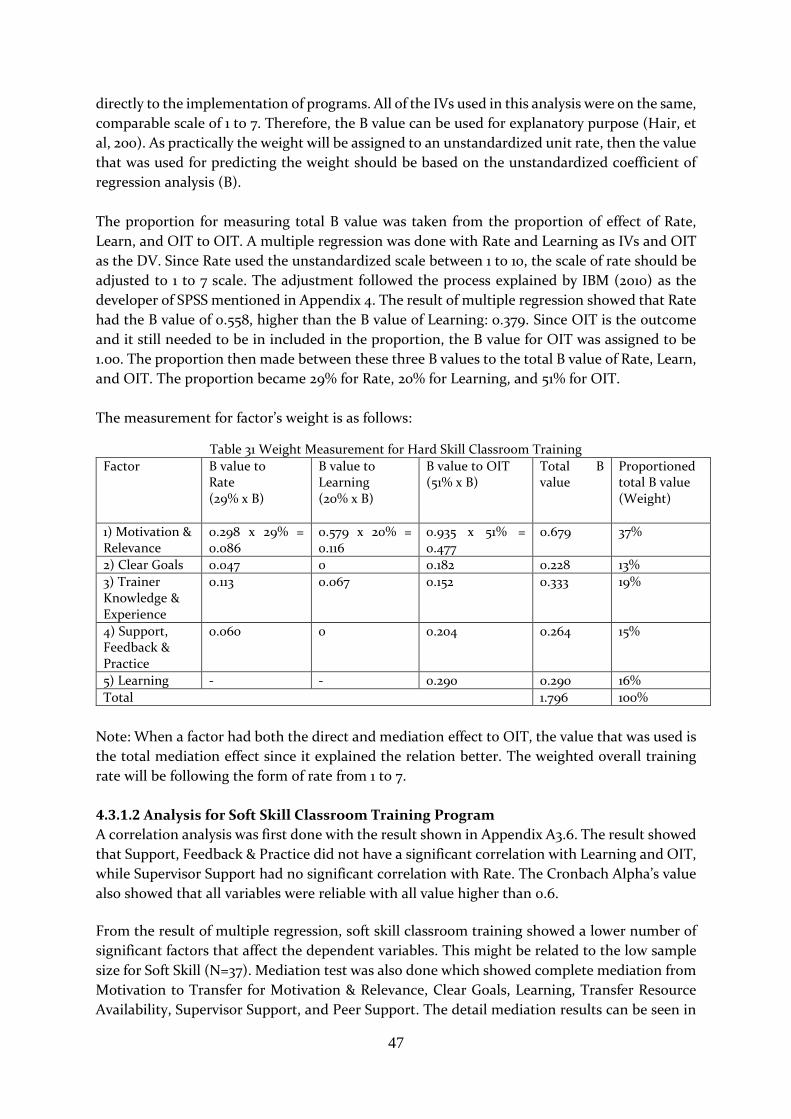
47
directly to the implementation of programs. All of the IVs used in this analysis were on the same,
comparable scale of 1 to 7. Therefore, the B value can be used for explanatory purpose (Hair, et
al, 200). As practically the weight will be assigned to an unstandardized unit rate, then the value
that was used for predicting the weight should be based on the unstandardized coefficient of
regression analysis (B).
The proportion for measuring total B value was taken from the proportion of effect of Rate,
Learn, and OIT to OIT. A multiple regression was done with Rate and Learning as IVs and OIT
as the DV. Since Rate used the unstandardized scale between 1 to 10, the scale of rate should be
adjusted to 1 to 7 scale. The adjustment followed the process explained by IBM (2010) as the
developer of SPSS mentioned in Appendix 4. The result of multiple regression showed that Rate
had the B value of 0.558, higher than the B value of Learning: 0.379. Since OIT is the outcome
and it still needed to be in included in the proportion, the B value for OIT was assigned to be
1.00. The proportion then made between these three B values to the total B value of Rate, Learn,
and OIT. The proportion became 29% for Rate, 20% for Learning, and 51% for OIT.
The measurement for factor’s weight is as follows:
Table 31 Weight Measurement for Hard Skill Classroom Training
Factor B value to Rate (29% x B)
B value to Learning (20% x B)
B value to OIT (51% x B)
Total B value
Proportioned total B value (Weight)
1) Motivation & Relevance
0.298 x 29% = 0.086
0.579 x 20% = 0.116
0.935 x 51% = 0.477
0.679 37%
2) Clear Goals 0.047 0 0.182 0.228 13%
3) Trainer Knowledge & Experience
0.113 0.067 0.152 0.333 19%
4) Support, Feedback & Practice
0.060 0 0.204 0.264 15%
5) Learning - - 0.290 0.290 16%
Total 1.796 100%
Note: When a factor had both the direct and mediation effect to OIT, the value that was used is
the total mediation effect since it explained the relation better. The weighted overall training
rate will be following the form of rate from 1 to 7.
4.3.1.2 Analysis for Soft Skill Classroom Training Program
A correlation analysis was first done with the result shown in Appendix A3.6. The result showed
that Support, Feedback & Practice did not have a significant correlation with Learning and OIT,
while Supervisor Support had no significant correlation with Rate. The Cronbach Alpha’s value
also showed that all variables were reliable with all value higher than 0.6.
From the result of multiple regression, soft skill classroom training showed a lower number of
significant factors that affect the dependent variables. This might be related to the low sample
size for Soft Skill (N=37). Mediation test was also done which showed complete mediation from
Motivation to Transfer for Motivation & Relevance, Clear Goals, Learning, Transfer Resource
Availability, Supervisor Support, and Peer Support. The detail mediation results can be seen in

48
Appendix A3.3. The summary of factors significantly related to Dependent Variables is shown
in Table 32. In this table, it can be seen that Motivation & Relevance and Trainer Knowledge &
Experience had significant regression effects on Rate, together explained 57.2% of the variance,
and only Trainer Knowledge & Experience had significant regression effects on Learning,
explaining 41.2% of the variance. Motivation to Transfer was again found to be the mediator
between the other factors to Opportunity & Implementation of Transfer (OIT). The complete
results of mediation effect can be seen in Appendix A3.3. The VIF are acceptable in all regression
model.
Table 32 Summary Significant Factors of Soft Skill Classroom Training
Dependent Variable Significant Independent Variable(s)
B β R2
Direct Effect to Rate 1) Motivation & Relevance 0.980 0.436 57.2%
2) Trainer Knowledge & Experience 0.861 0.381
Direct Effect to Learning 1) Trainer Knowledge & Experience 0.445 0.418 41.2%
Direct Effect to Opportunity & Implementation of Transfer (OIT)
1) Transfer Resource Availability 0.488 0.394 65.6%
2) Peer Support 0.936 0.566 3) Clear Goals 0.286 0.253
Total Effect to OIT through Mediation via Motivation to Transfer
1) Motivation & Relevance 0.982 0.531
2) Clear Goals 0.516 0.457
3) Learning 0.565 0.465
4) Transfer Resource Availability 0.650 0.525
5) Supervisor Support 0.461 0.522
6) Peer Support 1.074 0.650
The proportion for measuring the weight of each factor followed the proportion in Hard Skill
Classroom Training because the regression analysis did not result in significant value as the
sample size was low. For Support, Feedback, & Transfer, as it did not have any significant
relation to any of the dependent variables, the researcher assigned a number for the proportion
as the lowest number compared to the value of other factors. Rather than having 0% weight for
the insignificant factor, the researcher considered that it is important to have weights for all the
factors to define the overall training rate as all factors were found to be important for training
program based on the literature review and this research had limited data for analysis. To keep
the weight meaningful (i.e. not becoming very small) for the insignificant factor, the assigned B
value was defined to be close enough to the lowest B value by rounding down the lowest B value.
The weights are presented in Table 33.
Table 33 Weight for Soft Skill Classroom Training
Factor Total B value Proportioned total B value
(Weight) Soft Skill
Proportioned total B value
(Weight) Hard Skill
1) Motivation & Relevance 0.785 41% 37%
2) Clear Goals 0.263 14% 13%
3) Trainer Knowledge & Experience 0.338 18% 19%
4) Support, Feedback & Practice 0.200 (assigned number)
11% 15%
5) Learning 0.288 16% 16%
Total 1.855 100% 100%

49
4.3.1.3 Comparison to Previous Research at Vanderlande
In this research, factors that were found to have significant effect to training rate were
Motivation & Relevance, Clear Goals, Trainer Knowledge & Experience, and Support, Feedback
& Practice for Hard Skill programs. And for Soft Skill programs, the significant effect to training
rate was given by Motivation & Relevance and Trainer Knowledge & Experience. The founding
of this research was similar to what was found in the research by Radakrishnan (2015), and even
with more significant factors. In Radakrishnan (2015), Practice & Feedback and Trainer
Support were found to be significant for Hard Skill programs, and Trainer Support were found
to be significant for Soft Skill programs. Those two factors consisted of variables that were
also used to construct factors Trainer Knowledge & Experience and Support, Feedback &
Practice.
4.3.2 Blended Training Analysis
This analysis was done based on 25 cases. A correlation analysis in Appendix A3.7 showed
significant correlations between some of the independent variables and dependent variables.
The Cronbach Alpha’s value also showed that all variables had value higher than 0.6. The
dependent and Independent variables that were included in the multiple regression analysis
were the same as in Classroom Training, with the addition of factor Content Quality, Technical
System Quality, and Trainee’s Control as Independent variables for all three Dependent
Variables.
The summary of factors significantly related to Dependent Variables is shown in Table 34. In
this table, it can be seen that Motivation & Relevance and Trainer Knowledge & Experience had
significant regression effects on Rate, together explained 79.2% of the variance, and only
Motivation & Relevance had significant regression effects on Learning, explaining 60.4% of the
variance. Motivation to Transfer was found to be the mediator between the other factors to
Opportunity & Implementation of Transfer (OIT). The complete results of mediation effect can
be seen in Appendix A3.4. The VIF are acceptable in all regression model.
The weights for measuring the overall training rating are presented in Table 35. The proportion
for measuring the weight of each factor followed the proportion in Hard Skill Classroom
Training. The total B value of Clear Goals, Support, Feedback & Practice, Technical System
Quality, and Trainee’s Control were assigned by rounding down the lowest B value. The results
show that Motivation & Relevance had the highest weight.
Table 34 Summary Significant Factors of Blended Learning
Dependent Variable Significant Independent Variable(s)
B β R2
Direct Effect to Rate 1) Motivation & Relevance 0.742 0.627 79.2%
2) Trainer Knowledge & Experience 0.427 0.450
Direct Effect to Learning 1) Motivation & Relevance 0.674 0.657 60.4%
Direct Effect to Opportunity & Implementation of Transfer (OIT)
1) Motivation to Transfer 0.457 0.408 83.3%
2) Peer Support 0.776 0.539
Total Effect to OIT through Mediation via Motivation to Transfer
1) Motivation & Relevance 0.927 0.753
2) Content Quality 0.755 0.493
3) Learning 0.565 0.471
4) Supervisor Support 0.621 0.644
5) Peer Support 1.105 0.767

50
Table 35 Weight for Blended Learning
Factor Total B value Weight
1) Motivation & Relevance 0.822 41%
2) Clear Goals 0.100 (assigned) 5%
3) Trainer Knowledge & Experience 0.123 6%
4) Support, Feedback & Practice 0.100 (assigned) 5%
5) Learning 0.288 14%
6) Content Quality 0.385 19%
7) Technical System Quality 0.100 (assigned) 5%
8) Trainee’s Control 0.100 (assigned) 5%
Total 2.019 100%
4.3.3 Pit-Stop Development Program Analysis
This analysis was done based on 28 cases. A correlation analysis showed significant correlations
between some of the independent variables and dependent variables. The dependent and
Independent variables that were included in the multiple regression analysis were the same as
in Classroom Training, with the addition of Business Case Factors as Independent variables for
all three Dependent Variables.
The summary of factors significantly related to Dependent Variables is shown in Table 36. In
this table, it can be seen that Trainer Knowledge & Experience had significant regression effects
on Rate, explaining 49.9% of the variance, and Support, Feedback & Practice had significant
regression effects on Learning, explaining 60% of the variance. Motivation to Transfer was found
to be the mediator between the other factors to Opportunity & Implementation of Transfer
(OIT). The complete results of mediation effect can be seen in Appendix A3.5. The VIF are
acceptable in all regression model.
Table 36 Summary Significant Factors of Pit-Stop Program
Dependent Variable Significant Independent Variable(s)
B β R2
Direct Effect to Rate 1) Trainer Knowledge & Experience 0.567 0.378 49.9%
Direct Effect to Learning 1) Support, Feedback & Practice 0.804 0.502 60%
Direct Effect to Opportunity & Implementation of Transfer of Training (OIT)
1) Motivation & Relevance 0.491 0.301 84.4%
2) Fidelity of Design 0.425 0.437
Total effect to OIT through Mediation via Motivation to Transfer
1) Motivation & Relevance 1.277 0.784
2) Clear Goals 0.286 0.534
3) Fidelity of Design 1.051 0.792
4) Learning 0.593 0.663
5) Transfer Resource Availability 0.684 0.656
6) Supervisor Support 0.334 0.556
7) Peer Support 0.738 0.622
The weights for measuring the overall training rating are presented in Table 37. The proportion
for measuring the weight of each factor followed the proportion in Hard Skill Classroom
Training. The total B value of Feedback & Practice was assigned by rounding down the lowest B
value. The results show that Motivation & Relevance had the highest weight.

51
Table 37 Weight for Pit-Stop Program Evaluation
Factor Total B value Weight
1) Motivation & Relevance 0.651 31%
2) Clear Goals 0.146 7%
3) Trainer Knowledge & Experience 0.164 8%
4) Support, Feedback & Practice 0.160 8%
5) Learning 0.302 15%
6) Fidelity of Design 0.536 26%
7) Feedback & Practice 0.100 (assigned) 5%
Total 2.060 100%
4.4 Summary of Predictive Validity
Table 38 shows the summary of predictive effects between factors and the training or
development program. In the table, factors that were found to have effects on Rate are defined
as "R", factors that were found to have effects on learning are defined as "L", and factors that
were found to have effects on Opportunity and Implementation of Transfer of Training through
mediation of Motivation to Transfer are defined as "TM”. Motivation to Transfer was defined as
the mediator of the other factors to Opportunity and Implementation of Transfer of Training
(T). The summary of weights for each factor for every type of program also mentioned in Table
37This summary explains the answer for research question 6.

52
Table 38 Summary of Predictive Validity
No Factors Hard Skill Classroom Training
Soft Skill Classroom Training
Blended Learning Pit-Stop Program
Predictive Validity
Weight Predictive Validity
Weight Predictive Validity
Weight Predictive Validity
Weight
General Factors
1 Motivation & Relevance (4) R, L, TM 37% R, TM 41% R, L, TM 41% TM 31%
2 Clear Goals (2) R, TM 13% TM 14% 5% TM 7%
3 Learning (2) TM 19% TM 18% TM 14% TM 15%
Classroom Intervention Factors
4 Trainer Knowledge & Experience (2) R, L, TM 15% R, L 11% R 6% R 8%
5 Support, Feedback & Practice (4) R, TM 16% 16% 5% L 8%
6 Motivation to Transfer (4) Mediator to T Mediator to T Mediator to T Mediator to T
E-Learning Intervention Factors
7 Content Quality (3) TM 19%
8 Technical System Quality (2) 5%
9 Trainee's Control (3) 5%
Business Case Intervention factors
10 Fidelity of Design (5) TM 26%
11 Feedback & Practice (2) 5%
Transfer of Training Factors
12 Transfer Resource Availability (2) TM TM TM
13 Supervisor Support (5) TM TM TM TM
14 Colleague Support (2) TM TM TM TM

53
CHAPTER 5
DISCUSSION This chapter provides the summary of findings from this research and the recommendation for implementation of new evaluation tool. Suggestion for future research is also mentioned to give Vanderlande insights on future implementation of new research regarding the evaluation tool. A conclusion is provided at the end of this chapter regarding the overall research.
5.1 Summary of Research Findings
This research had the objective to design a training and development programs evaluation tool
that is applicable to be used across different interventions. The research started with defining
factors to be included in the evaluation tool, which was then followed by the design of the new
evaluation tool and evaluating the tool in a pilot study. The factors chosen to be included in the
new evaluation tool were based on literature and suggestions by training and development
experts at Vanderlande. Variables that construct the factors were determined based on validated
scales from previous studies and Confirmatory Factor Analysis (CFA) of current evaluation tool
using data from February to May 2016. The initial design of the new evaluation tool consisted of
different templates of factors and variables customized for six interventions that are currently
used at Vanderlande. The explanation of the new design of evaluation tool which was related to
the answer of each research question 1, 2, 3, and 4 is shown in Chapter 3. A cross-sectional pilot
study was carried out for seven different types of training and development programs that were
done during the first half of 2016. The result of the study was used to evaluate the new design of
evaluation tool. The result provided very limited data for some of the program and intervention
templates, thus the factor analysis was done to three of the intervention templates and the
general factors and transfer of training factors. There were three types of training outcomes that
were investigated for predictive validity which correlate to the first three levels of Kirkpatrick’s
model, Level 1 – Reaction (Training Rate), Level 2- Learning (Learning), and Level 3 – Behavior
(Transfer of Training).
5.1.1 Validity and Reliability of Evaluation Tool
This project succeeded in designing evaluation tool that could be applicable across different
types of training and development programs. The factors and variables that were included in
the pilot study fulfilled the content validity requirement. Based on Hair, Jr., et. al. (2010), content
validity, or also called as face validity is the extent to which the content of the variables that
represent a factor is consistent with the definition of the factor. This type of validity is based on
the researcher’s and experts’ judgement. The factors that were chosen to be included in the pilot
evaluation tool were based on literature study, which then ensured by interview with Training
and Development experts at Vanderlande. The variables that construct the factors were defined
based on validated scales from past research and CFA of current evaluation tool by
Radhakrishnan (2015). All scales were found to be reliable based on the Cronbach Alpha’s value.
The scales were also reviewed by the experts during interview sessions, and the final set of
variables for the pilot study was also reviewed by the Talent Development Manager. Three sets
of intervention factors that had sufficient number of data (General Factors, Classroom
Intervention Factors, and Transfer of Training Factors) were tested for construct validity by
Confirmatory Factor Analysis, and the final structure of those three sets of factors fulfilled all
requirements of construct validity as stated in Chapter 4.2.1. For E-learning factors and Business

54
Case Factors, the validity was tested by partial Exploratory Factor Analysis, and the validity was
achieved in the final structure as stated in Chapter 4.2.2. All factors in those statistically valid
scales were also found to have acceptable Cronbach’s Alpha, thus ensuring the reliability of the
scales. Due to limited number of responses, the statistical test for validity and reliability of
Coaching Factors, Outdoor Program Factors, and Peer Group Counseling Factors could not be
done in this project. However, the structure of those factors had the content validity, thus can
also be used for evaluation at Vanderlande.
To answer research question 6, the predictive validity test was done for three types of training
and development programs at Vanderlande that had quite sufficient data for analysis, which
were the Hard and Soft Skill Classroom Training Program, Blended Learning Training Program,
and Pit-Stop Development Program. From the summary of predictive effects in Table 37
(Chapter 4.4), it can be seen that each factors could give different effects to outcomes in
programs that uses different types of interventions. In this project, Motivation to Transfer was
found to be the mediator of other factors to Opportunity and Implementation of Transfer (OIT).
For the general factors, based on literature review in Chapter 2, Motivation to Learn, Content
Relevance and Clear Goals are factors that have effects on Transfer of Training in general.
Learning was also found to be affecting Transfer of Training by Kraiger et. al. (1993). In this
project, Motivation & Relevance which consisted of variables related to Motivation to Learn and
Content Relevance, Clear Goals, and Learning were found to have effects on OIT through
mediation for almost all types of programs, except that Clear Goals did not have effects to OIT
in Blended Learning program. From this, it can be concluded that the factors included in
General Factors were indeed had effects on the outcomes of training or development programs
in general.
Motivation & Relevance showed effects on all three outcomes for hard skill classroom training
and Blended learning while also showing effect on Rate for soft skill classroom training. Clear
Goals also showed significant effect to Rate in hard skill classroom training. This shows that
Motivation & Relevance played a big role in increasing the outcomes of training, which means
that the motivation to learn and match between the training content and the competency that
the participants need will affect to what extent they would be able to implement the knowledge
and skills to on-the-job behavior. With this information, Vanderlande should be more aware to
assign employees to the training or development program based on their needs and avoid
assigning employees to non-relevant programs. Van der Horst (2013) did a research at
Vanderlande where he found that there were cases where employees were assigned to the wrong
training program due to difficulties in assessing soft-skill competencies needed by employees.
Van der Horst then develop a competency self-assessment tool to solve this problem.
Vanderlande should be able to manage this relevancy issue by assessing the needs of
participants before the program. It can be done by using the participants’ manager’s judgement
or by using a tool like the one that was developed by Van der Horst.
For the Classroom Training, Trainer Knowledge & Experience and Support, Feedback & Practice
found to affect OIT through mediation for the hard skill classroom training. This effect is aligned
with the literature study in chapter 2. However, this effect did not appear in the soft skill
classroom training and the other programs that use other interventions as an addition of
classroom intervention. Literature also suggested that Trainer’s communication and support
has effect on learning performance which was proved in this project by the significant effect of

55
Trainer Knowledge & Experience for both hard and soft-skill classroom training. Trainer
Knowledge & Experience were also found to affect participant’s satisfaction towards all
inspected programs as shown by significant effect to Rating. Support, Feedback & Practice were
found to have significant effect to Rating for hard skill classroom training and to Learning on
Pit-stop program. The effect of Support, Feedback & Practice to the outcomes was different with
the literature study which stated that it should have effect on the transfer of training for training
and development programs in general. Moreover, in this project Motivation to Transfer were
found to have high significant effect to OIT in all inspected programs. Later it was found that
this happened because Motivation to Transfer was the mediator of relation between almost all
factors in all inspected programs with OIT. This also shows that Motivation to Transfer happens
as another outcome from the other factors. Therefore, it was decided to not include Motivation
to Transfer for measuring the weighted overall rating of programs.
For E-learning interventions factors, the only factors that was found to have an effect on OIT
through mediation was Content Quality in Blended Learning. Business case interventions
factors also only showed one factor that have effect on OIT through mediation, which was
Fidelity of Design, the integration of variables of Fidelity and Transfer Design in Pit-Stop
program. This might be related to the limited number of data available for analysis. Finally, all
the factors that were included in Transfer of Training Factors had effects on OIT through
mediation for almost all types of inspected programs, except that Transfer Resource Availability
did not have effect on OIT for Blended learning. This shows that the work environment factors
are very important in achieving transfer of training at Vanderlande. With this information,
Vanderlande should be able to encourage the supervisors/managers to support their employees
and also to instruct them to ensure that the peer support is available when the participants are
implementing their new knowledge and skills.
Overall, the result shows that the different use of interventions in a training or development
program lead to different significant factors affecting the outcomes. Therefore, the set of
variables used for evaluating a training or development program should be matched with the
interventions used in the program.
5.1.2 Structure Parsimony and Weighted Overall Rating
In this project, CFA and EFA were done to define the final structure of each set of factors. For
each type of training or development program, the content of the tool for evaluating the
implementation of the program is consisted of the General Factors and the special factors based
on the interventions used in the program. Below is the summary of the number of variables that
construct the evaluation tool for seven types of training and development programs that are
currently available at Vanderlande which also answers the research questions 5.
Table 39 Number of Variables in Final Structure
No Name of Training/Development Program No. of Variables
1 Classroom Training 21
2 E-Learning 19
3 Blended Learning (Classroom Training and E-learning) 29
4 Pit-Stop (Classroom Training and Business Case) 28
5 Authentic Leadership (Classroom Training, Peer Group Counseling, Outdoor Program)
34
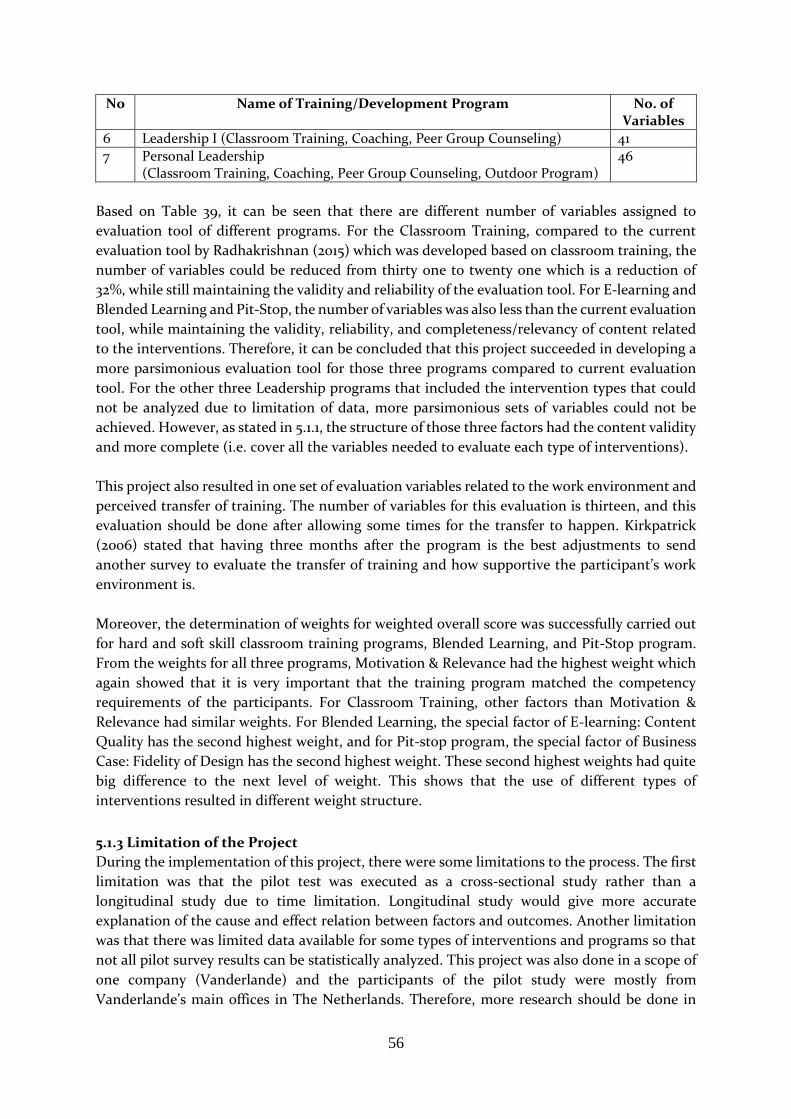
56
No Name of Training/Development Program No. of Variables
6 Leadership I (Classroom Training, Coaching, Peer Group Counseling) 41
7 Personal Leadership (Classroom Training, Coaching, Peer Group Counseling, Outdoor Program)
46
Based on Table 39, it can be seen that there are different number of variables assigned to
evaluation tool of different programs. For the Classroom Training, compared to the current
evaluation tool by Radhakrishnan (2015) which was developed based on classroom training, the
number of variables could be reduced from thirty one to twenty one which is a reduction of
32%, while still maintaining the validity and reliability of the evaluation tool. For E-learning and
Blended Learning and Pit-Stop, the number of variables was also less than the current evaluation
tool, while maintaining the validity, reliability, and completeness/relevancy of content related
to the interventions. Therefore, it can be concluded that this project succeeded in developing a
more parsimonious evaluation tool for those three programs compared to current evaluation
tool. For the other three Leadership programs that included the intervention types that could
not be analyzed due to limitation of data, more parsimonious sets of variables could not be
achieved. However, as stated in 5.1.1, the structure of those three factors had the content validity
and more complete (i.e. cover all the variables needed to evaluate each type of interventions).
This project also resulted in one set of evaluation variables related to the work environment and
perceived transfer of training. The number of variables for this evaluation is thirteen, and this
evaluation should be done after allowing some times for the transfer to happen. Kirkpatrick
(2006) stated that having three months after the program is the best adjustments to send
another survey to evaluate the transfer of training and how supportive the participant’s work
environment is.
Moreover, the determination of weights for weighted overall score was successfully carried out
for hard and soft skill classroom training programs, Blended Learning, and Pit-Stop program.
From the weights for all three programs, Motivation & Relevance had the highest weight which
again showed that it is very important that the training program matched the competency
requirements of the participants. For Classroom Training, other factors than Motivation &
Relevance had similar weights. For Blended Learning, the special factor of E-learning: Content
Quality has the second highest weight, and for Pit-stop program, the special factor of Business
Case: Fidelity of Design has the second highest weight. These second highest weights had quite
big difference to the next level of weight. This shows that the use of different types of
interventions resulted in different weight structure.
5.1.3 Limitation of the Project
During the implementation of this project, there were some limitations to the process. The first
limitation was that the pilot test was executed as a cross-sectional study rather than a
longitudinal study due to time limitation. Longitudinal study would give more accurate
explanation of the cause and effect relation between factors and outcomes. Another limitation
was that there was limited data available for some types of interventions and programs so that
not all pilot survey results can be statistically analyzed. This project was also done in a scope of
one company (Vanderlande) and the participants of the pilot study were mostly from
Vanderlande’s main offices in The Netherlands. Therefore, more research should be done in
57
other companies or to get more participants from other branches of Vanderlande in the world
to ensure the generality of the results.
5.2 Recommendations for Practical Implementation of New Evaluation Tool
For the implementation of the new evaluation tool, there are two key recommendations as
explained in the following pharagraphs.
Currently, Vanderlande carries out its training evaluation via an internal online web-site called
Coachview. This system provides feature for sending evaluation invitation to training
participants through an e-mail that includes the link that will direct the participants to the
evaluation survey. Past research showed mixed results on which one between online and offline
(paper-based) survey could attract more response rate (Gunter et. al., 2002). However, having
personalized mail that addressed to a specific individual can increase the response rate for both
the online and offline survey. For practicality, the researcher considered that using online survey
is a more favorable option as it can automatically store the survey data to the system. If offline
survey is used, a manual effort to put the data to the system for further analysis (i.e. calculation
of average and weighted total score) is required, which have the risk of human error in the
process, especially with so many programs to manage and large number of participants. Gunter
et. al. (2002) stated that the number of attempts made to contact the participants can also
increase the response rate. Therefore, using follow-up personal email is recommended to be
applied to increase the response rate of the online survey. This already implemented during the
pilot study.
The current online evaluation system is able to generate summary reports consisting of the
average rate of training and details on number and percentage of participants who choose each
choice of all variables. Another report that can be generated from the system is in the form of
excel-compatible file that includes all answer from participants. The structure of the file is not
always organized, especially when the survey gets a lot of response. For example, the variable is
not always in the same order as shown in the online survey. Moreover, both forms of report do
not generate the output that is required to draw conclusions effectively. The output that are
recommended to be put in the report are:
1) The average score of each variables
2) The average score of each factors, including the factors of outputs: Rating, Learning
3) The weighted overall rating based on weighted score of the factors
4) The average scores of weighted overall rating of all training programs that uses the same
interventions with the program that is being evaluated
5) Remarks on which factors scores fall below average of all programs or below the minimum
score that is determined by Vanderlande.
Output no. 4 is aligned with the need of Vanderlande Academy (VA) to be able to compare the
results of the evaluation of the training programs. The evaluation tool should also be able to
recode the rating choice from word type into number type (i.e. from “Strongly disagree to
Strongly agree” into “1 to 7”). Another option is to have the rate as number from the beginning.
The report for Transfer of Training Factors can also follow the above structure, but excluding
the weighted overall rating. The illustration figure of the report can be seen in Appendix 4. As
the final rating will also be in the form of scale 1 to 7, the interpretation of the scale can be: 1:

58
Totally Unacceptable, 2: Unacceptable, 3: Slightly unacceptable, 4: Neutral, 5: Slightly
acceptable, 6: Acceptable, 7: Perfectly acceptable.
Beside the above key recommendations, there are also some detail practical recommendations:
1. Sending the survey to the participants in the suitable time
As this research was done in the form of cross-sectional study, the participants filled in all
variables at one time. In the implementation, there are two different times that are required
to fill in the survey. The first one, is right after the training program. The evaluation that
needs to be sent at this time includes the General Factors, the special factors for each type
of intervention, and the three general questions. The second time is related to the Transfer
of Training. Based on Kirkpatrick (2006), there should be some time available after the
training or development program to allow the transfer of training to happen. Kirkpatrick
(2006) also stated that three months after the program is the best adjustments to send the
survey related to transfer of training
2. Placing several questions in one page
Based on the feedback that was given by the participants of pilot study, it will be more
comfortable for the participants if they do not have to go through too many pages to answer
all the survey variables. The current condition is that participants have to click on “next
page” as much as the number of questions in the evaluation survey. This might also be the
reason why not all participants are willing to complete the survey. Manfreda, Batagelj, &
Vehovar (2002) stated that when a web questionnaire presents one question per page, the
danger of not finishing all the questions is potentially high due to longer time required to
go through all questions and more actions to do (i.e clicking “next button several times).
Moreover, in the pilot survey, the information of the type of intervention related to the
variables were put only before the first variable related to the respective intervention.
Putting one question per page have the potential of participants forgetting which
intervention related to the variable they are answering after getting through some pages.
And going back to the previous pages to find the information will take more time.
Placing all items in one page has the potential to produce high correlation between
questions (Couper, Traugott, & Lamias, 2001). Grouping related variables have the potential
to reduce the time required to complete the survey by requiring only one orientation to
answer the questions (Couper et al, 2001). Therefore, the researcher recommends to
separate the page for the variable of General Factors and each type of Intervention factors.
For example, the evaluation survey of participants of Blended Learning should have 4 pages
consisting of page for General Factors, page for Classroom Intervention Factors, page for
E-learning Factors, and the last page for the general 3 questions of rate, willingness to
recommend the training program, and suggestions for the program. To avoid too much
scrolling in one page, rather than having the response choice in vertical order, it will be
beneficial if the responds to the answer can be put horizontally side by side or under the
variables.
3. Use the suitable factors for different type of interventions.
Vanderlande should be able to use the different set of variables templates depending on
the interventions used in a training or development program that has been found in this
research. This will give deeper understanding of the result of program implementation, and

59
can give Vanderlande more insights into how to improve their training and development
programs. It can also be useful to notify the training participants that they will receive
evaluation surveys regarding each type of intervention they followed in the program. With
this notification, the participants are expected to be more aware of the program
implementation and be able to give accurate answers to the evaluation survey.
4. Utilizing the result of Training and Development Evaluation
The implementation of the new evaluation tool at two different times based on the suitable
factors will give Vanderlande two types of insight. The first related to the actual
implementation of training or development programs. With the scores that Vanderlande
gets from this evaluation, an analysis to improve the program application can be carried
out. Based on the report illustrates in Appendix 4, Vanderlande should be able to see the
weighted score for each factors and the weighted overall rating of the program. When
looking at the weighted overall rating, Vanderlande can see whether the overall rating of
the program falls below or above the average overall rating and Vanderlande can also set a
minimum weighted overall rating that is wanted to be achieved. When the rating does not
achieve the minimum rating value, Vanderlande can also see which factor weighted score
is low or falls below the average factor weighted score. And then the average score of
variable rating can show which variable precisely that has low score.
Currently, when a training program does not achieve the minimum score that Vanderlande
determined (Minimum self-rating: 8), Vanderlande will discuss it directly with the trainer
or the organization that manages the training program. In using this new evaluation tool,
Vanderlande should be able to see that the problem does not always come from the Trainer
or the organizer of the program. For example, when a weighted overall rating score is low,
and it is found that the cause of the low score comes from the variables related to the
relevance of the program, then it is better to review the competency assessment rather than
directly bringing up the problem to the trainer or organizer. For the low score related to
the special factors of the interventions, Vanderlande can share the information to the
internal trainer or external training organizer, so that discussions regarding the program
can be carried out in more detail.
The second insight is related to the transfer of training. With the transfer of training
evaluation that will be given to the participants after giving some time to allow it to happen,
Vanderlande can get information on whether the participants are actually able to
implement the knowledge and skills they get from the training or development program.
Insights into the participant’s work environment can also be gathered from this evaluation.
Vanderlande can use this information to communicate with the participants and their
managers to be able to increase the probability of transfer of training.
5. Pay attention to the aspect of motivation to learn and relevancy between training program
and the required competency of participants
Based on the determination of weights, factor Motivation & Relevance has the highest
weight in all programs that had been inspected. Therefore, Vanderlande should make sure
that the participants follow the suitable training programs based on their needs and also to
encourage the trainers to motivate the participants during the program.

60
5.3 Possible Improvements for Future Research
The limitation of this research was that it was conducted within a limited period of time, and
the pilot study itself was done in the period that was not beneficial for the research, so that there
were some types of interventions and programs that could not be fully analyzed due to limited
number of participants. Therefore, there are some improvements that can be done for the future
research:
1. The number of participants were small for the intervention types apart from Classroom
Intervention. This was also due to the fact that almost all training programs at
Vanderlande are done using classroom interventions. The data that was gathered for
other interventions was not sufficient to carry out a CFA to determine the best set of
variables and parsimonious structure for those interventions. The research for special
interventions clearly requires more data to get a valid and more reliable result. Based on
Hair et al. (2010), a factor analysis requires at least 5 cases for each variable it tests, and
a minimum absolute sample size of 50. Analysis of the predictive validity of the other
programs that had not been analyzed in this research due to data limitation should also
be analyzed when sufficient data is gathered.
2. The number of questions can be too high when a program uses a lot of interventions.
When sufficient data is gathered, there can be an analysis of the effect of all factors in
each intervention type to training outcomes (Rate, Learning, Transfer of Training). With
this result, Vanderlande can choose which factors are best to include in the evaluation
tool based on the significant effect it gives to the training outcomes. The factor with the
highest significant prediction value of transfer of training should be chosen to include
in the evaluation tool. If there is no such factor, the outcome level can be lowered to
Learning or Rating.
3. The measurement of learning and transfer of training in this project is based on
subjective opinion of the participants. To have clearer insights to this aspects, the
evaluation can also be extended by including the learning and transfer of training
evaluation by the participants’ supervisor/manager or subordinate that works alongside
the participants daily.
5.4 Conclusion
This research focused on the design of a new evaluation tool for the training and development
programs at Vanderlande that is valid, reliable, applicable across different types of training and
development interventions, and have a feature of weighted overall score based on weighted
mean scores of factors related to the different types of interventions used in the program. This
research succeeded to fulfill all those requirements for three types of training and development
programs. The results of analysis of these three programs showed that for different types of
intervention, the factors that affect the training outcomes also varied. There were three other
development programs evaluations that included interventions that only had limited number
of data, thus was not able to be tested statistically for the validity, reliability and structure.
However, the structure of these three sets of evaluations fulfilled the face validity as explained
in 5.1.1. The determination of weights also could not be carried out for these three development
programs. This research also succeeded in extending the scope of the evaluation level from only
subjective reaction to the program (personal rating) to the perceived learning and transfer of
training.

61
References Aguinis, H., & Kraiger, K. (2009). Benefits of Training and Development for Individuals and
Teams, Organizations, and Society. Annual Review of Psychology, 60, 451-474.
Alliger, G. M., Tannenbaum, S. I., Bennett Jr., W., Traver, H., & Shotland, A. (1997). A meta-
analysis of the relations among training criteria. Personnel Psychology, 50, 341-358.
Alvarez, K., Salas, E., & Garofano, C. M. (2004). An Integrated Model of Training Evaluation
and Effectiveness. Human Resource Development Review, 385-416.
Arthur Jr., W., Bennett Jr., W., Edens, P. S., & Bell, S. T. (2003). Effectiveness of Training in
Organizations: A Meta-Analysis of Design and Evaluation Features. Journal of Applied
Psychology, 88, 234-245.
Baldwin, T., & Ford, J. K. (1988). Transfer of training: A review and directions for future
research. Personnel Psychology, 41, 63-105.
Barron, A. E., Dawson, K., & Yendol-Hoppey, D. (2009). Peer coaching and technology
integration: an evaluation of the Microsoft peer coaching program. Mentoring &
Tutoring: Partnership in Learning, 83-102.
Berg, M. E., & Karlsen, J. T. (2012). An evaluation of management training and coaching.
Journal of Workplace Learning, 177-199.
Blume, B. D., Ford, J. K., Baldwin, T. T., & Huang, J. L. (2010). Transfer of Training: A Meta-
Analytic Review. Journal of Management, 1065-1105.
Britton, L. R., & Anderson, K. A. (2010). Peer coaching and pre-service teachers: Examining an
underutilised concept. Teaching and Teacher Education, 306-314.
Burke, L. A., & Hutchins, H. M. (2007). Training Transfer: An Integrative Literature Review.
Human Resource Development Review, 263-296.
Chatzimouratidis, A., Theotokas, I., & Lagoudis, I. (2011). Decision support systems for human
resource training and development. The International Journal of Human Resource
Management, 23, 662-693.
Chen, S., Yen, D., & Hwang, M. (2012). Factors influencing the continuance intention to the
usage of Web 2.0: An empirical study. Computers in Human Behavior, 28, 933–941.
Chiu, C., Chiu, C., & Chang, H. (2007). Examining the integrated influence of fairness and
quality on learners’ satisfaction and web-based learning continuance intention. Info
Systems, 17, 271–287.
Clutterbuck, D. (2008). What's happening in coaching and mentoring? And what is the
difference between them? Development and Learning in Organizations: An
International Journal, 22, 8-10.
Couper, M., Traugott, M., & Lamias, M. (2001). Web survey design and administration.
American Association for Public Opinion Research, 65, 230-253.
Elbers, W. (2010). Improving transfer of training. Unpublished master's thesis. Eindhoven
University of Technology.
Ely, K., Boyce, L. A., Nelson, J. K., Zaccaro, S. J., Hernez-Broome, G., & Whyman, W. (2010).
Evaluating Leadership Coaching: A Review and Integrated Framework. The Leadership
Quarterly, 21, 585-599.
Ferrin, D., Dirks, K., & Shah, P. (2006). Direct and indirect effects of third-party relationships
on interpersonal trust. Journal of Applied Psychology, 91, 870-883.
Finch, W. H. (2013). Exploratory Factor Analysis. In T. Timothy, Hanbook of Quantitative
Methods for Educational Research (1st ed., pp. 166-186). Auckland: Sense Publisher.
Fitzgerald, W. (1992). Training versus development. Training & development, 46, 81-84.
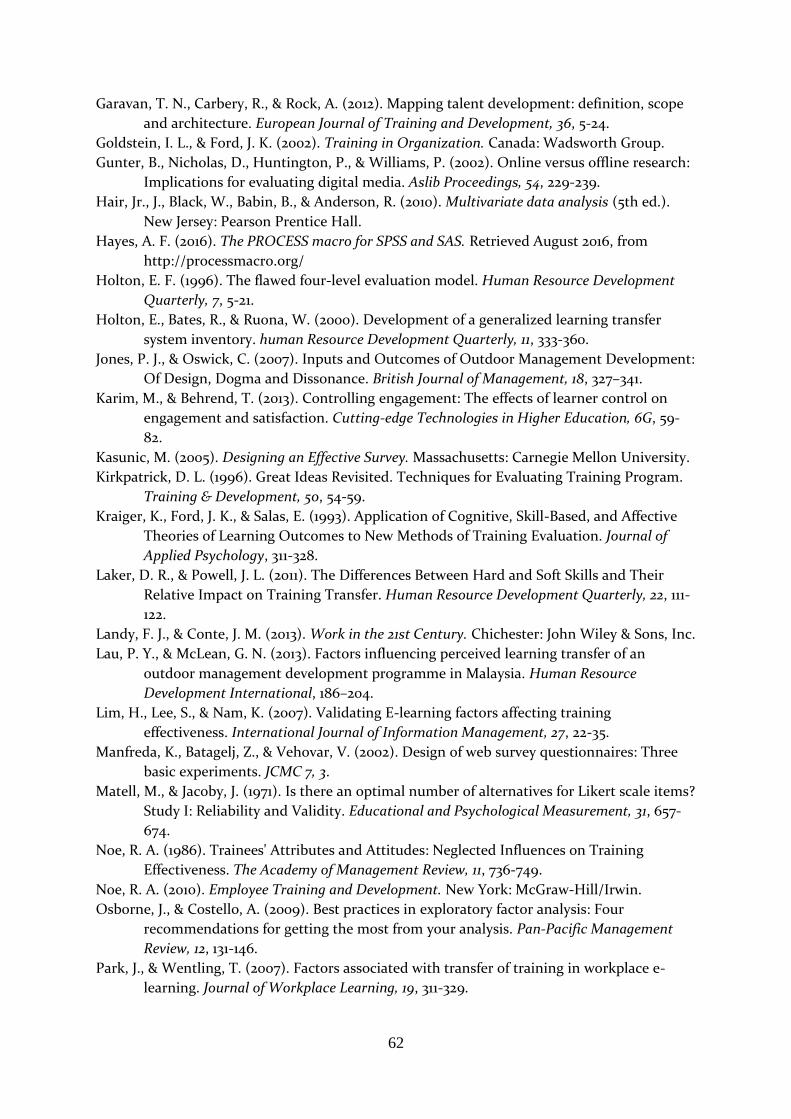
62
Garavan, T. N., Carbery, R., & Rock, A. (2012). Mapping talent development: definition, scope
and architecture. European Journal of Training and Development, 36, 5-24.
Goldstein, I. L., & Ford, J. K. (2002). Training in Organization. Canada: Wadsworth Group.
Gunter, B., Nicholas, D., Huntington, P., & Williams, P. (2002). Online versus offline research:
Implications for evaluating digital media. Aslib Proceedings, 54, 229-239.
Hair, Jr., J., Black, W., Babin, B., & Anderson, R. (2010). Multivariate data analysis (5th ed.).
New Jersey: Pearson Prentice Hall.
Hayes, A. F. (2016). The PROCESS macro for SPSS and SAS. Retrieved August 2016, from
http://processmacro.org/
Holton, E. F. (1996). The flawed four-level evaluation model. Human Resource Development
Quarterly, 7, 5-21.
Holton, E., Bates, R., & Ruona, W. (2000). Development of a generalized learning transfer
system inventory. human Resource Development Quarterly, 11, 333-360.
Jones, P. J., & Oswick, C. (2007). Inputs and Outcomes of Outdoor Management Development:
Of Design, Dogma and Dissonance. British Journal of Management, 18, 327–341.
Karim, M., & Behrend, T. (2013). Controlling engagement: The effects of learner control on
engagement and satisfaction. Cutting-edge Technologies in Higher Education, 6G, 59-
82.
Kasunic, M. (2005). Designing an Effective Survey. Massachusetts: Carnegie Mellon University.
Kirkpatrick, D. L. (1996). Great Ideas Revisited. Techniques for Evaluating Training Program.
Training & Development, 50, 54-59.
Kraiger, K., Ford, J. K., & Salas, E. (1993). Application of Cognitive, Skill-Based, and Affective
Theories of Learning Outcomes to New Methods of Training Evaluation. Journal of
Applied Psychology, 311-328.
Laker, D. R., & Powell, J. L. (2011). The Differences Between Hard and Soft Skills and Their
Relative Impact on Training Transfer. Human Resource Development Quarterly, 22, 111-
122.
Landy, F. J., & Conte, J. M. (2013). Work in the 21st Century. Chichester: John Wiley & Sons, Inc.
Lau, P. Y., & McLean, G. N. (2013). Factors influencing perceived learning transfer of an
outdoor management development programme in Malaysia. Human Resource
Development International, 186–204.
Lim, H., Lee, S., & Nam, K. (2007). Validating E-learning factors affecting training
effectiveness. International Journal of Information Management, 27, 22-35.
Manfreda, K., Batagelj, Z., & Vehovar, V. (2002). Design of web survey questionnaires: Three
basic experiments. JCMC 7, 3.
Matell, M., & Jacoby, J. (1971). Is there an optimal number of alternatives for Likert scale items?
Study I: Reliability and Validity. Educational and Psychological Measurement, 31, 657-
674.
Noe, R. A. (1986). Trainees' Attributes and Attitudes: Neglected Influences on Training
Effectiveness. The Academy of Management Review, 11, 736-749.
Noe, R. A. (2010). Employee Training and Development. New York: McGraw-Hill/Irwin.
Osborne, J., & Costello, A. (2009). Best practices in exploratory factor analysis: Four
recommendations for getting the most from your analysis. Pan-Pacific Management
Review, 12, 131-146.
Park, J., & Wentling, T. (2007). Factors associated with transfer of training in workplace e-
learning. Journal of Workplace Learning, 19, 311-329.

63
Parker, P., Hall, D. T., & Kram, K. E. (2008). Peer Coaching: A Relational Process for
Accelerating Career Learning. Academy of Management Learning & Education, 487-503.
Phillips, J. (2012). Handbook of training evaluation and measurement methods (3rd ed.). New
York: Routledge.
Piccoli, G., Ahmad, R., & Ives, B. (2001). Web-Based Virtual Learning Environments: A
Research Framework and a Preliminary Assessment of Effectiveness in Basic IT Skills
Training. MIS Quarterly, 401-426.
Radhakrishnan, P. (2015). An Assessment Tool to evaluate the Effectiveness of Training
Programs at Vanderlande. Unpublished master's thesis. Eindhoven University of
Technology.
Salas, E., & Burke, C. (2002). Simulation for training is effective when ... Quality & Safety in
Healthcare, 11, 119-120.
Saunders, M., Lewis, P., & Thornhill, A. (2009). Research methods for business students (5th
ed.). Amsterdam: Prentice Hall.
Shan, S., Li, C., Shi, J., Wang, L., & Cai, H. (2014). mpact of Effective Communication,
Achievement Sharing and Positive Classroom Environments on Learning Performance.
Systems Research and Behavioral Science, 31, 471-482.
Singh, H. (2003). Building Effective Blended Learning Programs. Educational Technology, 43,
51-54.
Sitzmann, T., Kraiger, K., Stewart, D., & Wisher, R. (2006). The comparative effectiveness of
web-based and classroom instruction: A meta analysis. Personnel Psychology, 623-664.
Turner, D. W. (2010). Qualitative Interview Design: A Practical Guide for Novice Investigators.
The Qualitative Report, 15, 754-760.
Van Aken, J., Berends, H., & Van der Bij, H. (2012). Problem solving in organizations : a
methodological handbook for business and management students. Cambridge:
Cambridge University Press.
Van der Horst, S. I. (2013). Competency Management. Unpublished master's thesis. Eindhoven
University of Technology.
Vanderlande. (2015). Year in Review CY2015. Veghel: Vanderlande.
Vanderlande. (2016). Retrieved from Vanderlande Intranet: http://intranet.vi.corp
Vanderlande. (2016, April 27). Vanderlande. Retrieved from Vanderlande:
www.vanderlande.com
VanderlandeAcademy. (2016). Vanderlande academy training catalogue.
Yousef, A. M., Chatti, M. A., Schroeder, U., & Wosnitza, M. (2015). A Usability Evaluation of a
Blended MOOC Environment: An Experimental Case Study. International Review of
Research in Open and Distributed Learning, 69-93.

64
APPENDIX
Appendix 1 – Detailed Information of CFA of Current Evaluation Tool
A1.1 Path Diagram Initial Structure of Current Evaluation Tool
Figure A1 Path Diagram Initial Construct of Current Evaluation Tool

65
Table A1 Validity of Initial Construct of Current Evaluation Tool
CR AVE MSV ASV 1 2 3 4 5 6 7 8 9
1) Self
Efficacy 0.881 0.599 0.731 0.401 0.774
2)Training
Expectation 0.814 0.594 0.394 0.187 0.455 0.771
3)Training
Relevance 0.798 0.570 0.947 0.433 0.855 0.431 0.755
4)Goal
Clarity 0.797 0.663 0.394 0.237 0.559 0.628 0.535 0.814
5)Practice &
Feedback 0.840 0.516 0.292 0.225 0.532 0.453 0.540 0.469 0.718
6)Fulfilment
Expectation 0.850 0.657 0.947 0.432 0.827 0.491 0.973 0.546 0.473 0.811
7)Trainer
Support 0.897 0.813 0.250 0.132 0.372 0.214 0.391 0.149 0.497 0.356 0.902
8)Up-to-
date
Content 0.839 0.723 0.250 0.100 0.356 0.207 0.309 0.198 0.368 0.255 0.500 0.850
9)Impact on
Work 0.887 0.723 0.878 0.399 0.851 0.420 0.881 0.573 0.443 0.937 0.261 0.213 0.850
Color code:
Green: Correlation between constructs (factors)
Blue: Square root of AVE (√𝐴𝑉𝐸)
Items in yellow highlights shows that the validity requirements were not fulfilled.

66
A1.2 Path Diagram Structure of Current Evaluation Tool after CFA
Figure A2 Path Diagram Current Evaluation after CFA
Table A2 Validity of Current Evaluation Tool after CFA
CR AVE MSV ASV
Trainer
Support
Training
Expectation
Relevance
To Work
Clear
Goal
Practice
Feedback Content
Trainer
Support 0.897 0.814 0.251 0.121 0.902
Training
Expectation 0.814 0.594 0.393 0.171 0.213 0.771
Relevance
to Work 0.940 0.612 0.335 0.186 0.342 0.461 0.782
Goal Clarity 0.797 0.663 0.393 0.193 0.149 0.627 0.579 0.814
Practice &
Feedback 0.794 0.567 0.186 0.161 0.413 0.404 0.431 0.423 0.753
Up-to-Date
Content 0.839 0.723 0.251 0.103 0.501 0.202 0.280 0.195 0.327 0.850
Color code:
Green: Correlation between constructs (factors)
Blue: Square root of AVE (√𝐴𝑉𝐸)

67
Appendix 2 – Detailed Information of CFA of New Design of Evaluation Tool
A2.1 Factor Analysis General Factors Constructs
A.2.1.1 EFA result General Factors - Content Relevance and Motivation to Learn
The KMO Measure of Sampling adequacy shows the value of 0.801 which is above the minimum value of 0.5 and the Bartlett test of sphericity shows the value of 0.000. This means that the variables have significant correlation so that it is appropriate to apply EFA to the data. The result in Table below shows that the variables of Content Relevance and Motivation to Learn belong to 1 factors.
Table A3 EFA General Factors
Factor
1
MOT1 .791 MOT2 .809 MOT3 .644 RLV1 .797 RLV2 .729
A2.1.2 Validity & Reliability Measurement of General Factors Initial Model
Table A4 Validity & Reliability Measurement of General Factors Initial Model
CR AVE MSV ASV Clear Goals
Motivation to Learn
Content Relevance Learning
Clear Goals 0.791 0.655 0.218 0.153 0.809 Motivation to Learn 0.748 0.503 0.745 0.476 0.467 0.709 Content Relevance 0.696 0.534 0.745 0.452 0.345 0.863 0.731
Learning 0.773 0.630 0.493 0.360 0.348 0.682 0.702 0.794
Color code: Green: Correlation between constructs (factors)
Blue: Square root of AVE (√𝐴𝑉𝐸)
Items in yellow highlights shows that the validity requirements were not fulfilled.
A2.1.3 Validity & Reliability Measurement of General Factors Final Model
Table A5 Validity & Reliability Measurement of General Factors Final Model
CR AVE MSV ASV Clear Goals
Motivation & Relevance Learning
Clear Goals 0.791 0.655 0.169 0.336 0.809 Motivation & Relevance 0.811 0.519 0.503 0.145 0.411 0.720
Learning 0.773 0.631 0.503 0.311 0.348 0.709 0.794

68
A2.1.4 EFA result Classroom Intervention Factors - Feedback & Practice and Fellow
Trainee Support
The KMO Measure of Sampling adequacy shows the value of 0.818 which is above the minimum value of 0.5 and the Bartlett test of sphericity shows significant value of 0.000. The result in Table below showed that the variables of Feedback & Practice and Fellow Trainee Support belong to 1 factors.
Table A6 EFA result Classroom Intervention Factors
Component
1 2
FELLOW1 .506 .442 FELLOW2 .749 FELLOW3 .841 FEEDPRA1 .868 FEEDPRA2 .802 FEEDPRA3 .939
A2.1.5 Validity & Reliability Measurement of Classroom Intervention Factors Initial
Model
Table A7 Validity & Reliability Measurement of Classroom Intervention Factors Initial Model
CR AVE MSV ASV Feedback &
Practice
Trainer Knowledge &
Experience
Fellow Trainee Support
Motivation to
Transfer Feedback & Practice
0.597 0.425 0.927 0.445 0.652
Trainer Knowledge & Experience
0.934 0.877 0.245 0.176 0.495 0.937
Fellow Trainee Support
0.687 0.434 0.927 0.438 0.963 0.439 0.659
Motivation to Transfer
0.897 0.639 0.194 0.149 0.405 0.299 0.440 0.799
Items in yellow highlights shows that the validity requirements were not fulfilled.
A2.1.6 Validity & Reliability Measurement of Classroom Intervention Factors Final
Model
Table A8 Validity & Reliability Measurement of Classroom Intervention Factors Final Model
CR AVE MSV ASV Support,
Feedback, & Practice
Trainer Knowledge &
Experience
Motivation to Transfer
Support, Feedback, & Practice 0.843 0.576 0.216
0.187 0.759
Trainer Knowledge & Experience 0.936 0.880 0.216
0.146 0.465 0.938
Motivation to Transfer 0.898 0.690 0.157 0.116 0.396 0.274 0.831
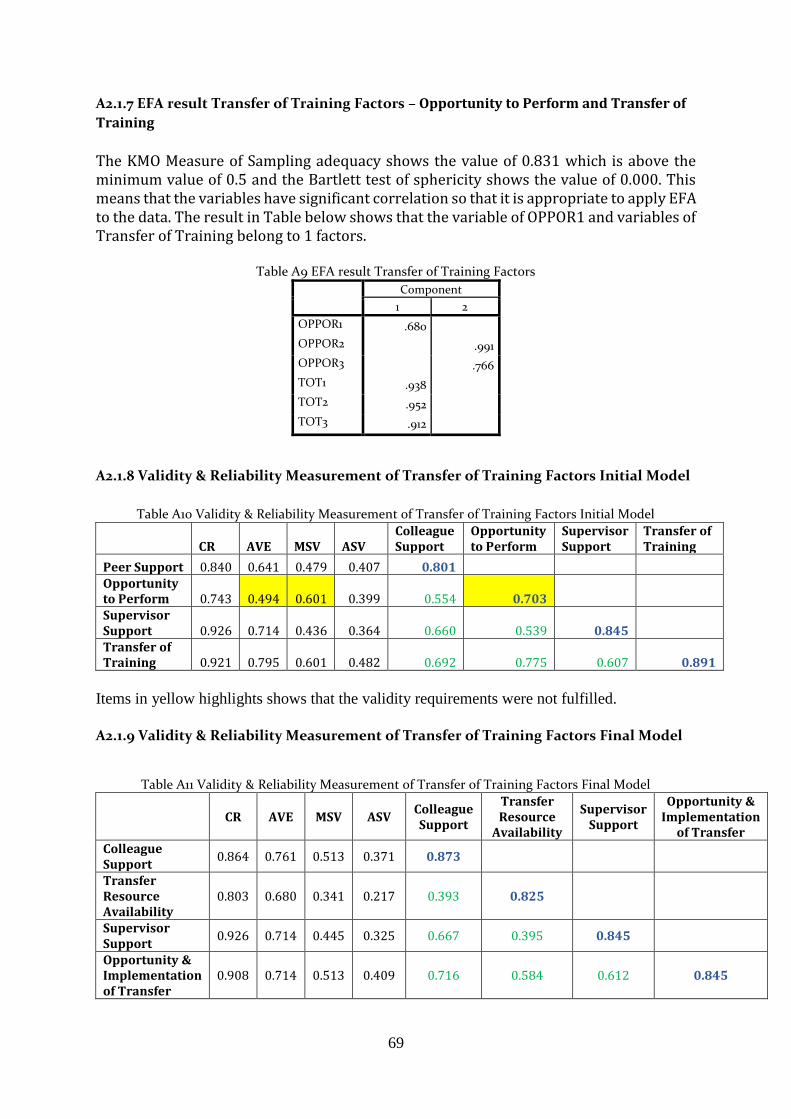
69
A2.1.7 EFA result Transfer of Training Factors – Opportunity to Perform and Transfer of
Training
The KMO Measure of Sampling adequacy shows the value of 0.831 which is above the minimum value of 0.5 and the Bartlett test of sphericity shows the value of 0.000. This means that the variables have significant correlation so that it is appropriate to apply EFA to the data. The result in Table below shows that the variable of OPPOR1 and variables of Transfer of Training belong to 1 factors.
Table A9 EFA result Transfer of Training Factors
Component
1 2
OPPOR1 .680 OPPOR2 .991
OPPOR3 .766
TOT1 .938 TOT2 .952 TOT3 .912
A2.1.8 Validity & Reliability Measurement of Transfer of Training Factors Initial Model
Table A10 Validity & Reliability Measurement of Transfer of Training Factors Initial Model
CR AVE MSV ASV Colleague Support
Opportunity to Perform
Supervisor Support
Transfer of Training
Peer Support 0.840 0.641 0.479 0.407 0.801 Opportunity to Perform 0.743 0.494 0.601 0.399 0.554 0.703 Supervisor Support 0.926 0.714 0.436 0.364 0.660 0.539 0.845 Transfer of Training 0.921 0.795 0.601 0.482 0.692 0.775 0.607 0.891
Items in yellow highlights shows that the validity requirements were not fulfilled.
A2.1.9 Validity & Reliability Measurement of Transfer of Training Factors Final Model
Table A11 Validity & Reliability Measurement of Transfer of Training Factors Final Model
CR AVE MSV ASV Colleague Support
Transfer Resource
Availability
Supervisor Support
Opportunity & Implementation
of Transfer Colleague Support
0.864 0.761 0.513 0.371 0.873
Transfer Resource Availability
0.803 0.680 0.341 0.217 0.393 0.825
Supervisor Support
0.926 0.714 0.445 0.325 0.667 0.395 0.845
Opportunity & Implementation of Transfer
0.908 0.714 0.513 0.409 0.716 0.584 0.612 0.845

70
Appendix 3 - Detailed Information of Regression Analysis of New Design of
Evaluation Tool
A3.1 EFA of Learning and Opportunity and Implementation of Transfer
Table A12 EFA of Learning and Opportunity and Implementation of Transfer
Factor Loadings
Opportunity &
Implementation of
Transfer Learning
LEARN1 .948
LEARN2 .849
OPPOR1 .662
TOT1 .914
TOT2 .971
TOT3 .888
Kaiser-Meyer-Olkin Measure of Sampling Adequacy. .783
Bartlett's Test of Sphericity Approx. Chi-Square 506.106
df 15
Sig. .000

71
A3.2 Mediation Effect of Motivation to Transfer in Hard Skill Classroom Training
X
predicts
Y (c)
X
predicts
M (a)
X&M together predicts Y Indirect
Effects
Confidence
Interval
(CI)
Remarks
M
predicts
Y (b)
X no longer
predicts Y or
is lessened
predict Y (c’)
Supervisor
Support
p<0.01
R2: 0.331
b: 0.522
β: 0.575
p<0.01
R2: 0.297
b: 0.446
β: 0.545
R2: 0.673 b: 0.345
β: 0.380
0.228-0.473
does not
cross 0
Partial
mediation p<0.01
b: 0.773
β: 0.698
p: 0.020
b: 0.177
β: 0.195
Peer Support p<0.01
R2: 0.415
b: 0.870
β: 0.647
p<0.01
R2: 0.418
b: 0.788
β: 0.644
R2: 0.673 b: 0.582
β: 0.433
0.414-0.785
does not
cross 0
Partial
mediation p<0.01
b: 0.738
β: 0.666
p<0.01
b: 0.289
β: 0.214
Transfer
Resource
Availability
p<0.01
R2: 0.415
b: 0.643
β: 0.503
p<0.01
R2: 0.163
b: 0.465
β: 0.404
R2: 0.684 b: 0.370
β: 0.289
0.206-0.562
does not
cross 0
Partial
mediation p<0.01
b: 0.796
β: 0.718
p<0.01
b: 0.273
β: 0.214
Motivation &
Relevance
p<0.01
R2: 0.383
b: 0.935
β: 0.619
p<0.01
R2: 0.566
b: 1.025
β: 0.752
R2: 0.647 b: 0.935
β: 0.619
0.658-1.145
does not
cross 0
Complete
mediation p<0.01
b: 0.864
β: 0.779
P=0.665
b: 0.050
β: 0.033
Clear Goals p<0.01
R2: 0.102
b: 0.356
β: 0.318
p<0.01
R2: 0.181
b: 0.429
β: 0.425
R2: 0.647 b: 0.356
β: 0.318
0.246-0.556
does not
cross 0
Complete
mediation p<0.01
b: 0.904
β: 0.816
P=0.610
b: -0.032
β: -0.028
Learning p<0.01
R2: 0.217
b: 0.569
β: 0.465
p<0.01
R2: 0.358
b: 0.661
β: 0.598
R2: 0.647 b: 0.569
β: 0.465
0.454-0.764
does not
cross 0
Complete
mediation p<0.01
b: 0.907
β: 0.818
P=0.694
b: -0.030
β: -0.025
Trainer
Knowledge &
Experience
P=0.019
R2: 0.038
b: 0.299
β: 0.195
p<0.01
R2: 0.051
b: 0.313
β: 0.226
R2: 0.646 b: 0.299
β: 0.195
0.041-0.537
does not
cross 0
Complete
mediation p<0.01
b: 0.888
β: 0.801
P=0.784
b: 0.022
β: 0.014
Support,
Feedback &
Practice
P<0.01
R2: 0.153
b: 0.401
β: 0.391
p<0.01
R2: 0.102
b: 0.295
β: 0.319
R2: 0.666 b: 0.248
β: 0.241
0.136-0.379
does not
cross 0
Partial
mediation p<0.01
b: 0.838
β: 0.756
P<0.01
b: 0.153
β: 0.150

72
A3.3 Mediation Effect of Motivation to Transfer in Soft Skill Classroom Training
X predicts
Y (c)
X predicts
M (a)
X&M together predicts Y Indirect Effects
Confidence Interval
(CI)
Remarks
M predicts
Y (b)
X no longer predicts Y or is lessened
predict Y (c’)
Supervisor Support
p<0.01 R2: 0.272 b: 0.461 β: 0.522
p<0.01 R2: 0.239 b: 0.313 β: 0.489
R2: 0.744 b: 0.461 β: 0.522
0.136-0.586 does not cross 0
Complete mediation p<0.01
b: 1.085 β: 0.787
p: 0.177 b: 0.121 β: 0.137
Peer Support p<0.01 R2: 0.422 b: 1.074 β: 0.650
p<0.01 R2: 0.382 b: 0.741 β: 0.618
R2: 0.753 b: 1.074 β: 0.650
0.388 -1.108 does not cross 0
Complete mediation p<0.01
b: 1.009 β: 0.731
p:0.077 b: 0.327 β: 0.198
Transfer Resource Availability
p<0.01 R2: 0.276 b: 0.650 β: 0.525
p<0.01 R2: 0.274 b: 0.470 β: 0.523
R2: 0.738 b: 0.650 β: 0.525
0.268-1.003 does not cross 0
Complete mediation p<0.01
b: 1.099 β: 0.797
P:0.300 b: 0.134 β: 0.108
Motivation & Relevance
p<0.01 R2: 0.282 b: 0.982 β: 0.531
p<0.01 R2: 0.366 b: 0.811 β: 0.605
R2: 0.729 b: 0.982 β: 0.531
0.434-1.510 does not cross 0
Complete mediation p<0.01
b: 1.158 β: 0.840
P=0.836 b: 0.043 β: 0.023
Clear Goals p<0.01 R2: 0.209 b: 0.516 β: 0.457
p: 0.012 R2: 0.167 b: 0.334 β: 0.408
R2: 0.743 b: 0.516 β: 0.457
0.129-0.705 does not cross 0
Complete mediation p<0.01
b: 1.104 β: 0.801
P=0.180 b: 0.147 β: 0.131
Learning p<0.01 R2: 0.190 b: 0.760 β: 0.436
p<0.01 R2: 0.289 b: 0.679 β: 0.537
R2: 0.730 b: 0.760 β: 0.436
0.455-1.311 does not cross 0
Complete mediation p<0.01
b: 1.201 β: 0.871
P=0.763 b: -0.056 β: -0.032
Trainer Knowledge & Experience
P=0.309 R2: 0.030 b: 0.319 β: 0.172
P: 0.202 R2: 0.046 b: 0.289 β: 0.215
R2: 0.729 b: 0 β: 0
- 0.435-0.788 cross 0
No mediation No Effect
p<0.01 b: 1.181 β: 0.857
P=0.896 b: -0.022 β: -0.012
Support, Feedback & Practice
p: 0.144 R2: 0.060 b: 0.404 β: 0.245
p: 0.055 R2: 0.101 b: 0.381 β: 0.318
R2: 0.666 b: 0 β: 0
-0.050 -0.989 cross 0
No mediation No Effect
p<0.01 b: 1.190 β: 0.863
P=0.756 b: -0.049 β: -0.030

73
A3.4 Mediation Effect of Motivation to Transfer in Blended Learning
X predicts
Y (c)
X predicts
M (a)
X&M together predicts Y Indirect Effects
Confidence Interval
(CI)
Remarks
M predicts
Y (b)
X no longer predicts Y or is lessened
predict Y (c’)
Supervisor Support p<0.01 R2: 0.414 b: 0.621 β: 0.644
p: 0.032 R2: 0.186 b: 0.371 β: 0.431
R2: 0.716 b: 0.253 β: 0.262
0.076-0.922 does not cross 0
Partial mediation p<0.01
b: 0.682 β: 0.608
p<0.01 b: 0.368 β: 0.381
Peer Support p<0.01 R2: 0.589 b: 1.105 β: 0.767
p<0.01 R2: 0.340 b: 0.749 β: 0.583
R2: 0.749 b: 0.414 β: 0.287
0.072 -1.117 does not cross 0
Partial mediation p<0.01
b: 0.553 β: 0.493
p<0.01 b: 0.691 β: 0.480
Transfer Resource Availability
p: 0.093 R2: 0.118 b: 0.593 β: 0.344
p<0.01 R2: 0.269 b: 0.798 β: 0.519
R2: 0.602 b: 0 β: 0
0.254-1.545 does not cross 0
No mediation No Effect
p<0.01 b: 0.911 β: 0.813
p:0.624 b: -0.135 β: -0.078
Motivation & Relevance
p<0.01 R2: 0.567 b: 0.927 β: 0.753
p<0.01 R2: 0.580 b: 0.837 β: 0.762
R2: 0.662 b: 0.927 β: 0.361
0.154-0.799 does not cross 0
Complete mediation p:0.021
b: 0.532 β: 0.475
p:0.053 b: 0.482 β: 0.392
Clear Goals p:0.965 R2: 0.0001 b: 0.011 β: 0.009
p: 0.368 R2: 0.035 b: 0.208 β: 0.188
R2: 0.616 b: 0 β: 0
-0.192-0.564 cross 0
No mediation No Effect
p<0.01 b: 0.896 β: 0.799
p:0.306 b: -0.175 β: -0.141
Learning p:0.017 R2: 0.221 b: 0.565 β: 0.471
p: 0.013 R2: 0.242 b: 0.527 β: 0.492
R2: 0.608 b: 0.565 β: 0.352
0.134-0.882 does not cross 0
Partial mediation p<0.01
b: 0.800 β: 0.714
P=0.445 b: 0.143 β: 0.119
Trainer Knowledge & Experience
P=0.092 R2: 0.118 b: 0.340 β: 0.344
P<0.01 R2: 0.389 b: 0.550 β: 0.624
R2: 0.600 b: 0 β: 0
- 0.435-0.788 cross 0
No mediation No Effect
p<0.01 b: 1.024 β: 0.914
P=0.187 b: -0.223 β: -0.226
Support, Feedback & Practice
p: 0.773 R2: 0.004 b: 0.070 β: 0.061
p: 0.480 R2: 0.022 b: 0.152 β: 0.148
R2: 0.666 b: 0 β: 0
-0.291 -0.455 cross 0
No mediation No Effect
p<0.01 b: 0.875 β: 0.781
P=0.690 b: -0.064 β: -0.055
Content Quality p: 0.012 R2: 0.243 b: 0.755 β: 0.493
p: 0.014 R2: 0.237 b: 0.665 β: 0.487
R2: 0.615 b: 0.755 β: 0.493
-0.016 -1.317 cross 0
Complete mediation
p<0.01 b: 0.783 β: 0.698
P=0.323 b: 0.234 β: 0.153
Technical System Quality
p: 0.800 R2: 0.003 b: -0.103 β: -0.053
p: 0.940 R2: 0.0003 b: 0.030 β: 0.018
R2: 0.602 b: 0 β: 0
-0.397 -2.102 cross 0
No mediation No Effect
p<0.01 b: 0.867 β: 0.774
P=0.624 b: -0.128 β: -0.067
Trainee’s Control p: 0.130 R2: 0.097 b: 0.704 β: 0.311
p: 0.020 R2: 0.215 b: 0.936 β: 0.464
R2: 0.600 b: 0 β: 0
0.237 -1.674 does not cross 0
No mediation No Effect
p<0.01 b: 0.897 β: 0.801
P=0.700 b: -0.136 β: -0.060
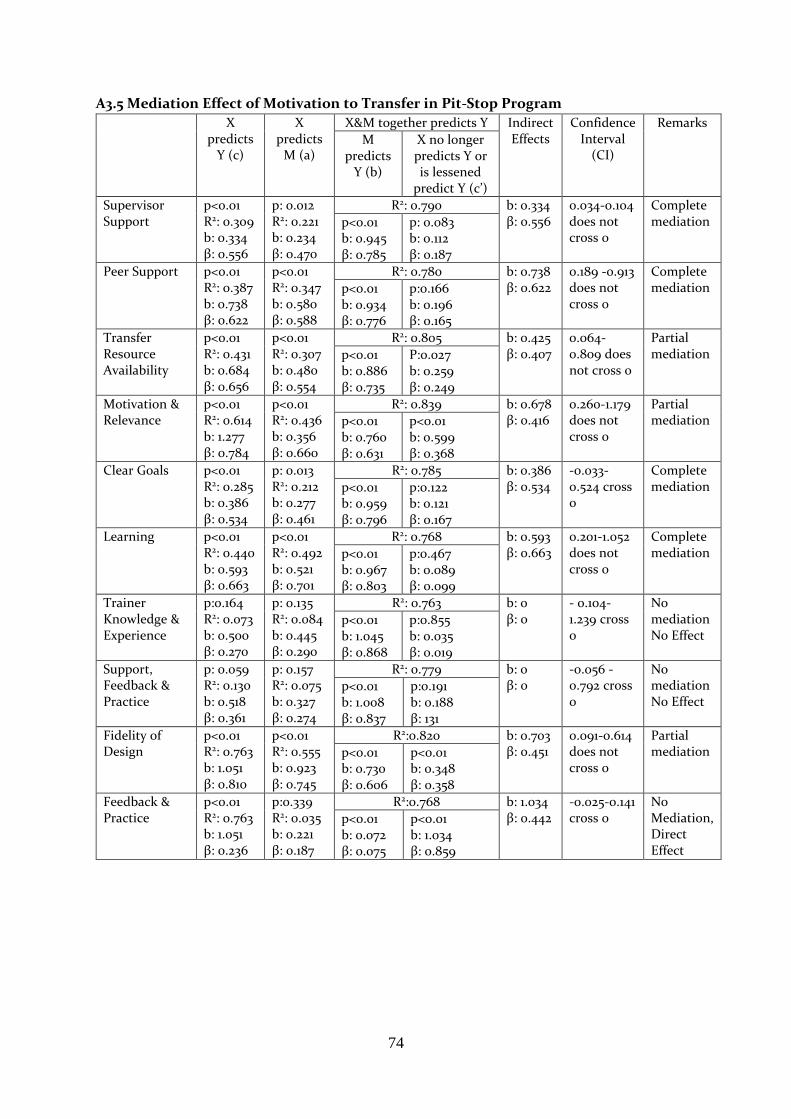
74
A3.5 Mediation Effect of Motivation to Transfer in Pit-Stop Program
X predicts
Y (c)
X predicts
M (a)
X&M together predicts Y Indirect Effects
Confidence Interval
(CI)
Remarks
M predicts
Y (b)
X no longer predicts Y or is lessened
predict Y (c’)
Supervisor Support
p<0.01 R2: 0.309 b: 0.334 β: 0.556
p: 0.012 R2: 0.221 b: 0.234 β: 0.470
R2: 0.790 b: 0.334 β: 0.556
0.034-0.104 does not cross 0
Complete mediation p<0.01
b: 0.945 β: 0.785
p: 0.083 b: 0.112 β: 0.187
Peer Support p<0.01 R2: 0.387 b: 0.738 β: 0.622
p<0.01 R2: 0.347 b: 0.580 β: 0.588
R2: 0.780 b: 0.738 β: 0.622
0.189 -0.913 does not cross 0
Complete mediation p<0.01
b: 0.934 β: 0.776
p:0.166 b: 0.196 β: 0.165
Transfer Resource Availability
p<0.01 R2: 0.431 b: 0.684 β: 0.656
p<0.01 R2: 0.307 b: 0.480 β: 0.554
R2: 0.805 b: 0.425 β: 0.407
0.064-0.809 does not cross 0
Partial mediation p<0.01
b: 0.886 β: 0.735
P:0.027 b: 0.259 β: 0.249
Motivation & Relevance
p<0.01 R2: 0.614 b: 1.277 β: 0.784
p<0.01 R2: 0.436 b: 0.356 β: 0.660
R2: 0.839 b: 0.678 β: 0.416
0.260-1.179 does not cross 0
Partial mediation p<0.01
b: 0.760 β: 0.631
p<0.01 b: 0.599 β: 0.368
Clear Goals p<0.01 R2: 0.285 b: 0.386 β: 0.534
p: 0.013 R2: 0.212 b: 0.277 β: 0.461
R2: 0.785 b: 0.386 β: 0.534
-0.033-0.524 cross 0
Complete mediation p<0.01
b: 0.959 β: 0.796
p:0.122 b: 0.121 β: 0.167
Learning p<0.01 R2: 0.440 b: 0.593 β: 0.663
p<0.01 R2: 0.492 b: 0.521 β: 0.701
R2: 0.768 b: 0.593 β: 0.663
0.201-1.052 does not cross 0
Complete mediation p<0.01
b: 0.967 β: 0.803
p:0.467 b: 0.089 β: 0.099
Trainer Knowledge & Experience
p:0.164 R2: 0.073 b: 0.500 β: 0.270
p: 0.135 R2: 0.084 b: 0.445 β: 0.290
R2: 0.763 b: 0 β: 0
- 0.104-1.239 cross 0
No mediation No Effect
p<0.01 b: 1.045 β: 0.868
p:0.855 b: 0.035 β: 0.019
Support, Feedback & Practice
p: 0.059 R2: 0.130 b: 0.518 β: 0.361
p: 0.157 R2: 0.075 b: 0.327 β: 0.274
R2: 0.779 b: 0 β: 0
-0.056 -0.792 cross 0
No mediation No Effect
p<0.01 b: 1.008 β: 0.837
p:0.191 b: 0.188 β: 131
Fidelity of Design
p<0.01 R2: 0.763 b: 1.051 β: 0.810
p<0.01 R2: 0.555 b: 0.923 β: 0.745
R2:0.820 b: 0.703 β: 0.451
0.091-0.614 does not cross 0
Partial mediation p<0.01
b: 0.730 β: 0.606
p<0.01 b: 0.348 β: 0.358
Feedback & Practice
p<0.01 R2: 0.763 b: 1.051 β: 0.236
p:0.339 R2: 0.035 b: 0.221 β: 0.187
R2:0.768 b: 1.034 β: 0.442
-0.025-0.141 cross 0
No Mediation, Direct Effect
p<0.01 b: 0.072 β: 0.075
p<0.01 b: 1.034 β: 0.859

75
A3.6 Correlation Matrix of Soft Skill Classroom Training
Mean Std. Deviati
on 1 2 3 4 5 6 7 8 9 10 11 1) Motivation & Relevance
5.818 0.655 (0.790)
2) Clear Goals 5.108 1.075 .523** (0.664)
3) Trainer Knowledge & Experience
6.365 0.652 .205 .036 (0.688)
4) Support, Feedback & Practice
5.912 0.734 .584** .143 .418* (0.691)
5) Motivation to Transfer
5.561 0.879 .595** .409* .233 .370* (0.905)
6) Transfer Resource Availability
5.527 0.979 .235 .332* .387* .213 .547** (0.893)
7) Supervisor Support
4.330 1.372 .407* .385* .086 .185 .513** .391* (0.925)
8) Peer Support 3.072 0.733 .450** .228 .126 .123 .588** .345* .615** (0.834)
9) Learning 5.851 0.696 .400* .347* .356* .211 .580** .475** .498** .621** (0.688)
10) Opportunity & Implementation of Transfer
5.203 1.212 .502** .462** .325* .208 .837** .633** .528** .612** .532** (0.951)
11) Training Rate 7.811 1.474 .461** .355* .408* .378* .578** .352* .308 .451** .509** .606**
**. Correlation is significant at the 0.01 level (2-tailed).
*. Correlation is significant at the 0.05 level (2-tailed).
Diagonal values with brackets show Cronbach’s alpha
N: 37 responses

76
A3.7 Correlation Matrix of Blended Learning
Mean Std. Deviation 1 2 3 4 5 6 7 8 9 10 11 12 13 14
1) Motivation & Relevance
5.340 1.050 (0.886)
2) Clear Goals 5.440 1.044 .038 (0.680)
3) Trainer Knowledge & Experience
5.380 1.309 .464* -.016 (0.921)
4) Support, Feedback & Practice
4.890 1.123 .245 .256 .594** (0.750)
5) Motivation to Transfer
5.290 1.154 .655** .277 .522** .202 (0.893)
6) Content Quality
5.480 0.907 .382 -.105 .165 -.059 .244 (0.721)
7) Technical System Quality
5.720 0.792 .552** -.063 .463* .240 .462* .389 (0.605)
8) Trainee Control
5.747 0.572 .350 .249 .221 .056 .482* .194 .452* (0.724)
9) Transfer Resource Availability
5.600 0.750 .550** .308 .526** .428* .504* .170 .458* .481* (0.693)
10) Supervisor Support
4.608 1.340 .695** .034 .225 .120 .602** .296 .577** .262 .363 (0.949)
11) Peer Support 3.173 0.898 .613** .182 .273 .216 .678** .295 .431* .298 .424* .730** (0.908)
12) Learning 5.580 1.077 .601** .168 .477* .141 .529** .015 .373 .406* .338 .397* .506** (0.884)
13) Opportunity & Implementation of Transfer
5.200 1.293 .799** .091 .395 .152 .800** .441* .390 .392 .455* .659** .757** .572** (0.895)
14) Training Rate 7.280 1.242 .695** -.005 .534** .186 .778** .179 .424* .394 .373 .587** .485* .619** .716**
*. Correlation is significant at the 0.05 level (2-tailed).
**. Correlation is significant at the 0.01 level (2-tailed).
Diagonal values with brackets show Cronbach’s alpha
N=25

77
A3.8 Correlation Matrix of Pit-Stop Program
Mean Std. Deviation 1 2 3 4 5 6 7 8 9 10 11 12
1) Motivation & Relevance
6.054 0.529 (0.542)
2) Clear Goals 5.571 1.192 .246 (0.884)
3) Trainer Knowledge & Experience
6.571 0.466 .291 .140 (0.854)
4) Support, Feedback & Practice
6.268 0.601 .213 -.114 .534** (0.717)
5) Motivation to Transfer 5.759 0.715 .550** .241 .164 .202 (0.867)
6) Business Case Design 5.339 0.757 .447* .142 .285 .457* .576** (0.807)
7) Transfer Resource Availability
5.643 0.826 .486** .218 .355 .614** .414* .570** (0.899)
8) Supervisor Support 4.707 1.436 .356 .319 .238 .221 .372 .507** .448* (0.932)
9) Peer Support 3.000 0.726 .290 -.016 .069 -.016 .501** .405* .112 .309 (0.778)
10) Learning 5.839 0.963 .382* .106 .281 .511** .559** .531** .429* .101 .318 (0.699)
11) Opportunity & Implementation of Transfer
5.411 0.861 .633** .335 .158 .198 .740** .687** .443* .598** .427* .301 (0.904)
12) Training Rate 8.607 0.699 .288 .264 .588** .433* .220 .237 .287 .355 .107 .374* .229
**. Correlation is significant at the 0.01 level (2-tailed).
*. Correlation is significant at the 0.05 level (2-tailed).
Diagonal values with brackets show Cronbach’s alpha
N=28

78
Appendix 4 – Adjustment of scales The scale adjustment follows the process explained by IBM (2010).
To adjust scale from 1-10 to 1-7, there are two steps that should be done:
1. Find a linear formula that can transform the scale to have 0 as the minimum, and 1 as
maximum. The formula is:
X = (x-a)/(b-a)
Where:
a = minimum of initial scale (in this case is 10)
b = maximum of initial scale (in this case is 1)
x = the initial scale (1,2,….10)
2. Find a linear formula that undo the first formula to become the desired scale. The formula is:
Y = (B-A) * X + A
Where:
Y = the final transformed scale
A = minimum of desired scale (in this case is 7)
B = maximum of desired scale (in this case is 1)
X = the transformed initial scale as the result of formula in explanation no.1
To put the formula together, the formula to change the scale becomes:
Y = (B-A) * ((x-a)/(b-a)) + A
To adjust scale from 1-10 to 1-7, the formula becomes:
Y = (7-1) * ((x-1)/(10-1)) + 1
Y = 6/9 x - 6/9 + 1
Y = 6/9 x + 3/9
This formula is used to transformed the scale in SPSS.

79
Appendix 5 – Example Illustration of Recommended Evaluation Report
Program Subject: E-learning Basic Excel Participants: 20 Survey Respondent: 18
No Items Average
Score Weighted Factor Score
Average of All Programs
Motivation & Relevance 2.1 1.5
1 This training motivated me to learn as much as I can
5.2
………
Clear Goals 0.4 0.9
5 I had specific, clear training goals to aim for during this training program.
3.6
……….
Learning 0.9 0.6
7 After this training, I know substantially more about the training contents than before.
4.8
……….
Content Quality 0.6 0.4
9 The content of the training program was up-to-date.
4.5
………
Technical System Quality 1.8 1.2
12 The e-learning site could quickly load all the texts and graphics/videos
3.5
………
Trainee’s control 0.5 0.5
13 The e-learning program let me decide on my own at what times and where I am learning (e.g., at the office, at home)
6.9
……..
Total Score 6.3 5.1
16 Personal Rating 8 7
Recommendation to other people: Yes: 12 ; No: 8 Other recommendations:
……… (Based on the answers to open question about recommendations for the program, and or
explanation in each variables)


