ENVIRONMENTALHEALTH PERSPECTIVES
Neurobehavioral Function in School-Age Children Exposed to Manganese in Drinking Water
Youssef Oulhote, Donna Mergler, Benoit Barbeau, David C. Bellinger, Thérèse Bouffard, Marie-Ève Brodeur,
Dave Saint-Amour, Melissa Legrand, Sébastien Sauvé, and Maryse F. Bouchard
http://dx.doi.org/10.1289/ehp.1307918Received: 21 November 2013Accepted: 25 September 2014
Advance Publication: 26 September 2014
http://www.ehponline.org
ehp
Neurobehavioral Function in School-Age Children Exposed to
Manganese in Drinking Water
Youssef Oulhote,1,2 Donna Mergler,3 Benoit Barbeau,4 David C. Bellinger,5 Thérèse Bouffard,6
Marie-Ève Brodeur,2 Dave Saint-Amour,2,6 Melissa Legrand,7 Sébastien Sauvé,8 and Maryse F.
Bouchard,1,2
1Department of Environmental and Occupational Health, Université de Montréal, Canada;
2CHU Sainte-Justine Mother and Child University Hospital Research Center, Montréal, Canada;
3Centre for Interdisciplinary Studies in Biology, Health, Society and Environment (CINBIOSE),
Université du Québec à Montréal, Canada; 4Department of Civil, Geological and Mining
Engineering, École Polytechnique de Montréal, Canada; 5Department of Environmental Health,
Harvard School of Public Health, Boston, Massachusetts, USA; 6Department of Psychology,
Université du Québec à Montréal, Canada; 7Department of Family Medicine, Ottawa Hospital,
University of Ottawa, Canada; 8Department of Chemistry, Université de Montréal, Canada
Address correspondence to Maryse Bouchard, Université de Montréal, Department of
Environmental and Occupational Health, 2375 chemin de la Côte Ste-Catherine, Room 7081,
Montréal, Québec, Canada. E-mail: [email protected]
Running title: Manganese and children's neurobehavioral function
Acknowledgment: This research was supported by the Canadian Institutes for Health Research.
Competing financial interests: The authors declare they have no actual or potential competing
financial interests.
1
Abstract
Background: Manganese neurotoxicity is well documented in individuals occupationally
exposed to airborne particulates, but few data are available on risks from drinking water
exposure.
Objective: We examined associations of manganese exposure from water and hair manganese
concentration with memory, attention, motor function, and parent- and teacher-reported
hyperactive behaviors.
Methods: We recruited 375 children and measured manganese in home tap water (MnW) and
hair (MnH). We estimated manganese intake from water ingestion. Using structural equation
modeling, we estimated associations between neurobehavioral functions and MnH, MnW, and
manganese intake from water. Exposure-response relationships were evaluated using generalized
additive models.
Results: After adjusting for potential confounders, a standard deviation (SD) increase in log10
MnH was associated with a significant difference of -24% (95% CI: -36, -12%) SD in memory
and -25% (95% CI: -41, -9%) SD in attention. The relations between log10 MnH and poorer
memory and attention were linear. A SD increase in log10 MnW was associated with a significant
difference of -14% (95% CI: -24, -4%) SD in memory, and this relation was nonlinear, with a
steeper decline in performance at MnW above 100 µg/L. A SD increase in log10 manganese
intake from water was associated with a significant difference of -11% (95% CI: -21, -0.4%) SD
in motor function. The relation between log10 manganese intake and poorer motor function was
linear. There was no significant association between manganese exposure and hyperactivity.
Conclusion: Exposure to manganese in water was associated with poorer neurobehavioral
performances in children, even at low levels commonly encountered in North America.
2
Introduction
Manganese (Mn) is widespread in the environment (ATSDR 2012). It is an essential element,
required for the function of many enzymes and involved in oxidative stress protection, as well as
in the formation of connective tissue and bone. However, inhaled manganese is a potent
neurotoxicant with well-documented effects in workplace settings (ATSDR 2012). Recent
epidemiologic studies suggest that manganese exposure from drinking water is associated with
poorer cognition and behavioral problems (Zoni and Lucchini 2013). High levels of manganese
in water (MnW) are common in groundwater since this element leaches from manganese-bearing
minerals and rocks into the aquifers (Groschen et al. 2009).
Studies in Bangladesh among children exposed to high MnW reported associations with lower
IQ scores (Wasserman et al. 2006), impaired perceptual reasoning, and working memory
(Wasserman et al. 2011), poorer academic achievement scores in mathematics (but not language)
(Khan et al. 2012), as well as internalizing and externalizing problems (Khan et al. 2011). In
addition, we reported findings from two separate investigations conducted in Quebec (Canada) at
MnW levels much lower than those in Bangladesh. In our pilot study, hair manganese levels
(MnH) were associated with hyperactive and oppositional behaviors in children (Bouchard et al.
2007), and in the epidemiological study that followed, MnW was associated with lower IQ
scores (Bouchard et al. 2011). On average, we estimated that there was a 6.2-point difference in
IQ between children in the lowest and highest MnW quintiles.
A neurobehavioral test battery is often employed in studies aiming to identify neurotoxic effects
of environmental exposures. This assessment typically results in a large number of scores used as
outcomes, raising the problem of multiple testing. To avoid this issue, investigators often select a
3
few test scores thought to be the most sensitive to detect neurotoxic effects associated with a
given contaminant. This selection, however, is difficult since different studies often report
slightly different findings. Although these apparent discrepancies could result from differences in
the tests employed, they could also be partly due to measurement errors in the neurobehavioral
assessment. A better approach would be to consider test scores as measurements of an
underlying neurobehavioral function, and use several scores as indicators for this function.
Structural equation modeling (SEM) can be used to implement this approach, in which several
different but related scores are used as indicators of a more global neurobehavioral domain,
resulting in a more comprehensive assessment of the domain. In addition, this approach greatly
reduces the number of outcomes (since several test scores are aggregated), therefore avoiding
inference errors arising from multiple comparisons (Sanchez et al. 2005).
We conducted a cross-sectional study among 375 children exposed to a relatively wide range of
MnW in Quebec (Canada), where the presence of manganese is naturally elevated. We
previously reported lower IQ scores with higher MnW, MnH, and manganese intake from water
ingestion (Bouchard et al. 2011). In the present study, we report the relation between these same
manganese exposure indicators and neurobehavioral functions (memory, attention, motor
function, and hyperactivity) in these children.
Materials and Methods
Study design and recruitment
This cross-sectional study was conducted in eight municipalities located in southern Quebec
(Canada) in 2007-2009. Municipalities were considered as potential study sites if their aqueduct
was supplied by groundwater, and were selected to achieve a gradient of MnW. However, we did
4
not limit our recruitment to children living in houses connected to the aqueduct, and many
participating children lived in a house with a private well (we had no information on the MnW in
private wells prior to recruitement). Children were recruited through elementary schools in the
selected municipalities, restricting enrollment to children who had lived in the same house for
more than three months to ensure that the measured MnW was representative of the water
children had been consuming for at least this duration. A total of 375 children aged 6 to 13 years
participated in the study. The Human Research Ethics Board of the Université du Québec à
Montréal approved the study protocol, and parents signed an informed consent.
Manganese in water and hair
We collected a water sample directly from the kitchen tap in each home. For homes that had a
point-of-use filter attached to the tap, we collected one sample of filtered water, and a second
sample with the filter removed. We used the following procedure to standardize tap water
sampling (van den Hoven and Slaats 2006): a) open the tap for 5 min, b) close and leave
untouched for 30 min, and c) collect first draw. We added 0.15 mL nitric acid (50%) to the 50-
mL water sample and stored samples at 4°C. Manganese and other metals (As, Cu, Pb, Fe, and
Zn) were measured by inductively coupled plasma mass spectrometry (ICP-MS) at the
Environmental Chemistry Laboratory of McGill University. Further details about analytical
techniques and quality assurance and control procedures can be found in Barbeau et al. (2011).
For a subset of participants (n=30 houses), we repeated tap water sampling four times (once per
season) during one year to examine seasonal variability of MnW. Analysis of these data
indicated an intraclass correlation coefficient of 0.91, indicating very little temporal variability in
MnW concentrations (Bouchard et al. 2011).
5
Duplicate hair samples of approximately 20 mg were taken from the occiput of each child,
cutting as close as possible to the root. We used the two cm closest to the scalp to measure
manganese and other metals by ICP-MS in the laboratory of co-author S. Sauvé at Université de
Montréal. Children were excluded from analysis when they reported using hair dye in the last
five months because it could influence manganese hair content (Sky-Peck 1990). When
manganese concentrations for certified hair material were outside of the designated
concentrations, we excluded the measures from the analyses; we therefore had valid MnH
measures for 313 children. When there was only one available measure (n=45), due to
contamination or insufficient hair for duplicates, the sole measure was retained for the statistical
analyses; for the others, the mean of duplicates was used (n=268). Further methodological details
can be found in supplemental material (Supplemental Material: Measurements of manganese hair
concentration).
Manganese intake from water ingestion
During the home visit, we orally administered a semi-quantitative food frequency questionnaire
to the parent and the child to assess manganese intake from water consumption, including direct
water ingestion and water incorporated in food preparations (e.g., juices made from concentrate,
soups, etc.) during the preceding month. We estimated water consumption from different
sources—bottled, tap, tap filtered with a pitcher, and tap with an attached filter. For each water
source, the amount consumed was multiplied by the measured or estimated concentration of
manganese. We then divided the estimated intake by the weight of the child to derive an estimate
of monthly intake in µg/kg. For untreated tap water and tap water treated with a carbon filter
attached to the tap, the measured concentrations were used in the calculation. We conducted
experiments to assess Mn removal efficacy for water filtered by a pitcher with activated carbon
6
and an ion-exchange resin filter, showing an average Mn removal efficacy of 74% (Carriere et al.
2011), which we used in our calculations. For bottled water, we attributed a concentration of 0
µg/L based on a survey of bottled water in Canada that reported a median < 1 µg/L for
manganese concentration (Dabeka et al. 2002).
Assessment of neurobehavioral function
Each child completed the following test battery: California Verbal Learning Test–Children's
Version (CVLT) (Delis et al. 1994), Conners' Continuous Performance Test II Version 5 (CPT
II) (Conners 2004), Digit Span, Santa Ana Test, and manual Fingertapping (Lafayette 2002). The
Wechsler Abbreviated Scale of Intelligence (Wechsler 1999) was also administered, and the
relation with manganese exposure was published elsewhere (Bouchard et al. 2011). The
Conners’ Rating Scales were completed by a teacher (CRS-T) and a parent (CRS-P) (Conners
2000).
Potential confounders
We collected information from the mother on socio-economic status indicators and other
variables (e.g., alcohol and tobacco consumption during pregnancy), and we assessed maternal
non-verbal intelligence with the Raven’s Progressive Matrices Test (Raven et al. 2003) and
maternal symptoms of depression with the Beck Depression Inventory-II (BDI-II) (Beck et al.
1996). Potential confounders were chosen a priori based on established associations and/or
plausible relations with the outcomes (Brooks-Gunn et al. 1996; Claus Henn et al. 2010; Neisser
et al. 1996), and included child’s sex, age (years, continuous), maternal education (not completed
high school/completed high school/some college/some university), non-verbal maternal
intelligence (Raven score, continuous), family income (nine categories with 10k$ increment
7
between two categories, entered as an ordinal variable), maternal depressive symptoms (Beck-II
score, continuous), and lead concentration in tap water (log10 transformed). In addition, we used
sensitivity analyses to assess the influence of additional adjustment for tap water arsenic
concentration (log10 transformed), water source (aqueduct or private well), child’s test
administrator, birth weight, maternal smoking and alcohol consumption during pregnancy
(entered one at the time in the models).
Statistical analysis
We used SEM to examine relationships between exposure to manganese and children’s
neurobehavioral functions (Sanchez et al. 2005). We built three models using different variables
to quantify manganese exposure (Figure 1). First, we constructed a latent manganese exposure
variable that is an underlying construct of measured MnH. In this model, we postulate that
internal manganese loading is manifested by MnH and that this also depends on manganese
intake from water ingestion. Second, given that there is no consensus that hair is a good
biomarker of exposure to manganese (Eastman et al. 2013), we used MnW as the latent variable
for manganese exposure. For the third model, we used the estimated intake of manganese from
water ingestion as the indicator for the exposure latent variable to account for variation in the
amount of water consumed by each child and the child’s weight.
Children’s scores on the neurobehavioral tests were used as indicators of four latent variables
representative of underlying neurobehavioral domains: memory, attention, motor function, and
hyperactivity (see Figure 1). We constructed these latent variables using a confirmatory factor
analysis allowing good discriminant validity between the factors. We also took into account the
response modalities of outcome scores in accordance with SEM guidelines, especially for
normality and the number of unique values (Kline 2011). To correct for local dependence when 8
the correlation between the indicators could not be fully explained by the underlying latent
variable, we allowed measurement errors of several outcomes indicating the same
neurobehavioral function to correlate. We tested goodness of model fit using several indices (see
Supplemental Material, Table S1).
The distributions of manganese exposure indicators (MnH, MnW, manganese intake from water
consumption) and water lead concentrations were skewed, and were therefore log-transformed
(base 10). The results are presented as the adjusted change in the latent variables for
neurobehavioral functions (ß) associated with a 10-fold increase in manganese exposure
indicators. Since ß has no unit, we also present standardized association estimates, expressed as
the change in % of standard deviation (SD) of neurobehavioral function scores associated with a
1-SD increase in log10 transformed manganese exposure indicators. Some test scores were
missing for some children, i.e. CPT II (n=9), Digit Span (n=14), Santa Ana (n=2), CRS-P (n=1),
and CRS-T (n=53). We imputed missing data using the full information maximum likelihood
method (Arbuckle 1996). In sensitivity analyses, we restricted our models to children with no
missing data, and we included additional covariates in the models (listed in Potential
Confounders). Finally, we explored effect modification by sex using multigroup SEM analyses.
Since SEM models data linearly, we also used generalized additive models (GAMs) with
penalized smoothing regression splines in order to detect possible nonlinear relations. We
extracted the scores from the factor analytic component of the SEM and used them as outcome
variables, adjusting for covariates. Manganese exposure indicators were introduced as spline
functions. We examined departure from linearity using analysis of variance to assess the
difference between the model with manganese levels introduced as a spline function and the
model with manganese levels introduced as a linear term. To estimate thresholds for effect, we
9
looked for the manganese level above which the estimated adjusted change in function was lower
than the 95% confidence interval (CI) lower bound of the intercept (i.e., neurobehavioral score at
the lowest manganese concentration).
All the outcomes variables were continuous; however, because some of them were not normally
distributed, we used maximum likelihood estimation with robust (Huber-White) standard errors
(Huber 1967). The threshold for statistical significance was set to 0.05 (two-sided tests). We
used the lavaan (Rosseel 2012) and mgcv (Wood 2011) packages in R (RCoreTeam 2013).
Finally, to assess the consistency of the SEM approach with a more traditional approach, we
used general linear models to estimate the associations between manganese exposure indicators
and individual test scores, adjusting for the same set of confounders.
Results
Descriptive statistics
Table 1 shows the characteristics of children in the study, as well as levels of manganese
exposure indicators. Almost all the children were white (99%) (data not shown), and 76% of
mothers had at least some college education. Thirty five percent of children resided in their
current residence from birth, and most children (66%) had resided for more than five years in
their present home, based on residential history collected from parent. About half of participating
children lived in a house connected to the aqueduct, and the other half in a house with a private
well (51% and 49%, respectively). Tap water MnW ranged from 1 to 2701 µg/L, with an
arithmetic mean of 99 µg/L and a geometric mean (GM) of 20 µg/L, whereas estimated
manganese intake from water ingestion ranged from 0 to 1059 µg/kg/month with a GM of 5.5
µg/kg/month. There were 4.3% of homes with water levels of manganese above the U.S health
10
reference value of 300 µg/L (U.S. EPA 2003), and 43.7 % exceeding the aesthetic level of 50
µg/L for manganese in drinking water (Health Canada 1979), above which the taste, smell, or
color of water might be impaired. Water levels of arsenic and lead were elevated (≥ 10 µg/L) for
4% and 0.5% of children, respectively (data not shown). The Pearson correlation of MnW with
other elements was 0.68 (iron), 0.26 (zinc), 0.11 (copper), 0.06 (arsenic), and –0.02 (lead).
In univariate analyses, there was no significant difference in MnW with respect to children’s sex
and age, family income, maternal education, maternal depression, and maternal intelligence
(Table 1). However, MnW was significantly higher in children living in homes connected to the
aqueduct than for children living in homes with a private well (geometric mean of 54.0 versus
8.2 µg/L, p<0.001). Univariate associations with estimated manganese intake from water
ingestion were consistent with those for MnW (data not shown).
Children’s MnH ranged from 0.1 to 20.7 µg/g with an arithmetic mean of 1.4 µg/g and a GM of
0.8 µg/g. In univariate analyses, MnH levels did not vary significantly with respect to children’s
sex or age, or with maternal education or depressive symptoms (Table 1). However, MnH was
higher in children living in homes connected to the aqueduct than for those living in homes with
a private well, and MnH was also higher in children with family’s income below 50Kcan$ than
in those with a higher income (both at p=0.02). In addition, MnH differed significantly between
maternal intelligence score categories (p=0.04) (Table 1), but this association was no longer
significant after additional adjustment for mother’s test administrator (p=0.17) (data not shown).
Structural equation model ing (SEM)
Table 2 describes the factor loadings and estimated correlation of measured variables to each of
the latent variables for neurobehavioral functions when MnH was the exposure (model 1). All
11
test scores had good factor loadings and were adequate as indicators of latent variables, and this
was similar when exposure was based on MnW and estimated Mn intake from water ingestion
(models 2 and 3, respectively, data not shown). It should be noted that higher scores for memory,
attention, and motor functions indicate better performance, but higher scores for hyperactivity
suggest more problems related to hyperactivity.
In the first model, which was based on MnH, a tenfold increase in MnH was significantly
associated with differences of -3.6 points (95% CI: -5.2, -2.0) on the memory function and -4.2
points (95% CI: -6.7, -1.7) on the attention function (both at p<0.01), after adjustment for
confounders (Table 3). In standardized results, a 1-SD increase in log10-MnH was associated
with lower memory (-24% SD; 95% CI: -36, -12%) and attention (-25% SD; 95% CI: -41, -9%)
functions. No significant association was found between MnH and motor function (p=0.57). The
scores for hyperactivity tended to be lower (indicating less hyperactivity problems) for higher
MnH with a difference of -2.0 points (95% CI: -4.6, 0.6; p=0.13) for a tenfold increase in MnH
(Table 3).
In the second model where MnW was the exposure indicator, a tenfold increase in MnW was
associated with a significant difference of -1.0 point (95% CI: -1.6, -0.4; p<0.01) of the memory
function and a non-significant difference of -1.2 point (95% CI: -2.7, 0.3; p=0.11) of the motor
function. In standardized results, one SD increase in log10-MnW was associated with memory
function lower by -14% SD (95% CI: -24, -4%). No significant association was found between
MnW and attention or hyperactivity functions.
The third model showed a significant association between estimated manganese intake from
water consumption and motor function. A tenfold increase in manganese intake was significantly
12
associated with a difference of -1.3 points (95% CI: -2.4, -0.2; p=0.02) on the motor function. In
standardized results, a 1-SD increase in log10 manganese intake was associated with motor
function lower by -11% SD (95% CI: -21, -0.4%). The scores for memory tended to be lower for
higher manganese intake with a difference of -0.4 points (95% CI: -0.9, 0.1; p=0.13) for a tenfold
increase in manganese intake from water ingestion (Table 3). No significant association was
found between manganese intake from water consumption and attention or hyperactivity
functions.
We assessed whether sex modifies the associations between manganese exposure indicators and
neurobehavioral functions, and found that the association estimates for boys and girls were very
similar (data not shown).
Separate models for each neurobehavioral function resulted in similar estimates (data not shown)
as the model taking into account all the four functions at the same time. Likewise, the model
including only children without missing data, and the model with additional adjustment for water
arsenic concentrations, birth weight, maternal smoking, and alcohol consumption during
pregnancy resulted in very similar effect estimates (data not shown).
General additive models to ex amine shape of the exposure-response relations
We explored the shape of the exposure-response relation with GAMs for the constructed
neurobehavioral functions, as shown in Figure 2 for MnH, Figure 3 for MnW, and in Figure 4 for
estimated manganese intake from water ingestion. MnH was significantly associated with poorer
memory and attention (p<0.001) with no significant departure from linearity (p=0.1 for memory
and attention; Figure 2a and 2b, respectively). For motor function, the association was significant
(p=0.02), and departed significantly from linearity (p<0.01), with a slight increase at
13
concentrations between 0.3 and 0.8 µg/g, and an apparent decrease in scores at MnH above 10
µg/g, but there were very few observations with such high levels (Figure 2c). The association for
hyperactivity was not significant (p=0.22) (Figure 2d).
In the GAM, children had significantly lower scores of memory with higher MnW (p<0.001),
and the relationship departed significantly from linearity (p=0.045), with a steeper slope at levels
above 100 µg/L than at lower concentrations (Figure 3a). No significant association was found
between MnW and attention (p=0.1) (Figure 3b). For motor function, the association with MnW
was significant (p<0.001), and departed significantly from linearity (p<0.001), with a threshold
indicating that scores decreased more steeply at concentrations above 180 µg/L (Figure 3c). No
significant association was observed for hyperactivity (p=0.47) (Figure 3d).
With GAM, estimated manganese intake from water ingestion was significantly associated with
memory function (p=0.038) in the GAM, and the function departed significantly from linearity
(p=0.04) (Figure 4a). No significant association was found for attention function (p=0.88)
(Figure 4b). For motor function, there was a significant association with manganese intake from
water ingestion (p<0.001) with no significant departure from linearity (p=0.99) (Figure 4c).
Finally, there was no significant association between manganese intake from water ingestion and
hyperactivity (p=0.44)(Figure 4d).
Supplemental Material, Table S2, shows estimated associations from general linear models of
individual neurobehavioral test scores. The results were very consistent with the findings from
SEM and GAM analyses.
14
Discussion
We report that higher levels of exposure to manganese in drinking water were associated with
poorer performance of memory, attention, and motor functions, but not hyperactivity, in
children. We estimated log-linear relationships between hair manganese and memory and
attention functions and between manganese intake from water ingestion and motor function. The
relationships for MnW exhibited a non-linear shape, with steeper decreases in memory and
motor functions at MnW levels above 100 and 180 µg/L, respectively. These findings
complement the previously reported association between the same three manganese exposure
indicators (MnW, MnH, and manganese intake from water ingestion) with lower IQ scores in
this same group of children (Bouchard et al. 2011). Furthermore, they are consistent with recent
studies reporting adverse associations of manganese exposure with scores on tests of cognitive
and motor functions (Zoni and Lucchini 2013). We did not observe a significant association with
hyperactivity as previously reported (Bouchard et al. 2007; Khan et al. 2011) but MnW levels in
the present study were considerably lower (GM for present study: 20 µg/L, compared with ≈300
µg/L [Bouchard et al. 2007], and ≈900 µg/L [Khan et al. 2011]).
Several mechanisms might underlie the association between manganese exposure and
neurobehavioral outcomes. Studies have shown that manganese accumulates in the basal ganglia,
white matter, and cortical structures (Guilarte et al. 2006). In animal models, manganese
exposure disrupts the dopaminergic, glutamatergic, and serotonin systems (Moreno et al. 2009;
Tran et al. 2002) that are essential to optimal cognitive functioning. Changes in gene expression
(i.e. amyloid beta precursor-like protein) and markers of neurodegeneration in the frontal cortex
(i.e. copper homeostasis dysregulation) induced by chronic manganese exposure may also
underlie neurobehavioral changes (Guilarte et al. 2008; Schneider et al. 2009).
15

The present study presents several strengths. We thoroughly assessed potential confounders,
adjusting for several socioeconomic status indicators, as well as maternal intelligence and
depression symptoms, and water lead concentrations. Furthermore, our results were robust to
additional adjustment for water arsenic concentration, water source, child’s test administrator,
birth weight, maternal smoking and alcohol consumption during pregnancy. SEM allowed the
simultaneous use of several indicators to better assess neurobehavioral functions, as well as
integration of different exposure indicators (Budtz-Jorgensen et al. 2002). In addition, the SEM
approach addresses issues arising from multiple testing and missing data that may not be
adequately considered by standard regression analyses. The SEM findings were compared with
the more traditional approach consisting in analyzing each test score separately, and the findings
were consistent.
There is no consensus on the best biomarker to assess exposure to manganese. Blood and urine
manganese content have been shown to correlate poorly with manganese exposure (Smith et al.
2007). In population studies, hair manganese concentration has often been used as a biomarker of
exposure. Significant correlations between exposure to manganese and hair manganese
concentration have been reported in several studies (Agusa et al. 2006; Bader et al. 1999)
including ours (Bouchard et al. 2007; Bouchard et al. 2011), supporting the contention that hair
is a valid biomarker of manganese exposure. As the hair grows slowly, the composition reflects a
time-weighted exposure over several months, which is appropriate since long-term exposure is
postulated to cause neurotoxic effects. However, the use of hair as a biomarker has been
criticized because of potential external contamination that is not removable by washing the
samples prior to analysis (Eastman et al. 2013), which in the present case could result from
bathing or showering in manganese-contaminated water.
16
There are several limitations to this study. The reported associations could be attributable to
unmeasured confounders, but MnW did not vary with socioeconomic factors, thus reducing the
potential for confounding. Nonetheless, possible residual or additional unmeasured confounding
by other factors cannot be ruled out. However, our findings are not likely to be explained by
anthropogenic contaminants, because in our study area, the contamination of water by
manganese results from natural processes associated with the bedrock geology, and not human
activities. There are no industrial sources of manganese emission in the study area, and the
gasoline additive methylcyclopentadienyl manganese tricarbonyl (MMT) is no longer used in
Canada since 2004 (Finkelstein and Jerrett 2007). A study (Bolté et al. 2004) showed very low
atmospheric manganese concentrations in rural areas of Quebec, with a mean of 0.005 µg/m3;
this is 10 times lower than the U.S. EPA inhalation reference concentration of 0.05 µg/m3 (U.S.
EPA 1993).
The cross-sectional design of the study limits the possibility to draw strong causal inferences,
although reverse causality is improbable. It is not known whether exposure during a critical
developmental period is responsible for our observations. The majority (66%) of participating
children had been living in the same home for at least five years; therefore, exposure levels are
representative of the past several years. Finally, our assessment of children’s exposure to
manganese from drinking water was based on a single measurement, however, repeated
measurements in the same houses showed very little time-variability in MnW levels suggesting
that the value measured in one occasion is representative of long-term exposure (Barbeau et al.
2011).
17
Conclusion
The World Health Organization (WHO) has recently discontinued its 400 µg/L guideline for
manganese in drinking water, arguing that “this health based value is well above concentrations
of manganese normally found in drinking water” (WHO 2011). In fact, drinking water supplies
with manganese concentrations exceeding this level are found in many countries, exposing tens
of millions of people worldwide (Frisbie et al. 2012). Coupled with our previous report of MnW-
associated IQ deficits (Bouchard et al. 2011), the present findings suggest the potential for
harmful effects at levels commonly encountered in groundwater.
18
References
Agusa T, Kunito T, Fujihara J, Kubota R, Minh TB, Kim Trang PT, et al. 2006. Contamination
by arsenic and other trace elements in tube-well water and its risk assessment to humans in
Hanoi, Vietnam. Environ Pollut 139:95-106.
Arbuckle JL. 1996. Full information estimation in the presence of incomplete data. In: Advanced
structural equation modeling: Issues and techniques (Lawrence Erlbaum Associates ed).
Mahwah, NJ.
ATSDR. 2012. Toxicological profil for manganese. Atlanta, GA: Agency for Toxic Substances
and Disease Registry.
Bader M, Dietz MC, Ihrig A, Triebig G. 1999. Biomonitoring of manganese in blood, urine and
axillary hair following low-dose exposure during the manufacture of dry cell batteries. Int
Arch Occup Environ Health 72:521-7.
Barbeau B, Carriere A, Bouchard MF. 2011. Spatial and temporal variations of manganese
concentrations in drinking water. J Environ Sci Health A Tox Hazard Subst Environ Eng
46:608-616.
Beck A, Steer R, Brown G. 1996. Manual for Beck Depression Inventory. 2nd ed. (BDI-II). San
Antonio, TX:Psychological Corporation.
Bouchard M, Laforest F, Vandelac L, Bellinger D, Mergler D. 2007. Hair manganese and
hyperactive behaviors: Pilot study of school-age children exposed through tap water.
Environ Health Perspect 115:122-127.
Bouchard MF, Sauve S, Barbeau B, Legrand M, Brodeur ME, Bouffard T, et al. 2011.
Intellectual impairment in school-age children exposed to manganese from drinking water.
Environ Health Perspect 119:138-143.
Brooks-Gunn J, Klebanov PK, Duncan GJ. 1996. Ethnic differences in children's intelligence test
scores: Role of economic deprivation, home environment, and maternal characteristics.
Child Dev 67:396-408.
Budtz-Jorgensen E, Keiding N, Grandjean P, Weihe P. 2002. Estimation of health effects of
prenatal methylmercury exposure using structural equation models. Environ Health 1:2.
Carriere A, Brouillon M, Sauve S et al. 2011. Performance of point-of-use devices to remove
manganese from drinking water. J Environ Sci Health A Tox Hazard Subst Environ Eng
46:601-607.
19
Claus Henn B, Ettinger AS, Schwartz J, Téllez-Rojo MM, Lamadrid-Figueroa H, Hernández-
Avila M, et al. 2010. Early postnatal blood manganese levels and children's
neurodevelopment. Epidemiology 21:433-9.
Conners CK. 2000. Conners' rating scales-revised: Technical manual. Toronto (Canada):Multi-
Health System Inc.
Conners CK. 2004. Conners' continuous performance test II Part 5. Toronto, Ontario,
Canada:Multi-Health Systems.
Dabeka RW, Conacher HB, Lawrence JF, Newsome WH, McKenzie A, Wagner HP, et al. 2002.
Survey of bottled drinking waters sold in Canada for chlorate, bromide, bromate, lead,
cadmium and other trace elements. Food Addit Contam 19:721-732.
Delis D, Kramer J, Kaplan E, Ober B. 1994. Manual for the California Verbal Learning Test—
Children’s version. San Antonio:The Psychological Corporation.
Eastman RR, Jursa TP, Benedetti C, Lucchini RG, Smith DR. 2013. Hair as a biomarker of
environmental manganese exposure. Environ Sci Technol 47:1629-1637.
Finkelstein MM, Jerett M. 2007. A study of the relationships between Parkinson's disease and
markers of traffic-derived and environmental manganese air pollution in two Canadian
cities. Environ Res 104: 420-432.
Frisbie SH, Mitchell EJ, Dustin H, Maynard DM, Sarkar B. 2012. World health organization
discontinues its drinking-water guideline for manganese. Environ Health Perspect 120:775-
778.
Groschen GE, Arnold TL, Morrow WS, Warner KL. Occurrence and Distribution of Iron, Manganese, and Selected Trace Elements in Ground Water in the Glacial Aquifer System of
the Northern United States.U.S. Geological Survey Scientific Investigations Report 2009-
5006. 2009. [accessed 7 September 2014]. Available: http://pubs.usgs.gov/sir/2009/5006/
Guilarte TR, McGlothan JL, Degaonkar M, Chen MK, Barker PB, Syversen T, et al. 2006.
Evidence for cortical dysfunction and widespread manganese accumulation in the nonhuman
primate brain following chronic manganese exposure: A 1H-MRS and MRI study. Toxicol
Sci 94:351-358.
Guilarte TR, Burton NC, Verina T, Prabhu VV, Becker KG, Syversen T, et al. 2008. Increased
aplp1 expression and neurodegeneration in the frontal cortex of manganese-exposed non-
human primates. J Neurochem 105:1948-1959.
20
Health Canada. 1979. Manganese. Ottawa, ON: Health Canada. Available at: http://www.hc-
sc.gc.ca/ewh-semt/alt_formats/hecs-sesc/pdf/pubs/water-eau/manganese/manganese-eng.pdf
[accessed 30 December 2013].
Huber P. 1967. The behavior of the maximum likelihood estimates under nonstandard
conditions. In: Proceedings of the Fifth Berkeley Symposium on Mathematical Statistics and
Probability, Vol. 1. Berkeley: University of California Press, 221-233.
Khan K, Factor-Litvak P, Wasserman GA, Liu X, Ahmed E, Parvez F, et al. 2011. Manganese
exposure from drinking water and children's classroom behavior in Bangladesh. Environ
Health Perspect 119:1501-1506.
Khan K, Wasserman GA, Liu X, Ahmed E, Parvez F, Slavkovich V, et al. 2012. Manganese
exposure from drinking water and children's academic achievement. Neurotoxicology 33:91-
97.
Kline R. 2011. Principles and practice of structural equation modeling. Third edition. New York:
Guilford Press.
Lafayette Instrument Company. 2002. Finger tapping test. Lafayette, Indiana, USA: Lafayette
Instrument Company Inc.
Moreno JA, Yeomans EC, Streifel KM, Brattin BL, Taylor RJ, Tjalkens RB. 2009. Age-
dependent susceptibility to manganese-induced neurological dysfunction. Toxicol Sci
112:394-404.
Neisser U, Boodoo G, Bouchard TJ, Boykin W, Brody N, Ceci SJ, et al. 1996. Intelligence:
knowns and unknowns. Am Psychol 51:77–101.
Raven J, Raven J, Court J. 2003. Manual for Raven’s progressive matrices and vocabulary
scales. San Antonio, TX:Harcourt Assessment.
RCoreTeam. 2013. R: A language and environment for statistical computing. R Foundation for
Statistical Computing, Vienna, Austria.
Rosseel Y. 2012. Lavaan: An R package for structural equation modeling. J Stat Softw 48:1-36.
Sanchez BN, Budtz-Jorgensen E, Ryan LM, Hu H. 2005. Structural equation models: A review
with applications to environmental epidemiology. J Am Stat Assoc 100:1443-1455.
Schneider JS, Decamp E, Clark K, Bouquio C, Syversen T, Guilarte TR. 2009. Effects of chronic
manganese exposure on working memory in non-human primates. Brain Res 1258:86-95.
21
Sky-Peck HH. 1990. Distribution of trace elements in human hair. Clin Physiol Biochem 8:70-
80.
Smith D, Gwiazda R, Bowler R, Roels H, Park R, Taicher C, Lucchini R. 2007. Biomarkers of
Mn exposure in humans. Am J Ind Med 50:801-11.
Tran TT, Chowanadisai W, Lonnerdal B, Le L, Parker M, Chicz-Demet A, et al. 2002. Effects of
neonatal dietary manganese exposure on brain dopamine levels and neurocognitive
functions. Neurotoxicology 23:645-651.
U.S. EPA. 1993. Health risk assessment for manganese. Cincinnati, OH: Office of Health and
Environmental Assessment. U.S. Environmental Protection Agency.
U.S. EPA. 2003. Health Effects Support Document for Manganese. EPA 822-R-03-
003.Washington, DC: U.S. Environmental Protection Agency.
van den Hoven T, Slaats N. 2006. Lead monitoring (chapter 3). In: Analytical methods for
drinking water, advances in sampling and analysis, (Quevaullier P, Thompson KC, eds).
Hoboken, NJ:Wiley.
Wasserman GA, Liu X, Parvez F, Ahsan H, Levy D, Factor-Litvak P, et al. 2006. Water
manganese exposure and children's intellectual function in araihazar, Bangladesh. Environ
Health Perspect 114:124-129.
Wasserman GA, Liu X, Parvez F, Factor-Litvak P, Ahsan H, Levy D, et al. 2011. Arsenic and
manganese exposure and children's intellectual function. Neurotoxicology 32:450-457.
Wechsler D. 1999. Wechsler abbreviated scale of intelligence (WASI). San Antonio,
TX:Harcourt Assessment.
WHO. 2011. Guidelines for drinking-water quality. World Health Organization. Geneva.
Wood SN. 2011. Fast stable restricted maximum likelihood and marginal likelihood estimation
of semiparametric generalized linear models. J R Stat Soc B 73:3-36.
Zoni S, Lucchini RG. 2013. Manganese exposure: Cognitive, motor and behavioral effects on
children: A review of recent findings. Curr Opin Pediatr 25:255-260.
22
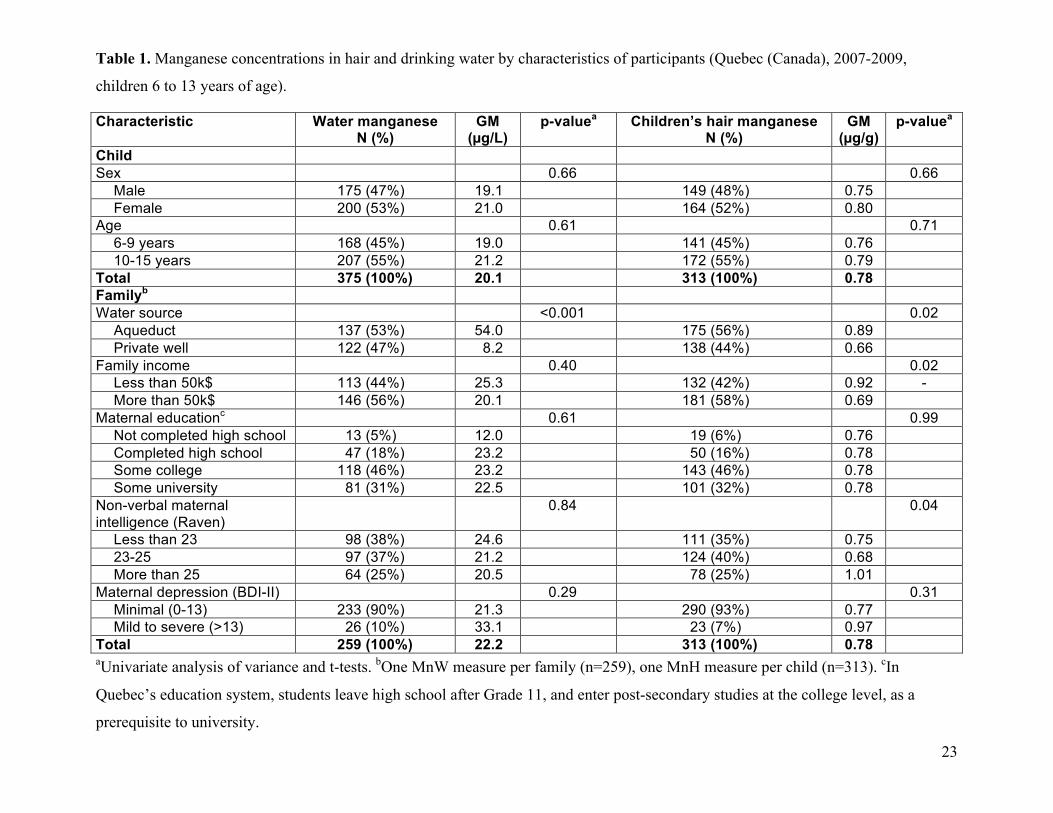
Table 1. Manganese concentrations in hair and drinking water by characteristics of participants (Quebec (Canada), 2007-2009,
children 6 to 13 years of age).
Characteristic Water manganese N (%)
GM (µg/L)
p-valuea Children’s hair manganese N (%)
GM (µg/g)
p-valuea
Child Sex 0.66 0.66
Male 175 (47%) 19.1 149 (48%) 0.75 Female 200 (53%) 21.0 164 (52%) 0.80
Age 0.61 0.71 6-9 years 168 (45%) 19.0 141 (45%) 0.76 10-15 years 207 (55%) 21.2 172 (55%) 0.79
Total 375 (100%) 20.1 313 (100%) 0.78 Familyb
Water source <0.001 0.02 Aqueduct 137 (53%) 54.0 175 (56%) 0.89 Private well 122 (47%) 8.2 138 (44%) 0.66
Family income 0.40 0.02 Less than 50k$ 113 (44%) 25.3 132 (42%) 0.92 -More than 50k$ 146 (56%) 20.1 181 (58%) 0.69
Maternal educationc 0.61 0.99 Not completed high school 13 (5%) 12.0 19 (6%) 0.76 Completed high school 47 (18%) 23.2 50 (16%) 0.78 Some college 118 (46%) 23.2 143 (46%) 0.78 Some university 81 (31%) 22.5 101 (32%) 0.78
Non-verbal maternal intelligence (Raven)
0.84 0.04
Less than 23 98 (38%) 24.6 111 (35%) 0.75 23-25 97 (37%) 21.2 124 (40%) 0.68 More than 25 64 (25%) 20.5 78 (25%) 1.01
Maternal depression (BDI-II) 0.29 0.31 Minimal (0-13) 233 (90%) 21.3 290 (93%) 0.77 Mild to severe (>13) 26 (10%) 33.1 23 (7%) 0.97
Total 259 (100%) 22.2 313 (100%) 0.78 aUnivariate analysis of variance and t-tests. bOne MnW measure per family (n=259), one MnH measure per child (n=313). cIn
Quebec’s education system, students leave high school after Grade 11, and enter post-secondary studies at the college level, as a
prerequisite to university.
23
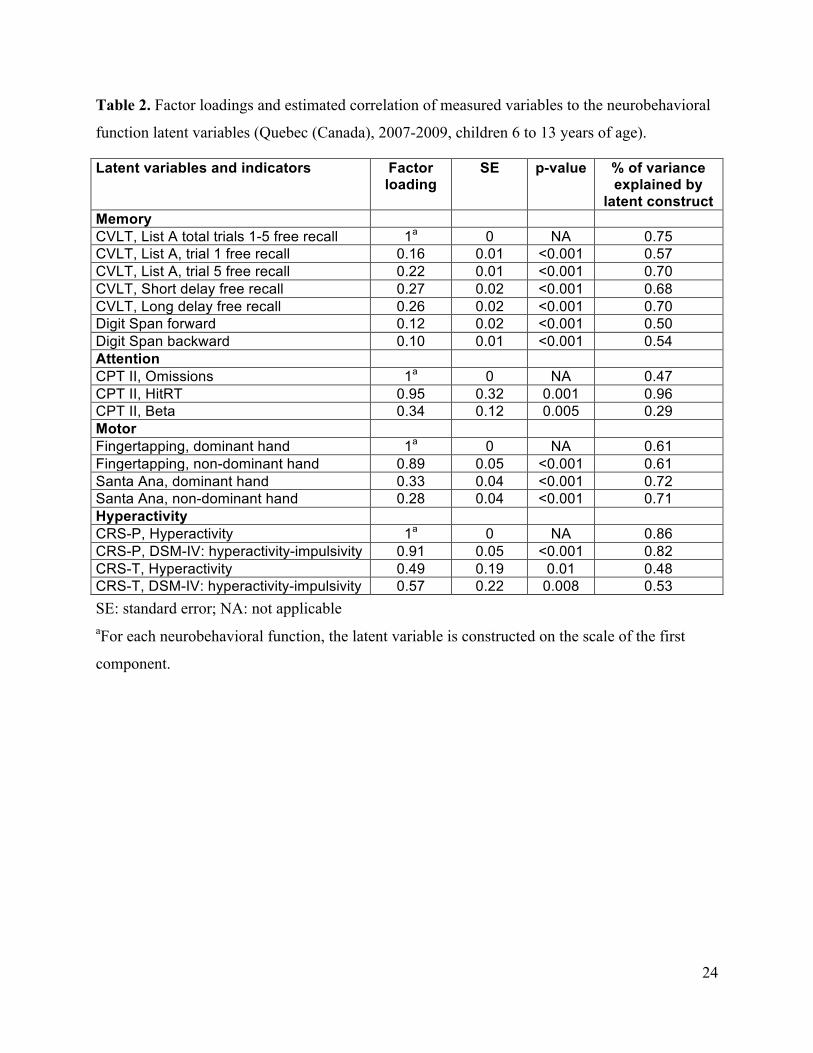
Table 2. Factor loadings and estimated correlation of measured variables to the neurobehavioral
function latent variables (Quebec (Canada), 2007-2009, children 6 to 13 years of age).
Latent variables and indicators Factor loading
SE p-value % of variance explained by
latent construct Memory CVLT, List A total trials 1-5 free recall 1a 0 NA 0.75 CVLT, List A, trial 1 free recall 0.16 0.01 <0.001 0.57 CVLT, List A, trial 5 free recall 0.22 0.01 <0.001 0.70 CVLT, Short delay free recall 0.27 0.02 <0.001 0.68 CVLT, Long delay free recall 0.26 0.02 <0.001 0.70 Digit Span forward 0.12 0.02 <0.001 0.50 Digit Span backward 0.10 0.01 <0.001 0.54 Attention CPT II, Omissions 1a 0 NA 0.47 CPT II, HitRT 0.95 0.32 0.001 0.96 CPT II, Beta 0.34 0.12 0.005 0.29 Motor Fingertapping, dominant hand 1a 0 NA 0.61 Fingertapping, non-dominant hand 0.89 0.05 <0.001 0.61 Santa Ana, dominant hand 0.33 0.04 <0.001 0.72 Santa Ana, non-dominant hand 0.28 0.04 <0.001 0.71 Hyperactivity CRS-P, Hyperactivity 1a 0 NA 0.86 CRS-P, DSM-IV: hyperactivity-impulsivity 0.91 0.05 <0.001 0.82 CRS-T, Hyperactivity 0.49 0.19 0.01 0.48 CRS-T, DSM-IV: hyperactivity-impulsivity 0.57 0.22 0.008 0.53 SE: standard error; NA: not applicable aFor each neurobehavioral function, the latent variable is constructed on the scale of the first
component.
24
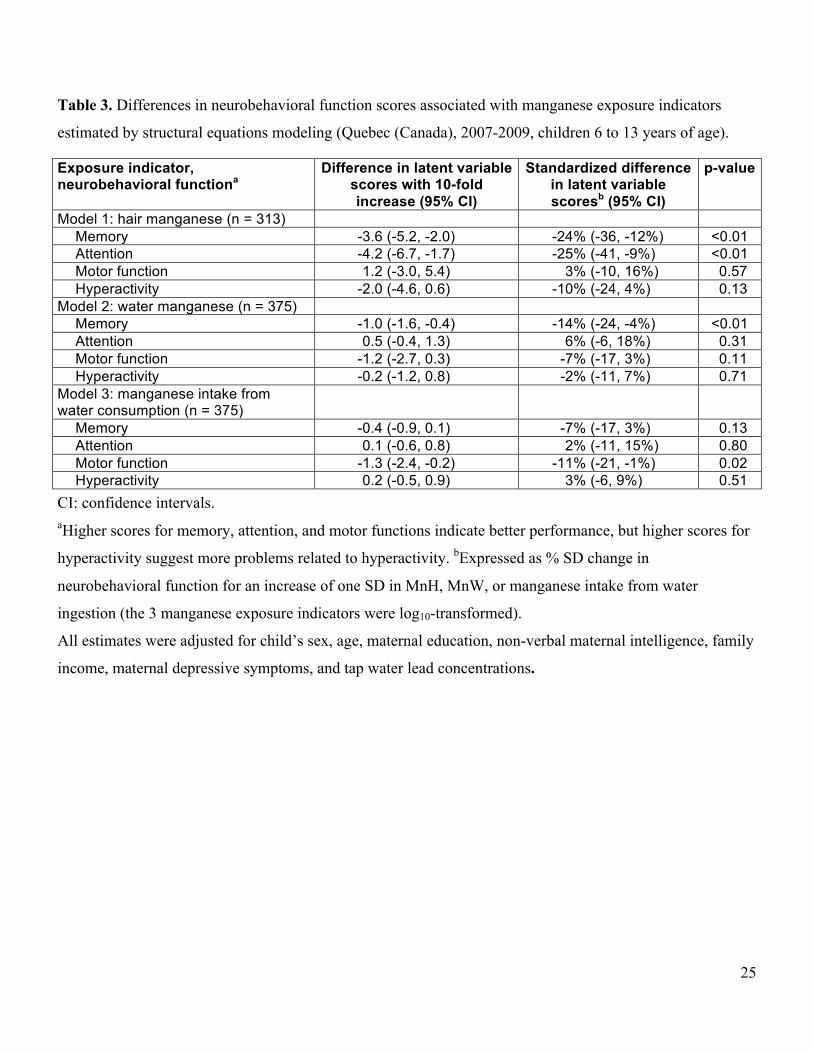
Table 3. Differences in neurobehavioral function scores associated with manganese exposure indicators
estimated by structural equations modeling (Quebec (Canada), 2007-2009, children 6 to 13 years of age).
Exposure indicator, neurobehavioral functiona
Difference in latent variable scores with 10-fold increase (95% CI)
Standardized difference in latent variable scoresb (95% CI)
p-value
Model 1: hair manganese (n = 313) Memory -3.6 (-5.2, -2.0) -24% (-36, -12%) <0.01 Attention -4.2 (-6.7, -1.7) -25% (-41, -9%) <0.01 Motor function 1.2 (-3.0, 5.4) 3% (-10, 16%) 0.57 Hyperactivity -2.0 (-4.6, 0.6) -10% (-24, 4%) 0.13
Model 2: water manganese (n = 375) Memory -1.0 (-1.6, -0.4) -14% (-24, -4%) <0.01 Attention 0.5 (-0.4, 1.3) 6% (-6, 18%) 0.31 Motor function -1.2 (-2.7, 0.3) -7% (-17, 3%) 0.11 Hyperactivity -0.2 (-1.2, 0.8) -2% (-11, 7%) 0.71
Model 3: manganese intake from water consumption (n = 375)
Memory -0.4 (-0.9, 0.1) -7% (-17, 3%) 0.13 Attention 0.1 (-0.6, 0.8) 2% (-11, 15%) 0.80 Motor function -1.3 (-2.4, -0.2) -11% (-21, -1%) 0.02 Hyperactivity 0.2 (-0.5, 0.9) 3% (-6, 9%) 0.51
CI: confidence intervals. aHigher scores for memory, attention, and motor functions indicate better performance, but higher scores for
hyperactivity suggest more problems related to hyperactivity. bExpressed as % SD change in
neurobehavioral function for an increase of one SD in MnH, MnW, or manganese intake from water
ingestion (the 3 manganese exposure indicators were log10-transformed).
All estimates were adjusted for child’s sex, age, maternal education, non-verbal maternal intelligence, family
income, maternal depressive symptoms, and tap water lead concentrations.
25
Figure Legends
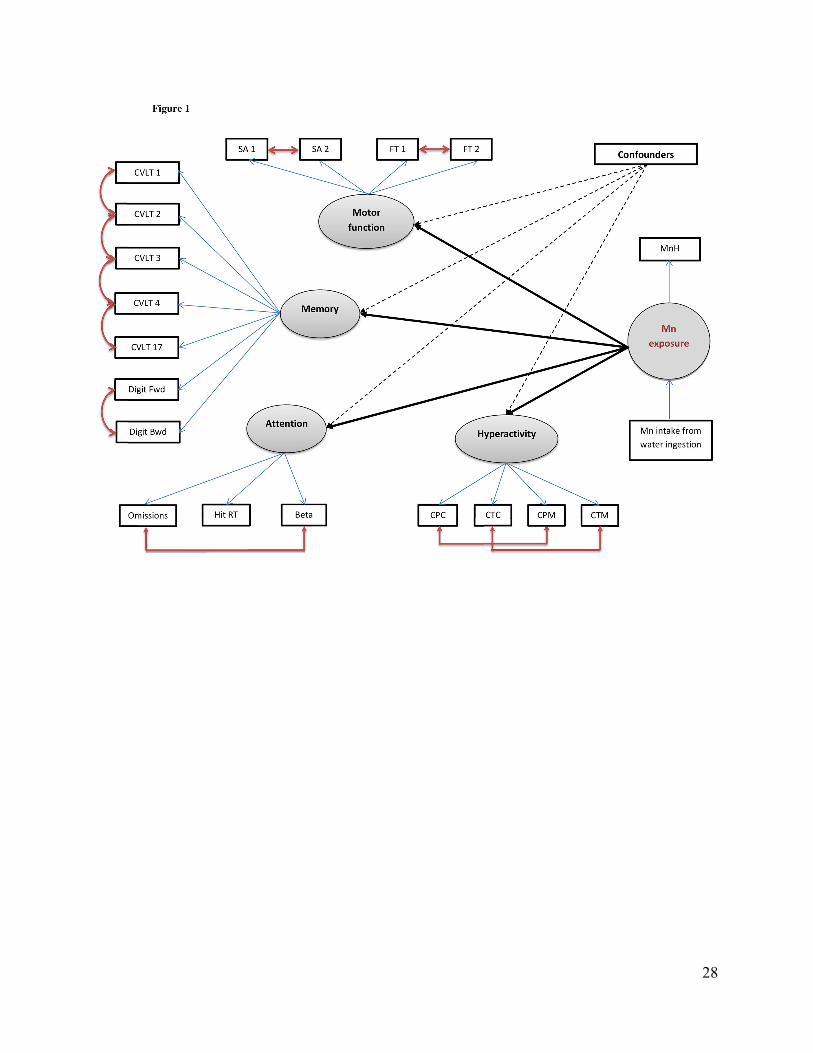
Figure 1. Conceptual path diagram for Model 1 of the SEM for the associations between
manganese exposure and neurobehavioral functions, with covariates adjustment. Manganese
(Mn) exposure was modeled as a latent parameter indicated by hair manganese concentration
(MnH), and influenced by manganese intake from water consumption. Four latent
neurobehavioral functions were constructed: memory, attention, motor, and hyperactivity. The
memory latent function was based on the number of correct responses on the learning trials of
the CVLT–C for List A total trials 1-5 free recall (CVLT 1); List A, trial 1 free recall (CVLT 2);
List A, trial 5 free recall (CVLT 3); Short delay free recall (CVLT 4); Long delay free recall
(CVLT 5); Digit span forward (Digit Fwd) and backward (Digit Bwd) scores. The attention
latent variable was indicated by the scores of the CPT II test: number of failure to respond to
target letters (omissions), overall hit reaction time (hit RT), and the response style indicator
(beta). The attention test scores were reversed; therefore, higher attention scores indicate better
performance. The motor function included scores on the Fingertapping (for dominant (FT 1) and
non-dominant (FT 2) hands) and the Santa Ana test (for dominant (SA 1) and non-dominant (SA
2) hands). The hyperactivity latent variable was indicated by parental (CPC) and teacher’s (CTC)
hyperactivity and DSM-IV hyperactivity-impulsivity (CPM and CTM) scores from the Conners’
Rating Scales test.
In Models 2 and 3, the latent variable for manganese exposure was indicated solely by water
manganese concentration, and manganese intake from water consumption, respectively.
Figure 2. Adjusted associations between hair manganese concentration (MnH) and memory (a),
attention (b), motor (c) functions, and hyperactivity (d). Covariates in models: child’s sex, age,
26
maternal education, non-verbal maternal intelligence, family income, maternal depression, and
water lead concentrations. Higher scores for memory, attention, and motor functions indicate
better performance, but higher scores for hyperactivity suggest more problems related to
hyperactivity
Figure 3. Adjusted association between water manganese concentration and memory (a),
attention (b), motor (c) functions, and hyperactivity (d). Covariates in models: child’s sex, age,
maternal education, non-verbal maternal intelligence, family income, maternal depression, and
water lead concentrations. Higher scores for memory, attention, and motor functions indicate
better performance, but higher scores for hyperactivity suggest more problems related to
hyperactivity
Figure 4. Adjusted association between manganese intake from water consumption and memory
(a), attention (b), motor (c) functions, and hyperactivity (d). Covariates in models: child’s sex,
age, maternal education, non-verbal maternal intelligence, family income, maternal depression,
and water lead concentrations. Higher scores for memory, attention, and motor functions indicate
better performance, but higher scores for hyperactivity suggest more problems related to
hyperactivity.
27
28
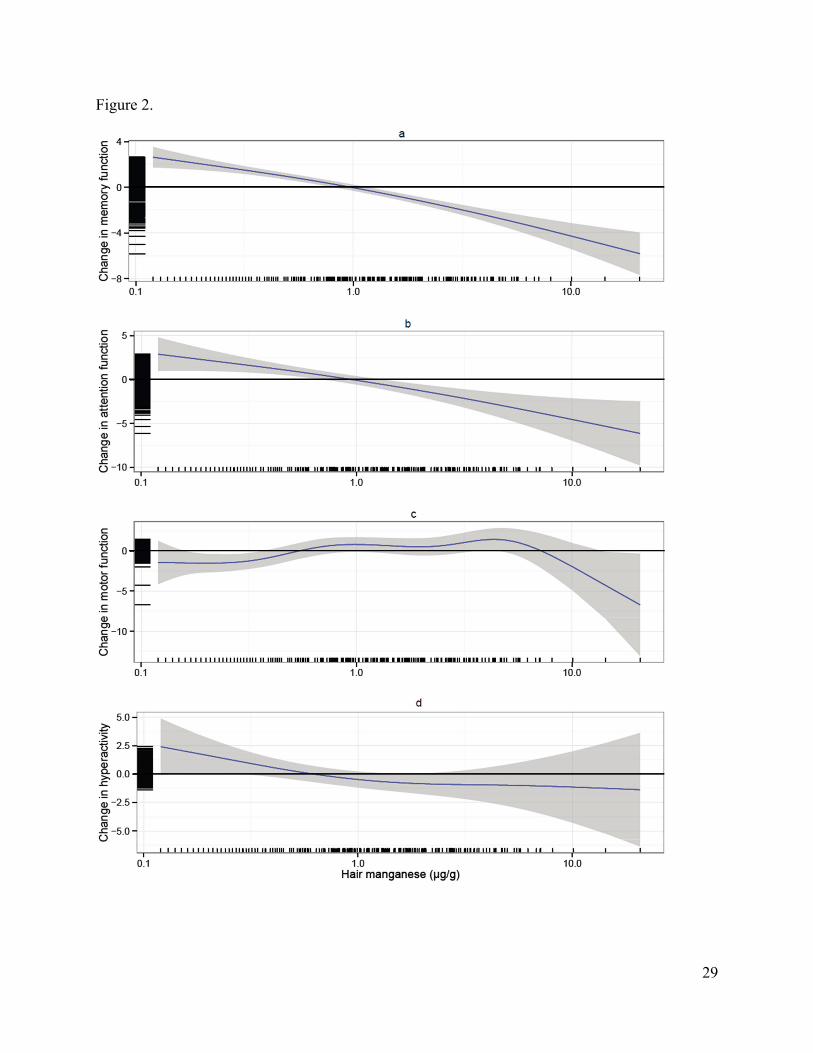
Figure 2.
29
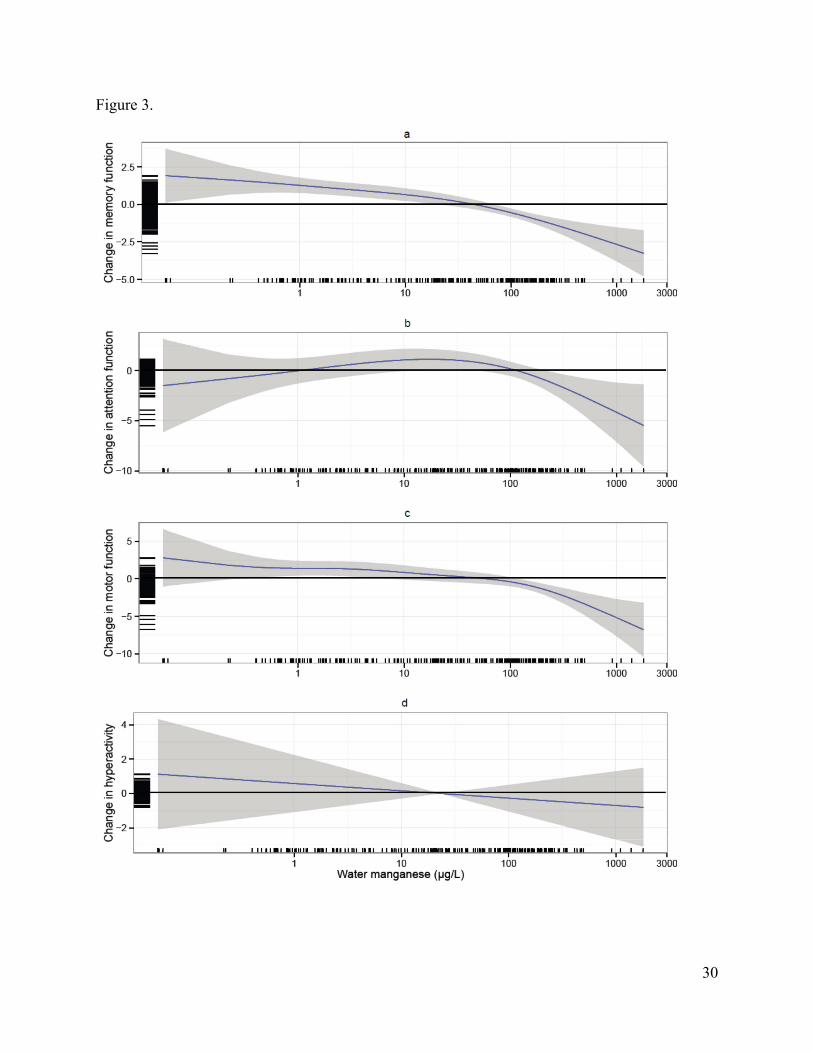
Figure 3.
30
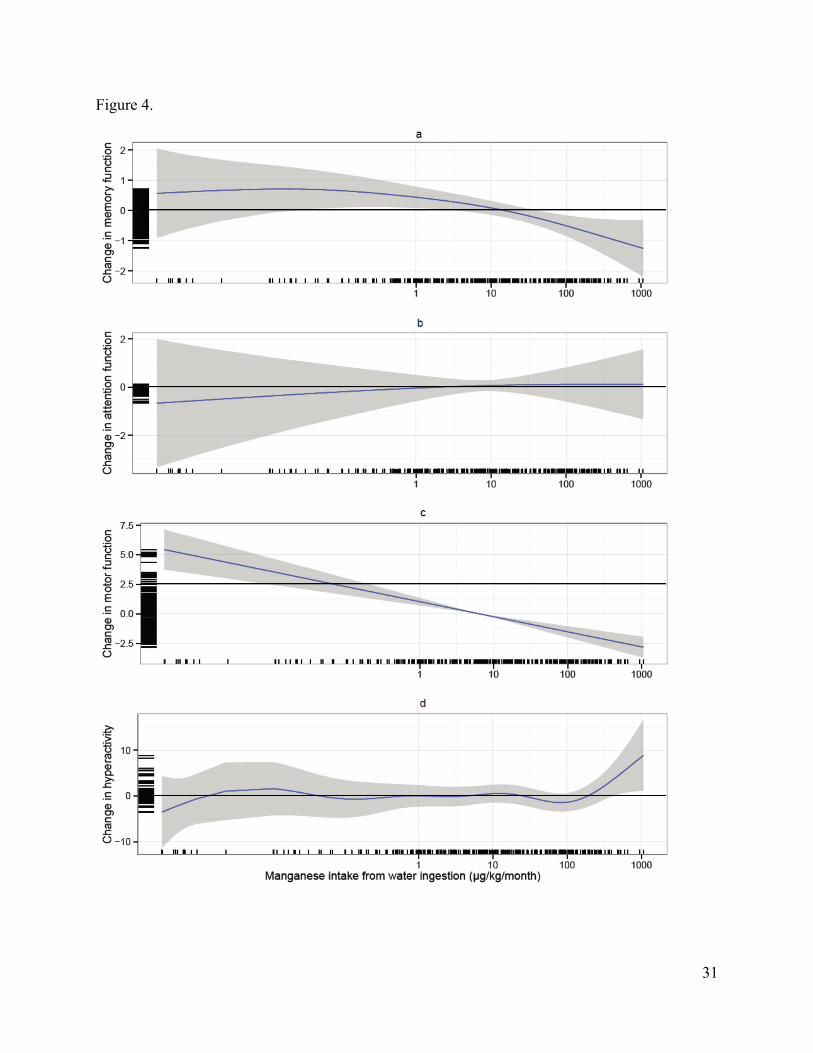
Figure 4.
31


