
EFFECTS OF ENVIRONMENTAL CONDITIONS ON SIZE DISTRIBUTIONS OF
LEPIDOPTERA IN TWO CONTRASTING ECOSYSTEMS:
THE CHIHUAHUAN DESERT AND
THE EDWARDS PLATEAU
by
Virginia B. Brown, B.S.
A thesis submitted to the Graduate Council of
Texas State University in partial fulfillment
of the requirements for the degree of
Master of Science
with a Major in Biology
May 2016
Committee Members:
Michael Huston, Chair
David Huffman
Chris Nice

COPYRIGHT
by
Virginia B. Brown
2016

FAIR USE AND AUTHOR’S PERMISSION STATEMENT
Fair Use
This work is protected by the Copyright Laws of the United States (Public Law 94-553,
section 107). Consistent with fair use as defined in the Copyright Laws, brief quotations
from this material are allowed with proper acknowledgement. Use of this material for
financial gain without the author’s express written permission is not allowed.
Duplication Permission
As the copyright holder of this work I, Virginia Brown, authorize duplication of this
work, in whole or in part, for educational or scholarly purposes only.

iv
ACKNOWLEDGEMENTS
Firstly I would like to thank my thesis advisor and committee chair, Dr. Michael
Huston at Texas State University. He consistently provided support and guidance while
allowing this paper to be my own work.
I would also like to thank my thesis committee members, Dr. David Huffman and
Dr. Chris Nice, for their invaluable expertise input. Without their guidance this paper
would not have been possible.
I would also like to acknowledge my fellow research partner, Kate Sideman-
Barclay. I am gratefully indebted to her for helping to conduct surveys at the Christmas
Mountains and Freeman Ranch. Without her passionate dedication this research would
not have been possible.
Finally I must express my profound gratitude to my parents for providing me with
unfailing support, and continuous engagement throughout my years of study and through
the process of research and writing this thesis. This accomplishment would not have been
possible without them. Thank you.
Virginia Brown

v
TABLE OF CONTENTS
Page
ACKNOWLEDGEMENTS ....................................................................................... iv
CHAPTER
I. INTRODUCTION .............................................................................................. 1
Body Size Relationships ......................................................................... 2
Study System .......................................................................................... 3
Abiotic Factors and Lepidoptera Responses to Environmental
Conditions .............................................................................................. 4
II. METHODS......................................................................................................... 7
Sampling and Sorting Methods .............................................................. 7
Site Descriptions ..................................................................................... 8
Chihuahuan Desert ..................................................................... 8
Edwards Plateau ......................................................................... 9
Analysis .................................................................................................. 9
III. RESULTS ....................................................................................................... 11
Freeman Ranch ..................................................................................... 12
Pearson’s Correlation Matrix ................................................... 13
Christmas Mountains ............................................................................ 14
Pearson’s Correlation Matrix ................................................... 15
IV. DISCUSSION ................................................................................................. 17
Future considerations ........................................................................... 20
APPENDIX ............................................................................................................... 22
REFERENCES .......................................................................................................... 35

1
I. INTRODUCTION
A central focus in ecology is understanding how organisms interact with
their environment. The mechanisms by which individuals, species and populations
respond to abiotic factors, such as weather, are not fully understood. These mechanisms
are the basis for understanding ecosystem dynamics, predicting how ecosystems will
respond to climate change, and developing methodologies for conservation efforts.
Comparative studies in ecosystems that differ strongly in climate could be especially
powerful for understanding how individuals, species, and populations respond to abiotic
factors, and predicting how the ecosystems will respond to the effects of variable or
changing climate. As climate varies seasonally, inter-annually or over longer time
periods, temperature and evaporation rates interact with the amount, frequency, intensity,
and type of precipitation (Trenberth 2011).
Comparative studies can address a wide range of hypotheses and questions. Do
closely-related organisms, for example of the of the same family or order, respond
similarly to abiotic factors? Does the response to these factors change with the size of the
organism? For example, in the Chihuahuan Desert the insects as well as the plants are
under-studied, which is a knowledge gap that complicates research because many of the
species are unidentified, and the natural histories of most species are not well known.
To investigate how organisms respond to abiotic factors and how those responses
vary with changes of weather patterns due to climates change, we took advantage of the
strong precipitation gradient across Texas and initiated research at two contrasting
locations along that gradient.
2
Given the near absence of information on insects of the Chihuahuan Desert in
West Texas, we began a long-term study to establish a baseline for the moth fauna. For
comparison, we also studied insects on the Edward’s Plateau, at Freeman Ranch near San
Marcos, where moth species and their life history properties are better known. Both of
these ecosystems have high rates of plant endemism and a strong contrast in the amount
and timing of rainfall.
Body Size Relationships
Even for species that cannot be identified, measurements of their size can provide
useful information about differences between species, as well as variation with the
population of a single species. Even for an environment where species are understudied
body size is an easily quantified dependent variable, and has been found to be correlated
with various independent variables, such as metabolism, temperature, primary
productivity, precipitation and nutrient availability (Peters 1986; Huston and Wolverton
2011). Body size patterns provide ecologists a starting point for investigating poorly-
characterized systems, and can be readily quantified for virtually all types of animals
(Wainwright 1994).
The idea that abiotic factors affect morphology has played a major role in the
fields of evolution and ecology (LaBarbera 1989). Abiotic factors vary spatially and
temporally, as does animal body size. In the mid-1800’s, various ecologists took notice of
body size patterns and established eco-geographic rules (e.g., Bergmann’s and Allen’s
Rule) to describe the patterns at the intraspecific and interspecific levels (Bidau et al.
2012). Both of these scales of analysis were traditionally applied to endotherms and

3
attempted to explain why the individuals of many species tended to be larger at higher
elevation and/or latitudes. This relationship was described in 1839 as the result of
metabolic demand based on total animal body size (Robiquet 1839). They explained that
this was due to larger animals having a lower surface-to-volume ratio and are
consequently more efficient at maintaining internal body temperatures that are
advantageous for colder climes (Bergmann 1848; Kivelä et al. 2011; see however Huston
and Wolverton 2011).
These eco-geographic rules, while simple in concept and general in application,
created a baseline for future ecological research. Some species of endotherms show
discrepancies from these predictions (Wolverton et al. 2009, Huston and Wolverton
2011). This suggests that body size distributions are more complex than thermoregulation
alone and are possibly due to a combination of abiotic and biotic factors (Huston and
Wolverton 2011). When originally applied to ectotherms, some of the observed patterns
were inconsistent between vertebrate and non-vertebrates ( Angilletta et al. 2004; Klok
and Harrison 2013). Many arthropods, specifically insects, demonstrate a Bergmann’s
cline for body size variance along latitude and altitudinal gradients, while they show an
inverse cline in response of their developmental time – as larval development rate
increased, growth rate decreased with increasing latitude (Ray 1960; Kivelä et al. 2011).
Study System
We chose nocturnal insects in the order Lepidoptera as our study system to
evaluate the variation of population responses and body-size distributions due to
differences in environmental conditions such as temperature, growing degree days, and
precipitation. This area of study is important because these factors potentially affect the

4
productivity of plants on which herbivorous insects feed, and are likely to shift spatially
and temporally as climate changes. We compared the patterns of lepidopteran body-size
distributions between two contrasting ecosystems, the Chihuahuan Desert and Edward’s
Plateau.
Night-flying lepidoptera are an ideal study system due to the ease of capturing
adults. Adults can be caught passively through the use of ultraviolet light traps, are easily
processed, and are in high abundance in most ecosystems. They are also used as an
umbrella species for biodiversity conservation (New 1997) and as indicator for ecosystem
health (Hilty and Merelender 2000). Night-flying lepidoptera, specifically
microlepidoptera, are not well-documented in the Chihuahuan Desert and many other
ecosystems, and using them as a study system helps develop a baseline for future
research in the region.
Abiotic Factors and Lepidoptera Responses to Environmental Conditions
We used nocturnal lepidoptera surveys in two ecosystems to address the
following questions: 1) Do abiotic factors predict the overall abundance of lepidoptera;
2) Do lepidoptera that differ in size respond similarly to abiotic factors, and 3) Do abiotic
factors affect the number of lepidopteran species in different areas. For abiotic factors,
we focused on precipitation, temperature, and growing degree-days, because these factors
are strongly influenced by climate and both plant growth and lepidopteran abundance are
influenced by them.
The vast majority of Lepidoptera are herbivores that feed on plants during
their larval stage. Variation in body size within and between species of Lepidoptera is

5
affected by many different environmental factors, including the quantity and quality of
the plant material they eat, rainfall, and temperature. It is important to note that other
factors such as top-down predation, life-history strategy, dormancy, and sexual selection
also influence body size (Klok and Harrison 2013).
Temperature is one of the strongest direct influences on body size of lepidoptera.
Temperature is crucial for development. It influences feeding rates, individual
development, movement, and population dynamics. Individuals that are reared in higher
temperatures are often smaller, in comparison to ones that are reared in lower
temperatures (Klok and Harrison 2013, Kingsolver and Huey 2008).
In addition to its effects on larval growth and activity, temperature also affects
movement of adult lepidoptera (Raimondo et al. 2004;De Freitas et al. 2005). Numerous
studies have demonstrated that as temperature increases more individuals are attracted to
light traps (Williams and Bell 1940;Yela and Holyoak 1997; Williams and Bell 1940;
Muirhead-Thompson 2012). The same pattern occurs with precipitation – as precipitation
increases so do the number of individuals at traps (Butler et al. 1999). Precipitation also
has been found to have a positive effect on individual body size of populations between
sampling years (Maelzer and Zalucki 1999).
To standardize temperature and to account for intra-annual variation, we used
growing degree-days (GDD). Growing degree-days are a temporal accumulation of heat
and are calculated by calculating the daily average temperature based on the daily
maximum and minimum temperatures, then subtracting temperature base, often 50°F
(10°C), from the total temperature. GDD are widely used in horticulture and agriculture
to determine planting dates, and have been demonstrated to be a reliable predictor of
6
phenological responses to temperature for lepidopteran host plants and larval emergence
(Baker et al. 1984, Damos and Savopoulou-Soultani 2011; Baker et al. 1984; Cayton et
al. 2015) While temperature can affect insect development, precipitation can alter its
effects.
Ecosystems are highly complex and have multiple levels of interactions between
organisms and abiotic factors, and among the organisms themselves. Ecological
comparative studies can be limited by the amount of knowledge of how organisms
respond to their environment. The lack of information of the lepidopteran community in
the Chihuahuan desert imposes limitations what types of research are feasible. It is
important to establish a baseline on which future research can be based. Lepidoptera are
an ideal study group because they are indicators for biodividersity and ecosystem health.
We identified abiotic factors for which data are relatively easy to gather to evaluate
whether and how the body size distribution of lepidoptera varies in response to the
chosen abiotic factors. By doing so we are establishing a methodology that can be used in
other under-studied ecosystems. This work should lead to a better understanding of how
lepidoptera respond to their environment and how that response changes due to climate
change.

7
II. METHODS
Sampling and Sorting Methods
The analysis is based on monthly sampling of a specific subset of the
Lepidopteran communities within two contrasting ecosystems, the Chihuahuan Desert
and the Edwards Plateau, in 2013. To develop a quantitative and reproducible sampling
method, we standardized a light-trap procedure after multiple trials in the field. Traps
were suspended from three telescoping legs that raised the trap above vegetation, with the
top of the trap about 1.75 m about the ground surface. Trap design consisted of a
cylindrical container with one side cut away to create a 90° field of light projected from a
15-w tubular UV light bulb that was attached to the inside of the trap. The bottom of the
trap funneled into a plastic bucket charged with ethyl acetate, a common entomological
killing agent. The UV-light attractant was indiscriminate of order of insect, and collected
only species that were attracted to UV light.
Criteria for acceptability of the monthly sample included controlling for UV light
competition from moonlight by sampling only during the new moon (Nowinszky 2004),
and by only sampling when wind gusts were less than 5 mph and ambient temperatures
were above 50o F (McGeachie 1989). Sampling was started 30 minutes after sunset for a
duration of 90 minutes, thus capturing only a subset of the total moth fauna, and
collecting no information on moths that become active later than two hours after sunset.
To eliminate sampling bias due to local vegetation composition, we chose two sites per
location, each comprised of different vegetation mosaics. Both sites were sampled
simultaneously with identical traps.

8
We sorted samples into morphospecies and pinned or stored them in dry vials. We
defined morphospecies by visible differences between individuals based on
morphological characteristics as color, wing pattern (e.g., reniform spot, fringe, and
margin), and size. To analyze body mass, we dried collections of morphospecies at 140°F
(60°C) for 24 hours, and immediately weighed them to the nearest mg. We chose to sort
samples to morphospecies, because the Chihuahuan Desert lepidopteran community is
not well-characterized, with incomplete species lists, and with many species having
multiple morphs that are not easily identifiable without dissection of genitalia.
Site Descriptions
Chihuahuan Desert
We sampled the Chihuahuan Desert near Terlingua Ranch Headquarters, at the
base of the Christmas Mountain Range, adjacent to Big Bend National Park located in
Brewster County, Texas. We chose the site due to the proximity of the Christmas
Mountains which are owned and maintained by the Texas State University System. We
obtained weather data for the area from Panther Junction in Big Bend National Park.
Panther Junction receives an average of 33.53cm (13.22inches) of rain per year, with
most of the precipitation occurring during the monsoon season – beginning in May and
peaking between July and October. Average annual temperature is 66.3°F (19.05°C).
The two different sampling sites were 1) mesquite (Prosopis pubescens) and
creosote (Larrea tridentate) flats, and 2) a mountain hillside that was dominated by
Sotol , Yucca, tarbush (Flourensia cernua), and various other shrubs. One temperature
station was used for both sites during sampling. However, it should be noted that the two
sites have microclimatic differences. The mountain hillside (west slope facing afternoon

9
sun) is warmed from the sun during the late afternoon, while the flats (lower elevation)
are affected by cool-air drainage that occurs shortly after sunset.
Edwards Plateau
The Edwards Plateau sampling site is located at Freeman Ranch in San Marcos,
Texas. Freeman Ranch is managed by Texas State University, and has been used as a site
for cattle management and forensic research. The area that was sampled has not been
used for grazing cattle for over 20 years. Weather data for the area were obtained from a
weather station in San Marcos, Texas. San Marcos, Texas receives an average of
90.81cm (35.75 in) of precipitation per year with the majority of the rain falling during
the spring, May and June, and the fall, September and October. This bimodal distribution
of rainfall, with the rainy periods separated by a hot, dry summer is similar to a
mediterranean climate. Average annual temperature is 68.45°F (20.25°C).
The two sites sampled are an open oak savannah and a juniper thicket
(29.935140, -98.014092). The juniper thicket tended to stay warmer than the open
savannah (29.935458, -98.013853).
Analysis
I calculated individual weights for each morphospecies by dividing the total mass
of all individuals by the number of individuals. Body size classes were defined using a
log 2 scale of average morphospecies weight in milligrams: 1,2,4,8,16,32,64, and 128.
The effects of environmental factors (precipitation, temperature, growing degree
days, photoperiod) on the abundance of the various body-size classes (evaluated using
both the total number of individuals and total weight per size class) were evaluated using

10
a correlation matrix. Because of small sampling size (9 months) the significance level
was set at p < 0.05.
11
III. RESULTS
I analyzed a total of 11,060 individual lepidoptera in 9 monthly samples at both
the Christmas Mountains (6,884) and Freeman Ranch (4,176) Total dry weight of all
samples was 56.92 grams (see Appendix B, Table 3 and 2). Christmas Mountains had a
total of 39.82 grams, with Freeman Ranch having a total of 17.10 grams for the 9 sample
months. At the Christmas Mountains there were more correlations (both positive and
negative) among body-size classes and of body size classes with environmental factors
than at Freeman Ranch (Table 1 and Table 2). The majority of the significant (p< 0.05)
correlations were positive.
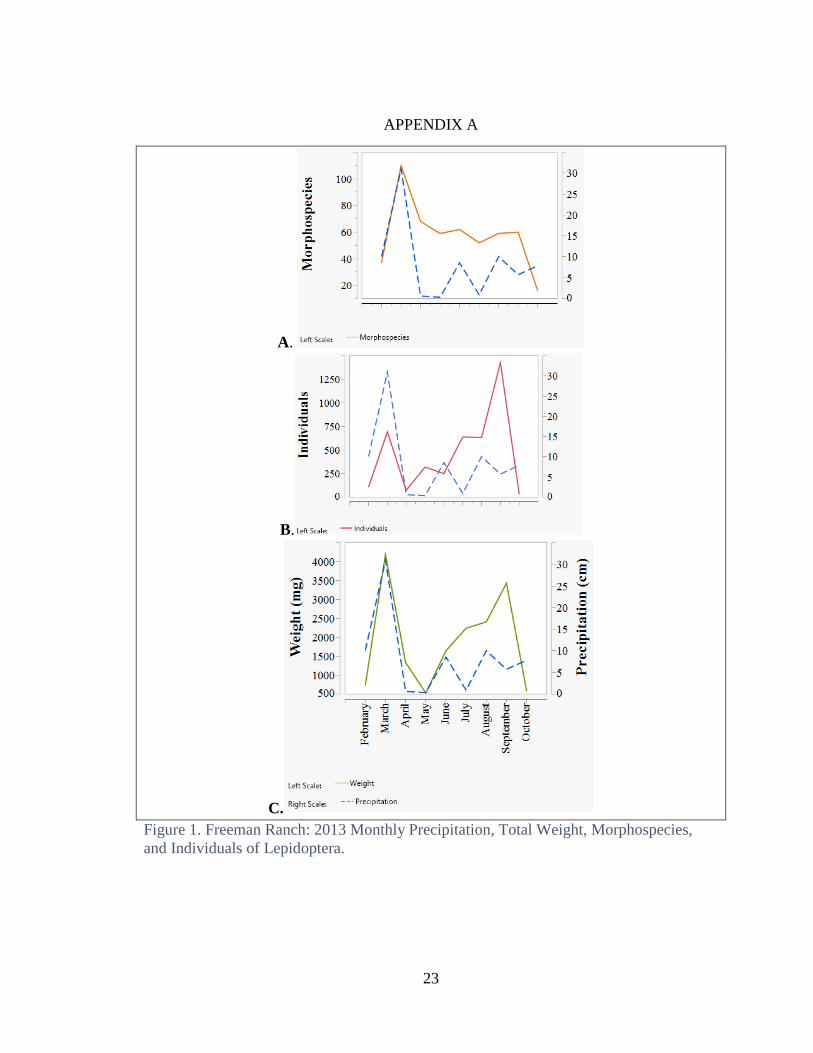
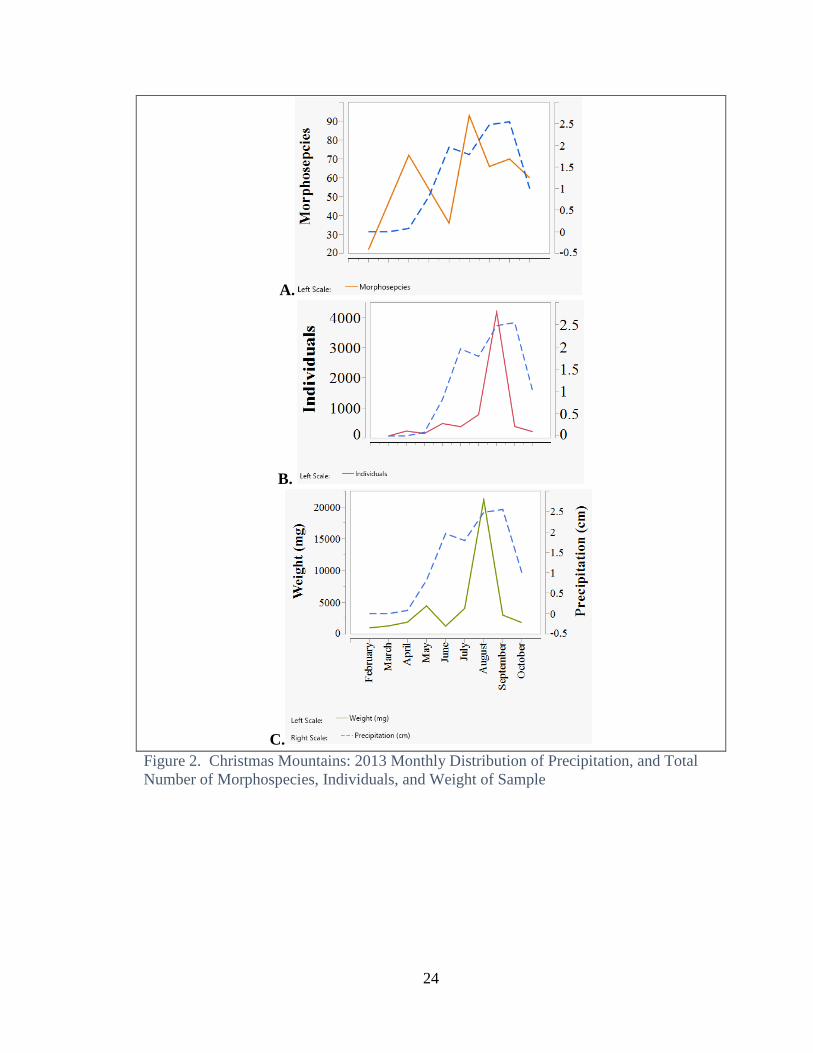
The number of morphospecies, total weight, and the number of individuals per
size class all reach a maximum during the month when precipitation reaches a maximum
(Fig 1 and 2). At Freeman Ranch this is during the spring and fall months, while at
Christmas Mountains it is at the peak of the summer monsoon in late summer. Total
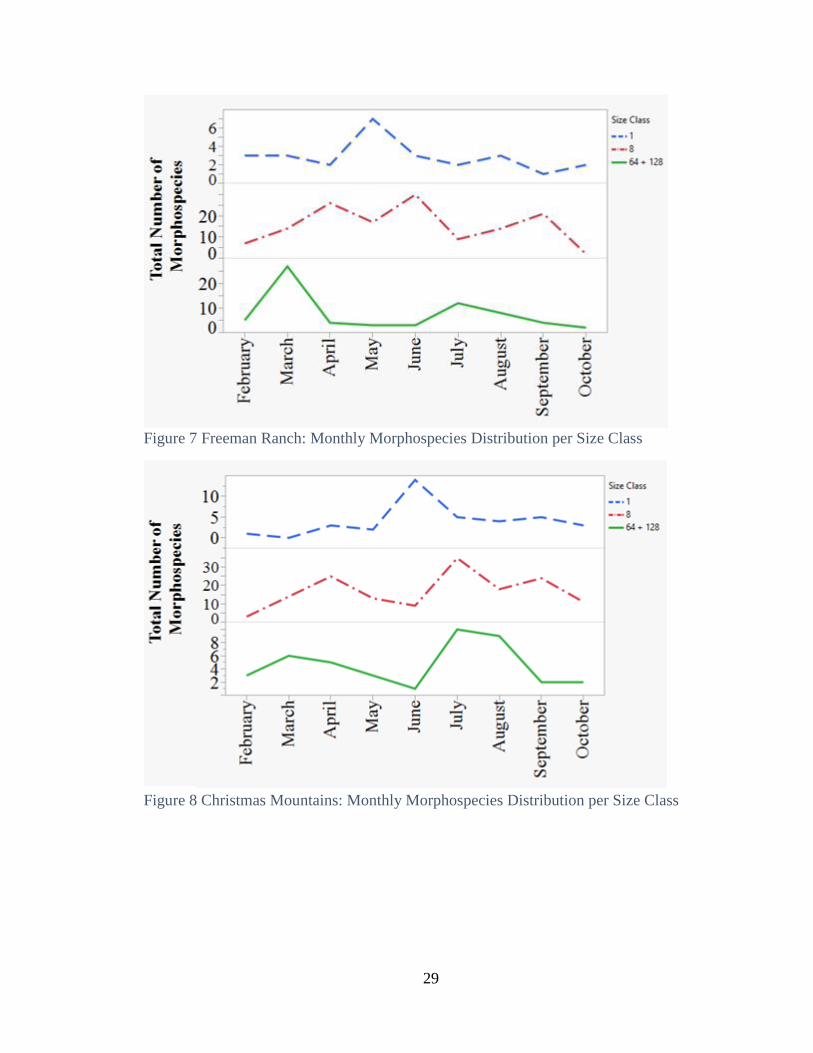
annual distribution of morphospecies varies in peaks per size class at both locations (Fig.
7 and 8). The annual totals of the number of morphospecies by size class at both sites
have a unimodal annual normal distribution (Fig. 3 and 4). The monthly distributions of
morphospecies per size class differs greatly from month to month, and rarely matches the
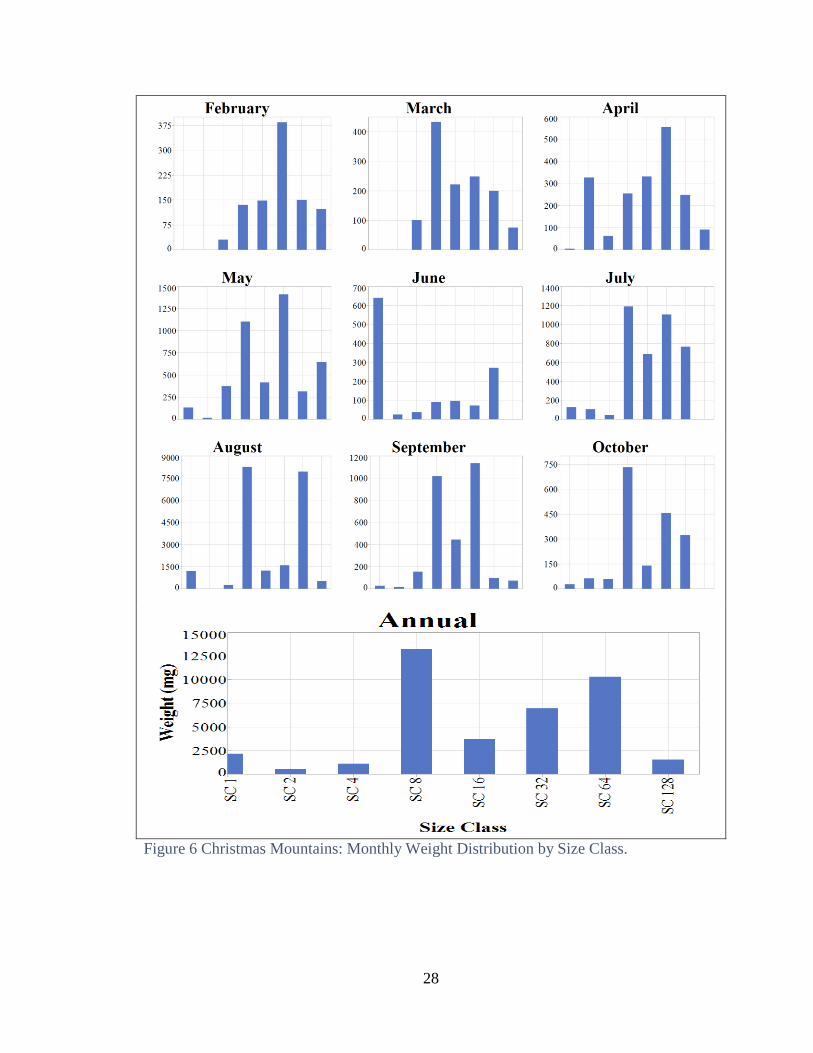
annual average. Annual weight by size class has a distribution that is skewed to the left at
both locations, with most of the weight in the larger size classes (Fig 5 and 6). Weight by
size class is greatest during months that had the highest amount of precipitation. i.e,
March and September at Freeman Ranch, and August in the Christmas Mountains

12
All data are compiled in the Appendix. These data include monthly mean and
cumulative values for precipitation, photoperiod and temperature, and temperature at time
of sampling. These are the highlights of the most pertinent data for the study.
Freeman Ranch
Monthly precipitation in Central Texas typically has a bimodal distribution with
most rain falling in the spring and fall. In 2013, there was heavy rainfall in March, some
rain in June and moderate rainfall in August, September and October. Both the total
number of individuals and total dry weight per month had a bimodal distribution, with
peaks in March and September (Fig. 1b and c).
The total number of morphospecies was highest in March and remained relatively
constant until dropping in October (Fig. 1c ). March has the highest total of
morphospecies coinciding with the major peak of precipitation.
Patterns of number of individuals and of weight per size classes, did not follow
that of total morphospecies. The annual pattern of total weight was bimodal with peaks in
March and September (Fig. 1c), and the annual pattern of the number of individuals was
also bimodal, with the largest amount in the late summer (Fig. 1b). Months that had the
highest total weight also had the largest number of morphospecies.
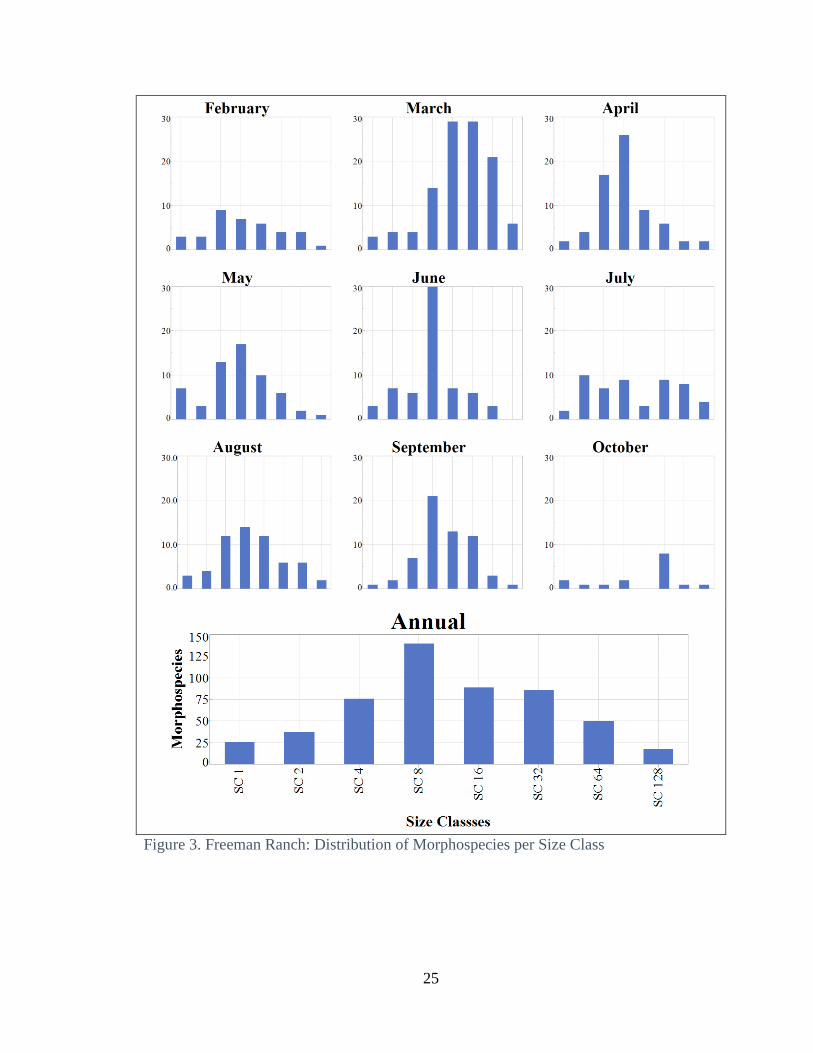
The summed annual distribution of morphospecies per size class is unimodal with
the highest number in the median size class, size class 8 (Fig 3, bottom panel). This
annual pattern breaks down at a monthly scale. June has the most dramatic difference
among size classes, with 30 morphospecies in size class 8, and with size classes 2 and 16
following with 7 morphospecies, respectively. Size classes representing the ends of the
13
spectrum, 1,2, and 128, are low in number of morphospecies in all months. In March,
weight was centered on larger body size classes, 8, 16, and 32 (Fig. 3).
Annual distributions of morphospecies were not consistent between size classes
(Fig. 7). Combined body-size classes 64 and 128 due to small sample size. Body-size
classes 64 and 128 peaked in March, coinciding with spring rainfall. Body-size class 8
had varied distribution not coinciding with rainfall. Body-size classes 1 peaked in May,
and in August coinciding with fall precipitation.
Annual distribution of total weight were not consistent between size classes (Fig.
9). Body-size classes 64 and 128 peaked in March, coinciding with increase in total
number of morphospecies. Body-size class 8 peaked in September.
Pearson’s Correlation Matrix
Numbers of individuals for body size classes 2, 8, 16, 32, 64 and 128, were
positively correlated with one another (Table 1). Body-size class 16 was the strongest
predictor of presence and total number of individuals for body-size classes 32, 64, and
128 (p <0.05). No environmental factors were statistically significant (p< 0.05) as
predictors for biotic, weight, response of the total sample and for all body size classes,
although the three correlations greater than r = 0.5 were negative (Table 1).
Total weight of the monthly sample was strongly correlated with the weights of
body-size classes 2, 16, 32, and 64, indicating that these comprise the majority of the
total sample weight. Size class 64 was positively correlated with size class 16 and 32 ( p
< 0.05 ). Total monthly precipitation was negatively correlated with body size class 128
14
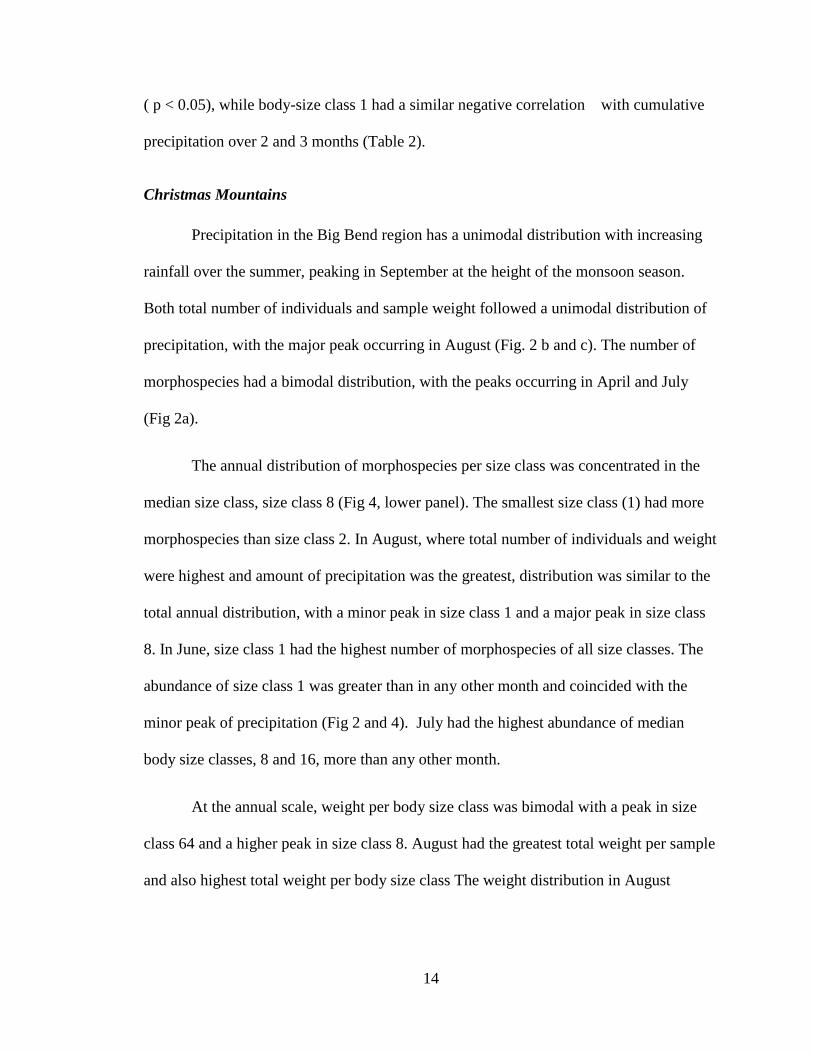
( p < 0.05), while body-size class 1 had a similar negative correlation with cumulative
precipitation over 2 and 3 months (Table 2).
Christmas Mountains
Precipitation in the Big Bend region has a unimodal distribution with increasing
rainfall over the summer, peaking in September at the height of the monsoon season.
Both total number of individuals and sample weight followed a unimodal distribution of
precipitation, with the major peak occurring in August (Fig. 2 b and c). The number of
morphospecies had a bimodal distribution, with the peaks occurring in April and July
(Fig 2a).
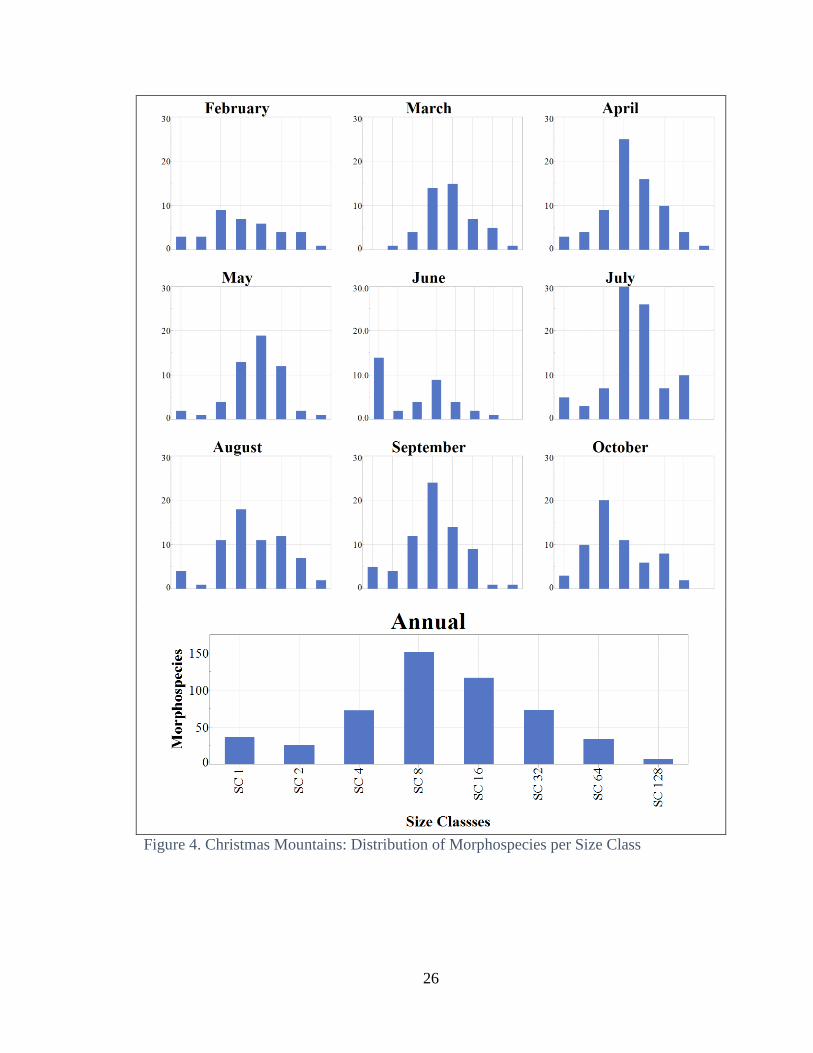
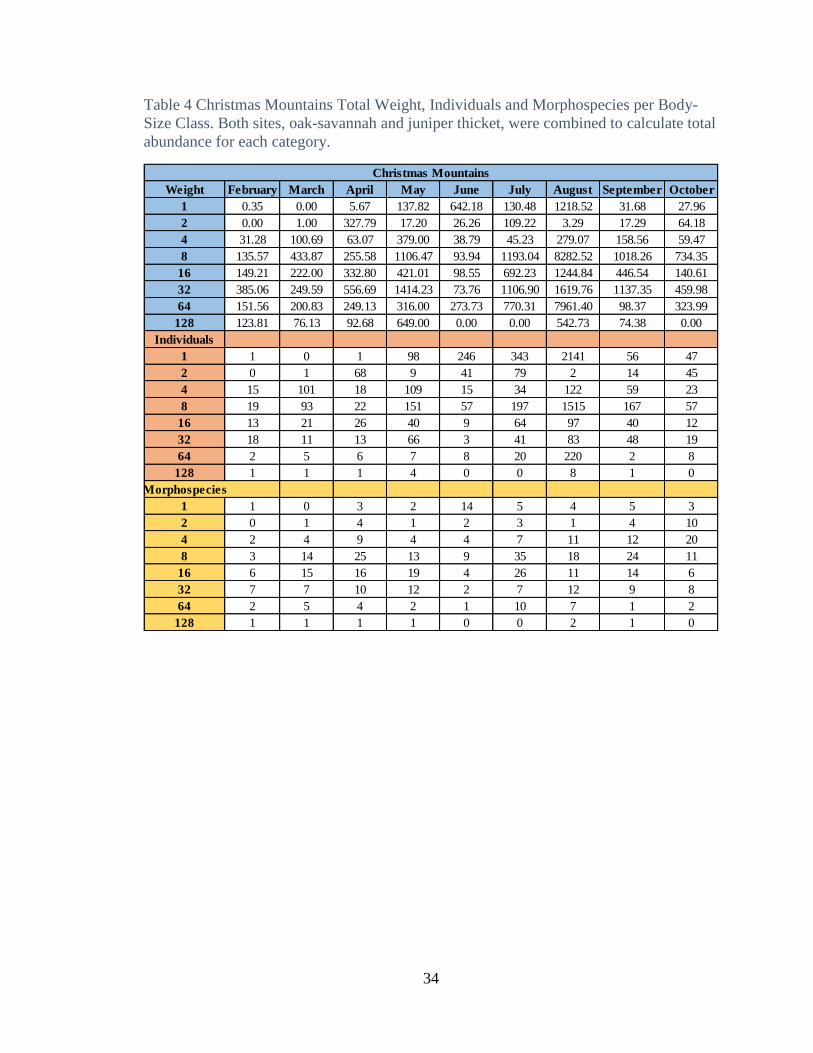
The annual distribution of morphospecies per size class was concentrated in the
median size class, size class 8 (Fig 4, lower panel). The smallest size class (1) had more
morphospecies than size class 2. In August, where total number of individuals and weight
were highest and amount of precipitation was the greatest, distribution was similar to the
total annual distribution, with a minor peak in size class 1 and a major peak in size class
8. In June, size class 1 had the highest number of morphospecies of all size classes. The
abundance of size class 1 was greater than in any other month and coincided with the
minor peak of precipitation (Fig 2 and 4). July had the highest abundance of median
body size classes, 8 and 16, more than any other month.
At the annual scale, weight per body size class was bimodal with a peak in size
class 64 and a higher peak in size class 8. August had the greatest total weight per sample
and also highest total weight per body size class The weight distribution in August
15
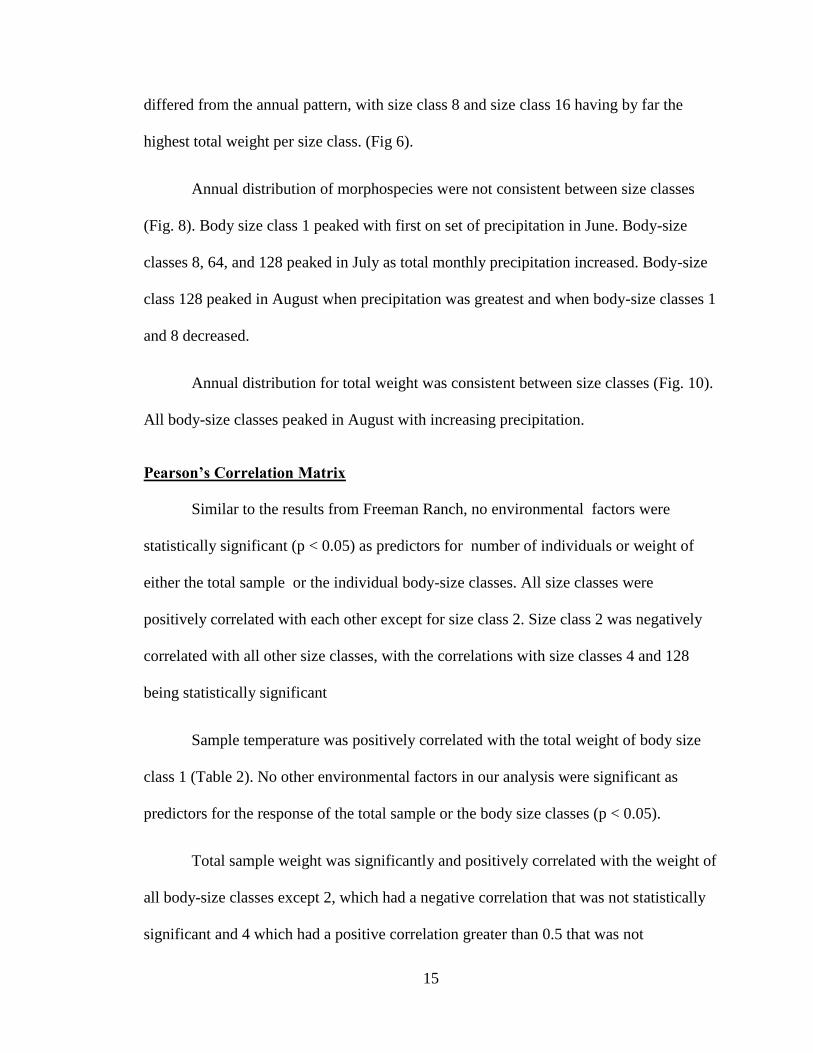
differed from the annual pattern, with size class 8 and size class 16 having by far the
highest total weight per size class. (Fig 6).
Annual distribution of morphospecies were not consistent between size classes
(Fig. 8). Body size class 1 peaked with first on set of precipitation in June. Body-size
classes 8, 64, and 128 peaked in July as total monthly precipitation increased. Body-size
class 128 peaked in August when precipitation was greatest and when body-size classes 1
and 8 decreased.
Annual distribution for total weight was consistent between size classes (Fig. 10).
All body-size classes peaked in August with increasing precipitation.
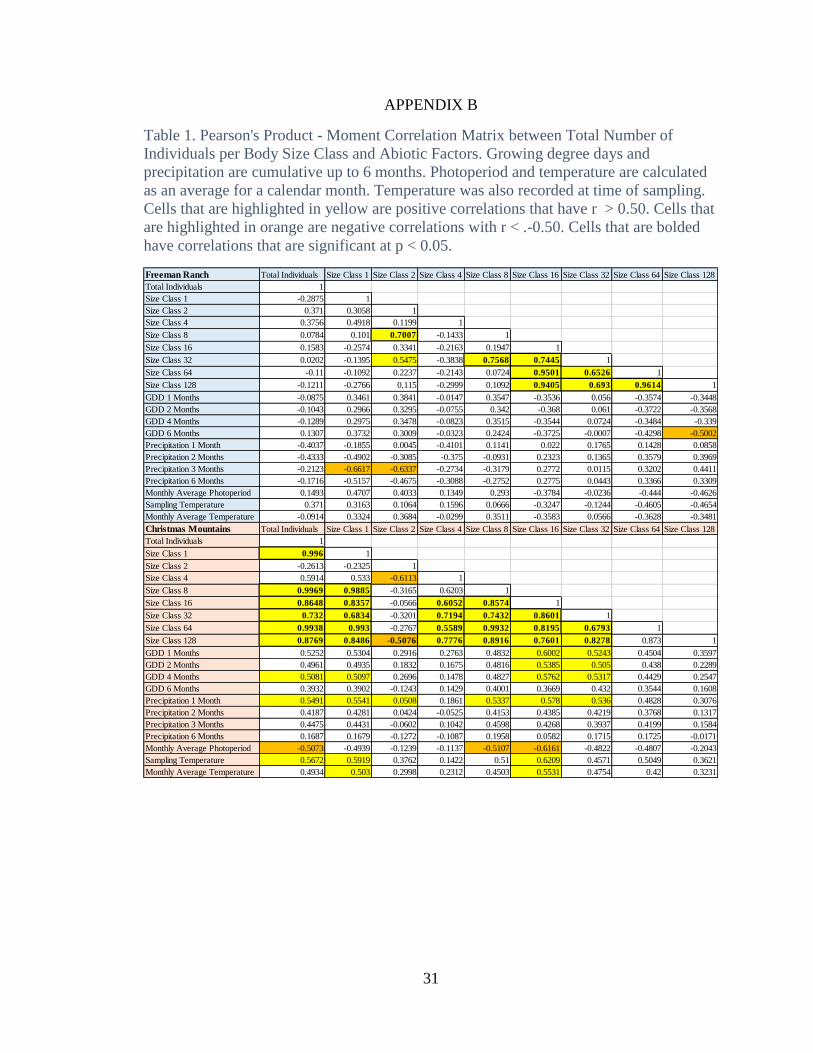
Pearson’s Correlation Matrix
Similar to the results from Freeman Ranch, no environmental factors were
statistically significant (p < 0.05) as predictors for number of individuals or weight of
either the total sample or the individual body-size classes. All size classes were
positively correlated with each other except for size class 2. Size class 2 was negatively
correlated with all other size classes, with the correlations with size classes 4 and 128
being statistically significant
Sample temperature was positively correlated with the total weight of body size
class 1 (Table 2). No other environmental factors in our analysis were significant as
predictors for the response of the total sample or the body size classes (p < 0.05).
Total sample weight was significantly and positively correlated with the weight of
all body-size classes except 2, which had a negative correlation that was not statistically
significant and 4 which had a positive correlation greater than 0.5 that was not

16
significantly significant at p<0.05 (Table 2). Increase in body weight in size class 1 was
correlated with increases in body-size classes 8, 16, and 64 (p < 0.05).

17
IV. DISCUSSION
Despite the fact that there were few correlations between specific environmental
factors and either the total number or weight of all lepidoptera or the number or weight of
the individual size classes, there were strong differences in the patterns observed at
Freeman Ranch in comparison to the Christmas Mountains. Specifically, there were
many more correlations and stronger correlations among the abundance and weights of
the body size classes at Christmas Mountains than at Freeman Ranch. This could be due
to the contrasting seasonal patterns of precipitation at the two locations.
There are also more correlations between abiotic factors and body size classes at
Christmas Mountains than at Freeman Ranch, which also likely due to the differences in
the precipitation patterns at each location. Rainfall at Freeman Ranch has a bimodal
distribution, peaking in the spring and in the fall, while Christmas Mountains has a
unimodal distribution peaking in the late summer (Fig 1 and 2). Water is a much more
limiting resource at the Christmas Mountains than at Freeman Ranch. In the desert,
precipitation is the driving force behind ecosystem dynamics. It is a signal to animals to
mate (Denlinger 1980), for plants to grow (Ogle and Reynolds 2004), and for seeds to
germinate (Clauss and Venable 2000). We can conclude that body size classes 1, 4, 8, 16,
32, 64 and 128 are responding and utilizing the same type of resources as they are all
strongly correlated with precipitation (Table 1). However, since the species composition
and productivity of the plant communities were not quantified, it is difficult to say what
resources are being utilized.
The lepidopteran community at Freeman Ranch is responding to a more complex
precipitation pattern than in the Christmas Mountains. The total number of individuals at
18
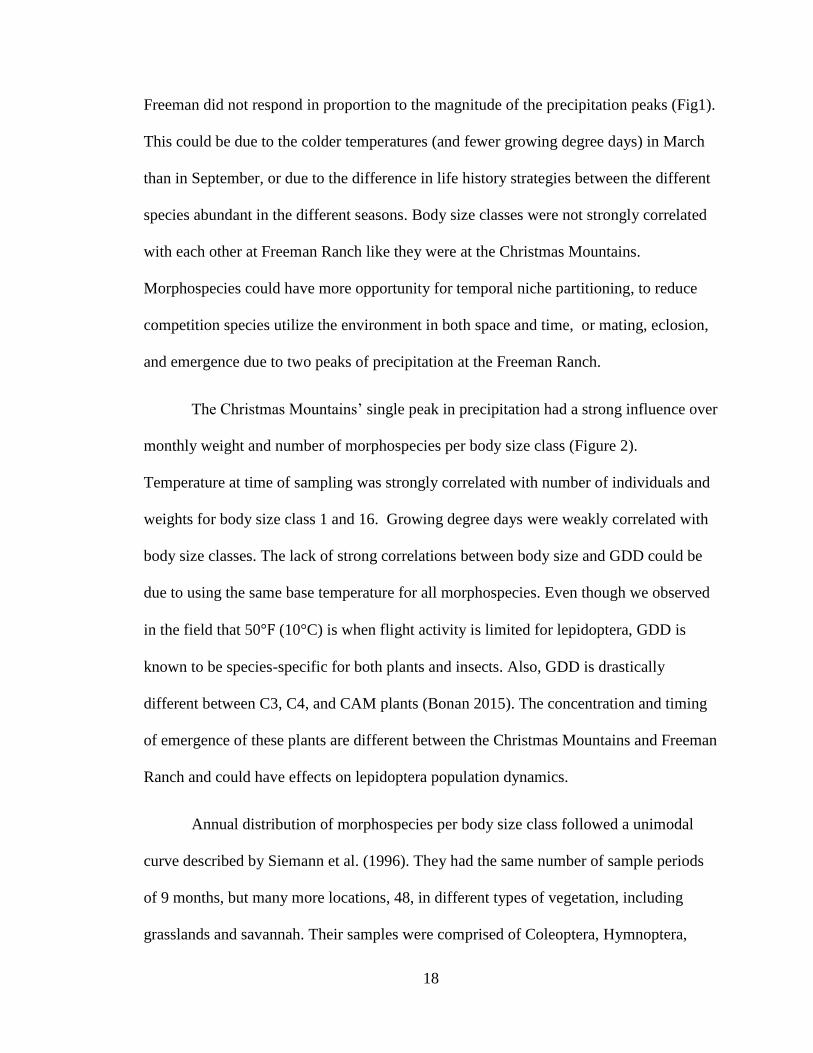
Freeman did not respond in proportion to the magnitude of the precipitation peaks (Fig1).
This could be due to the colder temperatures (and fewer growing degree days) in March
than in September, or due to the difference in life history strategies between the different
species abundant in the different seasons. Body size classes were not strongly correlated
with each other at Freeman Ranch like they were at the Christmas Mountains.
Morphospecies could have more opportunity for temporal niche partitioning, to reduce
competition species utilize the environment in both space and time, or mating, eclosion,
and emergence due to two peaks of precipitation at the Freeman Ranch.
The Christmas Mountains’ single peak in precipitation had a strong influence over
monthly weight and number of morphospecies per body size class (Figure 2).
Temperature at time of sampling was strongly correlated with number of individuals and
weights for body size class 1 and 16. Growing degree days were weakly correlated with
body size classes. The lack of strong correlations between body size and GDD could be
due to using the same base temperature for all morphospecies. Even though we observed
in the field that 50°F (10°C) is when flight activity is limited for lepidoptera, GDD is
known to be species-specific for both plants and insects. Also, GDD is drastically
different between C3, C4, and CAM plants (Bonan 2015). The concentration and timing
of emergence of these plants are different between the Christmas Mountains and Freeman
Ranch and could have effects on lepidoptera population dynamics.
Annual distribution of morphospecies per body size class followed a unimodal
curve described by Siemann et al. (1996). They had the same number of sample periods
of 9 months, but many more locations, 48, in different types of vegetation, including
grasslands and savannah. Their samples were comprised of Coleoptera, Hymnoptera,
19
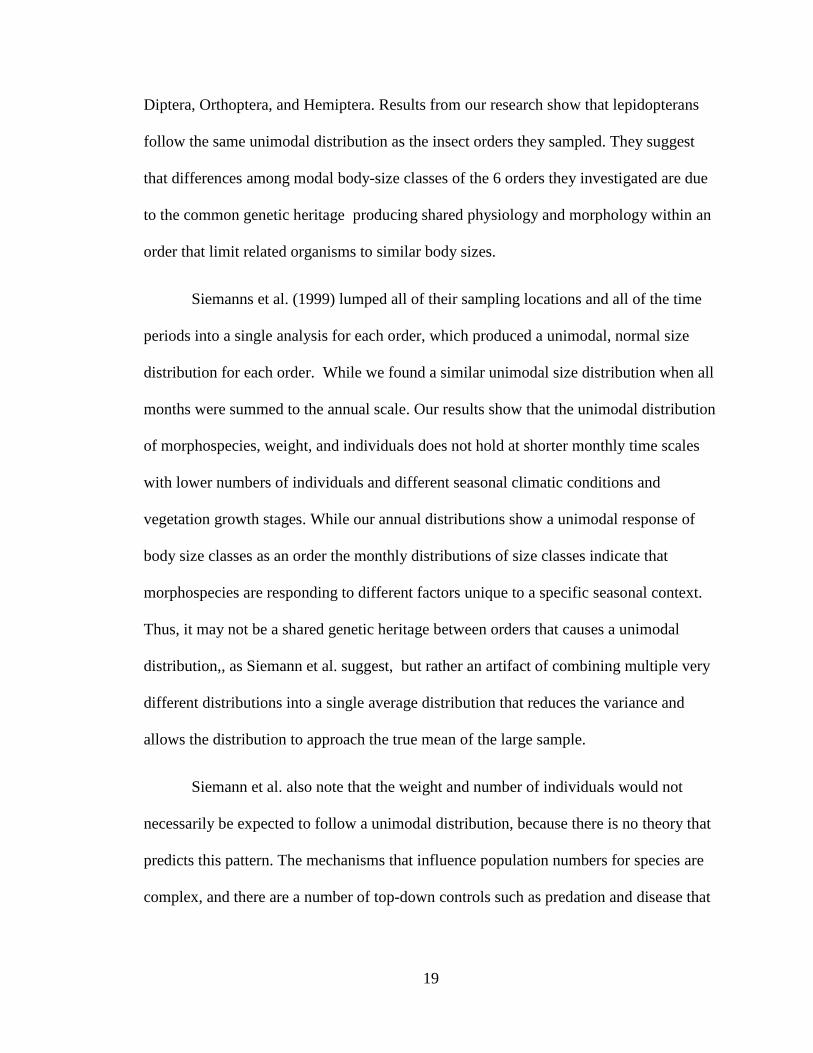
Diptera, Orthoptera, and Hemiptera. Results from our research show that lepidopterans
follow the same unimodal distribution as the insect orders they sampled. They suggest
that differences among modal body-size classes of the 6 orders they investigated are due
to the common genetic heritage producing shared physiology and morphology within an
order that limit related organisms to similar body sizes.
Siemanns et al. (1999) lumped all of their sampling locations and all of the time
periods into a single analysis for each order, which produced a unimodal, normal size
distribution for each order. While we found a similar unimodal size distribution when all
months were summed to the annual scale. Our results show that the unimodal distribution
of morphospecies, weight, and individuals does not hold at shorter monthly time scales
with lower numbers of individuals and different seasonal climatic conditions and
vegetation growth stages. While our annual distributions show a unimodal response of
body size classes as an order the monthly distributions of size classes indicate that
morphospecies are responding to different factors unique to a specific seasonal context.
Thus, it may not be a shared genetic heritage between orders that causes a unimodal
distribution,, as Siemann et al. suggest, but rather an artifact of combining multiple very
different distributions into a single average distribution that reduces the variance and
allows the distribution to approach the true mean of the large sample.
Siemann et al. also note that the weight and number of individuals would not
necessarily be expected to follow a unimodal distribution, because there is no theory that
predicts this pattern. The mechanisms that influence population numbers for species are
complex, and there are a number of top-down controls such as predation and disease that

20
affect population numbers and various life history properties such as fecundity and
mating success also have effects.
Future considerations
This work has multiple lessons for future studies. First, meteorological data
should be obtained directly from the sites at each location by a weather station. This is
most important in the Christmas Mountains where microclimates are highly
heterogeneous and may have a greater effect on local populations. It would also be
important to analyze multiple years of data to determine if the body size responses are
typical for the region, or vary from one year to the next. This would also lead to larger
sample sizes and allow more complex statistical analysis to investigate nonlinear
relationships.
A starting point for evaluating environmental biotic effects on body size
distribution would be to catalog species and biomass of plants at each site during the
sampling period. Collecting plant biomass synchronously with insect sampling would
allow investigation of how plant productivity and diversity affect insect body size
distributions. Productivity of plants determines the amount and type of herbivores, such
as lepidopterans, that an ecosystem can support (Huston and Wolverton 2011), while
diversity of plants determines the diversity of insect herbivores (Knops et al. 1999). Our
results have shown that the Christmas Mountains have more insect biomass, more
morphospecies, and more individuals than the Freeman Ranch, at least for the subset of
moths that are active for the two hours after sunset. Evaluating variation in plant
productivity and how variation in insect body size distribution responds might help
answer why the insect communities at these two sites have patterns of abundance, total

21
weight, and number of morphospecies that are negatively correlated with the amount of
precipitation at each site, contrary to what would be expected.
We conclude that there is a need for future research in how lepidoptera respond to
environmental factors. This study is a starting point for future comparative studies based
on a precipitation gradient. It has been demonstrated that in an environment where water
is limited, the Chihuahuan Desert, individuals across body-size classes respond to the
influx of rain. In contrast in environment where rainfall is distributed throughout the year,
Freeman Ranch, individuals do not respond consistently to precipitation. With the
inclusion of more studies across the precipitation gradient it would be interesting to see if
this response of individuals changes with increasing amounts of rainfall.

22
APPENDIX SECTION
Appendix A ................................................................................................................23
Appendix B ................................................................................................................31
23
APPENDIX A
A.
B.
C.
Figure 1. Freeman Ranch: 2013 Monthly Precipitation, Total Weight, Morphospecies,
and Individuals of Lepidoptera.
24
A.
B.
C.
Figure 2. Christmas Mountains: 2013 Monthly Distribution of Precipitation, and Total
Number of Morphospecies, Individuals, and Weight of Sample
25
Figure 3. Freeman Ranch: Distribution of Morphospecies per Size Class
26
Figure 4. Christmas Mountains: Distribution of Morphospecies per Size Class

27
Figure 5. Freeman Ranch: Monthly Weight Distribution by Size Class.
28
Figure 6 Christmas Mountains: Monthly Weight Distribution by Size Class.
29
Figure 7 Freeman Ranch: Monthly Morphospecies Distribution per Size Class
Figure 8 Christmas Mountains: Monthly Morphospecies Distribution per Size Class

30
Figure 9 Freeman Ranch: Monthly Weight Distribution per Size Class
Figure 10 Christmas Mountains: Monthly Weight Distribution per Size Class
31
APPENDIX B
Table 1. Pearson's Product - Moment Correlation Matrix between Total Number of
Individuals per Body Size Class and Abiotic Factors. Growing degree days and
precipitation are cumulative up to 6 months. Photoperiod and temperature are calculated
as an average for a calendar month. Temperature was also recorded at time of sampling.
Cells that are highlighted in yellow are positive correlations that have r > 0.50. Cells that
are highlighted in orange are negative correlations with r < .-0.50. Cells that are bolded
have correlations that are significant at p < 0.05.
Freeman Ranch Total Individuals Size Class 1 Size Class 2 Size Class 4 Size Class 8 Size Class 16 Size Class 32 Size Class 64 Size Class 128
Total Individuals 1
Size Class 1 -0.2875 1
Size Class 2 0.371 0.3058 1
Size Class 4 0.3756 0.4918 0.1199 1
Size Class 8 0.0784 0.101 0.7007 -0.1433 1
Size Class 16 0.1583 -0.2574 0.3341 -0.2163 0.1947 1
Size Class 32 0.0202 -0.1395 0.5475 -0.3838 0.7568 0.7445 1
Size Class 64 -0.11 -0.1092 0.2237 -0.2143 0.0724 0.9501 0.6526 1
Size Class 128 -0.1211 -0.2766 0.115 -0.2999 0.1092 0.9405 0.693 0.9614 1
GDD 1 Months -0.0875 0.3461 0.3841 -0.0147 0.3547 -0.3536 0.056 -0.3574 -0.3448
GDD 2 Months -0.1043 0.2966 0.3295 -0.0755 0.342 -0.368 0.061 -0.3722 -0.3568
GDD 4 Months -0.1289 0.2975 0.3478 -0.0823 0.3515 -0.3544 0.0724 -0.3484 -0.339
GDD 6 Months 0.1307 0.3732 0.3009 -0.0323 0.2424 -0.3725 -0.0007 -0.4298 -0.5002
Precipitation 1 Month -0.4037 -0.1855 0.0045 -0.4101 0.1141 0.022 0.1765 0.1428 0.0858
Precipitation 2 Months -0.4333 -0.4902 -0.3085 -0.375 -0.0931 0.2323 0.1365 0.3579 0.3969
Precipitation 3 Months -0.2123 -0.6617 -0.6337 -0.2734 -0.3179 0.2772 0.0115 0.3202 0.4411
Precipitation 6 Months -0.1716 -0.5157 -0.4675 -0.3088 -0.2752 0.2775 0.0443 0.3366 0.3309
Monthly Average Photoperiod 0.1493 0.4707 0.4033 0.1349 0.293 -0.3784 -0.0236 -0.444 -0.4626
Sampling Temperature 0.371 0.3163 0.1064 0.1596 0.0666 -0.3247 -0.1244 -0.4605 -0.4654
Monthly Average Temperature -0.0914 0.3324 0.3684 -0.0299 0.3511 -0.3583 0.0566 -0.3628 -0.3481
Christmas Mountains Total Individuals Size Class 1 Size Class 2 Size Class 4 Size Class 8 Size Class 16 Size Class 32 Size Class 64 Size Class 128
Total Individuals 1
Size Class 1 0.996 1
Size Class 2 -0.2613 -0.2325 1
Size Class 4 0.5914 0.533 -0.6113 1
Size Class 8 0.9969 0.9885 -0.3165 0.6203 1
Size Class 16 0.8648 0.8357 -0.0566 0.6052 0.8574 1
Size Class 32 0.732 0.6834 -0.3201 0.7194 0.7432 0.8601 1
Size Class 64 0.9938 0.993 -0.2767 0.5589 0.9932 0.8195 0.6793 1
Size Class 128 0.8769 0.8486 -0.5076 0.7776 0.8916 0.7601 0.8278 0.873 1
GDD 1 Months 0.5252 0.5304 0.2916 0.2763 0.4832 0.6002 0.5243 0.4504 0.3597
GDD 2 Months 0.4961 0.4935 0.1832 0.1675 0.4816 0.5385 0.505 0.438 0.2289
GDD 4 Months 0.5081 0.5097 0.2696 0.1478 0.4827 0.5762 0.5317 0.4429 0.2547
GDD 6 Months 0.3932 0.3902 -0.1243 0.1429 0.4001 0.3669 0.432 0.3544 0.1608
Precipitation 1 Month 0.5491 0.5541 0.0508 0.1861 0.5337 0.578 0.536 0.4828 0.3076
Precipitation 2 Months 0.4187 0.4281 0.0424 -0.0525 0.4153 0.4385 0.4219 0.3768 0.1317
Precipitation 3 Months 0.4475 0.4431 -0.0602 0.1042 0.4598 0.4268 0.3937 0.4199 0.1584
Precipitation 6 Months 0.1687 0.1679 -0.1272 -0.1087 0.1958 0.0582 0.1715 0.1725 -0.0171
Monthly Average Photoperiod -0.5073 -0.4939 -0.1239 -0.1137 -0.5107 -0.6161 -0.4822 -0.4807 -0.2043
Sampling Temperature 0.5672 0.5919 0.3762 0.1422 0.51 0.6209 0.4571 0.5049 0.3621
Monthly Average Temperature 0.4934 0.503 0.2998 0.2312 0.4503 0.5531 0.4754 0.42 0.3231

32
Table 2. Pearson's Product - Moment Correlation Matrix between Total Weight of
Individuals per Body Size Class and Abiotic Factors. Growing degree days and
precipitation are cumulative up to 6 months. Photoperiod and temperature are calculated
as an average for a calendar month. Temperature was also recorded at time of sampling.
Cells that are highlighted in yellow are positive correlations that have r > 0.50. Cells that
are highlighted in orange are negative correlations with r < .-0.50. Cells that are bolded
have correlations that are significant at p < 0.05
Freeman Ranch Total Weight Size Class 1 Size Class 2 Size Class 4 Size Class 8 Size Class 16 Size Class 32 Size Class 64 Size Class 128
Total Weight 1
Size Class 1 0.1744 1
Size Class 2 0.8859 0.2772 1
Size Class 4 0.0726 0.4834 0.0668 1
Size Class 8 0.546 0.0769 0.6563 0.0002 1
Size Class 16 0.7592 0.3757 0.5863 -0.0021 0.0079 1
Size Class 32 0.7226 -0.4173 0.5544 -0.3503 0.222 0.4812 1
Size Class 64 0.6991 0.0238 0.498 -0.1487 -0.1682 0.9029 0.7097 1
Size Class 128 0.295 -0.0393 0.0543 0.6077 -0.1723 0.1745 0.2284 0.2721 1
GDD 1 Months 0.0376 0.2348 0.0961 -0.1993 0.4678 -0.1251 -0.0569 -0.3406 -0.4528
GDD 2 Months -0.0158 0.1853 0.0763 -0.2771 0.4456 -0.1806 -0.0486 -0.3654 -0.5256
GDD 4 Months 0.0015 0.1716 0.0886 -0.2749 0.4483 -0.1597 -0.0271 -0.3411 -0.5364
GDD 6 Months -0.1438 0.3442 0.0526 -0.4551 0.3721 -0.177 -0.2457 -0.391 -0.7506
Precipitation 1 Month -0.0685 -0.3847 0.0629 -0.4289 0.0024 -0.0647 0.2927 0.1002 -0.6098
Precipitation 2 Months -0.0297 -0.6152 -0.0327 -0.0859 -0.2762 -0.043 0.4132 0.2758 0.0214
Precipitation 3 Months -0.1434 -0.6129 -0.1826 0.1017 -0.49 -0.1589 0.2866 0.219 0.4761
Precipitation 6 Months -0.1693 -0.512 -0.1063 -0.1508 -0.4456 -0.0626 0.2244 0.2724 0.0249
Monthly Average Photoperiod 0.0025 0.4519 0.0767 -0.1711 0.4595 -0.0982 -0.249 -0.3946 -0.4168
Sampling Temperature -0.1691 0.4464 -0.05 -0.1803 0.2284 -0.1995 -0.3901 -0.4201 -0.2543
Monthly Average Temperature 0.0234 0.222 0.09 -0.2176 0.4622 -0.1413 -0.0551 -0.3489 -0.4679
Christmas Mountains Total Weight Size Class 1 Size Class 2 Size Class 4 Size Class 8 Size Class 16 Size Class 32 Size Class 64 Size Class 128
Total Weight 1
Size Class 1 0.8486 1
Size Class 2 -0.2033 -0.2728 1
Size Class 4 0.5676 0.3614 -0.3081 1
Size Class 8 0.9965 0.8409 -0.2314 0.5336 1
Size Class 16 0.9243 0.6863 -0.0658 0.5274 0.9106 1
Size Class 32 0.7126 0.3821 -0.1207 0.7796 0.6829 0.836 1
Size Class 64 0.9861 0.8762 -0.1958 0.451 0.99 0.8775 0.5908 1
Size Class 128 0.6442 0.4553 -0.2576 0.9406 0.6043 0.5605 0.7283 0.557 1
GDD 1 Months 0.5121 0.6404 -0.0395 0.3972 0.4796 0.5777 0.541 0.446 0.2888
GDD 2 Months 0.4822 0.4851 -0.2328 0.2147 0.4968 0.5253 0.5058 0.4346 0.0422
GDD 4 Months 0.4966 0.5301 -0.1475 0.2528 0.4957 0.5587 0.5473 0.4395 0.1016
GDD 6 Months 0.3781 0.3359 -0.56 0.1277 0.4184 0.3562 0.3751 0.3534 -0.0156
Precipitation 1 Month 0.5265 0.6108 -0.3044 0.2518 0.5275 0.5682 0.5211 0.4789 0.1106
Precipitation 2 Months 0.3982 0.3905 -0.3556 0.0091 0.4241 0.4335 0.4077 0.3757 -0.0942
Precipitation 3 Months 0.4266 0.3413 -0.4038 0.0221 0.4745 0.4305 0.3599 0.4183 -0.1191
Precipitation 6 Months 0.1654 0.0976 -0.3609 -0.0769 0.2227 0.0808 0.1263 0.1717 -0.2058
Monthly Average Photoperiod -0.4986 -0.2584 0.1846 -0.0001 -0.5359 -0.6055 -0.5012 -0.482 0.0752
Sampling Temperature 0.54 0.7062 0.0382 0.2627 0.4985 0.6059 0.4733 0.5017 0.2657
Monthly Average Temperature 0.4761 0.6395 -0.0326 0.3603 0.4433 0.5332 0.4908 0.4151 0.2518

33
Table 3. Freeman Ranch Total Weight, Individuals, and Morphospecies by Body-Size
Class. Both sites, oak-savannah and juniper thicket, were combined to calculate total
abundance for each category.
Weight February March April May June July August September October
1 1.13 2.72 98.08 12.91 109.60 426.29 240.28 0.89 43.23
2 22.12 126.70 21.34 7.42 4.29 153.87 16.44 145.00 1.60
4 55.29 7.88 209.58 41.71 7.34 137.70 63.87 26.87 4.57
8 50.30 91.56 246.84 186.27 298.24 815.88 323.31 2101.67 17.08
16 118.77 840.92 115.00 124.79 82.03 541.76 596.67 200.27 0.00
32 236.00 1137.98 332.13 76.39 297.81 183.44 188.55 718.05 397.73
64 247.62 1344.86 148.20 89.25 91.31 414.27 478.25 145.73 42.31
128 0.00 389.04 640.12 251.08 163.91 163.91 84.37 84.37 0.00
Individuals
1 44 8 4 154 162 2 376 195 5
2 12 87 6 6 3 162 128 150 1
4 17 3 16 71 4 30 48 15 2
8 9 298 29 58 47 363 38 983 3
16 10 158 9 16 12 47 22 17 0
32 9 76 6 11 20 32 9 64 16
64 6 49 2 3 2 3 13 3 1
128 0 15 2 1 0 0 1 1 1
Morphospecies
1 3 3 2 7 3 2 3 1 2
2 3 4 4 3 7 10 4 2 1
4 9 4 17 13 6 7 12 7 1
8 7 14 26 17 30 9 14 21 2
16 6 29 9 10 7 3 12 13 0
32 4 29 6 6 6 9 6 12 8
64 4 21 2 2 3 8 6 3 1
128 1 6 2 1 0 4 2 1 1
Freeman Ranch
34
Table 4 Christmas Mountains Total Weight, Individuals and Morphospecies per Body-
Size Class. Both sites, oak-savannah and juniper thicket, were combined to calculate total
abundance for each category.
Weight February March April May June July August September October
1 0.35 0.00 5.67 137.82 642.18 130.48 1218.52 31.68 27.96
2 0.00 1.00 327.79 17.20 26.26 109.22 3.29 17.29 64.18
4 31.28 100.69 63.07 379.00 38.79 45.23 279.07 158.56 59.47
8 135.57 433.87 255.58 1106.47 93.94 1193.04 8282.52 1018.26 734.35
16 149.21 222.00 332.80 421.01 98.55 692.23 1244.84 446.54 140.61
32 385.06 249.59 556.69 1414.23 73.76 1106.90 1619.76 1137.35 459.98
64 151.56 200.83 249.13 316.00 273.73 770.31 7961.40 98.37 323.99
128 123.81 76.13 92.68 649.00 0.00 0.00 542.73 74.38 0.00
Individuals
1 1 0 1 98 246 343 2141 56 47
2 0 1 68 9 41 79 2 14 45
4 15 101 18 109 15 34 122 59 23
8 19 93 22 151 57 197 1515 167 57
16 13 21 26 40 9 64 97 40 12
32 18 11 13 66 3 41 83 48 19
64 2 5 6 7 8 20 220 2 8
128 1 1 1 4 0 0 8 1 0
Morphospecies
1 1 0 3 2 14 5 4 5 3
2 0 1 4 1 2 3 1 4 10
4 2 4 9 4 4 7 11 12 20
8 3 14 25 13 9 35 18 24 11
16 6 15 16 19 4 26 11 14 6
32 7 7 10 12 2 7 12 9 8
64 2 5 4 2 1 10 7 1 2
128 1 1 1 1 0 0 2 1 0
Christmas Mountains

35
REFERENCES
• Angilletta, M.J.,Jr Steury, T.D. & Sears, M.W. (2004)Temperature, growth rate,
and body size in ectotherms: fitting pieces of a life-history puzzle. Integrative and
comparative biology 44: 498-509.
• Baker, D. Sharratt, B. Chiang, H. Zandlo, J. & Ruschy, D. (1984) Base temperature
selection for the prediction of European corn borer instars by the growing degree
day method.Agricultural and Forest Meteorology 32: 55-60.
• Bergmann, C. (1848) Über die Verhältnisse der Wärmeökonomie der Thiere zu
ihrer Grösse.
• Bidau, C.J. Miño, C.I. Castillo, E.R. & Martí, D.A. (2012) Effects of abiotic factors
on the geographic distribution of body size variation and chromosomal
polymorphisms in two neotropical grasshopper species (Dichroplus: Melanoplinae:
Acrididae).Psyche: A Journal of Entomology 2012.
• Bonan, G. (2015) Ecological climatology: concepts and applications. Cambridge
University Press.
• Butler, L. Kondo, V. Barrows, E.M. & Townsend, E.C. (1999) Effects of weather
conditions and trap types on sampling for richness and abundance of forest
macrolepidoptera.Environmental Entomology 28: 795-811.
• Cayton, H.L. Haddad, N.M. Gross, K. Diamond, S.E. & Ries, L. (2015) Do
growing degree days predict phenology across butterfly species? Ecology 96: 1473-
1479.
• Clauss, M., and Venable, D. (2000) Seed germination in desert annuals: an
empirical test of adaptive bet hedging. The American Naturalist 155: 168-186.

36
• Damos, P., and Savopoulou-Soultani, M. (2011) Temperature-driven models for
insect development and vital thermal requirements. Psyche: A Journal of
Entomology 2012.
• Davidowitz, G. D'Amico, L.J. & Nijhout, H.F. (2003) Critical weight in the
development of insect body size. Evolution & Development 5: 188-197.
• De Freitas, F.A. Zanuncio, T.V. Zanuncio, J.C. Da Conceição, P.M. Fialho, Maria
do Carmo Queiroz & Bernardino, A.S. (2005)Effect of plant age, temperature and
rainfall on Lepidoptera insect pests collected with light traps in a Eucalyptus
grandis plantation in Brazil. Annals of Forest Science 62: 85-90.
• Denlinger, D.L. (1980) Seasonal and annual variation of insect abundance in the
Nairobi National Park, Kenya. Biotropica : 100-106.
• Hilty, J., and Merenlender, A. (2000) Faunal indicator taxa selection for
monitoring ecosystem health. Biological Conservation 92: 185-197.
• Huston, M.A., and Wolverton, S. (2011) Regulation of animal size by eNPP,
Bergmann's rule and related phenomena.Ecological Monographs 81: 349-405.
• Jones, P. Trenberth, K. Ambenje, P. Bojariu, R. Easterling, D. Klein, T. Parker, D.
Renwick, J. Rusticucci, M. & Soden, B. (2007) Observations: surface and
atmospheric climate change.IPCC, Climate change : 235-336.
• Kingsolver, J.G., and Huey, R.B. (2008) Size, temperature, and fitness: three
rules. Evolutionary Ecology Research 10: 251-268.
• Kivelä, S.M. Välimäki, P. Carrasco, D. Mäenpää, M.I. & Oksanen, J.
(2011) Latitudinal insect body size clines revisited: a critical evaluation of the saw‐
tooth model. Journal of Animal Ecology 80: 1184-1195.

37
• Klok, C.J., and Harrison, J.F. (2013) The temperature size rule in arthropods:
independent of macro-environmental variables but size dependent. Integrative and
comparative biology 53: 557-570.
• Knops, J.M. Tilman, D. Haddad, N.M. Naeem, S. Mitchell, C.E. Haarstad, J.
Ritchie, M.E. Howe, K.M. Reich, P.B. & Siemann, E. (1999) Effects of plant species
richness on invasion dynamics, disease outbreaks, insect abundances and
diversity. Ecology Letters 2: 286-293.
• LaBarbera, M. (1989) Analyzing body size as a factor in ecology and
evolution. Annual Review of Ecology and Systematics : 97-117.
• Maelzer, D., and Zalucki, M. (1999) Analysis of long-term light-trap data for
Helicoverpa spp.(Lepidoptera: Noctuidae) in Australia: the effect of climate and
crop host plants. Bulletin of entomological research 89: 455-463.
• McGeachie, W. (1989) The effects of moonlight illuminance, temperature and wind
speed on light-trap catches of moths.Bulletin of entomological research 79: 185-192.
• Muirhead-Thompson, R. (2012) Trap responses of flying insects: the influence of
trap design on capture efficiency.Academic Press, .
• New, T. (1997) Are Lepidoptera an effective ‘umbrella group ‘for biodiversity
conservation? Journal of Insect Conservation 1: 5-12.
• Nowinszky, L. (2004) Nocturnal illumination and night flying insects. Applied
ecology and environmental research 2: 17-52.
• Ogle, K., and Reynolds, J.F. (2004) Plant responses to precipitation in desert
ecosystems: integrating functional types, pulses, thresholds, and
delays. Oecologia 141: 282-294.

38
• Peters, R.H. (1986) The ecological implications of body size.Cambridge University
Press, .
• Raimondo, S. Liebhold, A.M. Strazanac, J.S. & Butler, L. (2004) Population
synchrony within and among Lepidoptera species in relation to weather, phylogeny,
and larval phenology.Ecological Entomology 29: 96-105.
• Ray, C. (1960) The application of Bergmann's and Allen's rules to the
poikilotherms. Journal of Morphology 106: 85-108.
• Robiquet, T. (1839) Rapport suir un memoire addresse a la Academie Royale de
Medicin par MM Sarrus et Rameaux. Bulletin of academic Research 3: 1090-1100.
• Semlitsch, R.D. Scott, D.E. Pechmann, J.H. & Gibbons, J.W. (1993) Phenotypic
variation in the arrival time of breeding salamanders: individual repeatability and
environmental influences. Journal of Animal Ecology : 334-340.
• Siemann, E. Tilman, D. & Haarstard, J. (1996) Insect species diversity, abundance
and body size relationships. letters to nature 380: 704-706.
• Thomson, A. Shepherd, R. Harris, J. & Silversides, R. (1984)Relating weather to
outbreaks of western spruce budworm, Choristoneura occidentalis (Lepidoptera:
Tortricidae), in British Columbia. The Canadian Entomologist 116: 375-381.
• Trenberth, K.E. (2011) Changes in precipitation with climate change. Climate
Research 47: 123.
• Wainwright, P.C. (1994) Functional morphology as a tool in ecological
research. Ecological morphology: integrative organismal biology.University of
Chicago Press, Chicago : 42-59.

39
• White, E.P. Ernest, S.M. Kerkhoff, A.J. & Enquist, B.J. (2007)Relationships
between body size and abundance in ecology.Trends in ecology & evolution 22: 323-
330.
• Williams, R., and Bell, E.L. (1940) New Neotropical Hesperiidae and notes on
others (Lepidoptera). Transactions of the American Entomological Society
(1890) 66: 121-140.
• Wolverton, S. Huston, M.A. Kennedy, J.H. Cagle, K. & Cornelius, J.D.
(2009) Conformation to Bergmann's rule in white-tailed deer can be explained by
food availability. The American Midland Naturalist 162: 403-417.
• Yela, J.L., and Holyoak, M. (1997) Effects of moonlight and meteorological factors
on light and bait trap catches of noctuid moths (Lepidoptera:
Noctuidae). Environmental Entomology 26: 1283-1290.


