1
Effect of Fuel Injection Pressure and Injection 1
Timing of Karanja Biodiesel Blends on Fuel 2
Spray, Engine Performance, Emissions and 3
Combustion Characteristics 4
5
Avinash Kumar Agarwala*, Atul Dhara, Jai Gopal Guptaa, 6
Woong Il Kimb, Kibong Choib, Chang Sik Leeb, Sungwook Parkb 7
aEngine Research Laboratorya, Department of Mechanical Engineering, 8
Indian Institute of Technology Kanpur, Kanpur-208016, India 9
bCombustion Engine and Energy Conversion Laboratoryb 10
School of Mechanical Engineering, College of Engineering, Hanyang University 11
Seoul 133-791, Republic of Korea 12
*Corresponding Author’s email: [email protected] 13
14
Abstract 15
In this investigation, effect of 10, 20 and 50% Karanja biodiesel blends on injection rate, 16
atomization, engine performance, emissions and combustion characteristics of common 17
rail direct injection (CRDI) fuel injection system were evaluated in a single cylinder 18
research engine with CRDI at 300, 500, 750 and 1000 bar fuel injection pressures at 19
different start of injection timings and constant engine speed of 1500 rpm. The 20
durationof fuel injection slightly decreased with increasing blend ratio of biodiesel 21
(Karanja Oil Methyl Ester: KOME) and significantly decreases with increasing fuel 22
injection pressure. The injection rate profile and sauter mean diameter (D32) of the fuel 23

2
droplets are influenced by the injection pressure. Increasing fuel injection pressure 24
generally improves the thermal efficiency of the test fuels. Sauter mean diameter (D32) 25
and arithmetic mean diameter (D10) decreased with decreasing Karanja biodiesel 26
content in the blend and significantly increased for higher blends due to relatively 27
higher fuel density and viscosity. Maximum thermal efficiency was observed at the same 28
injection timing for biodiesel blends and mineral diesel. Lower Karanja biodiesel blends 29
(upto 20%) showed lower brake specific hydrocarbon (BSHC) and carbon monoxide 30
(BSCO) emissions in comparison to mineral diesel. For lower Karanja biodiesel blends, 31
combustion duration was shorter than mineral diesel however at higher fuel injection 32
pressures, combustion duration of 50% blend was longer than mineral diesel. Upto 10% 33
Karanja biodiesel blends in a CRDI engines improves brake thermal efficiency and 34
reduces emissions, without any requirement of hardware changes or ECU recalibration. 35
Keywords: Combustion; Karanja biodiesel; Emissions; Fuel injection pressure; 36
Injection timing. 37
38
1. Introduction 39
Diesel engines are extensively used and dominating power sources for road transport 40
sector due to their higher thermal efficiency, operational reliability, robustness, lower 41
hydrocarbon (HC) and carbon monoxide (CO) emissions. In the last two decades, 42
biodiesel has emerged as a well-accepted alternative fuel to mineral diesel because its 43
utilization requires insignificant modifications in the engine hardware. With advanced 44
fuel injection systems, fuel injection pressures have risen by an order of magnitude in 45
comparison to older mechanical fuel injection systems. It is therefore very important to 46
investigate the effect of fuel injection pressure on comparative performance, emissions 47
and combustion characteristic of biodiesel and mineral diesel for effective utilization of 48
biodiesel in modern CI engines. Boudy et al. estimated the influence of fuel properties on 49

3
the pressure–wave in the injector feed pipe and injector mass flow rate by the modeling 50
for a common-rail diesel injection system and reported that amount of injected mass was 51
mainly affected by the density of the fuel [1]. Yehliu et al. observed 12% higher brake 52
specific fuel consumption (BSFC) for B100 (with 15% lower calorific value than diesel) in 53
comparison to mineral diesel in a four-cylinder CRDI engine [2]. Suryawanshi et al. 54
reported slightly higher brake thermal efficiency (BTE) for Pongamia biodiesel blends in 55
comparison to mineral diesel. They also reported that retarding the injection timing by 4 56
crank angle degrees resulted in minor improvement in thermal efficiency at part loads 57
and no change at full load [3]. Grimaldi et al. obtained slightly higher engine efficiency, 58
when the engine was fuelled with biodiesel, particularly at high load in comparison to 59
mineral diesel fuelled engine [4]. Zhu et al. reported that oxygenated fuels including 60
biodiesel, biodiesel-ethanol and biodiesel-methanol blends gave better BTE at all engine 61
operating conditions vis-à-vis mineral diesel [5]. Gumus et al. observed that BTE of 62
mineral diesel decreased as fuel injection pressures increased from 18 to 24 MPa but for 63
biodiesel, it increased with increasing fuel injection pressure at full load [6]. Highest 64
achieved BTE for diesel (at 18 MPa injection pressure) and biodiesel (at 24 MPa 65
injection pressure) were 32.1 and 41.3% respectively [6]. Agarwal et al. reported that 66
higher fuel injection pressure leads to a longer spray tip penetration and larger spray 67
area compared to lower fuel injection pressures after identical elapsed time after the 68
start of injection (SOI) for Karanja biodiesel blends and diesel [7]. 69
Baldassarri et al. reported 10% reduction in CO emissions by fuelling the bus engines by 70
B20 vis-à-vis mineral diesel [8]. Zhu et al. observed lower BSCO emissions for biodiesel 71
fuelled engine in comparison to diesel fuelled engine [5]. Kousoulidou et al. observed 72
that biodiesel does not have any effect on CO emission levels vis-à-vis mineral diesel in 73
an engine equipped with common rail injection system [9]. Suh et al. reported reduction 74
in CO emissions for biodiesel blends as well as mineral diesel with advanced injection 75
4
timing [10]. Wang et al. observed that 35% soybean biodiesel blend resulted in reduced 76
HC emissions in comparison to mineral diesel [11]. Gumus et al. reported that NOx 77
emissions generally decreased with increasing fuel injection pressure but the trend was 78
not regular and significant [6]. 79
Kuti et al. investigated the spray formation and combustion characteristics of Palm 80
biodiesel and mineral diesel by using a CRDI system in a constant volume chamber [12]. 81
They observed longer liquid length for biodiesel in comparison of mineral diesel due to 82
higher boiling range of biodiesel [12]. Ignition delay (ID) was shorter for biodiesel due to 83
its higher cetane number. ID reduced with increasing fuel injection pressure and 84
decreasing nozzle diameter [12]. Suh et al. reported similar combustion pressure and 85
rate of heat release for 5% blend of soybean biodiesel and mineral diesel [10]. Lee et al. 86
investigated the effect of biodiesel blended fuels (Biodiesel derived from unpolished rice 87
and soyabean) on the atomization and combustion characteristics for a common-rail 88
single-cylinder engine. It was reported that higher surface tension and viscosity of the 89
biodiesel causes lower Weber number and decreases injection velocity of biodiesel-90
blended fuels respectively, and result in increased mean droplet size diameter with 91
increasing blend ratio. The spray tip penetration was observed to be longer for higher 92
injection pressure. Higher cetane number of biodiesel causes shorter ignition delay, 93
which was responsible for increased peak combustion pressure with an increase of the 94
biodiesel blend ratio. With increasing biodiesel blend ratio, lower HC and CO were 95
observed, whereas NOx emissions increased, possibly because of fuel oxygen in biodiesel 96
coupled to shorter ignition delay of biodiesel. [13]. Experimental study by Can concluded 97
that despite earlier start of injection, combustion and engine performance 98
characteristics proved that the ignition delay decreased with addition of biodiesel at all 99
engine loads with relatively earlier SOC due to higher cetane number of biodiesel [14]. 100
101
5
Depending upon the local availability, different feedstocks are being promoted 102
worldwide for production of biodiesel. Biodiesel policy of India encourages utilization of 103
non-edible oils for biodiesel production because India has shortage of edible oils [15]. 104
Karanja also known as pongamia pinnata, is a tree borne oil seed, which naturally 105
grows in almost whole of south Asia [16-18]. Karanja is one of the important nitrogen 106
fixing trees (NFTs) which produces seeds containing 30-40% oil (w/w). It is planted as an 107
ornamental and shade tree but now-a-days, it has emerged as an important resource for 108
oil, which can be used for production of biodiesel. The average seed yield of Karanja is 109
about 4-9 tons/ha [19]. Based on review of several experimental studies, Ashraful et al. 110
concluded that Karanja biodiesel is superior because of its cetane number, higher brake 111
thermal efficiency, lower BSFC and lower emission characteristics in comparison to 112
various other non-edible feedstock based biodiesels [20]. Its utilization for large scale 113
biodiesel production will ensure stability of supply because it is well adapted to local 114
climatic conditions. In this study, effect of Karanja biodiesel blends on engine 115
performance, emissions and combustion characteristics have been experimentally 116
investigated at different fuel injection pressure for exploring the prospects of Karanja 117
biodiesel/ blends utilization in modern transport engines equipped with common rail 118
direct injection (CRDI) fuel injection system. In addition to detailed engine 119
investigations, spray studies have also been done. 120
121
2. Experimental Setup 122
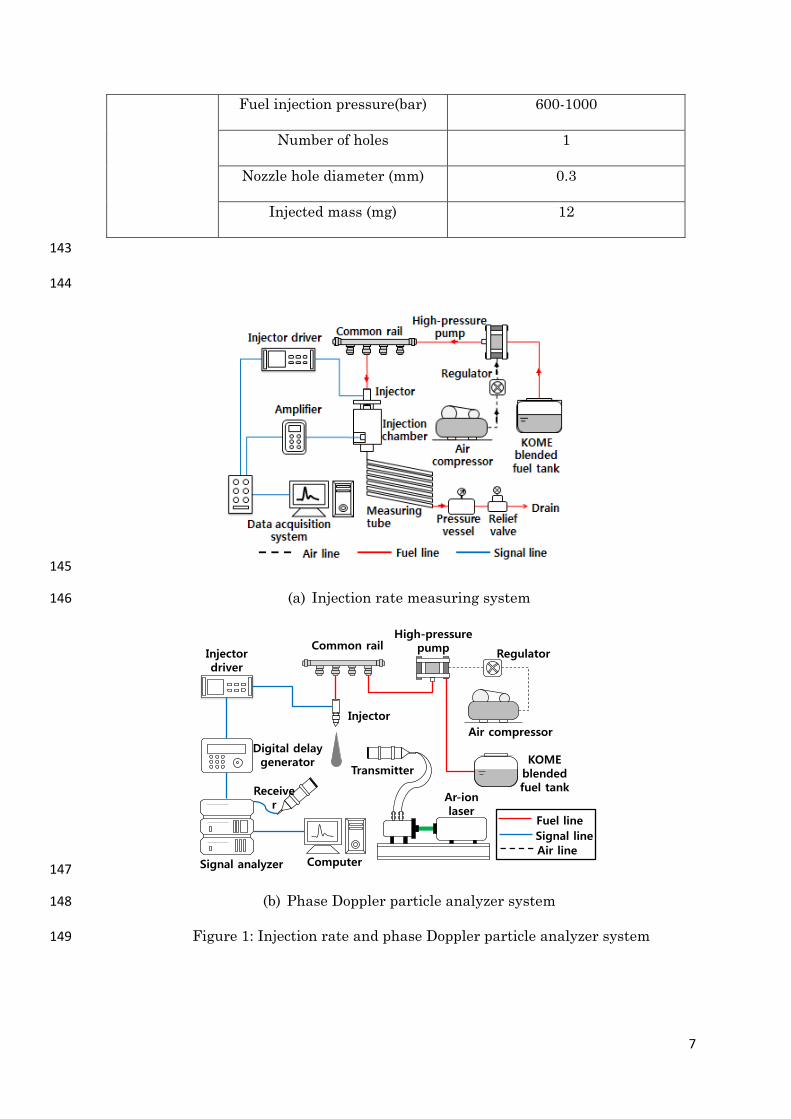
2.1 Injection rate and spray droplet measuring system 123
In order to investigate the injection rate of Karanja oil biodiesel, the injection rate 124
measuring system was used for various injection pressure conditions as illustrated in 125
Figure 1. This system is based on the pressure variation in a measuring tube, filled with 126
biodiesel. When the high- pressure biodiesel is injected into the tube, the fuel creates 127
6
pressure wave detected by a pressure sensor in the tube. During the fuel injection, the 128
pressure in the tube was maintained constant at 20 bar. In the system, the line pressure 129
was continuously measured by using the pressure sensor. In this test, 1000 fuel 130
injections were carried out and the measurements were averaged. 131
Figure 2 shows the phase Doppler droplet analysis system, which comprises of a high-132
pressure fuel injection system, an Ar-Ion laser, a transmitter, a receiver, data 133
acquisition and signal synchronizer system. To investigate the droplet size of Karanja 134
biodiesel under varying injection pressure conditions, droplet measuring system with a 135
514.5 nm and 488 nm wavelengths were applied. As listed in Table 1, photomultiplier 136
voltages and laser output were selected at 500V and 700mW, respectively. For 137
measuring range of droplet size, cut-off range of the droplet sizes for spray measurement 138
was set up from 2 µm to 75 µm. In this investigation, a 0.3 mm single hole nozzle with 139
0.8 mm hole depth was used in order to the prevent the interference of droplet 140
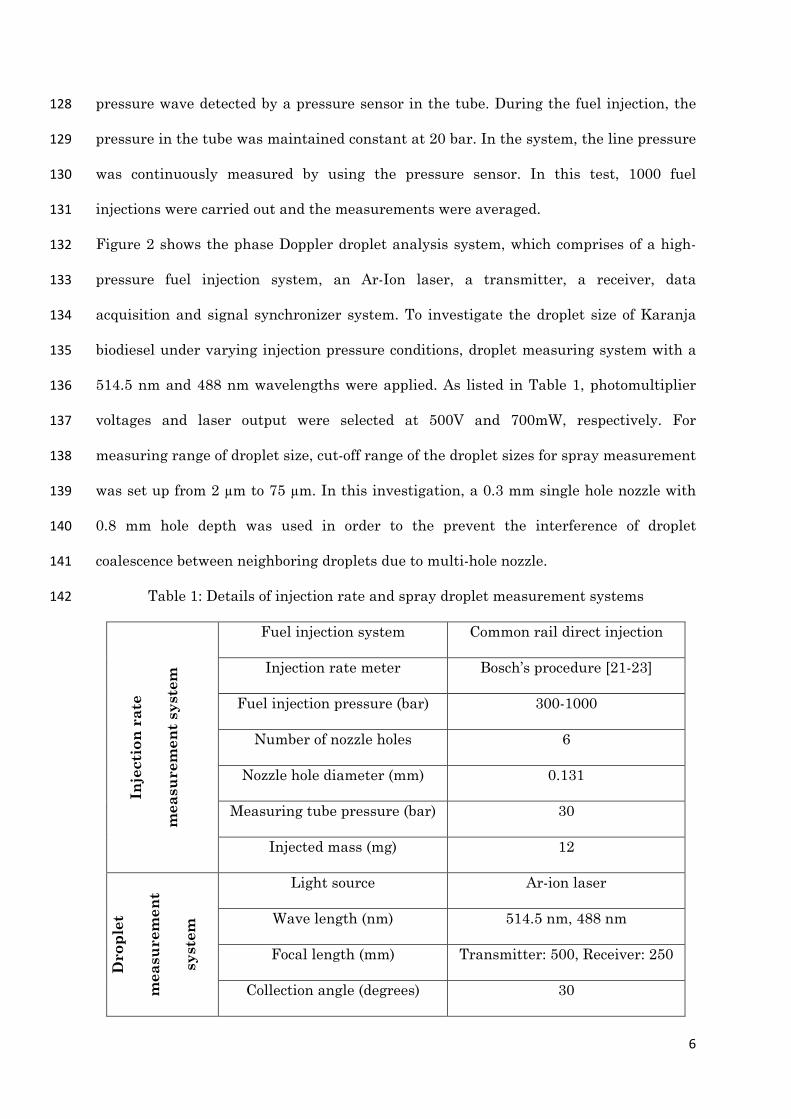
coalescence between neighboring droplets due to multi-hole nozzle. 141
Table 1: Details of injection rate and spray droplet measurement systems 142
Inje
ctio
n ra
te
mea
sure
men
t sys
tem
Fuel injection system Common rail direct injection
Injection rate meter Bosch’s procedure [21-23]
Fuel injection pressure (bar) 300-1000
Number of nozzle holes 6
Nozzle hole diameter (mm) 0.131
Measuring tube pressure (bar) 30
Injected mass (mg) 12
Dro
plet
mea
sure
men
t
syst
em
Light source Ar-ion laser
Wave length (nm) 514.5 nm, 488 nm
Focal length (mm) Transmitter: 500, Receiver: 250
Collection angle (degrees) 30
7
Fuel injection pressure(bar) 600-1000
Number of holes 1
Nozzle hole diameter (mm) 0.3
Injected mass (mg) 12
143
144
145
(a) Injection rate measuring system 146
Signal lineFuel line
KOME blendedfuel tank
Injector
Common railHigh-pressure
pumpInjector driver
Computer
Regulator
Digital delay generator
Transmitter
Receiver
Signal analyzer
Ar-ion laser
Air compressor
Air line
147
(b) Phase Doppler particle analyzer system 148
Figure 1: Injection rate and phase Doppler particle analyzer system 149
8
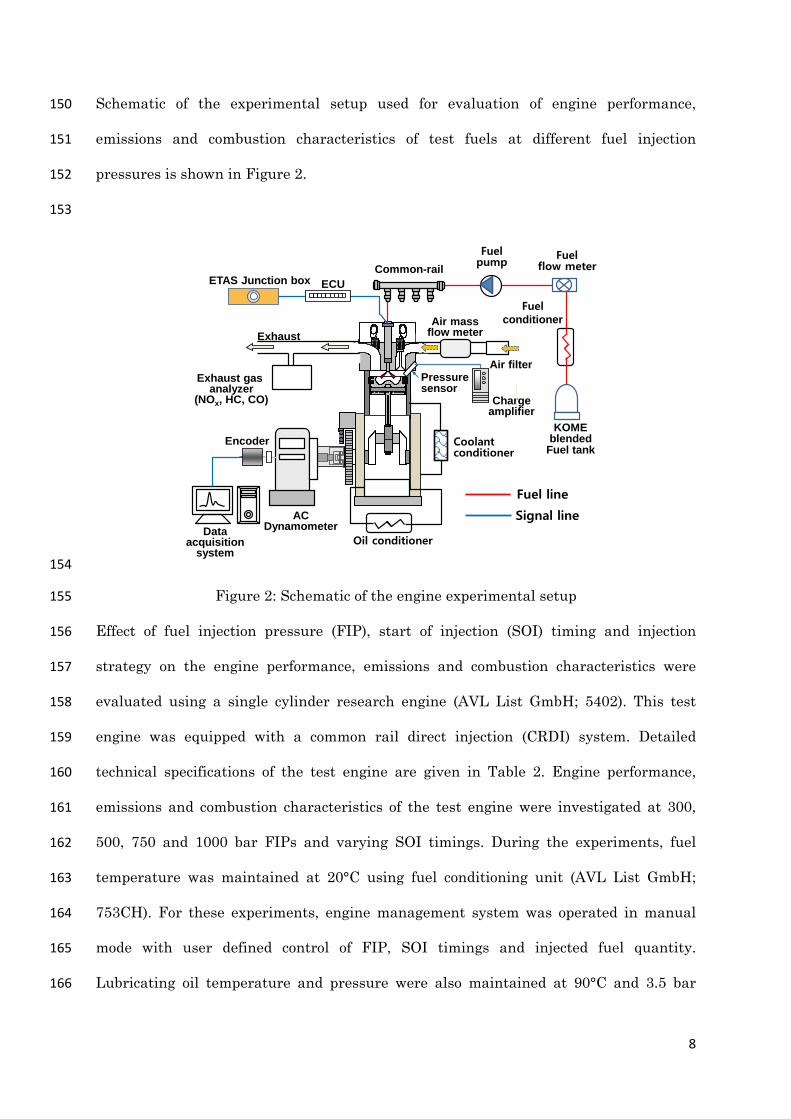
Schematic of the experimental setup used for evaluation of engine performance, 150
emissions and combustion characteristics of test fuels at different fuel injection 151
pressures is shown in Figure 2. 152
153
Encoder
Chargeamplifier
Dataacquisition
system
AC Dynamometer
Common-rail
Exhaust
KOME blended
Fuel tank
Exhaust gas analyzer
(NOx, HC, CO)
ECU
Fuel pump
Fuel flow meter
Fuel conditioner
ETAS Junction box
Air massflow meter
Air filter
Signal line
Fuel line
Coolant conditioner
Oil conditioner
Pressure sensor
154
Figure 2: Schematic of the engine experimental setup 155
Effect of fuel injection pressure (FIP), start of injection (SOI) timing and injection 156
strategy on the engine performance, emissions and combustion characteristics were 157
evaluated using a single cylinder research engine (AVL List GmbH; 5402). This test 158
engine was equipped with a common rail direct injection (CRDI) system. Detailed 159
technical specifications of the test engine are given in Table 2. Engine performance, 160
emissions and combustion characteristics of the test engine were investigated at 300, 161
500, 750 and 1000 bar FIPs and varying SOI timings. During the experiments, fuel 162
temperature was maintained at 20°C using fuel conditioning unit (AVL List GmbH; 163
753CH). For these experiments, engine management system was operated in manual 164
mode with user defined control of FIP, SOI timings and injected fuel quantity. 165
Lubricating oil temperature and pressure were also maintained at 90°C and 3.5 bar 166

9
respectively using an oil condition system (Yantrashilpa; YS4312). Coolant temperature 167
was kept maintained at 80°C by coolant conditioning condition unit (Yantrashilpa; 168
YS4027). 169
Air and fuel consumption rates were measured by rotary gas flow meter system (Elster 170
Instromart; RVG G160) and a fuel flow meter (AVL List GmbH; Fuel Balance 733S.18) 171
respectively. Raw engine emissions were measured by exhaust gas emissions analyser 172
(AVL List GmbH; 444). Exhaust gas sample was passed through a moisture trap and a 173
filter to arrest moisture condensation and particulates from entering the analyzer test 174
cell. HC is measured in 'ppm of hexane equivalent’; NO measured in 'ppm' and CO, CO2, 175
and O2 are measured in 'volume percentage'. Accuracy and measurement ranges of 176
emission analyzer have been given in table 3. For comparison across different power 177
ranges, data of raw emissions from the exhaust gas emission analyzer is converted to 178
mass emissions i.e. brake specific emission using IS: 14273 code [24]. Cylinder pressure 179
was measured by a water cooled piezoelectric pressure transducer (AVL List GmbH; 180
QC34C) mounted flush in the cylinder head. Rotation of the crank shaft was recorded by 181
an optical encoder (AVL List GmbH; 365CC/ 365X). For acquisition and analysis of 182
cylinder pressure-crank angle data, a high speed data acquisition system (AVL List 183
GmbH; Indismart-611) was used. Variation in cylinder pressure with crank angle was 184
recorded for 200 consecutive engine cycles and then averaged for eliminating the effect 185
of cycle-to-cycle variations. This averaged cylinder pressure data was used to calculate 186
heat release rate, mass-burn fraction crank angles, combustion duration and other 187
combustion related parameters. 188
Experiments were performed for mineral diesel, biodiesel and three biodiesel blends 189
(KOME10, KOME20 and KOME50) at constant engine speed (1500 rpm). Important 190
physical properties of test fuels are given in Table 4. Fuel energy injected into each 191
engine cycle was kept constant for all engine operating conditions, which was equivalent 192
10
to air-fuel ratio (AFR) of 23 using mineral diesel. Engine operating point corresponding 193
to 5 bar brake mean effective pressure (BMEP) engine load and 1500 rpm engine speed 194
was chosen for detailed investigations of the effect of FIP and SOI timings on particulate 195
numbers emitted. Upper limit of advanced SOI timings at each FIPs was limited by 196
peak rate of pressure rise limit (15 bar/deg). Lower limit of retarded SOI timings was 197
limited by the lower selected limit of BMEP (4.5 bar). 198
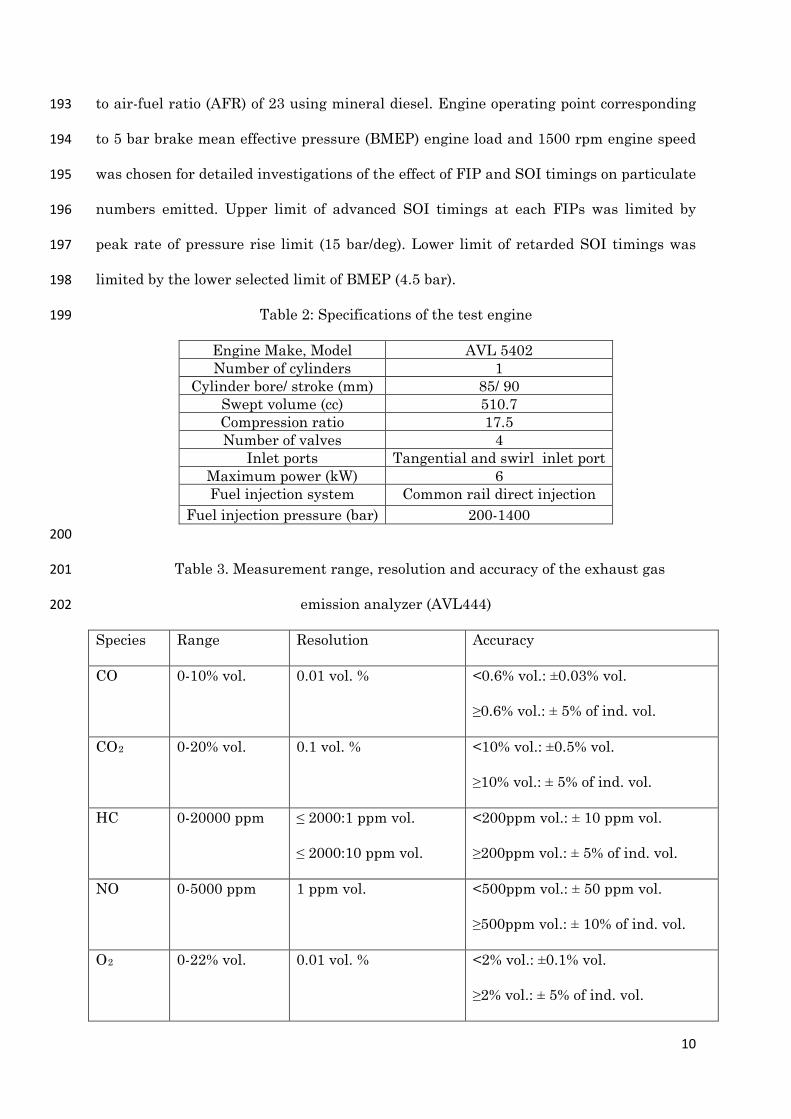
Table 2: Specifications of the test engine 199
Engine Make, Model AVL 5402 Number of cylinders 1
Cylinder bore/ stroke (mm) 85/ 90 Swept volume (cc) 510.7 Compression ratio 17.5 Number of valves 4
Inlet ports Tangential and swirl inlet port Maximum power (kW) 6 Fuel injection system Common rail direct injection
Fuel injection pressure (bar) 200-1400 200
Table 3. Measurement range, resolution and accuracy of the exhaust gas 201
emission analyzer (AVL444) 202
Species Range Resolution Accuracy
CO 0-10% vol. 0.01 vol. % <0.6% vol.: ±0.03% vol.
≥0.6% vol.: ± 5% of ind. vol.
CO2 0-20% vol. 0.1 vol. % <10% vol.: ±0.5% vol.
≥10% vol.: ± 5% of ind. vol.
HC 0-20000 ppm ≤ 2000:1 ppm vol.
≤ 2000:10 ppm vol.
<200ppm vol.: ± 10 ppm vol.
≥200ppm vol.: ± 5% of ind. vol.
NO 0-5000 ppm 1 ppm vol. <500ppm vol.: ± 50 ppm vol.
≥500ppm vol.: ± 10% of ind. vol.
O2 0-22% vol. 0.01 vol. % <2% vol.: ±0.1% vol.
≥2% vol.: ± 5% of ind. vol.

11
203
Important fuel properties of diesel, biodiesel and blends were measured in the 204
laboratory. The instruments used for these measurements and the properties are given 205
in Table 4. 206
Table 4: Important physical properties of test fuels 207
Properties Instruments Used KOME100 KOME50 KOME20 KOME10 Diesel
Viscosity @
40oC (cSt)
Kinematic
Viscometer
(Setavis)
4.42 3.51 3.11 3.04 2.78
Density @ 40oC
(g/cm3)
Portable Density
Meter (KEM
Electronics)
0.881 0.856 0.841 0.836 0.831
Lower Calorific
Value (MJ/kg)
Bomb Calorimeter
(Parr)
37.98 40.8 42.57 43.18 43.79
Cetane Number CRF Engine (CI
Unit)
50.8 -- -- -- 51.2
208
3. Results and Discussion 209
Effect of fuel injection pressure and SOI timing on engine performance, emissions and 210
combustion characteristics of Karanja biodiesel and blends with mineral diesel 211
(KOME50, KOME20 and KOME10) vis-à-vis baseline mineral diesel were investigated 212
at 1500 rpm speed in a single cylinder research engine. For the sake of clarity, the 213
experiments on Spray are discussed first, followed by the results on engine experiments. 214
3.1 Injection rate and spray atomization 215
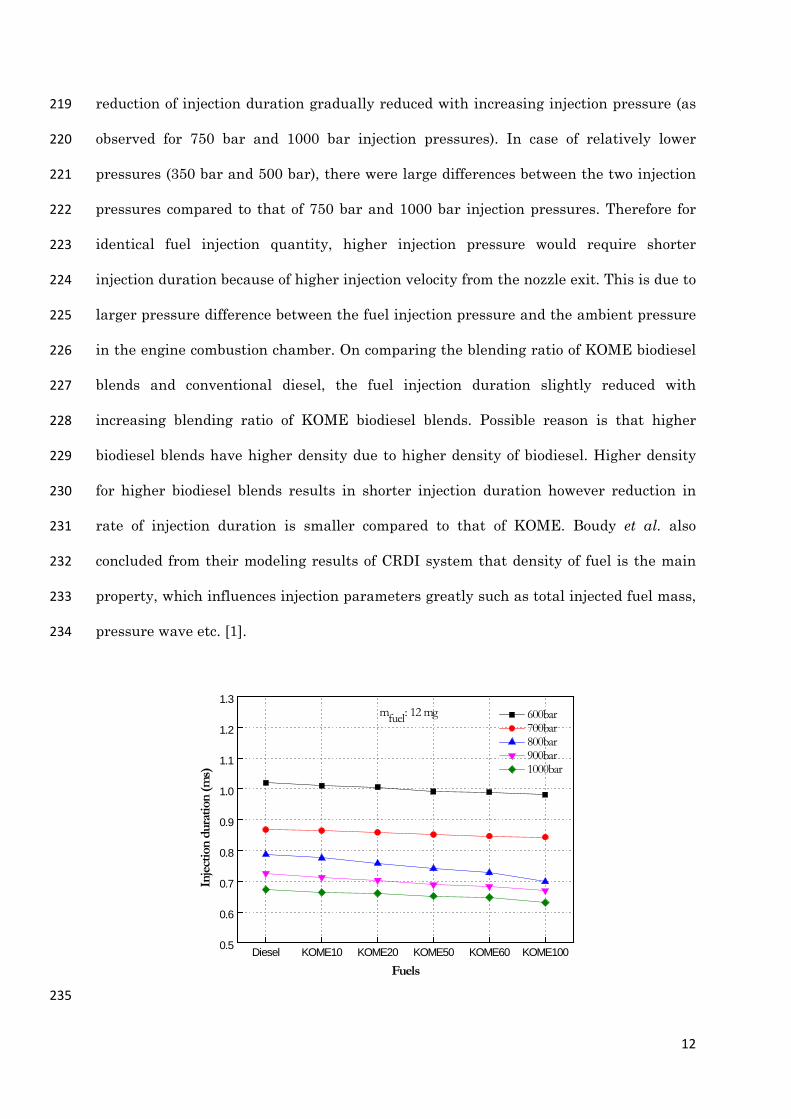
Figure 3 shows the effects of fuel injection pressure on the injection duration for 216
different biodiesel blends. As seen from the figure 3, injection duration of KOME blends 217
and mineral diesel decreases with increasing fuel injection pressure. The rate of 218
12
reduction of injection duration gradually reduced with increasing injection pressure (as 219
observed for 750 bar and 1000 bar injection pressures). In case of relatively lower 220
pressures (350 bar and 500 bar), there were large differences between the two injection 221
pressures compared to that of 750 bar and 1000 bar injection pressures. Therefore for 222
identical fuel injection quantity, higher injection pressure would require shorter 223
injection duration because of higher injection velocity from the nozzle exit. This is due to 224
larger pressure difference between the fuel injection pressure and the ambient pressure 225
in the engine combustion chamber. On comparing the blending ratio of KOME biodiesel 226
blends and conventional diesel, the fuel injection duration slightly reduced with 227
increasing blending ratio of KOME biodiesel blends. Possible reason is that higher 228
biodiesel blends have higher density due to higher density of biodiesel. Higher density 229
for higher biodiesel blends results in shorter injection duration however reduction in 230
rate of injection duration is smaller compared to that of KOME. Boudy et al. also 231
concluded from their modeling results of CRDI system that density of fuel is the main 232
property, which influences injection parameters greatly such as total injected fuel mass, 233
pressure wave etc. [1]. 234
Diesel KOME10 KOME20 KOME50 KOME60 KOME1000.5
0.6
0.7
0.8
0.9
1.0
1.1
1.2
1.3Diesel KOME10 KOME20 KOME50 KOME60 KOME100
Inje
ctio
n du
ratio
n (m
s)
Fuels
600bar 700bar 800bar 900bar 1000bar
mfuel: 12 mg
235

13
Figure 3: Effects of varying fuel injection pressure on the injection duration for different 236
biodiesel blends. 237
0
5
10
15
20
25
30
0 0.3 0.6 0.9 1.2 1.5 1.8 2.1
Inje
ctio
n ra
te (m
g/s)
Time (ms)
FIP: 300 bar DieselKOME10KOME20KOME50
(a)
0
5
10
15
20
25
30
0 0.3 0.6 0.9 1.2 1.5 1.8 2.1
Inje
ctio
n ra
te (m
g/s)
Time (ms)
FIP: 500 bar DieselKOME10KOME20KOME50
(b)
(c) (d)
Figure 4: Effects of fuel injection pressure on the injection rate for different biodiesel 238
blends at (a) 300, (b) 500, (c) 750 and (d) 1000 bar FIPs. 239
Figure 4 illustrates the effects of fuel injection pressure on the injection rate for 240
different KOME biodiesel blends. As shown in Figure 4, fuel injection duration 241
shortened with increasing injection pressure and the peak injection rate increased with 242
increasing fuel injection pressure. 243
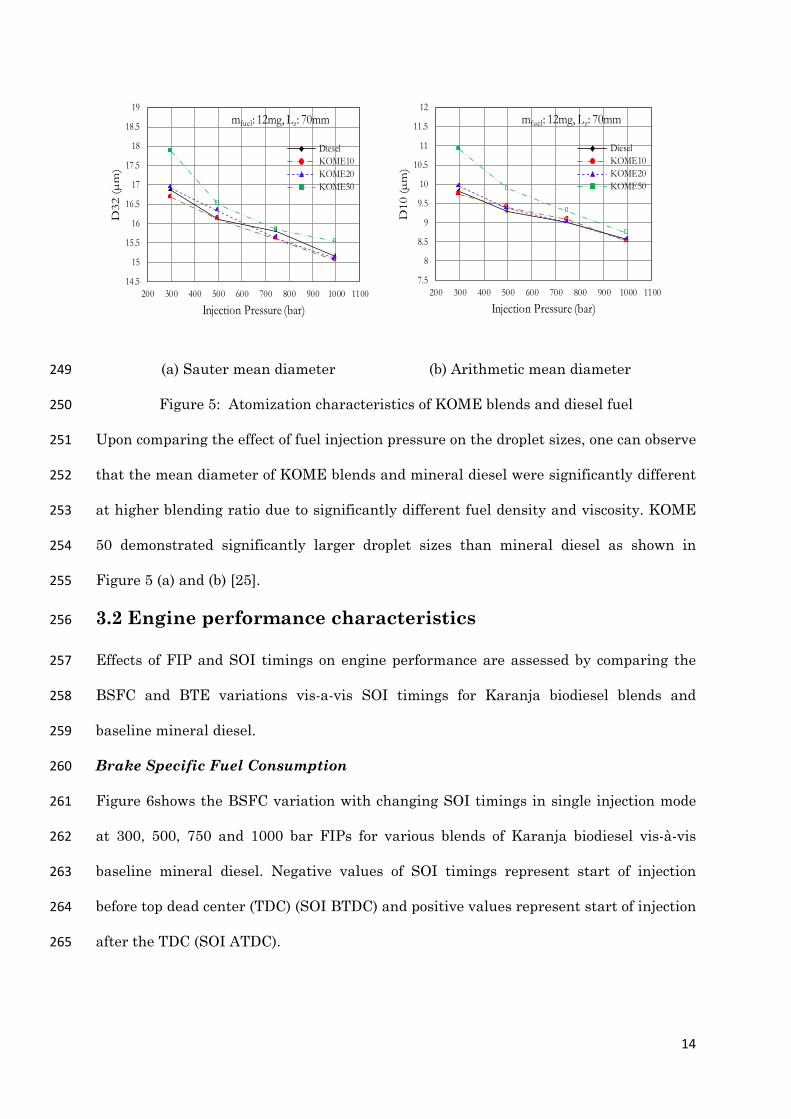
Figure 5 shows the droplet size in the fuel sprays of KOME blends and conventional 244
diesel measured by Phase Doppler Particle Analyzer (PDPA) system. As illustrated in 245
this Figure5, droplet sizes were represented by Sauter mean diameter (SMD or D32) and 246
arithmetic mean diameter (D10) increased with increase in KOME biodiesel 247
concentration in the test blend. 248
0
5
10
15
20
25
30
0 0.3 0.6 0.9 1.2 1.5 1.8 2.1
Inje
ctio
n ra
te (m
g/s)
Time (ms)
FIP: 750 barDieselKOME10KOME20KOME50
0
5
10
15
20
25
30
0 0.3 0.6 0.9 1.2 1.5 1.8 2.1
Inje
ctio
n ra
te (m
g/s)
Time (ms)
FIP: 1000 bar
DieselKOME10KOME20KOME50
14
14.5
15
15.5
16
16.5
17
17.5
18
18.5
19
200 300 400 500 600 700 800 900 1000 1100
D32
(µm
)
Injection Pressure (bar)
mfuel: 12mg, Lz: 70mm
DieselKOME10KOME20KOME50
7.5
8
8.5
9
9.5
10
10.5
11
11.5
12
200 300 400 500 600 700 800 900 1000 1100
D10
(µm
)
Injection Pressure (bar)
mfuel: 12mg, Lz: 70mm
DieselKOME10KOME20KOME50
(a) Sauter mean diameter (b) Arithmetic mean diameter 249
Figure 5: Atomization characteristics of KOME blends and diesel fuel 250
Upon comparing the effect of fuel injection pressure on the droplet sizes, one can observe 251
that the mean diameter of KOME blends and mineral diesel were significantly different 252
at higher blending ratio due to significantly different fuel density and viscosity. KOME 253
50 demonstrated significantly larger droplet sizes than mineral diesel as shown in 254
Figure 5 (a) and (b) [25]. 255
3.2 Engine performance characteristics 256
Effects of FIP and SOI timings on engine performance are assessed by comparing the 257
BSFC and BTE variations vis-a-vis SOI timings for Karanja biodiesel blends and 258
baseline mineral diesel. 259
Brake Specific Fuel Consumption 260
Figure 6shows the BSFC variation with changing SOI timings in single injection mode 261
at 300, 500, 750 and 1000 bar FIPs for various blends of Karanja biodiesel vis-à-vis 262
baseline mineral diesel. Negative values of SOI timings represent start of injection 263
before top dead center (TDC) (SOI BTDC) and positive values represent start of injection 264
after the TDC (SOI ATDC). 265

15
(a) (b)
(c) (d)
Figure 6: Variations in BSFC with varying SOI timings for biodiesel blends vis-à-vis 266
mineral diesel at (a) 300, (b) 500, (c) 750 and (d) 1000 bar FIPs 267
In single injection mode, BSFC for KOME50 and KOME20 were higher than mineral 268
diesel (Figure 6). BSFC of KOME10 was almost similar to mineral diesel due to 269
insignificant difference in physical properties of the test fuels. Reduction of calorific 270
value of test fuel with increasing concentration of Karanja biodiesel was responsible for 271
increase in BSFC for KOME50 and KOME20 blends. These results are in conformity 272
with similar measurement obtained by Yehliu et al. [2], which were primarily due to 273
approximately 13% lower calorific value of biodiesel compared to mineral diesel. At 300 274
and 500 bar FIPs, BSFC was lowest at -18°CA and -15°CA SOI timings respectively for 275
all test fuels. At 750 bar FIP, BSFC was lowest for -4.875°CA SOI timing. At 1000 bar 276
FIP, BSFC was lowest at 1.125 °CA SOI timing for all test fuels. At higher FIPs, 277
advancement of SOI timings were restricted to -4.875 and -0.375°CA at 750 and 1000 278
bar FIPs respectively due to very high rate of pressure rise (ROPR). Figure 6 shows that 279
0.3
0.31
0.32
0.33
0.34
0.35
0.36
-24 -21 -18 -15 -12 -9
BSF
C (k
g/kW
h)
Start of injection (deg)
FIP: 300 bar
Diesel KOME50KOME20 KOME10 0.3
0.31
0.32
0.33
0.34
0.35
0.36
-15 -12 -9 -6 -3
BSF
C (k
g/kW
h)
Start of injection (deg)
FIP: 500 bar
Diesel KOME50KOME20 KOME10
0.3
0.31
0.32
0.33
0.34
0.35
0.36
-4.875 -1.875 1.125 4.125
BSF
C (k
g/kW
h)
Start of injection (deg)
FIP: 750 bar
Diesel KOME50KOME20 KOME10 0.3
0.31
0.32
0.33
0.34
0.35
0.36
-0.375 1.125 2.625 4.125
BSF
C (k
g/kW
h)
Start of injection (deg)
FIP: 1000 bar
Diesel KOME50KOME20 KOME10

16
SOI timing corresponding to minimum BSFC retarded with increasing FIP for all test 280
fuels. Park et al. also reported similar findings that at higher FIPs in single injection 281
mode (600 and 1200 bar); fuel energy was most efficiently converted into useful power, 282
when SOI timing was closer to TDC [26]. Increasing FIP reduces the injection duration, 283
leading to finer spray droplets, which improve the air-fuel mixing, thus increasing the 284
premixed heat release, which results in significant portion of heat being released during 285
the compression stroke, especially for advanced SOI timings. Higher heat release during 286
the compression stroke is counter-productive beyond a certain limit because it works 287
against the piston, which is trying to reach TDC in the compression stroke, hence 288
minimum BSFC is observed for retarded SOI timings with increasing FIPs. 289
Brake Thermal Efficiency 290
Figure 7 shows the variation of BTE of Karanja biodiesel blends with SOI timings at 291
different FIPs vis-à-vis baseline mineral diesel. 292
(a) (b)
(c) (d)
23
24
25
26
27
28
-24 -21 -18 -15 -12 -9
BTE
(%)
Start of injection (deg)
FIP: 300 bar
Diesel KOME50KOME20 KOME10
23
24
25
26
27
28
-15 -12 -9 -6 -3
BTE
(%)
Start of injection (deg)
FIP: 500 bar
Diesel KOME50KOME20 KOME10
23
24
25
26
27
28
-4.875 -1.875 1.125
BTE
(%)
Start of injection (deg)
FIP: 750 bar
Diesel KOME50KOME20 KOME10
23
24
25
26
27
28
-0.375 1.125 2.625 4.125
BTE
(%)
Start of injection (deg)
FIP: 1000 bar
Diesel KOME50KOME20 KOME10

17
Figure 7: Variation in BTE with varying SOI timings for biodiesel blends vis-à-vis 293
mineral diesel at (a) 300, (b) 500, (c) 750 and (d) 1000 bar FIPs 294
Figure 7 shows that the thermal efficiency of Karanja biodiesel blends is higher than 295
mineral diesel at all engine operating conditions. These results are consistent with 296
previous research results [3-6], Suryawanshi et al. also observed increase in BTE for 297
Pongamia biodiesel compared to mineral diesel [3]. Thermal efficiency of lower biodiesel 298
blends (KOME10 and KOME20) was higher than KOME50. BTE was highest at -15°CA 299
SOI timing for all test fuels for 300 and 500 bar FIPs. At a fixed SOI timing, it was 300
observed that increasing FIP generally improves the thermal efficiency of test fuels. 301
Increasing FIP was more effective in increasing BTE of mineral diesel in comparison to 302
Karanja biodiesel blends, which suggests that higher injection pressure is more effective 303
in improving the spray characteristics of fuels with lower viscosity, which is mineral 304
diesel in this case. However, Gumus et al. reported decrease in BTE of mineral diesel 305
with increase in fuel injection pressures from 180 to 240 bar while for biodiesel, found 306
increased with increasing fuel injection pressure at full load [6]. It was also observed 307
that for all test fuels, SOI timing corresponding to maximum BTE shifts towards TDC 308
with increasing FIP. Suryawanshi et al. also reported that retarding injection timing by 309
4° crank angle resulted in minor improvement in thermal efficiency at part loads [3]. 310
3.3 Emissions characteristics 311
Effect of FIP and SOI timings on carbon monoxide (CO), hydrocarbons (HC) and oxides 312
of nitrogen (NOx) emissions were investigated by maintaining input fuel energy per 313
cycle constant for all test fuels. Brake specific emissions of regulated gases for Karanja 314
biodiesel blends are compared with mineral diesel for varying fuel injection parameters. 315
Carbon Monoxide Emissions 316

18
(a) (b)
(c) (d)
Figure 8:Variations in BSCO emissions with varying SOI timings for biodiesel blends 317
vis-à-vis mineral diesel at (a) 300, (b) 500, (c) 750 and (d) 1000 bar FIP 318
Figure 8 shows the variations in brake specific carbon monoxide (BSCO) emissions from 319
Karanja biodiesel blends with varying SOI timings at different FIPs vis-à-vis baseline 320
mineral diesel. At 300 bar FIP, BSCO emissions were lowest at -18°CA SOI timing for 321
all test fuels and they increased when injection timing was further retarded (Figure 322
8(a)). Advanced SOI timings beyond -18°CA resulted in greater formation of fuel rich 323
zones due to increased ignition delay and relatively inferior atomization of fuel injected 324
during early phase of fuel injection, when in-cylinder pressure and temperature were 325
comparatively lower. These fuel rich zones may be the reason for increased CO 326
emissions. At 500 bar FIP, BSCO emissions were lowest at -15°CA SOI timing which 327
increased with retarded SOI timings (Figure 8(b)). Retarding the injection resulted in 328
increase of BSCO as it pushed the majority of combustion into the expansion stroke, 329
which reduced the temperature and pressure during the later part of the combustion in 330
4
8
12
16
20
-24 -21 -18 -15 -12 -9
BSC
O (g
/kW
h)
Start of injection (deg)
FIP: 300 barDieselKOME50KOME20KOME10
4
8
12
16
20
-15 -12 -9 -6 -3
BSC
O (g
/kW
h)
Start of injection (deg)
FIP: 500 barDiesel
KOME50
KOME20
KOME10
4
8
12
16
20
-4.875 -1.875 1.125
BSC
O (g
/kW
h)
Start of injection (deg)
FIP: 750 bar
Diesel KOME50KOME20 KOME10
4
8
12
16
20
-0.375 1.125 2.625 4.125
BSC
O (g
/kW
h)
Start of injection (deg)
FIP: 1000 barDieselKOME50KOME20KOME10

19
the expansion stroke, thus increasing CO formation. Suh et al. also observed rapid 331
increase in CO emission for retarded injection timing due to a longer heat release [10]. 332
At 750 and 1000 bar FIPs, CO emissions were high when SOI timings were close to TDC 333
and it decreased with retarding SOI timings. This is probably due to wall impingement 334
of high pressure fuel spray droplets. Park et al. also reported that injection under high 335
pressure close to TDC results in wall impingement of fuel droplets and/ or accumulation 336
of some fuel in the squish area of the piston [26], which causes relatively inferior mixing 337
of fuel with air, resulting in increased CO and HC emissions. At all FIPs, BSCO 338
emissions of KOME20 and KOME10 were lower than mineral diesel. Similar trends for 339
lower BSCO for biodiesel were also reported by Zhu et al. [5]. However, another 340
scientific study by Baldassarri et al. reported 10% reduction in CO emissions for B20 341
vis-à-vis mineral diesel [8]. BSCO emissions of KOME50 were higher relative to lower 342
biodiesel blends and at higher injection pressures and they were even higher than 343
mineral diesel. It indicates that higher concentration of Karanja biodiesel in test fuel 344
causes issues related to fuel atomization and mixing, which can possibly offset 345
improvement in the combustion due to oxygenated fuels. At a fixed SOI timing, 346
increasing FIP results in reduction in BSCO emissions due to improvement in fuel-air 347
mixing because of finer fuel spray droplets formation at higher FIP. 348
Unburnt Hydrocarbon Emissions 349
Figure 9shows the variation in brake specific hydrocarbon (BSHC) emissions of Karanja 350
biodiesel blends vis-à-vis SOI timings at different FIPs in comparison to baseline 351
mineral diesel. 352
BSHC emissions increased with retarded SOI timings for 300 and 500 bar FIPs for all 353
test fuels. Retarding SOI timings lowers the in-cylinder pressure and temperature 354
during combustion, which in-turn increases engine-out HC emissions. At 750 and 1000 355
bar FIPs, BSHC emissions increased sharply, when the SOI timings were close to TDC. 356
20
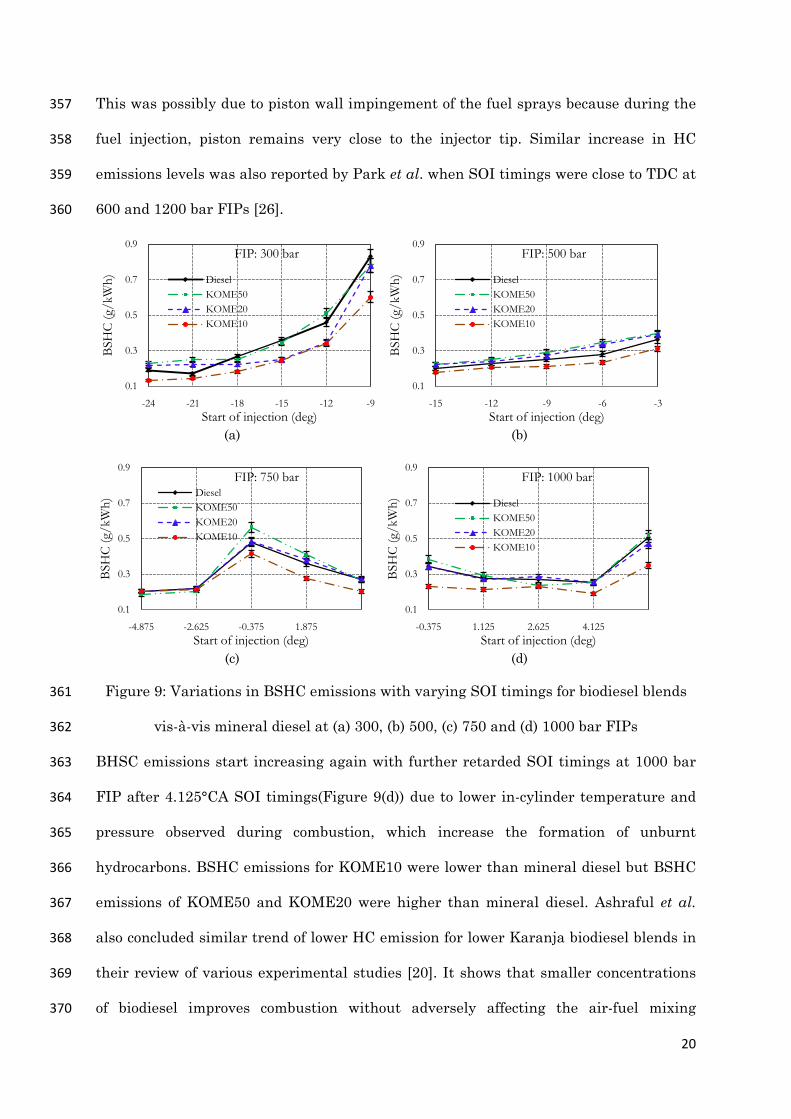
This was possibly due to piston wall impingement of the fuel sprays because during the 357
fuel injection, piston remains very close to the injector tip. Similar increase in HC 358
emissions levels was also reported by Park et al. when SOI timings were close to TDC at 359
600 and 1200 bar FIPs [26]. 360
(a) (b)
(c) (d)
Figure 9: Variations in BSHC emissions with varying SOI timings for biodiesel blends 361
vis-à-vis mineral diesel at (a) 300, (b) 500, (c) 750 and (d) 1000 bar FIPs 362
BHSC emissions start increasing again with further retarded SOI timings at 1000 bar 363
FIP after 4.125°CA SOI timings(Figure 9(d)) due to lower in-cylinder temperature and 364
pressure observed during combustion, which increase the formation of unburnt 365
hydrocarbons. BSHC emissions for KOME10 were lower than mineral diesel but BSHC 366
emissions of KOME50 and KOME20 were higher than mineral diesel. Ashraful et al. 367
also concluded similar trend of lower HC emission for lower Karanja biodiesel blends in 368
their review of various experimental studies [20]. It shows that smaller concentrations 369
of biodiesel improves combustion without adversely affecting the air-fuel mixing 370
0.1
0.3
0.5
0.7
0.9
-24 -21 -18 -15 -12 -9
BSH
C (g
/kW
h)
Start of injection (deg)
FIP: 300 bar
DieselKOME50KOME20KOME10
0.1
0.3
0.5
0.7
0.9
-15 -12 -9 -6 -3BS
HC
(g/k
Wh)
Start of injection (deg)
FIP: 500 bar
DieselKOME50KOME20KOME10
0.1
0.3
0.5
0.7
0.9
-4.875 -2.625 -0.375 1.875
BSH
C (g
/kW
h)
Start of injection (deg)
FIP: 750 barDieselKOME50KOME20KOME10
0.1
0.3
0.5
0.7
0.9
-0.375 1.125 2.625 4.125
BSH
C (g
/kW
h)
Start of injection (deg)
FIP: 1000 bar
DieselKOME50KOME20KOME10
21
significantly however higher concentrations of biodiesel adversely affects the 371
atomization of the fuel sprays and subsequent air-fuel mixing. 372
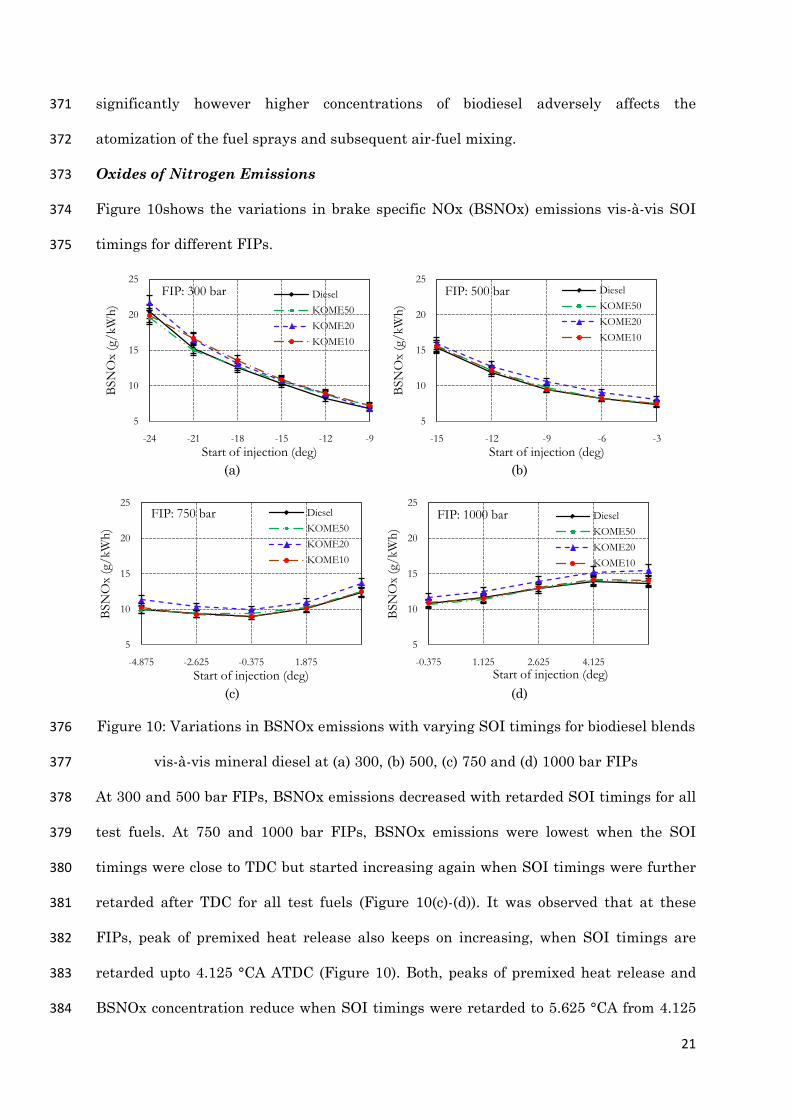
Oxides of Nitrogen Emissions 373
Figure 10shows the variations in brake specific NOx (BSNOx) emissions vis-à-vis SOI 374
timings for different FIPs. 375
(a) (b)
(c) (d)
Figure 10: Variations in BSNOx emissions with varying SOI timings for biodiesel blends 376
vis-à-vis mineral diesel at (a) 300, (b) 500, (c) 750 and (d) 1000 bar FIPs 377
At 300 and 500 bar FIPs, BSNOx emissions decreased with retarded SOI timings for all 378
test fuels. At 750 and 1000 bar FIPs, BSNOx emissions were lowest when the SOI 379
timings were close to TDC but started increasing again when SOI timings were further 380
retarded after TDC for all test fuels (Figure 10(c)-(d)). It was observed that at these 381
FIPs, peak of premixed heat release also keeps on increasing, when SOI timings are 382
retarded upto 4.125 °CA ATDC (Figure 10). Both, peaks of premixed heat release and 383
BSNOx concentration reduce when SOI timings were retarded to 5.625 °CA from 4.125 384
5
10
15
20
25
-24 -21 -18 -15 -12 -9
BSN
Ox
(g/k
Wh)
Start of injection (deg)
FIP: 300 bar DieselKOME50KOME20KOME10
5
10
15
20
25
-15 -12 -9 -6 -3
BSN
Ox
(g/k
Wh)
Start of injection (deg)
FIP: 500 bar DieselKOME50KOME20KOME10
5
10
15
20
25
-4.875 -2.625 -0.375 1.875
BSN
Ox
(g/k
Wh)
Start of injection (deg)
FIP: 750 bar DieselKOME50KOME20KOME10
5
10
15
20
25
-0.375 1.125 2.625 4.125
BSN
Ox
(g/k
Wh)
Start of injection (deg)
FIP: 1000 bar DieselKOME50KOME20KOME10

22
°CA. BSNOx emissions of KOME20 and KOME10 were higher than mineral diesel for 385
all FIPs. NOx emissions of KOME50 were lower than KOME20 and KOME10 and 386
almost equal to mineral diesel. At BMEP comparable to present study and 450 bar FIP 387
(-3.89 °CA SOI timing), Yehliu et al. reported almost comparable BSNOx emissions [2]. 388
These values and trends are consistent with trend of BSNOx emissions at 500 bar FIP 389
in this study. At the same SOI, increasing fuel injection pressure increases NOx 390
emissions significantly. Similar trend of NOx emissions were also reported by Ye et al. 391
[30]. However, Ye et al. also concluded that at the same SOI and fuel injection pressure, 392
biodiesel fueling also increases NOx emissions significantly. Many studies have reported 393
that effect of biodiesel on NOx emissions depends on the type of engine used as well as 394
engine operating conditions [2, 27-29]. These trends are observed due to the combined 395
effect of fuel spray characteristics deterioration because of higher fuel viscosity and 396
higher fuel density and differences in the ignition quality due to the differences in the 397
chemical structure of mineral diesel and biodiesel. 398
399
3.4 Combustion characteristics 400
Effects of FIP and SOI timings on the combustion characteristics of KOME50, KOME20 401
and KOME10 vis-à-vis mineral diesel were analyzed by measuring in-cylinder pressure 402
w.r.t. crank angle position in a single cylinder research engine equipped with CRDI fuel 403
injection system. Measured pressure data of 200 consecutive engine cycles were 404
averaged in order to eliminate the effect of cyclic variations of combustion parameters 405
and the experimental data was analyzed to calculate heat release rate (HRR), mass 406
burn fractions (MBF) as well as the combustion duration. 407
In-Cylinder Pressure and Heat Release Rate 408
409

23
410
411
Figure 11: Variation of in-cylinder pressure and HRR with FIP and SOI at 300 and 500 412
bar FIPs 413
Figure 11 shows the variation of cylinder pressure and HRR at -15 and -12°CA SOI 414
timings at 300 and 500 bar FIPs for Karanja biodiesel blends vis-à-vis mineral diesel. 415
Negative heat release was observed for all test fuels due to cylinder charge cooling 416
because of vaporization of the fuel accumulated during the ignition delay period. HRR 417
becomes positive after the start of combustion (SOC). After the ignition delay, premixed 418
air-fuel mixture burns rapidly, followed by diffusion combustion, when the HRR is 419
controlled by rate of air-fuel mixing. Figure 12 shows the variation in in-cylinder 420
pressure and HRR with SOI timings for higher injection pressures (750 and 1000 bar 421
FIP) for Karanja biodiesel blends vis-a-vis mineral diesel. For all the test fuels, shift in 422
in-cylinder pressure and HRR curves is consistent with shift in SOI timings. 423

24
424
Figure 12: Variation of in-cylinder pressure and HRR with FIP and SOI at 750 and 1000 425
bar FIPs 426
Start of heat release was slightly advanced for KOME10 in comparison to other test 427
fuels at 300 and 500 bar FIPs and this advancement was higher at advanced SOI 428
timings (-15° CA SOI timing). Maximum premixed heat release for KOME20 was 429
comparable to mineral diesel and maximum premixed heat release of KOME50 was 430
slightly lower than mineral diesel. Reduction in heat release in premixed phase for 431
biodiesel is also reported by other researchers [30-32]. This is mostly attributed to 432
biodiesel’s lower volatility in addition to the shorter ignition delay [30,32,33]. At higher 433
FIP and advanced SOI timings (Figure 12), start of combustion advances for KOME50 434
in comparison to other fuels however at retarded injection timing (figure 12(d)), start of 435
heat release for KOME50 was comparable to lower Karanja biodiesel blends and 436
mineral diesel. Ye et al. also reported slightly advanced SOC for B40 in comparison to 437
mineral diesel for SOI timings in the range of -9 to +3° crank angle for varying injection 438
pressures [30]. Effect of lower volatility of biodiesel and almost comparable cetane 439
25
number of Karanja biodiesel and mineral diesel may not be significant to alter the HRR 440
profile of lower biodiesel blends in an engine equipped with CRDI fuel injection system. 441
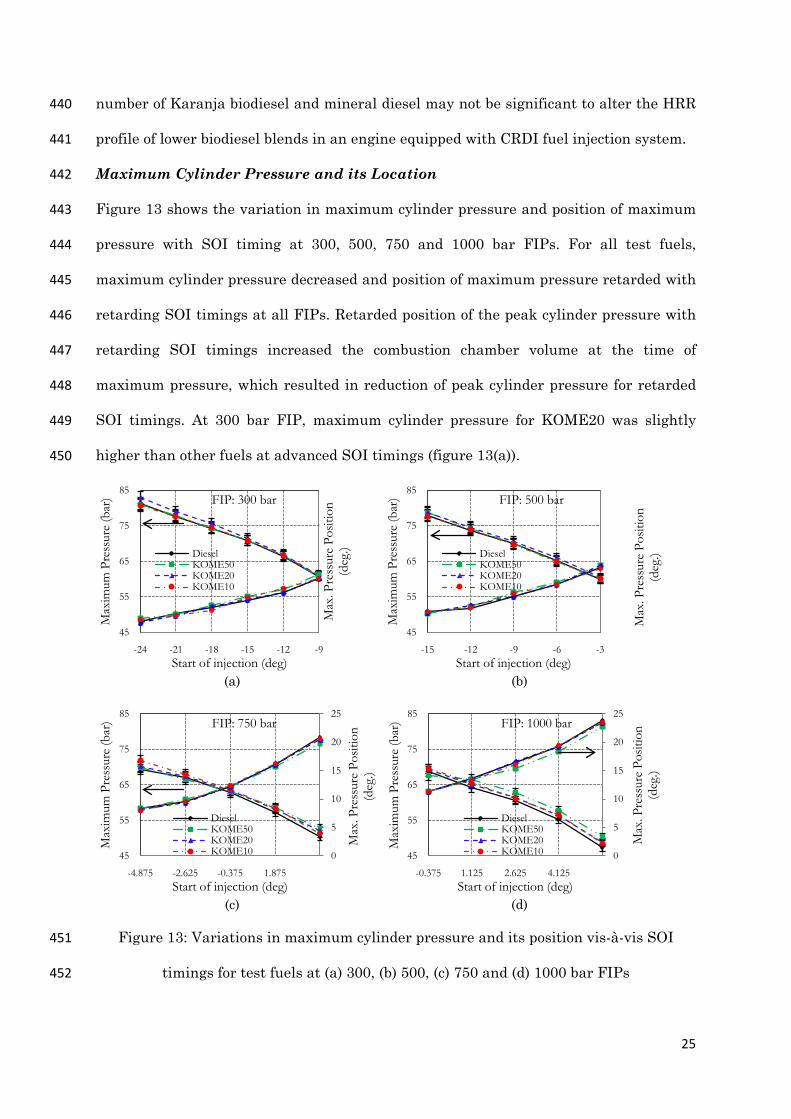
Maximum Cylinder Pressure and its Location 442
Figure 13 shows the variation in maximum cylinder pressure and position of maximum 443
pressure with SOI timing at 300, 500, 750 and 1000 bar FIPs. For all test fuels, 444
maximum cylinder pressure decreased and position of maximum pressure retarded with 445
retarding SOI timings at all FIPs. Retarded position of the peak cylinder pressure with 446
retarding SOI timings increased the combustion chamber volume at the time of 447
maximum pressure, which resulted in reduction of peak cylinder pressure for retarded 448
SOI timings. At 300 bar FIP, maximum cylinder pressure for KOME20 was slightly 449
higher than other fuels at advanced SOI timings (figure 13(a)). 450
(a) (b)
(c) (d)
Figure 13: Variations in maximum cylinder pressure and its position vis-à-vis SOI 451
timings for test fuels at (a) 300, (b) 500, (c) 750 and (d) 1000 bar FIPs 452
45
55
65
75
85
-24 -21 -18 -15 -12 -9
Max
. Pre
ssur
e Po
sitio
n (d
eg.)
Max
imum
Pre
ssur
e (b
ar)
Start of injection (deg)
FIP: 300 bar
DieselKOME50KOME20KOME10
45
55
65
75
85
-15 -12 -9 -6 -3M
ax. P
ress
ure
Posit
ion
(deg
.)
Max
imum
Pre
ssur
e (b
ar)
Start of injection (deg)
FIP: 500 bar
DieselKOME50KOME20KOME10
0
5
10
15
20
25
45
55
65
75
85
-4.875 -2.625 -0.375 1.875
Max
. Pre
ssur
e Po
sitio
n (d
eg.)
Max
imum
Pre
ssur
e (b
ar)
Start of injection (deg)
FIP: 750 bar
DieselKOME50KOME20KOME10 0
5
10
15
20
25
45
55
65
75
85
-0.375 1.125 2.625 4.125
Max
. Pre
ssur
e Po
sitio
n (d
eg.)
Max
imum
Pre
ssur
e (b
ar)
Start of injection (deg)
FIP: 1000 bar
DieselKOME50KOME20KOME10

26
It can be explained by improvement in combustion due to oxygen content of biodiesel. 453
With higher concentration of biodiesel in the test fuel, this improvement in combustion 454
is offset by inferior spray atomization and poorer mixing characteristics caused by high 455
fuel viscosity and inferior volatility of biodiesel. At retarded SOI timings, maximum in-456
cylinder pressures of all test fuels were almost same (figures 11). At retarded injection 457
timings, cylinder temperature and pressure were comparatively higher during fuel 458
injection, which improves spray characteristics and reduces the ignition delay for all test 459
fuels, thus reducing the difference in the combustion characteristics of different test 460
fuels. At 750 and 1000 bar FIPs, maximum cylinder pressure of biodiesel increases with 461
increasing biodiesel concentration in the blend at retarded injection timings. At 462
advanced injection timings, maximum cylinder pressure of higher biodiesel blends was 463
comparatively lower (figures 12 (c)-(d)). It shows that higher cylinder pressures and 464
temperatures during the injection improve the spray characteristics of higher viscosity 465
and low volatility fuels. Maximum cylinder pressure increased with increasing FIP at 466
fixed SOI timings for all test fuels due to increased HRR because of improved fuel-air 467
mixing. Suh et al. also observed increased combustion pressure and heat release rate for 468
rapeseed biodiesel blends, when injection pressure were increased to 1000 bar. They 469
concluded that higher fuel injection pressure cause better fuel injection and atomization 470
of higher viscosity biodiesel [10]. 471
Start and End of Combustion 472
SOC is characterized by position of 10% MBF in terms of crank angle degree. End of 473
combustion (EOC) is characterized by position of 90% MBF. Figure 14 shows the 474
variations in start and end of combustion with varying SOI timings at 300, 500, 750 and 475
1000 bar FIPs. 476
27
(a) (b)
(c) (d)
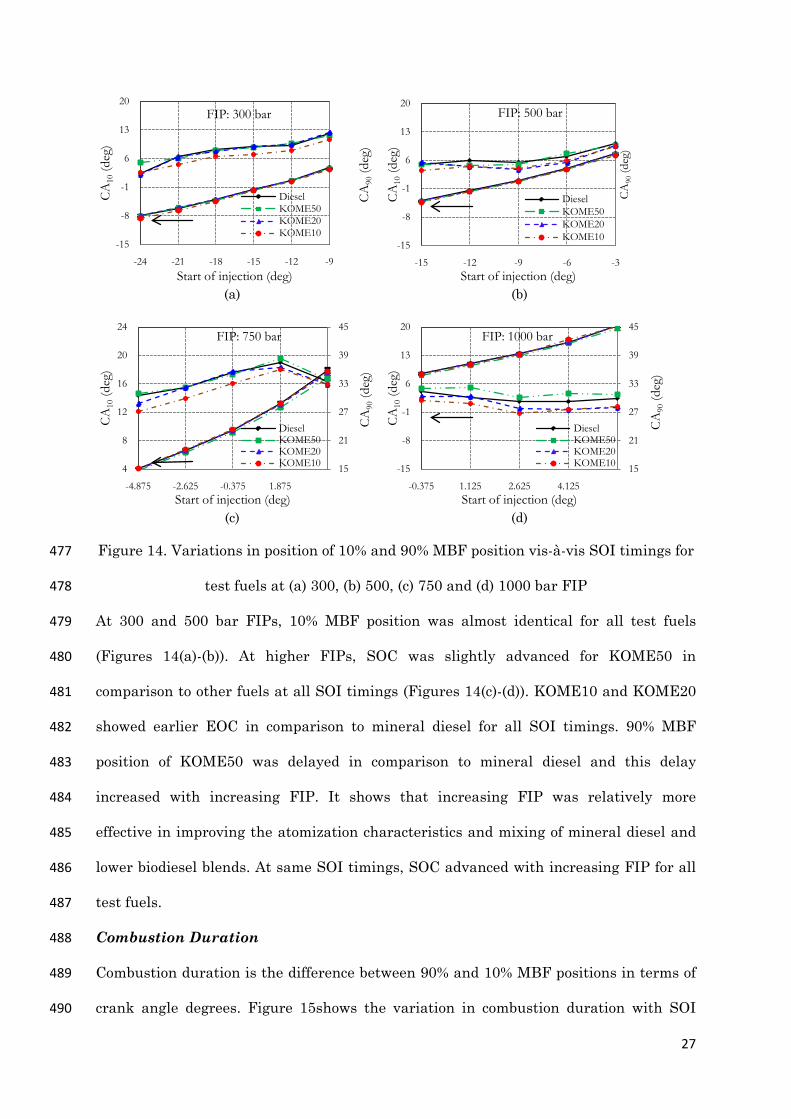
Figure 14. Variations in position of 10% and 90% MBF position vis-à-vis SOI timings for 477
test fuels at (a) 300, (b) 500, (c) 750 and (d) 1000 bar FIP 478
At 300 and 500 bar FIPs, 10% MBF position was almost identical for all test fuels 479
(Figures 14(a)-(b)). At higher FIPs, SOC was slightly advanced for KOME50 in 480
comparison to other fuels at all SOI timings (Figures 14(c)-(d)). KOME10 and KOME20 481
showed earlier EOC in comparison to mineral diesel for all SOI timings. 90% MBF 482
position of KOME50 was delayed in comparison to mineral diesel and this delay 483
increased with increasing FIP. It shows that increasing FIP was relatively more 484
effective in improving the atomization characteristics and mixing of mineral diesel and 485
lower biodiesel blends. At same SOI timings, SOC advanced with increasing FIP for all 486
test fuels. 487
Combustion Duration 488
Combustion duration is the difference between 90% and 10% MBF positions in terms of 489
crank angle degrees. Figure 15shows the variation in combustion duration with SOI 490
-15
-8
-1
6
13
20
-24 -21 -18 -15 -12 -9
CA
90(d
eg)
CA
10(d
eg)
Start of injection (deg)
FIP: 300 bar
DieselKOME50KOME20KOME10
-15
-8
-1
6
13
20
-15 -12 -9 -6 -3
CA
90(d
eg)
CA
10(d
eg)
Start of injection (deg)
FIP: 500 bar
DieselKOME50KOME20KOME10
15
21
27
33
39
45
4
8
12
16
20
24
-4.875 -2.625 -0.375 1.875
CA
90(d
eg)
CA
10(d
eg)
Start of injection (deg)
FIP: 750 bar
DieselKOME50KOME20KOME10 15
21
27
33
39
45
-15
-8
-1
6
13
20
-0.375 1.125 2.625 4.125
CA
90(d
eg)
CA
10(d
eg)
Start of injection (deg)
FIP: 1000 bar
DieselKOME50KOME20KOME10

28
timings at 300, 500, 750 and 1000 bar FIPs. It can be observed that combustion duration 491
decreased with retarding SOI timings for all test fuels at all FIPs. Retarded SOI timings 492
delayed both start and end of combustion (Figure 14) but delay in SOC timing was 493
longer in comparison to EOC timing. This longer delay in SOC timing resulted in 494
shortening of combustion duration with retarded SOI timings. Combustion duration of 495
KOME10 and KOME20 was shorter than mineral diesel. Combustion duration of 496
KOME50 was comparable to mineral diesel at 300, 500 and 750 bar FIPs. At 1000 FIP, 497
combustion duration of KOME50 was higher than mineral diesel. 498
(a) (b)
(c)
(d)
Figure 15. Variations in combustion duration vis-à-vis SOI timings for test fuels at (a) 499
300, (b) 500, (c) 750 and (d) 1000 bar FIPs 500
Combustion duration decreased with increasing FIP for all test fuels. Lower biodiesel 501
blends showed faster HRR in comparison to mineral diesel due to fuel oxygen, which 502
7
13
19
25
31
37
43
-24 -21 -18 -15 -12 -9
Com
bust
ion
dura
tion
(deg
)
Start of injection (deg)
FIP: 300 bar
Diesel KOME50KOME20 KOME10
7
13
19
25
31
37
43
-15 -12 -9 -6 -3
Com
bust
ion
dura
tion
(deg
)
Start of injection (deg)
FIP: 500 bar
Diesel KOME50KOME20 KOME10
7
13
19
25
31
37
43
-4.875 -2.625 -0.375 1.875
Com
bust
ion
dura
tion
(deg
)
Start of injection (deg)
FIP: 750 bar
Diesel KOME50KOME20 KOME10 7
13
19
25
31
37
43
-0.375 1.125 2.625 4.125
Com
bust
ion
dura
tion
(deg
)
Start of injection (deg)
FIP: 1000 bar
Diesel KOME50KOME20 KOME10

29
also resulted in shorter combustion duration. Higher concentration of biodiesel in test 503
fuels resulted in inferior atomization and fuel-air mixing characteristics due to higher 504
fuel viscosity and inferior volatility characteristics of biodiesel vis-a-vis mineral diesel, 505
which in-turn increased combustion duration of biodiesel blends in the CRDI engine. 506
Similar results of increased combustion duration with increasing biodiesel blend ratio 507
were also observed by CAN. They attributed this behaviour to higher fuel injection 508
duration and slower combustion rate [14]. 509
4. Conclusions 510
Effects of fuel injection pressure and start of injection timings on CRDI engine 511
performance, emissions and combustion characteristics of Karanja biodiesel (KOME) 512
blends and baseline mineral diesel were investigated at a constant engine speed of 1500 513
rpm, in addition to comprehensive spray investigations were carried out. The fuel 514
injection duration decreased slightly with increasing biodiesel content in the biodiesel 515
blend. Fuel injection duration shortened and peak injection rate increased with 516
increasing fuel injection pressure. Sauter mean diameter and arithmetic mean 517
diameter of fuel spray droplet (D32 and D10) decreased with reduction in biodiesel 518
blending ratio due to relatively lower fuel density and viscosity. 519
Brake thermal efficiency of biodiesel blends was slightly higher than mineral diesel. 520
Increasing fuel injection pressures generally improved the thermal efficiency of test 521
fuels. SOI timing corresponding to maximum thermal efficiency was identical for 522
biodiesel blends and mineral diesel. Lower biodiesel blends showed lower BSCO and 523
BSHC emissions in comparison to mineral diesel however BSHC and BSCO emissions 524
were found to be higher for some operating conditions for KOME50. BSNOx emissions 525
for KOME20 were higher than mineral diesel however they were almost identical to 526
mineral diesel for other blends. Maximum cylinder pressure increased with increasing 527
fuel injection pressure at fixed SOI timing for all test fuels and SOC advanced for lower 528

30
biodiesel blends in comparison to mineral diesel. For lower biodiesel blends, combustion 529
duration was relatively shorter than mineral diesel but at higher FIPs, combustion 530
duration of KOME50 was found to be relatively longer. These experimental results 531
showed that utilization of upto 10% Karanja biodiesel blends in a CRDI engines can be 532
done for improving engine efficiency and reducing emissions, without any significant 533
hardware changes or ECU recalibration. 534
Acknowledgements 535
Research Grant from Department of Science and Technology under Indo-Korea project 536
(No. INT/KOREA/P-04 dated 13-09-2011) is also gratefully acknowledged, which enabled 537
Indian side to undertake this joint research project. Korean side of this research was 538
supported by the National Research Foundation of Korea (NRF) Grant funded by the 539
Korea government (MSIP) (No.20110025295). 540
Support provided by Council of Scientific and Industrial Research (CSIR), Government 541
of India under Senior Research Associate (Pool Scientist) scheme to Mr. Atul Dhar for 542
conducting this research under the supervision of Prof. Avinash Kumar Agarwal at 543
Engine Research Laboratory, IIT Kanpur is gratefully acknowledged. 544
References 545
1. Boudy F, Seers P, Impact of physical properties of biodiesel on the injection process 546
in a common-rail direct injection system. Energy Conversion and Management 2009; 547
50: 2905–2912. 548
2. Yehliu K, Boehman AL, Armas O. Emissions from different alternative diesel fuels 549
operating with single and split fuel injection. Fuel 2010; 89(2): 423-437. 550
3. Suryawanshi JG, Deshpande NV. Effect of injection timing retard on emissions and 551
performance of a pongamia oil methyl ester fuelled ci engine. SAE Paper 2005; 2005-552
01-3677. 553

31
4. Grimaldi CN, Postrioti L, Battistoni M, Millo F. Common rail HSDI diesel engine 554
combustion and emissions with fossil/ bio-derived fuel blends. SAE Paper 2002; 555
2002-01-0865. 556
5. Zhu L, Cheung CS, Zhang WG, Huang Z. Emissions characteristics of a diesel engine 557
operating on biodiesel and biodiesel blended with ethanol and methanol. Science of 558
the Total Environment 2010; 408: 914–921. 559
6. Gumus M, Sayin C, Canakci M. The impact of fuel injection pressure on the exhaust 560
emissions of a direct injection diesel engine fueled with biodiesel–diesel fuel blends. 561
Fuel 2012; 95: 486-494. 562
7. Agarwal AK, Dhar A, Gupta JG, Kim WI, Lee CS, Park SW, Effect of fuel injection 563
pressure and injection timing on spray characteristics and particulate size–number 564
distribution in a biodiesel fuelled common rail direct injection diesel engine, Applied 565
Energy 2014; 130: 212–221. 566
8. Baldassarri LT, Battistelli CL, Conti L, Crebelli R, Berardis BD Iamiceli AL, 567
Gambino M, Iannaccone S. Emission comparison of urban bus engine fueled with 568
diesel oil and ‘biodiesel’ blend. Science of the Total Environment 2004; 327: 147–162. 569
9. Kousoulidou M, Fontaras G, Ntziachristos L, Samaras Z . Biodiesel blend effects on 570
common-rail diesel combustion and emissions. Fuel 2010; 89(11): 3442-3449. 571
10. Suh HK, Roh HG, Lee CS. Spray and combustion characteristics of biodiesel/diesel 572
blended fuel in a direct injection common-rail diesel engine. Journal of Engineering 573
for Gas Turbines and Power 2008; 130 (3): 1−9. 574
11. Wang WG, Lyons DW, Clark NN, Gautam M. Emissions from nine heavy trucks 575
fueled by diesel and biodiesel blend without engine modification. Environmental 576
Science & Technology 2000; 34(6):933 -939. 577

32
12. Kuti OA, Zhu J, Nishida K, Wang X, Huang Z. Characterization of spray and 578
combustion processes of biodiesel fuel injected by diesel engine common rail system. 579
Fuel 2012; http://dx.doi.org/10.1016/j.fuel.2012.05.014. 580
13. Lee CS, Park SW, Kwon SI, An experimental study on the atomization and 581
combustion characteristics of biodiesel-blended fuels. Energy & Fuels 2005; 19: 2201-582
2208. 583
14. Can Ö, Combustion characteristics, performance and exhaust emissions of a diesel 584
engine fueled with a waste cooking oil biodiesel mixture. Energy Conversion and 585
Management 2014; 87: 676–686. 586
15. Ministry of New & Renewable Energy, Government of India; National Policy on 587
Biofuels, http://mnre.gov.in/file-manager/UserFiles/biofuel_policy.pdf accessed on 588
20.05.13. 589
16. Sharma YC, Singh B, Upadhyay SN. Advancements in development and 590
characterization of biodiesel: A review. Fuel 2008; 87: 2355–2373. 591
17. Agarwal AK, Dhar A. Experimental investigations of performance, emission and 592
combustion characteristics of Karanja oil blends fuelled DICI engine. Renewable 593
Energy 2013; 52: 283-291. 594
18. Dhar A, Agarwal AK. Effect of Multiple Injections on Particulate Size-Number 595
Distributions in a Common Rail Direct Injection Engine Fueled with Karanja 596
Biodiesel Blends. SAE Paper 2013-01-1554; 2013. 597
19. Kureel RS, Singh CB, Gupta AK, Panday A, Karanja: A potential source of bio-diesel, 598
National Oilseed and Vegetalbe Oils Development (NOVOD) Board, 2008. 599
20. Ashraful AM, Masjuki HH, Kalam MA, Fattah IMR, Imtenan S, Shahir SA, 600
Mobarak HM, Production and comparison of fuel properties, engine performance, 601
and emission characteristics of biodiesel from various non-edible vegetable oils: A 602
review. Energy Conversion and Management 2014; 80: 202–228. 603

33
21. Bosch W. The fuel rate indicator: A new measuring instrument for display of the 604
characteristics of individual injection. SAE Technical Paper 1966; 660749. 605
22. Arcoumanis C, Baniasad MS. Analysis of Consecutive Fuel Injection Rate Signals 606
Obtained by the Zeuch and Bosch Methods, SAE Technical Paper 1993; 930921. 607
23. Suh HK, Lee CS. Effect of grouped-hole nozzle geometry on the improvement of 608
biodiesel fuel atomization characteristics in a compression ignition engine, Proc. 609
IMechE, Journal of Automobile Engineering 2009; 223: Part D, 1587-1600. 610
24. Indian standard IS: 14273, Automotive vehicles – Exhaust emissions – Gaseous 611
pollutants from vehicles fitted with compression ignition engines – method of 612
measurement, 1999, Bureau of Indian Standards, New Delhi, India. 613
25. Park SH, Seo HK, Lee CS, Effect of bioethanol-biodiesel blending ratio on fuel spray 614
behavior and atomization characteristics, Energy & Fuel 2009, 23,pp.4092-4098. 615
26. Park SH, Yoon SH, Lee CS. Effects of multiple-injection strategies on overall spray 616
behavior, combustion, and emissions reduction characteristics of biodiesel fuel. 617
Applied Energy 2011; 88: 88–98. 618
27. Lapuerta M, Armas O, Fernàndez JR. Effect of biodiesel fuels on diesel engine 619
emissions. Progress in Energy and Combustion Science 2008; 34:198–223. 620
28. Miyamoto, N, Ogawa, H, Nurun, NM, Obata, K, Arima, T. Smokeless, low NOx, high 621
thermal efficiency, and low noise diesel combustion with oxygenated agents as main 622
fuel. SAE paper 1998; 980506. 623
29. Lešnik L, Iljazˇ J, Hribernik A, Kegl B, Numerical and experimental study of 624
combustion, performance and emission characteristics of a heavy-duty DI diesel 625
engine running on diesel, biodiesel and their blends. Energy Conversion and 626
Management 2014; 81: 534–546. 627

34
30. Ye P, Boehman AL. An investigation of the impact of injection strategy and biodiesel 628
on engine NOx and particulate matter emissions with a common-rail turbocharged 629
DI diesel engine. Fuel 2012; 97: 476-488. 630
31. Szybist JP, Kirby SR, Boehman AL. NOx emissions of alternative diesel fuels: a 631
comparative analysis of biodiesel and FT diesel. Energy & Fuels 2005; 19: 1484–632
1492. 633
32. Yu CW, Bari S, Ameen A. A comparison of combustion characteristics of waste 634
cooking oil with diesel as fuel in a direct injection diesel engine. Proceedings of the 635
Institution of Mechanical Engineers, Part D: Journal of Automobile Engineering 636
2002; 216: 237–243. 637
33. Sun J, Caton JA, Jacobs TJ. Oxides of nitrogen emissions from biodiesel-fuelled 638
diesel engines. Progress in Energy and Combustion Science 2010; 36: 677-695. 639


