
1
Agro-Science Journal of Tropical Agriculture, Food, Environment and Extension
Volume 19 Number 1 (January 2020) pp. 1 - 10
ISSN 1119-7455
EFFECT OF DIFFERENT PROCESSING METHODS ON CHEMICAL AND
PASTING PROPERTIES OF TAMARIND (Tamarindus indica L.) SEED FLOURS
*1Uzodinma E.O.,
1Osagiede E.G. and
2Chikwendu J.N.
1Department of Food Science & Technology and
2Department of Human Nutrition & Dietetics,
University of Nigeria, Nsukka, Enugu State, Nigeria
*Corresponding author’s email: [email protected]
ABSTRACT This study investigated the effect of autoclaving, boiling and roasting methods on the chemical and pasting
properties of tamarind seed flour. The flours were analyzed for proximate composition, functional properties,
selected mineral contents, anti-nutrients and pasting properties. Results indicated that there were significant
(p < 0.05) differences in the moisture, protein, fat, fibre, ash and carbohydrate contents of the flour samples
with values that ranged from 10.26-11.36, 19.64-24.23, 2.26-4.13, 3.25-4.55, 3.48-3.98 and 52.59-59.86%,
respectively. Significant (p < 0.05) differences were also observed in the values of selected functional
properties and minerals (sodium, magnesium, potassium and phosphorus). Boiling method relatively reduced
some of the anti-nutrients more effectively than others. Flour from boiled T. indica seeds could withstand
heating and shear stress compared to other processed samples because of its low breakdown viscosity value.
However, flour from roasted seeds had highest setback viscosity value among others and might withstand
retrogradation better than others. Overall results indicated that autoclaved, boiled and roasted seed flours
could be useful in pasta, noodle and bakery industries. Key words: boiling, flour, pasting properties, tamarind seed flours, tamarind seeds, viscosity
INTRODUCTION
Tamarind is a highly wind-resistant tree which can
be grown unattended in backyards, roadsides or
wastelands and almost every part of the tree is
useful (Singh et al., 2007). In inter-tropic zone,
tamarind pulp, leaves and flowers are commonly
consumed in various dishes and traditional drinks
due to its high nutritive and calorific value.
Tamarind tree bears pods containing about 10
brown seeds surrounded by an abundant acid pulp.
Traditional processing for food preparation is
widespread, whereas its commercial uses
(pasteurized juices and tamarind paste) are still
relatively unknown and under-developed (Singh et
al., 2007). Tamarind seed as a by-product of the
commercial utilization of the fruit has several uses.
The seeds are rich in protein and can alleviate
protein malnutrition widespread in many Asian and
African countries. They are good sources of crude
fibre, carbohydrate and mineral concentrations
particularly potassium (Ajayi et al., 2006). The
seeds also have the potential for substituting 30%
of cereals in livestock rations (Singh et al., 2007).
Presence of tannin, phytic acid, hydrogen cyanide,
trypsin inhibitor and phyto-haemaglutinations in
the seed testa, makes the whole seed unsuitable for
consumption. The testa can produce some side
effects such as depression, constipation and gastro-
intestinal disorder and must be removed by soaking
or boiling in water and roasting (El-Siddig et al.,
2006). Moreover, the nutrient value of food can be
changed by the way it is processed, cooked and
stored. However, some food processing methods
(soaking, boiling, roasting, blanching, autoclaving
and fermentation) can enhance quality of processed
foods through detoxification of anti-nutrients,
flavour and colour development, among others
(Oluseyi and Temitayo, 2015). Previous studies
had reported the use of soaking, boiling, roasting,
germination and fermentation to produce detoxified
flours from tamarind nuts (El-Siddig et al., 2006;
Oluseyi and Temitayo, 2015). However,
information on the use of autoclaving in processing
of tamarind seeds and pasting properties of
processed flours from the seeds based on previous
methods are limited. Hence, the aim of this study
was to determine the effect of autoclaving, boiling
and roasting methods on the chemical and pasting
properties of flours produced from tamarind seeds.
MATERIALS AND METHODS Tamarind seeds were purchased from Jasuwagwari
Market, Minna in Niger State, Nigeria. Chemicals
of analytical grade and equipment were obtained
from Department of Food Science and Technology
of the University of Nigeria, Nsukka and
International Institute of Tropical Agriculture
(IITA), Ibadan, both in Nigeria.
Please cite as: Uzodinma E.O., Osagiede E.G. and Chikwendu J.N. (2020). Effect of different processing methods on chemical and pasting
properties of tamarind (Tamarindus indica L.) seed flours. Agro-Science, 19 (1), 1-10. DOI: https://dx.doi.org/10.4314/as.v19i1.1

2
Processing Methods
Production of the different flours from the seeds
Raw seeds of the tamarind fruits were manually
sorted to remove stones and other contaminants and
divided into five portions. The first portion was
sun-dried during active sunshine hours (9 am - 5 pm)
for four days to a constant moisture content of
8.0% at ambient conditions and milled without any
form of processing (UTS). The second portion was
also sun-dried for three days to constant moisture
content of 8.5% within the active sunshine hours at
ambient conditions and milled after removing the
seed coat (DTS). Different processing treatments
were adopted for each of the remaining portions.
The treatments were: roasting (RTS), boiling (BTS)
and autoclaving (ATS) to enhance removal of the
seeds from the seed coat, followed by drying, de-
hulling and milling (Figure 1).
Roasting
After preliminary investigation, 500 g of tamarind
seeds were roasted in an open pan placed on an
electric stove at a temperature range of 100-120oC
for 15 min. The roasted seeds were de-hulled after
breaking the cotyledons with the attrition mill and
the seed coats removed by abrasion (rubbing in-
between palms) and winnowing. The cotyledons
were sun-dried and milled into flour using attrition
mill and sifted through a 1-mm mesh size sieve,
packaged in air- tight plastic containers and stored
under laboratory room temperature.
Boiling
In this method, 500 g of the seeds were cooked in
boiling water for 30 min. (Akajiaku et al., 2014).
The seeds were sun-dried and milled into flour. The
flour was sifted through a 1-mm mesh size sieve,
packaged in an air tight container and stored under
laboratory room temperature.
Autoclaving Five hundred grammes (500 g) of the seeds were
soaked in sufficient clean water for 1 h, autoclaved
for 15 min. at 121oC, cooled and the seed coat
removed by abrasion and hand picking. De-hulled
seeds were hot oven dried at 60°C for 8 h. to a
constant moisture content of 8.30% and milled into
flour. The flour was sifted through a 1-mm mesh
size sieve and packaged in an air-tight container.
Production of flour from whole raw seeds
Five hundred grammes (500 g) of the sun-dried
seeds were sorted, milled, sieved and packaged in
airtight container to obtain the first control sample.
Production of flour from the raw seeds de-hulled
Five hundred grammes (500 g) of the sun-dried
seeds were de-coated by breaking them using at
attrition mill and then separated from the seed coat,
milled, sieved and packaged in an airtight container
to obtain a second control sample.
Figure 1: Production of tamarind seed flour
Source: Akajiaku et al. (2014)
Analytical Methods
Determination of flour proximate composition The moisture, crude protein, crude fat, ash, crude
fibre and carbohydrate by difference were carried
out using AOAC (2010) method. All analysis was
carried out in triplicates and values obtained
reported in percentages.
Determination of water/oil absorption capacities
Water absorption capacity was determined
according to the method of Phillips et al. (1988)
with slight modifications. One gramme (dry weight
basis) of sample was dispersed in 10 ml distilled
water, vortexed intermittently for 10 min. and
centrifuged at 4500 rpm for 20 min. The aqueous
supernatant obtained after centrifuging was
decanted and the test tubes were inverted and
allowed to drain for 5 min. on a towel. By
weighing the residue, water absorption capacity
was calculated as percentage of gram of water
absorbed per gram of sample.
Oil absorption capacity was determined by the
method of Beuchat (1977). About 0.50 g of each
powder sample was mixed with 5 ml of oil for 30
seconds. The samples were then allowed to stand at
room temperature (30.0 ± 2°C) for 30 min. after
which they were centrifuged at 5000 rpm for 30
min. The supernatant, mainly oil was decanted, and
the test tubes inverted and allowed to drain for 15
min. on a towel. By weighing the residue, oil
absorption capacity was calculated as grams of oil
absorbed per gram of samples.
Determination of emulsifying capacity and
emulsion stability
Emulsifying capacity was determined by the
procedure of Beuchat et al. (1975), while emulsion
stability was also evaluated using that of Pearce
and Kinsella (1978). About 0.5 g of the sample was
suspended in 3 ml of distilled water contained in a
graduated tube followed by the successive addition
of 3 ml of cottonseed oil. The mixture was
vigorously mixed for 10 min. using an agitator. The
Tamarind seeds
sorting/cleaning
Roasting
Dehulling
Dehulled seeds
Dry, mill & sieve
Roasted tamarind flour
Boiling
Dehulling
Dehulled seeds
Dry, mill & sieve
Boiled T. indica flour
Autoclaving
Dehulling
Dehulled seeds
Dry, mill & sieve
Autoclaved T. indica flour
Effect of Processing Method on Some Properties of Tamarindus indica L. Seed Flours

3
resulting emulsion was centrifuged at 2500 rpm for
30 min. The height of the emulsified layer divided
by that of the whole slurry multiplied by 100 was
taken as the emulsifying capacity of the sample.
For the emulsion stability, the homogenized
mixture of powder, water and oil were heated at
80°C for 30 min. before centrifugation. The
emulsion stability was calculated as the height of
the emulsifying layer divided by that of the heated
slurry multiplied by 100.
Determination of bulk density
The bulk density was determined by the method
described by Onwuka (2018). A 10-ml capacity
graduated measuring cylinder was weighed. The
cylinder was gently filled with the sample followed
by tapping the bottom until there was no further
diminution of the sample level after filling to the
10-ml mark. The bulk density was calculated as:
B𝑢𝑙𝑘 𝑑𝑒𝑛𝑠𝑖𝑡𝑦( 𝑔𝑚𝑙) = 𝑤𝑒𝑖𝑔ℎ𝑡 𝑜𝑓 𝑠𝑎𝑚𝑝𝑙𝑒 𝑣𝑜𝑙𝑢𝑚𝑒 𝑜𝑓 𝑠𝑎𝑚𝑝𝑙𝑒
Determination of swelling power
The method described by Daramola and
Osanyinlusi (2006) was used to determine the
swelling power with slight modifications. The flour
sample (0.1 g) was weighed into a test tube and 10
ml of distilled water was added. The mixture was
heated in a water bath at a temperature of 50oC for
30 min. with continuous shaking. Centrifugation
was then carried out at 1500 rpm for 20 min. in
order to facilitate the removal of the supernatant
which was carefully decanted, and weight of the
starch paste taken. The swelling power was
calculated as follows:
𝑆𝑤𝑒𝑙𝑙𝑖𝑛𝑔 𝑝𝑜𝑤𝑒𝑟 = 𝑊𝑒𝑖𝑔ℎ𝑡 𝑜𝑓 𝑠𝑡𝑎𝑟𝑐ℎ 𝑝𝑎𝑠𝑡𝑒𝑤𝑒𝑖𝑔ℎ𝑡 𝑜𝑓 𝑑𝑟𝑦 𝑠𝑡𝑎𝑟𝑐ℎ
Determination of mineral contents (magnesium,
potassium, sodium and phosphorus)
The mineral contents of the flours were determined
using atomic absorption spectrophotometer (Perkin
Elmer, model number: 2380, USA) as detailed in
International Institute of Tropical Agriculture
(IITA) manual for methods of mineral analysis
with procedure similar to that described in Onwuka
(2018). About 0.50 g sample was weighed into a
clean ceramic crucible and the weight recorded to
the nearest 0.001 g. One empty crucible was
included for a blank. The sample was placed in a
cool muffle furnace and temperature set to 500 °C
over a period of 2 h. This remained at 500 °C for an
additional 2 h. The sample was allowed to cool
inside desiccators in the analysis room. The ashed
sample was then poured first into an already
labeled 50 ml centrifuge tube. The crucible was
rinsed with 5 ml of distilled water into the
centrifuge tube. The crucible was rinsed again with
5 ml of aqua regia up to 4 times (Preparation: In a
2-liter volumetric flask, 1.2 liter distilled water was
added followed by careful addition of 400 ml Conc.
HCl and 133 ml of 70% Nitric acid. The flask and
its content were dilute to 2 liters.). The sample was
vortexed for proper mixing. This was followed
with centrifugation for 10 min. at 3000 rpm. The
supernatant was decanted into clean vials for macro
and micronutrients determination using atomic
absorption spectrophotometer.
Determination of anti-nutrients
Determination of tannin content
Tannin content was determined using Folin-Denis
spectrophotometric method described by Singh et
al. (2012). One gramme of each sample was
dispersed in 10 ml of distilled water, shaken and
allowed to stand for 30 min. at 28°C before it was
centrifuged to get the extract. About 2.5 ml of the
supernatant (extract) was dispersed into a 50 ml
volumetric flask. Similarly, 2.5 ml of standard
tannic acid solution was dispersed into a separate
50 ml flask. One ml Folin-Denis reagent was
measured into each flask, followed by 2.5 ml of
saturated Na2CO3 solution. The mixture was
diluted to mark in the flask (50 ml), and incubated
for 90 min. at 28°C. The absorbance was measured
at 250 nm in a spectrophotometer. Readings was
taken with the reagent blank at zero. The tannin
content was calculated as follows:
% Tannin = 𝐴𝑛𝐴𝑠 × 𝐶 × 100𝑊 × 𝑉𝑓𝑉𝑎
where An is absorbance of test sample, As is
absorbance of standard solution, C is concentration
of standard solution, W is weight of sample, Vf is
total volume of extract, and Va is volume of extract.
Determination of hydrogen cyanide
The alkaline picrate method described by Onwuka
(2018) was used. Five grammes (5 g) of each of
the different flour were dissolved in 50 ml distilled
water in a corked conical flask. The cyanide
extraction was allowed to stay overnight and then
filtered. About 4 ml alkaline picrate was added to 1
ml of the filtrate and incubated in the water bath.
After colour development, the absorbance was read
at 490 nm. The absorbance of the blank containing
only one ml distilled water and 4 ml alkaline
picrate solution was read.
The cyanide content was extrapolated from a
cyanide standard curve, prepared from different
concentrations of KCN solution containing 5-50 µg
cyanide in a 500 ml conical flask.
Determination of trypsin inhibitor
Trypsin inhibitor activity was determined by
spectrophotometric method described in Onwuka
(2018). About 1 g of the test sample was weighed
and dispersed in 50 ml of 0.5M NaCl solution to
obtain sample extract. The mixture was stirred for
Uzodinma E.O., Osagiede E.G. and Chikwendu J.N.

4
30 min. at room temperature and centrifuged. The
supernatants were filtered through watchman No.
41 filter paper and the filtrate utilized for the assay.
Standard trypsin was prepared using BAPA (N-α-
Benzoyl-DL-Arginine-P-nitroanilide) reagent
which was added to the filtrate/extract. Two
millilitres (2 ml) of the standard trypsin solution
was added to 10 ml of sample extract in a test tube.
A blank of 10ml of substrate was also prepared but
did not contain the extract. The contents of the test
tubes stood for 10 min. and measurement was
carried out using Spectronic 401 spectrophotometer
at 410 nm, wavelength. Trypsin inhibitor activity
expressed as number of try sin units inhibited per
unit weight of sample was calculated as follows:
𝑇𝐼𝑈𝑚𝑔 = 𝐴𝑏𝑠𝑜𝑟𝑏𝑎𝑛𝑐𝑒 𝑜𝑓 𝑠𝑎𝑛𝑝𝑙𝑒 × 0.01𝐹𝐴𝑏𝑠𝑜𝑟𝑏𝑎𝑛𝑐𝑒 𝑜𝑓 𝑠𝑡𝑎𝑛𝑑𝑎𝑟𝑑 𝑇𝐼𝑈/𝑚𝑔 = 𝑏 − 𝑎 × 𝐹0.01
where b is absorbance of test sample solution, a is
absorbance of the blank and F is experimental factor
given by 𝐹 = 1𝑤 × 𝑉𝑓𝑉𝑎 × 𝐷; with w as weight of sample,
Vf as total volume of the extract, Va as volume of
the extract used in the assay, and D as dilution factor.
Determination of alkaloids
This was determined using the method described in
Onwuka (2018). Five grammes (5.0 g) of flour
sample was weighed and dispersed into 50 ml of
10% acetic acid solution in ethanol. The mixture
was well shaken and stood for 4 h before filtering.
The filtrate was evaporated one-quarter of its
original volume and concentrated ammonia solution
(NH4OHaq.) was added drop wise to precipitate
alkaloids. The precipitate was separated using
weighed filter paper and washed with 1% NH4OHaq.
The precipitate in the filter paper was dried in hot
air oven at 60oC for 30 min. and reweighed.
% 𝐴𝑙𝑘𝑎𝑙𝑜𝑖𝑑𝑠 = 𝑤2 − 𝑤1 × 100𝑤
where w2 is weight of filter paper + precipitate, w1
is weight of filter paper, and w is weight of sample.
Determination of pasting properties
Pasting properties of flour samples were determined
using Rapid Visco-Analyser (RVA-Model RVA 3D)
series 4 (New Scientific P.V.T Ltd, Australia, 1998)
with the aid of the rmocline for windows version
1.1 software). Three grammes (3.0 g) of each of the
flour sample were weighed into a dried empty
canister and 25 ml of distilled water was added to
obtain flour dispersion after thorough mixing. The
canister with dispersion was then fitted well into
the RVA as indicated by the procedure and heated
from 50-95 oC with a holding time of 2 min.
followed by cooling to 50 oC with 2 min. holding
time. Heating and cooling were at a constant rate of
11.25 oC/min (Newport Scientific, 1998). Peak
viscosity, peak time, trough viscosity, breakdown
viscosity, setback viscosity, final viscosity and
pasting temperature were read from the pasting
profile using the rmocline for windows software
connected to a computer (Newport Scientific, 1998).
Experimental design and data analysis
The experiment was carried out based on
completely randomized design. Data collected from
physicochemical (proximate, mineral composition,
among others) and anti-nutrient determinations
were subjected to one-way analysis of variance.
Means were separated using least significant
difference (Steel and Torrie, 1980) and significance
was accepted at p < 0.05.
RESULTS AND DISCUSSION
Effect of Processing Methods on the Flour
The different flours produced from the seeds are
presented in (Plates 1 to 5). The flours had different
colours due to the different processing methods.
Flour from boiling and roasting had very fine
particles as compared to others.
Plate 1: Autoclaved tamarind seeds and seed flour
Plate 2: Boiled tamarind seeds and seed flour
Plate 3: Roasted tamarind seeds and seed flour
Plate 4: Dehulled raw tamarind seeds and seed flour
Plate 5: Undehulled raw tamarind seeds and seed
flour
Effect of Processing Method on Some Properties of Tamarindus indica L. Seed Flours

5
Effect of Processing Methods on Proximate
Composition of Tamarind Seed Flours
Proximate composition of autoclaved (ATS), boiled
(BTS), roasted (RTS), dehulled raw seed (DTS)
and undehulled raw seed flours (UTS) are shown in
Table 1. Moisture contents of the samples ranged
from 10.26-11.36% with sample ATS having the
least value (10.26%). Significant (p < 0.05)
differences existed among the samples and could
be due to different processing methods. However,
the values are within the range (10-14%) required
for the safe keeping of flours (SON, 2007). Protein
content of the samples ranged from 19.64-24.23%.
Sample BTS has the least value (19.64%) among
others. The values were within the range of 20-37%
reported by Glew et al. (1997) for indigenous plants
of Burkina Faso. Proteins and starch contained in
flours are water loving (hydrophilic) and hence, the
ATS, RTS and BTS flours, could be used as
components in baking flours especially for proper
dough development (Onwurafor et al., 2017). The
raw dehulled and undehulled flour samples were
also high in protein contents but cannot be used in
any food formulation without further processing for
their flours might contain other toxins at high
concentration in addition to very dark colour.
Fat content of the flour samples ranged from 2.26
to 4.13%, with significant (p < 0.05) differences
among them. The fat composition agrees with the
nutritional and anti-nutritional properties of under-
exploited legumes species reported by Siddhuraju
et al. (1995). Processing of the seeds based on
boiling and autoclaving significantly (p < 0.05)
resulted to reduction in fat contents of the ATS and
BTS flours and could be due to type of heating
methods applied. Roasting involved mainly dry
heating. Crude fibre content of flour samples ranged
from 3.25 to 4.55%. Sample BTS had the least
value (3.25%). The values obtained in experimental
study were lower than an earlier report of 6.0-7.0%
on same tamarind species by Oluseyi and Temitayo
(2015), and might be due to different processing
methods. Fibre is important in human system when
consumed through diets and could decrease bad
cholesterol (LDL) levels, risk of coronary heart
disease, colon and breast cancer (Plaami, 1997).
Ash contents of the samples ranged from 3.48 to
3.98% and there were no significant (p > 0.05)
differences among the samples and indicated that
the processing methods did not relatively affect the
mineral composition of the ATS, BTS and RTS
flours. Values were within the range of 3.20-4.60%
reported in Nigeria for under-utilized legume flours
(Aremu et al., 2006) and 4.10-4.30% recorded by
Oluseyi and Temitayo (2015) on processing of
tamarind seeds into flours using different methods.
Total carbohydrate contents of the samples ranged
from 52.89 to 59.86% and significant (p < 0.05)
differences existed among them. Carbohydrate
content values were found to be higher than those
of earlier investigation on wild pulses such as
Afzelia Africana (Madubuike et al., 1994) and
those of Oluseyi and Temitayo (2015). The
differences in quantities might be due to variations
in cultivars and wide genetic diversity found in
different geographical locations of the world as
noted in Oluseyi and Temitayo (2015).
Effect of Processing Methods on Functional
Properties of Tamarind Seed Flours
Functional properties of tamarind seed flours are
shown in Table 2. Water absorption capacity (WAC)
ranged from 89.66 to 97.46% with ATS having the
lowest value (89.66%) among the processed flours.
There were significant (p < 0.05) differences
among them. However, no significant (p > 0.05)
differences existed between the values for boiled
and roasted samples. Water absorption affects the
quality of baked goods and depends partly on the
damaged starch contained in the flour, the protein
content and particle size (Kulkarni et al., 1991).
Higher values for boiled and roasted flours WAC
indicated that they could be included into aqueous
food formulations in food processing that would
involve preparation of dough such as baking. For
instance, some reports (Aprianita et al., 2014;
Ramashia et al., 2017) indicated that flour with
high WAC encouraged initial softness in bread,
while decreasing unnecessary firmness. It also
enhanced smoothness and viscosity of the baked
product. Emulsion capacity ranged from 34.35 to
46.12%. There were no significant (p > 0.05)
differences in the values for RTS and ATS flours
and could show that both processing methods did
not affect their emulsion capacities. The values for
boiled and autoclaved flours also indicated their
suitability for stable emulsions that cannot easily
coalesce and flocculate (Subago, 2006). Hence,
they could be used with wheat flour as composite
in food formulations since values recorded in the
study were higher than range (14.67-20.35%)
reported for wheat flour (Ukom et al., 2017).
Table 1: Proximate composition of the tamarind seed flours Flour samples
Moisture (%)
Crude protein (%)
Crude fat (%)
Crude fibre (%)
Ash (%)
Carbohydrate (%)
ATS 10.26a±0.01 20.24b±0.01 2.26a±0.01 3.97b±0.01 3.98b±0.01 59.29d±0.00
BTS 11.36e±0.01 19.64a±0.01 2.35a±0.01 3.25b±0.01 3.56b±0.01 59.84d±0.02
RTS 10.88c±0.01 22.26c±0.01 3.66c±0.01 4.55e±0.01 3.73b±0.01 54.92e±0.01
DTS 10.66b±0.01 24.23e±0.01 4.13e±0.01 4.47e±0.01 3.64b±0.01 52.87a±0.014
UTS 11.15d±0.01 23.37d±0.01 3.98d±0.01 4.16e±0.01 3.48b±0.01 53.86b±0.01
Values are means for three replications ± standard deviations. Mean values with same superscript in the same column are not significantly (p > 0.05) different. ATS - Autoclaved tamarind seed flour; BTS - Boiled tamarind seed flour; RTS - Roasted tamarind seed flour; DTS - Dehulled raw tamarind seed flour; UTS - Undehulled raw tamarind seed flour
Uzodinma E.O., Osagiede E.G. and Chikwendu J.N.

6
The values for bulk density values of the samples
ranged from 0.45 to 0.48 g/ml. There were no
significant (p > 0.05) differences in values among
the flours but the values were slightly lower than
those of Bambara groundnut flour (0.60-0.75 g/ml)
reported by Onimawo et al. (1998). Bulk density is
very important in determining the packaging
materials for flours, material handling and
application in wet processing in the food industries
(Karuna et al., 1996). Low values obtained for the
processed flours in bulk density might imply that
the powdered processed samples would have
application in complementary food formulations
for infants. Swelling power ranged from 10.24 to
11.13%. There were no significant (p > 0.05)
differences in the swelling power of the different
samples. The swelling power could be dependent
on association binding within the starch granules
and strength and character of the micelle network
in relation to amylose content of the flour
(Adebowale et al., 2005). Therefore, swelling
power has direct relationship with WAC.
Effect of Processing Methods on Mineral
Composition of Tamarind Seed Flours Selected mineral composition of tamarind seed
flours is presented in Figure 1. Sodium content
ranged from 73.35-122.26 mg/100g. The ATS and
RTS flours had significantly (p < 0.05) higher
values for sodium content than flour from boiling
method. This could be due to leaching of the
mineral into water during processing, while
complex reaction during roasting of the seeds might
reduce amount of sodium in the roasted flour.
However, both ATS and RTS flours were fair
sources of sodium. The mineral is required for
regulation of acid-base balance and osmotic pressure
in human body system (Maher and Escort-Stump,
2004). As a macro-mineral, adults up to 50 years
require 2.4 g/day, while 50-70 years need 2.2 g/day
(Maher and Escort-Stump, 2004).
The sodium content for the processed flours was
relatively higher than an earlier report of same
species of tamarind seeds studied by Ishola et al.
(1990). Magnesium content ranged from 2.95 to
3.56 mg/100g. Sample ATS had the highest
magnesium content among processed flours.
However, results indicated that the seeds were
relatively low sources of magnesium as compared
to daily nutrient intake by adults’ females and
males that varied between 220 and 260 mg/day
(FAO, 2004). Magnesium is important in the
formation of body’s main energy compound called
adenosine triphosphate (ATP), nerve impulse
transmissions and muscle contractions. Potassium
was the highest mineral recorded for all the flours
and significant (p < 0.05) differences existed
among the samples. Sample RTS had the highest
potassium content (478.86 mg/100g) followed by
ATS (460.26 mg/100g). An earlier report on all the
minerals by Ajayi et al. (2006) indicated that K had
the highest concentration in under-utilized legumes,
and this agrees with the results in the present
report. This is nutritionally significant (p < 0.05)
since potassium plays major role in neuro-muscular
function, acid-base fluid and electrolyte balance,
osmotic pressure, enzyme reactions, among others
(Ajayi et al., 2006; FAO, 2004). The processed T.
indica seed flours of experimental study were found
to contain more than adequate level of potassium
compared to recommended dietary allowance
(RDA) of Anonymous (2019). Adeola and Aworh
(2012) pointed out that sodium to potassium ratio
(Na: K) was important for proper balancing of the
heart pressure in human system and for this to be
achieved NaK−1
must be less than one. Hence,
values calculated for the ratios of the minerals in
the processed flours showed that ATS had 0.26,
while values for BTS and RTS were 0.17 and 0.27,
respectively. Phosphorus content of the sample
ranged from 120.26 to 153.36 mg/100g. The
contents were relatively higher for all the processed
flours but BTS had lowest value among the flours
and could be due to the processing method.
Phosphorus mineral participates in buffering the
human body system, is part of DNA and RNA and
helps in energy metabolism (Paul et al., 2018).
Figure 1: Mineral composition of the processed
tamarind seed flours
1 - Autoclaved tamarind seeds; 2 - Boiled tamarind seeds;
3 - Roasted tamarind seeds; 4 - Dehulled raw tamarind seeds;
5 - Undehulled raw tamarind seeds
0
100
200
300
400
500
600
1 2 3 4 5
Se
lect
ed
min
era
l co
mp
osi
tio
n
Flour samples
Na Mg K P
Table 2: Functional properties of tamarind flour samples Sample Water flours absorption capacity (%)
Emulsion capacity
(%)
Bulk density (g/ml)
Swelling Power
(%)
ATS 89.66a±0.01 45.37d±0.01 0.48a±0.00 10.67a±0.01
BTS 96.35d±0.02 38.38b±0.01 0.45a±0.00 11.13b±0.01
RTS 95.16d±0.01 46.12d±0.01 0.46a±0.00 10.36ac±0.01
DTS 97.46e±0.01 34.35a±0.01 0.46a±0.00 10.24a±0.02
UTS 91.47b±0.01 41.16c±0.01 0.45a±0.00 10.45a±0.01
Values are means for three determinations ± standard deviation. Mean values with same superscript in the same column are not significantly (p > 0.05) different. ATS - Autoclaved tamarind seed flour; BTS - Boiled tamarind seed flour; RTS – Roasted tamarind seed flour; DTS - Dehulled raw tamarind seed flour; UTS - Undehulled raw tamarind seed flour
Effect of Processing Method on Some Properties of Tamarindus indica L. Seed Flours

7
Effect of Processing Methods on Anti-Nutrient
Composition of Tamarind Seed Flours
Anti-nutrient composition of tamarind seed flours is
shown in Table 3. Tannin content ranged from 2.63 to
4.21 mg/100g. Samples BTS and ATS had lower
tannin contents than sample RTS. The lower content
in BTS and ATS could be attributed to solubility of
some tannin in water during soaking and heating
(Uzogara et al., 1990) of the seeds. There are water
soluble and insoluble tannins and these organic
compounds commonly form insoluble complexes with
protein making them non-bioavailable. However,
values of the experimental study were all within
acceptable levels (< 76-90 g kg/dry matter); lower the
value, the better for the processed flour utilization in
food product development. Research findings of
Aletor and Adeogun (1995) on nutrient and anti-
nutrient composition of some tropical leafy vegetables
highlighted that tannin contents as high as 76-90 g
kg/dry matter might be harmful when consumed.
Hydrogen cyanide contents of the samples ranged
from 0.24-0.86 mg/100g and values were relatively
lower for all the flours but exceptionally lowest for the
roasted flour. This can be attributed to heat application
which has been reported to reduce cyanogen’s content
(Sathe and Salunkhe, 1984). High concentrations of
hydrogen cyanide can be very poisonous to human
health if consumed. Trypsin inhibitor activity of
tamarind seed flours range from 7.67-20.05 TIU/mg.
Boiling method significantly (p < 0.05) reduced
trypsin inhibitor of the tamarind seeds from 20.05 of
undehulled seeds to 7.67 TIU/mg in the boiled seed
flour. Trypsin is an enzyme involved in the breakdown
of many different proteins during digestion in humans,
monogastrics and young ruminants.
Trypsin inhibitors are proteins that reduce biological
activity of trypsin by controlling the activation and
catalytic reactions of proteins and compete with
proteins to bind to trypsin and therefore render them
unavailable to bind with proteins for the digestion
process; example, protease inhibitors. Reduction in
trypsin content might be attributed to effect of heat
denaturation during boiling. Kanwar et al. (1991)
recorded that cooking removes trypsin inhibitor
activity by more than 98%. Alkaloid contents of the
samples ranged from 23.34-30.05 mg/100g and were
higher than other anti-nutrient contents recorded.
Alkaloids have dual functions. At high
concentration most of them are toxic but have
pharmacological effect at low concentrations. The
RTS flour had lowest amount of alkaloids among
others. Most alkaloids as organic nitrogen bases are
bitter in taste. Tamarind seed alkaloids such as
cochins and vinca are capable of inhibitory
mitotic cell division; phagocytosis and can encourage
lympho-toxic activities that are dangerous to health at
low concentration (Higuchi and Hassan, 1973).
Effect of Processing Methods on Pasting Properties
of Tamarind Seed Flours Pasting properties of flour dispersions are presented in
Figure 2. They are properties used to predict flour
behaviours during and after cooking. Pasting
temperatures (PTs) of all samples ranged from 82.38
to 84.55 oC. There were no significant (p > 0.05)
differences in the values for BTS, RTS and UTS
flours. The BTS and RTS had also lower pasting
temperatures than ATS. The PT is the temperature at
which viscosity of flour dispersion first increase by at
least 2RVU over a period of 20 sec. and indicates the
temperature required to cook the flour starch beyond
its gelatinization point (Adebowale et al., 2008).
Gelatinization is an irreversible process that occurs
when starch/starch-based foods are heated in water
beyond a critical temperature, starch molecules’ intermolecular bonds break down allowing the
hydrogen bonding sites to engage more water and
become hydrated. The irreversible process gives room
for dissolution of starch granules and the chains
separate into amorphous format that temperature based
on the starch type. High PT values indicate the ability
of the flour starch dispersion to resist swelling and
rupturing that might be due to size of the granules and
effect of the processing methods. The PT of the T.
indica seed flours were generally lower than boiling
temperature of water; hence the flours could form
paste before boiling point of water was attained in < 7
min. as indicated by the peak time. At commercial
level, it is a remarkable way of saving cost.
Peak viscosity (PV) of the flour samples ranged
from 49.35 to 66.77 RVU. The RTS flour had the
highest value (66.77 RVU) among processed flours.
Significant (p < 0.05) differences observed in processed
samples are indicative of nature and composition of
their starches. The PV is the maximum viscosity
developed when portion of the test sample is heated.
The viscosity has been reported to be closely associated
with the degree of starch damage during stirring,
amylose content and relative crystalline; and high
damage enhances viscosity of paste (Sanni et al., 2001).
This implied that the roasted flour dispersion would
have high gel strength and gel forming potential
during cooking than other processed flours and could
be used in food preparations that would require high
thickening power at high temperatures in food
industries (Kim et al., 1995). However, all processed
flour samples could be used for similar applications as
their PV values ranged from 50.43-66.77 RVU.
Table 3: Anti-nutrient composition of tamarind seed flours Flour
samples
Tannin
(mg/100g)
HCN
(mg/100g)
Trypsin
(TIU/mg)
Alkaloid
(mg/100g)
ATS 2.68b±0.01 0.64b±0.00 13.59b±0.01 24.49b±0.01
BTS 2.63b±0.01 0.24a±0.01 7.67a±0.01 28.45d±0.01
RTS 3.98d±0.01 0.67b±0.01 17.57c±0.02 23.34a±0.01
DTS 3.81d±0.02 0.86b±0.01 18.66d±0.01 26.66c±0.01
UTS 4.21e±0.02 0.74b±0.01 20.05e±0.01 30.05e±0.01
Values are means for three replications, ± Standard deviations. Mean
values with same superscript in the same column are not significantly
(p > 0.05) different. ATS- Autoclaved tamarind seeds; BTS- Boiled
tamarind seeds; RTS- Roasted tamarind seeds; DTS- Dehulled raw
tamarind seeds; UTS-Undehulled raw tamarind seeds
Uzodinma E.O., Osagiede E.G. and Chikwendu J.N.
8
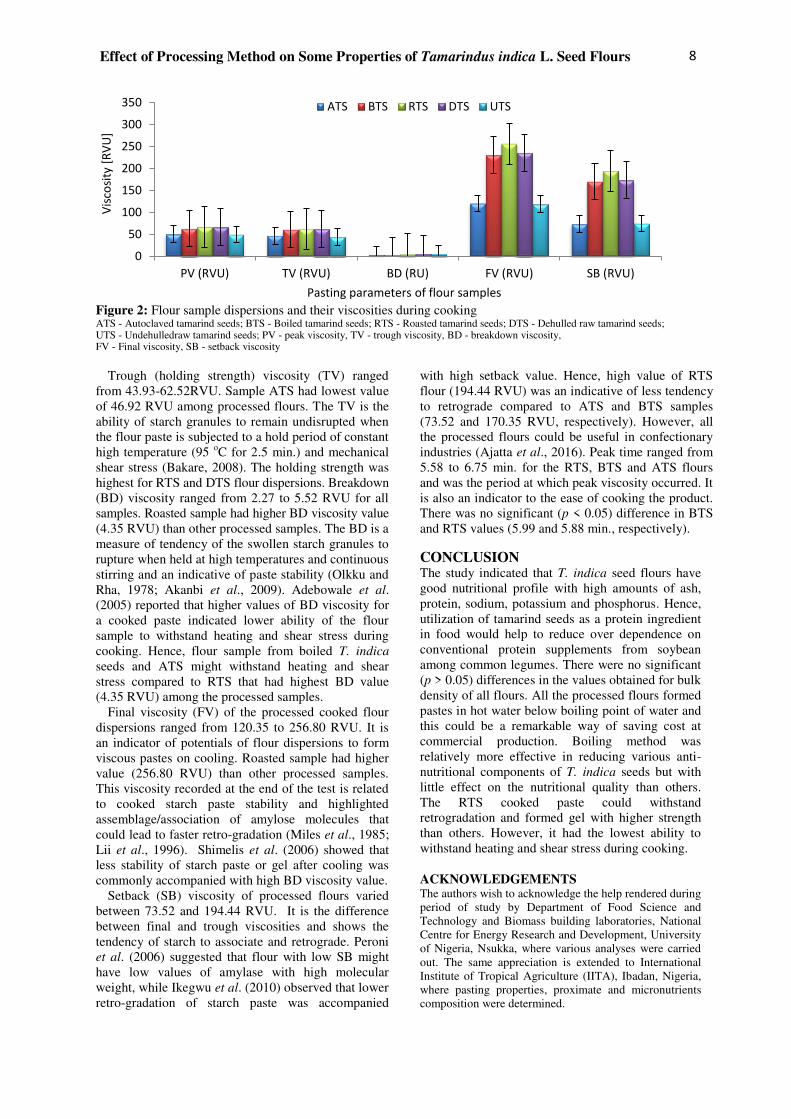
Figure 2: Flour sample dispersions and their viscosities during cooking ATS - Autoclaved tamarind seeds; BTS - Boiled tamarind seeds; RTS - Roasted tamarind seeds; DTS - Dehulled raw tamarind seeds; UTS - Undehulledraw tamarind seeds; PV - peak viscosity, TV - trough viscosity, BD - breakdown viscosity, FV - Final viscosity, SB - setback viscosity
Trough (holding strength) viscosity (TV) ranged
from 43.93-62.52RVU. Sample ATS had lowest value
of 46.92 RVU among processed flours. The TV is the
ability of starch granules to remain undisrupted when
the flour paste is subjected to a hold period of constant
high temperature (95 oC for 2.5 min.) and mechanical
shear stress (Bakare, 2008). The holding strength was
highest for RTS and DTS flour dispersions. Breakdown
(BD) viscosity ranged from 2.27 to 5.52 RVU for all
samples. Roasted sample had higher BD viscosity value
(4.35 RVU) than other processed samples. The BD is a
measure of tendency of the swollen starch granules to
rupture when held at high temperatures and continuous
stirring and an indicative of paste stability (Olkku and
Rha, 1978; Akanbi et al., 2009). Adebowale et al.
(2005) reported that higher values of BD viscosity for
a cooked paste indicated lower ability of the flour
sample to withstand heating and shear stress during
cooking. Hence, flour sample from boiled T. indica
seeds and ATS might withstand heating and shear
stress compared to RTS that had highest BD value
(4.35 RVU) among the processed samples.
Final viscosity (FV) of the processed cooked flour
dispersions ranged from 120.35 to 256.80 RVU. It is
an indicator of potentials of flour dispersions to form
viscous pastes on cooling. Roasted sample had higher
value (256.80 RVU) than other processed samples.
This viscosity recorded at the end of the test is related
to cooked starch paste stability and highlighted
assemblage/association of amylose molecules that
could lead to faster retro-gradation (Miles et al., 1985;
Lii et al., 1996). Shimelis et al. (2006) showed that
less stability of starch paste or gel after cooling was
commonly accompanied with high BD viscosity value.
Setback (SB) viscosity of processed flours varied
between 73.52 and 194.44 RVU. It is the difference
between final and trough viscosities and shows the
tendency of starch to associate and retrograde. Peroni
et al. (2006) suggested that flour with low SB might
have low values of amylase with high molecular
weight, while Ikegwu et al. (2010) observed that lower
retro-gradation of starch paste was accompanied
with high setback value. Hence, high value of RTS
flour (194.44 RVU) was an indicative of less tendency
to retrograde compared to ATS and BTS samples
(73.52 and 170.35 RVU, respectively). However, all
the processed flours could be useful in confectionary
industries (Ajatta et al., 2016). Peak time ranged from
5.58 to 6.75 min. for the RTS, BTS and ATS flours
and was the period at which peak viscosity occurred. It
is also an indicator to the ease of cooking the product.
There was no significant (p < 0.05) difference in BTS
and RTS values (5.99 and 5.88 min., respectively).
CONCLUSION The study indicated that T. indica seed flours have
good nutritional profile with high amounts of ash,
protein, sodium, potassium and phosphorus. Hence,
utilization of tamarind seeds as a protein ingredient
in food would help to reduce over dependence on
conventional protein supplements from soybean
among common legumes. There were no significant
(p > 0.05) differences in the values obtained for bulk
density of all flours. All the processed flours formed
pastes in hot water below boiling point of water and
this could be a remarkable way of saving cost at
commercial production. Boiling method was
relatively more effective in reducing various anti-
nutritional components of T. indica seeds but with
little effect on the nutritional quality than others.
The RTS cooked paste could withstand
retrogradation and formed gel with higher strength
than others. However, it had the lowest ability to
withstand heating and shear stress during cooking.
ACKNOWLEDGEMENTS The authors wish to acknowledge the help rendered during
period of study by Department of Food Science and
Technology and Biomass building laboratories, National
Centre for Energy Research and Development, University
of Nigeria, Nsukka, where various analyses were carried
out. The same appreciation is extended to International
Institute of Tropical Agriculture (IITA), Ibadan, Nigeria,
where pasting properties, proximate and micronutrients
composition were determined.
0
50
100
150
200
250
300
350
PV (RVU) TV (RVU) BD (RU) FV (RVU) SB (RVU)
Vis
cosi
ty [
RV
U]
Pasting parameters of flour samples
ATS BTS RTS DTS UTS
Effect of Processing Method on Some Properties of Tamarindus indica L. Seed Flours

9
REFERENCES Adebowale A.A., Sanni L.O. and Awonorin S.O. (2005).
Effect of texture modifiers on the physicochemical and
sensory properties of dried fufu. Food Science &
Technology International, 11 (5), 73-382
Adebowale A.A., Sanni L.O. and Onitilo M.O. (2008).
Chemical composition and pasting properties of tapioca
grits from different cassava varieties and roasting
methods. African Journal of Food Science, 2, 077-082
Adeola A.A. and Aworh O.C. (2012). A comparative
evaluation of the chemical properties of wild tamarind
(Tamarindus indica L.) fruits in Nigeria. Food, 6 (1),
49-57
Ajayi I.A., Oderinde R.A., Kajogbola D.O. and Uponi J.I.
(2006). Oil content and fatty acid composition of some
underutilized legumes from Nigeria. Food Chemistry,
99, 115-120
Ajjata M.A., Akinola S.A. and Osundahunsi O.F. (2016).
Proximate, functional and pasting properties of composite
flours made from wheat, breadfruit and cassava starch.
Applied Tropical Agriculture, 21 (3), 158-165
Akajiaku L.O., Nwosu J.N., Onuegbu N.C., Njoku N.E.
and Egbeneke C.O. (2014). Proximate, minerals and
anti-nutrient composition of processed tamarind seed
nut. Current Res. Nutrition & Food Sci., 2 (3), 136-145
Akanbi C.T., Nazamid S. and Adebowale A.A. (2009).
Functional and pasting properties of a tropical breadfruit
(Artocarpus altilis) starch from Ile Ife, Osun State,
Nigeria. Int. Food Research Journal, 16, 151-157
Aletor V.A. and Adeogun O.A. (1995). Nutrient and
antinutrient components of some tropical leafy
vegetables. Food Chemistry, 53, 375-379
Anonymous (2019). Dietary guidelines for Americans,
2005, USDA. http://health.gov/dietaryguideline/dcga2005/
document/html/chapter8.htm. Accessed on 01-08-2019
AOAC (2010). Official Method of Analysis. Association
of Official Analytical Chemists International, 18th
edition, Washington. D.C., USA
Aprianita A., Vasiljesic T., Banicova A. and Kasapis S.
(2014). Physicochemical properties of flours and starches
from traditional Indonesian tubers and roots. Journal of
Food Science & Technology, 51, 3669-3679
Aremu M.O., Olaofe O. and Akintayo T.E. (2006). A
Comparative study on the chemical and amino acid
composition of some Nigerian under-utilized legume
flours. Pakistan Journal of Nutrition, 5 (1), 34-38
Bakare H.A. (2008). Evaluation of Rheological Properties
and Baking Performance of Wheat Composite Flour
Produced From Lye-Peeled Breadfruit (Artocarpus
communis) and Cassava. Ph.D. Thesis, University of
Ibadan, Nigeria, pp. 170
Beuchat L.R. (1977). Functional and electrophoretic
characteristics of succinylated peanut flour proteins.
Journal of Agricultural Food Chemistry, 25, 258-26
Beuchat L.R., Cherry J.B. and Quinn M.R. (1975).
Physicochemical properties of peanut powder as
affected by proteolysis. Journal of Agricultural Food
Chemistry, 23, 616-620
Daramola B. and Osanyinlusi S.A. (2006). Production,
characterization and applications of banana (Musa spp.)
flour in whole maize. African Journal of Biotechnology,
5 (10), 992-995
El-Siddig K., Gunasen H.P.M., Prasa B.A., Pushpakumara
D.K.N., Ramana K.V.R., Vijayanand P. and Williams
J.T. (2006). Tamarind (Tamarindus indica L.) fruits for
the future1. Southampton Centre for Underutilized
Crops, Southampton, UK, 188
FAO (2004). Handbook on Human Nutrition Requirements:
FAO Food and Nutrition Vitamin and Mineral
Requirements: Second edition. www.fao.org Accessed
on 07-12-2019
Glew R.H., VanderJagt D.J., Lockett C., Gravette L.E.,
Smith G.C., Pastuszyn A. and Millson M. (1997).
Amino acid, fatty acid and mineral composition of 24
indigenous plants of BurkinaFaso. Journal of Food
Composition and Analysis, 10, 205-217
Higuchi T. and Hassan B. (1973). Pharmaceutical
Analysis. Litton educational Publication Incorporated,
New York, pp. 100-116
Ikegwu O.J., Okechukwu P.E and Ekumenkana E.O.
(2010). Physicochemical and pasting characteristics of
flour and starch from Achi (Brachystegia eurycoma)
seed. Journal of Food Technology, 8 (2), 58-66
Ishola M.M., Agabaji E.B. and Agbaji A.S. (1990). A
chemical study of Tamarindus indica (Tsamiya)fruits
grown in Nigeria. Journal of Science of Food and
Agriculture, 51, 141-143
Kanwar J.R., Sharma P.B. and Kanwar S.S. (1991).
Biochemical and nutritional characteristics of non-
conventional protein sources. Journal of the Food and
Agriculture, 55, 141-151
Karuna D., Noel G. and Dilip K. (1996). Food and nutrition
bulletin, Vol. 17 No. 2, United Nation University
Kim Y.S., Wiesnborg D.P., Orr. P.H. and Grant L.A.
(1995). Screening potato starch for novel properties
using different scanning calorimeter. Journal of Food
Science, 60, 1060-1065
Kulkarni K.D., Kulkarni D.N. and Ingle U.M. (1991).
Sorghum malt-based weaning formulations preparation,
functional properties and nutritive value. Food and
Nutrition Bulletin, 13 (4), 322-327
Lii C.Y., Tsai M. and Tseng K.H. (1996). Effect of
amylose content on rheological properties of rice starch.
Cereal Chemistry, 73, 415-420
Madubuike F.N., Ojimelukwe P.C. and Ajah P.O. (1994).
Proximate composition, energy content and physico-
chemical properties of Afzelia Africana and
Brachystegiaeurycoma seeds. Plant Foods for Human
Nutrition, 46, 339-344
Maher L.K. and Escott-Stump S. (2004). Krause’s Food
Nutrition and Dietary Therapy (11th ed.). Elsevier, USA
Maziya-Dixon B., Dixon A.G.O. and Adebowale A.A.
(2004). Targeting different end uses of cassava: genotypic
variations for cyanogenic potentials and pasting. A
paper presented on ISTRC-AB Symposium, 31 Oct-5
Nov., 2004, White sands Hotel Mombasa, Kenya
Miles M.J., Moris V.J., Orford P.D. and Ring S.G.
(1985). The roles of amylose and amylopectin in the
gelation and retrogradation of starch. Carbohydrate
Research, 135 (2), 271-281
Newport Scientific (1998). Application manual for rapid
visco-analyzer using thermocline for windows,
Newport Scientific Pty Ltd, Australia, pp. 2-26
Olkku T. and Rha C. (1978). Gelatinisation of starch and
wheat flour starch – a review. Food Chemistry, 3, 293-31
Onwurafor E.U., Umego E.C., Uzodinma E.O. and
Samuel E.D. (2017). Chemical, functional, pasting and
sensory properties of sorghum-maize-mungbean malt
complementary food. Pakistan Journal of Nutrition, 16,
826-834
Oluseyi E.O. and Temitayo O.U. (2015). Chemical and
functional properties of fermented, roasted and
germinated tamarind (Tamarindus indica) seed flours.
Journal of Nutrition and Food Science, 45 (1), 97-111
Uzodinma E.O., Osagiede E.G. and Chikwendu J.N.

10
Onimawo I.A., Momoh A.A. and Usman A. (1998).
Proximate composition and functional properties of
flour cultivars of Bambara groundnut (Voandzeia
subterranean). Plant Foods for Human Nutrition, 53,
153-158
Onwuka G. I., (2018). Food Analysis and Instrumentation
(Theory and practice). Second edition Naphthali
Prints, Lagos, Nigeria, pp. 343, 353-359, 373
Paul S.H., Usman A.A., Gana I.N., Manase A., Adeniyi
O.D. and Olutoye M.A. (2018). Comparative study of
mineral and nutritional composition of a
multifunctional flora composite formulated from seven
medicinal plants and their applications to human health.
Engineering Technology Journal, 1 (5), 001-0014
Peroni F.H.G., Roche T.S. and Franco C.M.L. (2006).
Some structural and physicochemical characteristics of
tuber and root starches. Food Science and Technology
International, 12, 505-510
Pearce K.N. and Kinsella J.E. (1978). Emulsifying properties
of proteins: evaluation of a turbidimetric technique.
Agricultural Food Chemistry, 26 (3), 716-723
Phillips R.D., Chinnan M.S, Branch A.L., Miller J. and
Mcwatters K.H. (1988).Effects of pre-treatment on
functional and nutritional properties of cowpea meal.
Journal of Food Science, 53, 805-809
Plaami S.P. (1997). Content of dietary fiber in foods and
its physiological effects. Food Review International, 13
(1), 29-76
Ramashia S.E., Gwata E.T., Medows-Taylor S., Anyasi
T.A. and Jideani A.I.O. (2017). Some physical and
functional properties of finger millet (Eleusine
coranana) obtained in Sub-Saharan Africa. Food
Research International, 104, 110-118
Sathe S. K., Desphande S.S. and Salunkhe D. K. (1982).
Functional properties of lupin seed (Lupinus mutabilis)
protein and protein concentrates. Journal of Food
Science, 47, 491-497
Sanni L.O., Ikuomola D.P. and Sanni S.A. (2001). Effect
of length of fermentation and varieties on the quality
of sweet potato gari. Proc. 8th Triennial Symposium of
the International Society for Tropical Root Crops
Africa Branch (ISTRC-AB), Ed. M.O. Akoroda,
IITA, Ibadan., Nigeria, 12-16th Nov., 2001, 208-211
Sanni L.O., Christiana A.B and Silifat A.S. (2004).
Production of instant cassava noodles. Journal of
Food Technology, 2, 83-89
Siddhuraju P., Vijayakumari K. and Janardhanan K.
(1995). Nutritional and anti-nutritional properties of the
under-exploited legumes (Cassia laevigata W. and
Tamarindus indica L.). Journal of Food Composition
and Analysis, 8, 351-362
Shimelis E., Meaza M. and Rakshit S. (2006). Physico-
chemical properties, pasting behaviour and functional
characteristics of flour and starches from improved
bean (Phaseolus vulgaris L.) varieties grown in East
Africa. Ejournal of Agricultural Engineering
International, 8, 1-18
Singh D., Wangchu L. and Moond S.K. (2007). Processed
products of tamarind. Nigerian Product Radiance, 6
(4), 315-321
Steel R.G.D. and Torrie J.H. (1980). Principles and
Procedures of Statistics (2nd ed.) McGraw-Hill, New
York
SON (2007). Nigerian industrial standards for pastes.
Standard Organization of Nigeria. ICS (International
Classifications Standard) 664, 68, pp. 1-8
Subago A. (2006). Characteristics of hyacinth bean
(Labtab purpireus L.) sweet seeds from Indonesia and
their proteins. Food Chemistry, 95 (1), 65-70
Shittu T.A., Lasekan O.O., Sanni L.O. and Oledosu M.O.
(2001). The effect of drying methods on the functional
and sensory characteristics of purpura fermented
cassava product. ASSET, 1 (2), 9-16
Ukom A.N., Richard C.P. and Abasiekong S.K. (2017).
Effect of processing on the proximate, functional and
anti-nutritional properties of cocoyam (Xanthosoma
mafa S.) flour. Nigerian Food Journal, 35 (2), 9-17
Uzogara S.G., Agu L.N. and Uzogara E.O. (1990). A
review of traditional fermented foods, condiments and
beverages in Nigeria: their benefits and possible
problems. Ecology of Food Nutrition, 24 (4), 267-288
Effect of Processing Method on Some Properties of Tamarindus indica L. Seed Flours


