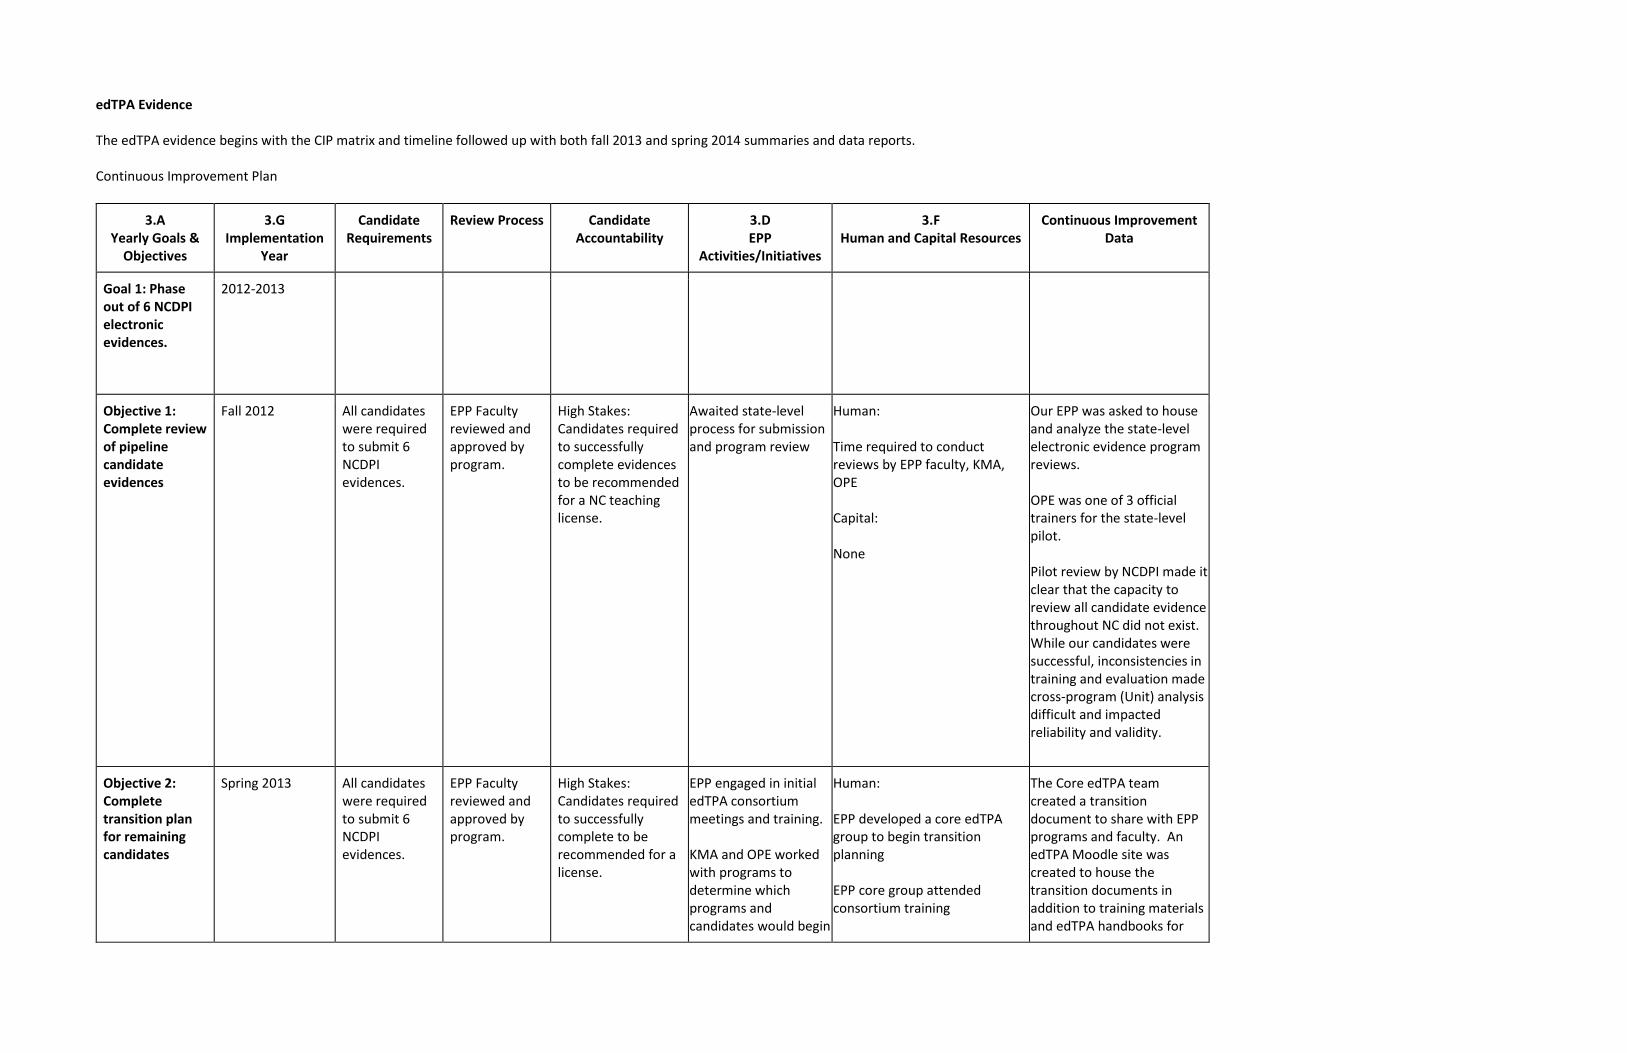
edTPA Evidence The edTPA evidence begins with the CIP matrix and timeline followed up with both fall 2013 and spring 2014 summaries and data reports. Continuous Improvement Plan
3.A Yearly Goals &
Objectives
3.G Implementation
Year
Candidate Requirements
Review Process Candidate Accountability
3.D EPP
Activities/Initiatives
3.F Human and Capital Resources
Continuous Improvement Data
Goal 1: Phase out of 6 NCDPI electronic evidences.
2012-2013
Objective 1: Complete review of pipeline candidate evidences
Fall 2012 All candidates were required to submit 6 NCDPI evidences.
EPP Faculty reviewed and approved by program.
High Stakes: Candidates required to successfully complete evidences to be recommended for a NC teaching license.
Awaited state-level process for submission and program review
Human: Time required to conduct reviews by EPP faculty, KMA, OPE Capital: None
Our EPP was asked to house and analyze the state-level electronic evidence program reviews. OPE was one of 3 official trainers for the state-level pilot. Pilot review by NCDPI made it clear that the capacity to review all candidate evidence throughout NC did not exist. While our candidates were successful, inconsistencies in training and evaluation made cross-program (Unit) analysis difficult and impacted reliability and validity.
Objective 2: Complete transition plan for remaining candidates
Spring 2013 All candidates were required to submit 6 NCDPI evidences.
EPP Faculty reviewed and approved by program.
High Stakes: Candidates required to successfully complete to be recommended for a license.
EPP engaged in initial edTPA consortium meetings and training. KMA and OPE worked with programs to determine which programs and candidates would begin
Human: EPP developed a core edTPA group to begin transition planning EPP core group attended consortium training
The Core edTPA team created a transition document to share with EPP programs and faculty. An edTPA Moodle site was created to house the transition documents in addition to training materials and edTPA handbooks for
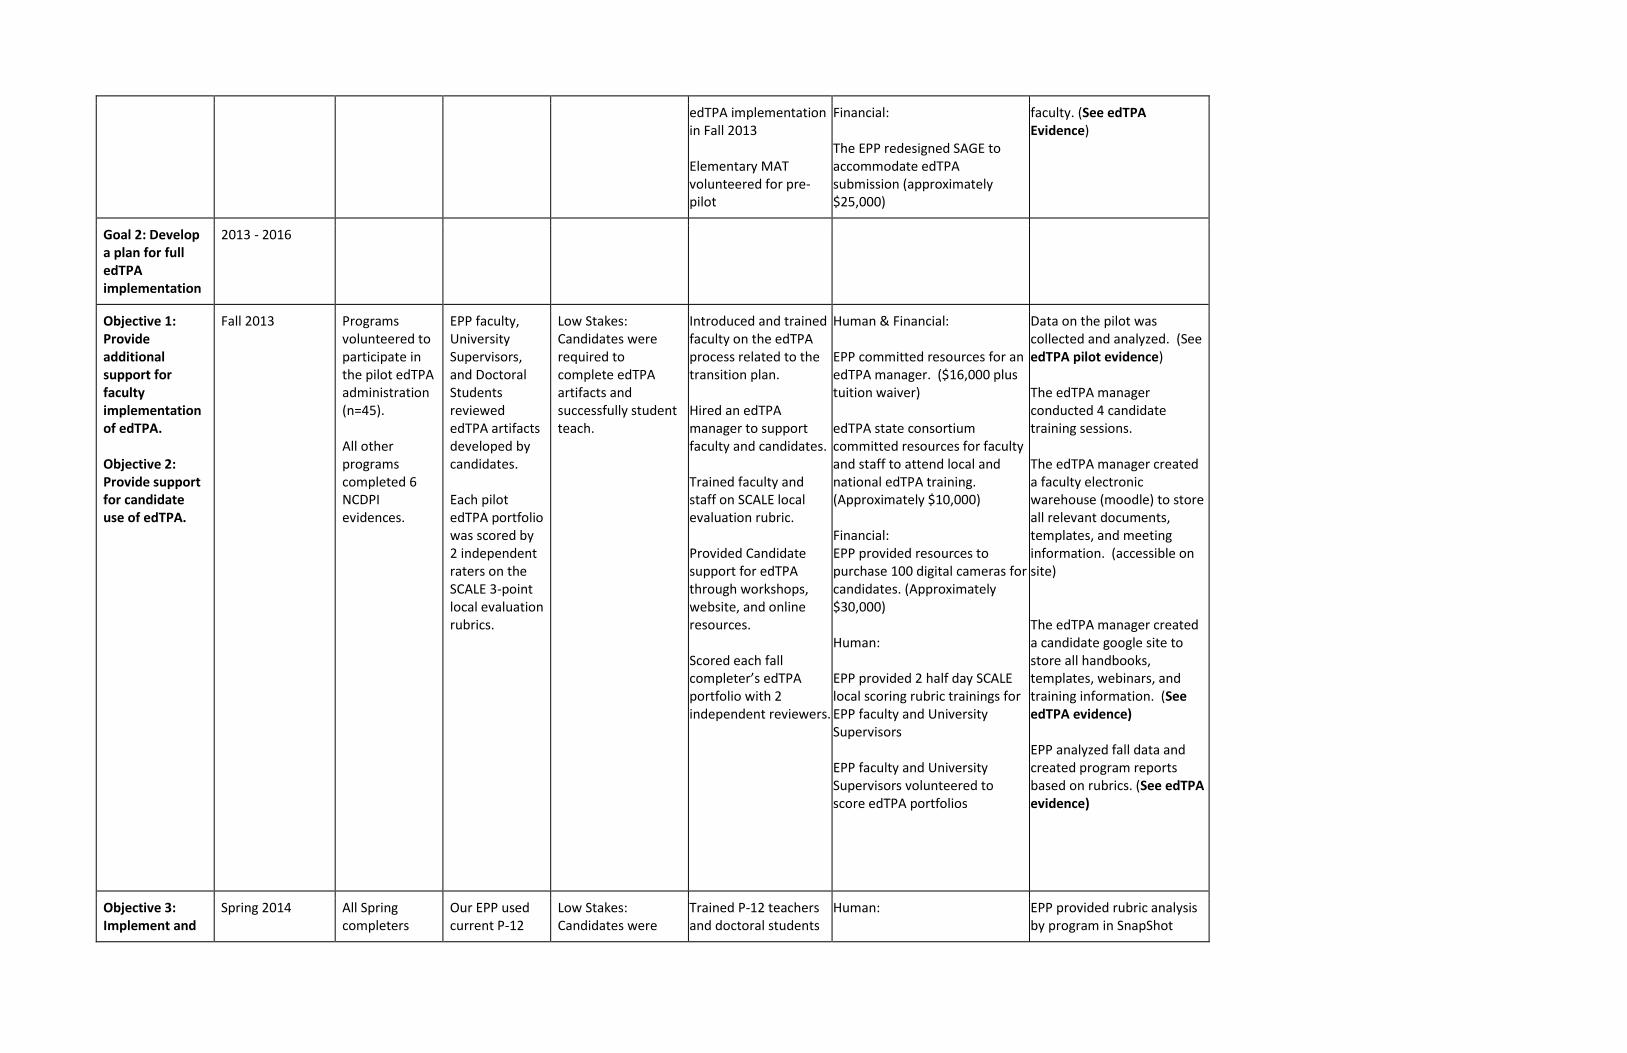
edTPA implementation in Fall 2013 Elementary MAT volunteered for pre-pilot
Financial: The EPP redesigned SAGE to accommodate edTPA submission (approximately $25,000)
faculty. (See edTPA Evidence)
Goal 2: Develop a plan for full edTPA implementation
2013 - 2016
Objective 1: Provide additional support for faculty implementation of edTPA. Objective 2: Provide support for candidate use of edTPA.
Fall 2013 Programs volunteered to participate in the pilot edTPA administration (n=45). All other programs completed 6 NCDPI evidences.
EPP faculty, University Supervisors, and Doctoral Students reviewed edTPA artifacts developed by candidates. Each pilot edTPA portfolio was scored by 2 independent raters on the SCALE 3-point local evaluation rubrics.
Low Stakes: Candidates were required to complete edTPA artifacts and successfully student teach.
Introduced and trained faculty on the edTPA process related to the transition plan. Hired an edTPA manager to support faculty and candidates. Trained faculty and staff on SCALE local evaluation rubric. Provided Candidate support for edTPA through workshops, website, and online resources.
Scored each fall completer’s edTPA portfolio with 2 independent reviewers.
Human & Financial: EPP committed resources for an edTPA manager. ($16,000 plus tuition waiver) edTPA state consortium committed resources for faculty and staff to attend local and national edTPA training. (Approximately $10,000) Financial: EPP provided resources to purchase 100 digital cameras for candidates. (Approximately $30,000) Human: EPP provided 2 half day SCALE local scoring rubric trainings for EPP faculty and University Supervisors EPP faculty and University Supervisors volunteered to score edTPA portfolios
Data on the pilot was collected and analyzed. (See edTPA pilot evidence) The edTPA manager conducted 4 candidate training sessions. The edTPA manager created a faculty electronic warehouse (moodle) to store all relevant documents, templates, and meeting information. (accessible on site) The edTPA manager created a candidate google site to store all handbooks, templates, webinars, and training information. (See edTPA evidence) EPP analyzed fall data and created program reports based on rubrics. (See edTPA evidence)
Objective 3: Implement and
Spring 2014 All Spring completers
Our EPP used current P-12
Low Stakes: Candidates were
Trained P-12 teachers and doctoral students
Human:
EPP provided rubric analysis by program in SnapShot

Evaluate edTPA artifacts across all programs.
required to complete edTPA artifacts. (n=220)
teachers and doctoral students with teaching experience for edTPA pilot portfolio review. Each pilot portfolio was scored on the SCALE 3-point local evaluation rubrics.
required to complete edTPA and successfully student teach.
on SCALE local evaluation rubric. Provided Candidate support for edTPA through workshops, edTPA Google site, and online resources.
Scored each Spring completer’s edTPA portfolio.
EPP provided 1 half day SCALE local scoring rubric training for P-12 teachers, doctoral students, and University Supervisors Human & Financial: EPP provided resources to pay P-12 teachers and doctoral students to score spring edTPA portfolios ($25K)
Objective 4: Transition from local scored (3 point) to Pearson scored (5 point) edTPA portfolios.
Fall 2014 All completers will submit edTPA portfolios to Pearson for scoring.
All completer edTPA portfolios will be scored by Pearson.
Moderate Stakes: Candidates are required to complete, higher threshold for quality; Resubmission is required for candidates not meeting program specified criteria.
Provide Candidate support for edTPA through workshops, website, and online resources.
Financial: EPP will provide funding for the Pearson Scoring (Approximately $12k)
EPP will provide results from Pearson to programs through the SnapShot
Objective 5: Conduct review of 2014-15 data to determine EPP cut score.
Spring 2015 All completers will submit edTPA portfolios to Pearson for scoring.
All completer edTPA portfolios will be scored by Pearson. EPP will conduct an analysis of completer scores along with national data to determine an appropriate cut score.
Moderate Stakes: Candidates are required to complete, higher threshold for quality; Resubmission is required for candidates not meeting program specified criteria.
Provide Candidate support for edTPA through workshops, website, and online resources.
Financial: EPP will provide funding for the Pearson Scoring ($60k) Human: KMA and OPE will work with programs to create cut score policy KMA and OPE will work with programs to determine candidate remediation procedures
EPP will provide results from Pearson to programs through the SnapShot
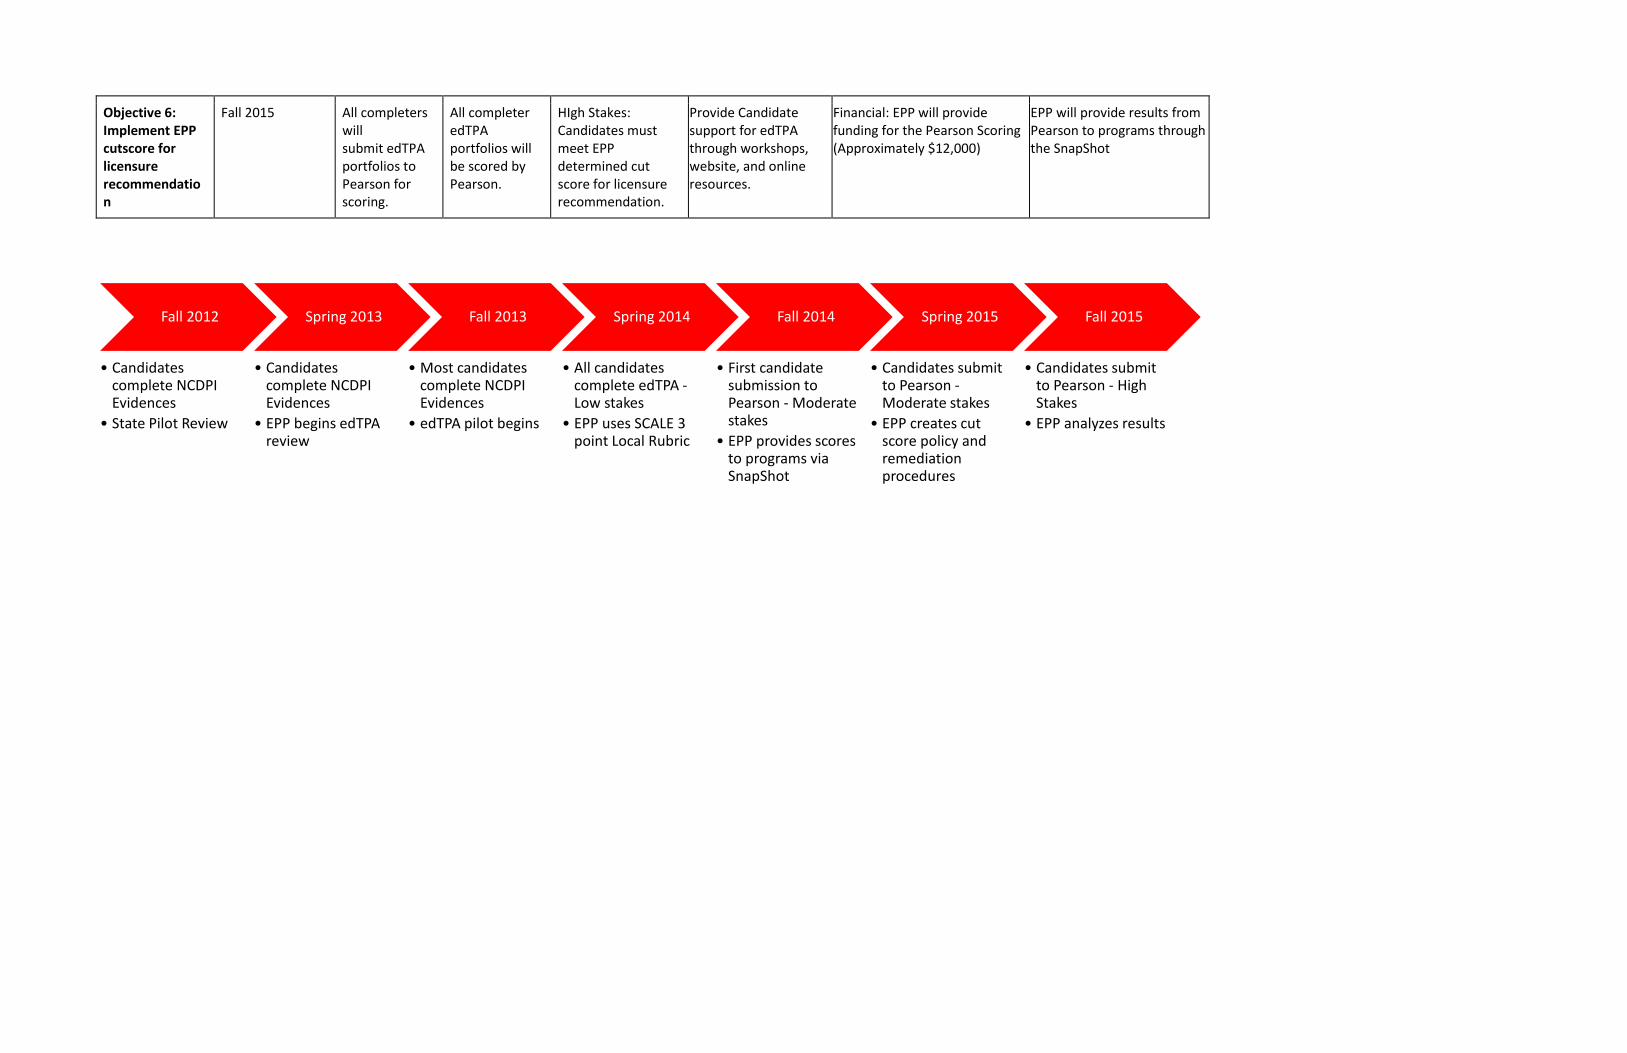
Objective 6: Implement EPP cutscore for licensure recommendation
Fall 2015 All completers will submit edTPA portfolios to Pearson for scoring.
All completer edTPA portfolios will be scored by Pearson.
HIgh Stakes: Candidates must meet EPP determined cut score for licensure recommendation.
Provide Candidate support for edTPA through workshops, website, and online resources.
Financial: EPP will provide funding for the Pearson Scoring (Approximately $12,000)
EPP will provide results from Pearson to programs through the SnapShot
Fall 2012
• Candidates complete NCDPI Evidences
• State Pilot Review
Spring 2013
• Candidates complete NCDPI Evidences
• EPP begins edTPA review
Fall 2013
• Most candidates complete NCDPI Evidences
• edTPA pilot begins
Spring 2014
• All candidates complete edTPA -Low stakes
• EPP uses SCALE 3 point Local Rubric
Fall 2014
• First candidate submission to Pearson - Moderate stakes
• EPP provides scores to programs via SnapShot
Spring 2015
• Candidates submit to Pearson -Moderate stakes
• EPP creates cut score policy and remediation procedures
Fall 2015
• Candidates submit to Pearson - High Stakes
• EPP analyzes results
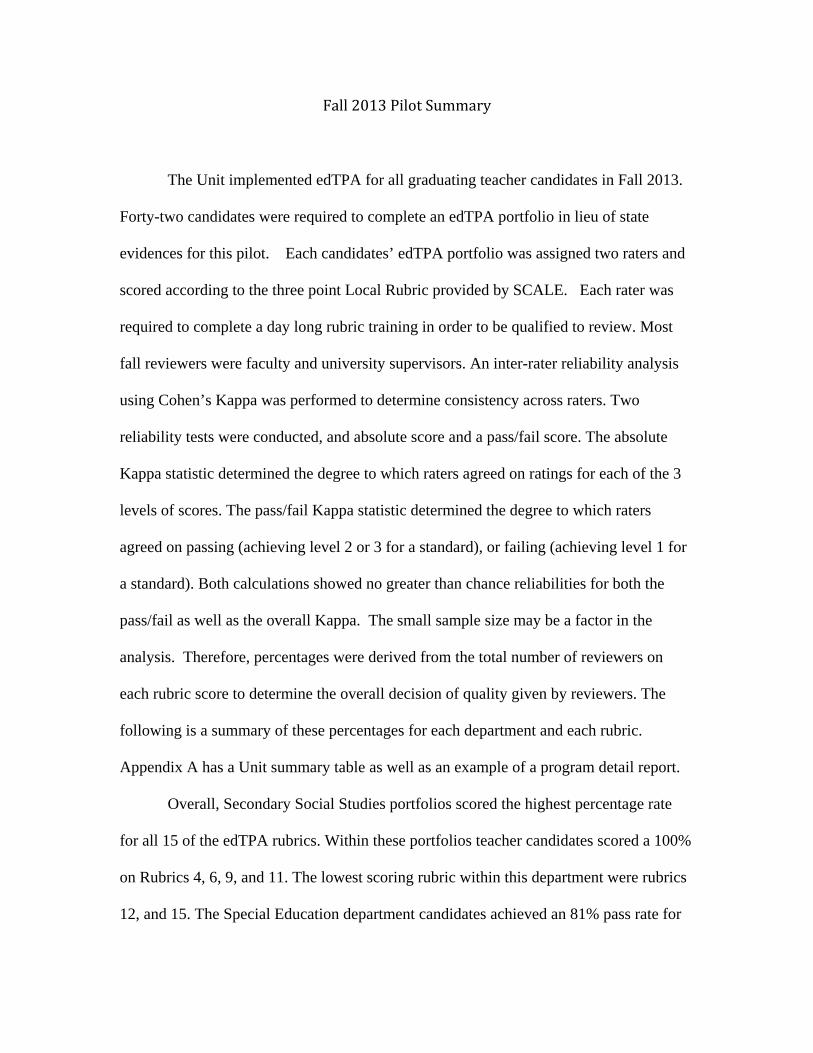
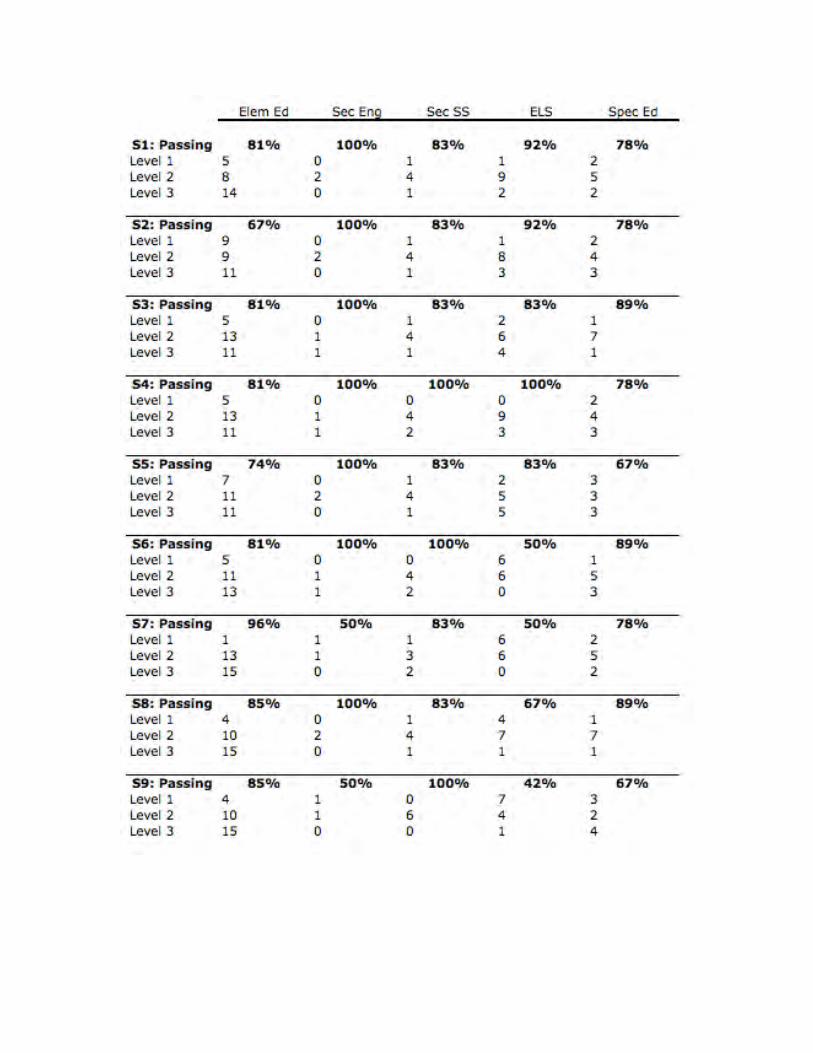
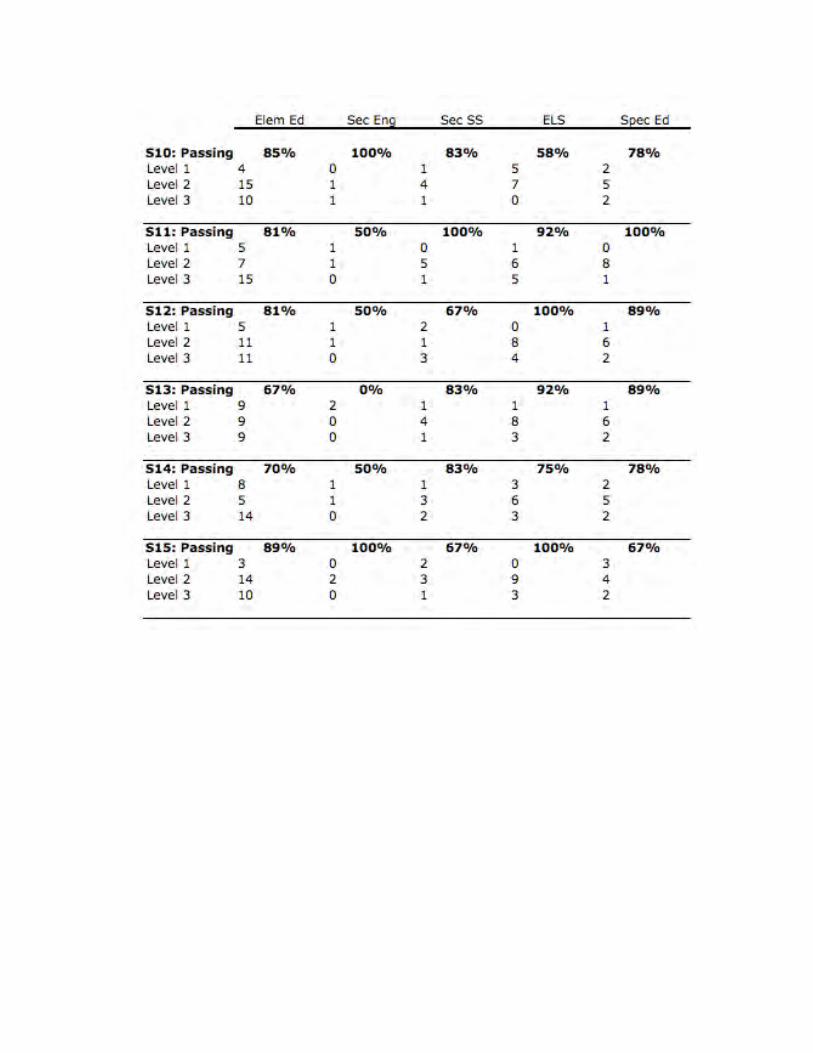
Fall2013PilotSummary
The Unit implemented edTPA for all graduating teacher candidates in Fall 2013.
Forty-two candidates were required to complete an edTPA portfolio in lieu of state
evidences for this pilot. Each candidates’ edTPA portfolio was assigned two raters and
scored according to the three point Local Rubric provided by SCALE. Each rater was
required to complete a day long rubric training in order to be qualified to review. Most
fall reviewers were faculty and university supervisors. An inter-rater reliability analysis
using Cohen’s Kappa was performed to determine consistency across raters. Two
reliability tests were conducted, and absolute score and a pass/fail score. The absolute
Kappa statistic determined the degree to which raters agreed on ratings for each of the 3
levels of scores. The pass/fail Kappa statistic determined the degree to which raters
agreed on passing (achieving level 2 or 3 for a standard), or failing (achieving level 1 for
a standard). Both calculations showed no greater than chance reliabilities for both the
pass/fail as well as the overall Kappa. The small sample size may be a factor in the
analysis. Therefore, percentages were derived from the total number of reviewers on
each rubric score to determine the overall decision of quality given by reviewers. The
following is a summary of these percentages for each department and each rubric.
Appendix A has a Unit summary table as well as an example of a program detail report.
Overall, Secondary Social Studies portfolios scored the highest percentage rate
for all 15 of the edTPA rubrics. Within these portfolios teacher candidates scored a 100%
on Rubrics 4, 6, 9, and 11. The lowest scoring rubric within this department were rubrics
12, and 15. The Special Education department candidates achieved an 81% pass rate for

all rubrics combined. Candidates achieved a 100% on rubric 11. Achievement was lowest
in the Special Education department for rubrics 9, and 15. Elementary Education
candidates achieved an 80% for their edTPA portfolios as a whole. Achievement for
rubric 7 was the highest at 96% with rubrics 2 and 13 having the lowest achievement of
67%. English as an Additional Language department achieved a 78% on their edTPA
portfolios as a whole. Rubrics 4, and 15 constituted the highest achievement at 100%.
English as an Additional Language portfolios showed achievement difficulties in rubrics
6 (50%), 7 (50%), 8 (67%), 9 (42%), and 10 (58%). Many of these rubrics scored video
excerpts that were unavailable, incorrectly uploaded, or unrelated to the rubric prompt for
this department. Finally, the Secondary English department portfolio (2 raters for 1
portfolio), showed an achievement of 77% across all rubrics. A 100% achievement rating
was given for rubrics 1, 2, 3, 4, 5, 6, 8, 10, and 15.
Each rubric was given an overall percentage to determine the highest achievement
areas and the lowest achievement areas as a college. According to raters, Rubric 4 was
achieved by the most portfolios (92%). Rubrics 1, and 3 showed achievement of 87%.
Raters determined that the portfolios were weakest on achieving the goals of rubrics 7
(71%), 9 (69%), 13 (66%), and 14 (71%).
Each program was provided with a detailed summary of their rubric scores.
Included in the report were percent at each level of each rubric as well as what specific
“look for” items were included or omitted from the portfolio. The Unit compiled and
included this information in the program reports to aid programs in program
improvement.

Overall, the Unit saw three areas where support is needed. First, candidates
struggled with some of the technology requirements. Several video clips were not able to
be viewed, had corrupt links, or were of poor quality. The Unit is providing addition
technology training in digital media, compressing video files, and camera use. In
addition, an assignment was added to the ED 312 (assessment course) for students to
practice recording and uploading small segments of instruction. The Unit has purchased
120 small video camera for check out in METRC. Candidates can check out equipment
free of charge. Second, area of support is use of academic language. Rubric data
revealed candidates struggle with academic language portions of the rubric. The Unit has
added more discussion and practice with academic language in the ED 204 course. This
course is required of all candidates. The spring 2014 sections of ED 204 included the
additional support so we should see an improvement in this area for the 2016 cohort. The
third area of improvement focuses around timing issues and logistics. The Unit provided
a timeline for programs to have students complete and submit edTPA documents. The
2013-2014 academic year was a low stakes year for candidates. Candidates were
required to submit edTPA portfolios but results were not used for graduation or licensure
purposes. Scoring for 2013-2014 was done using the local scoring rubric and candidates
were not provided rubric scores. Moving forward, academic year 2014-15, all edTPA
portfolios will be submitted to Pearson for full scoring. Although this academic year is
still low stakes, candidates must submit documents earlier than previous years. The Unit
is working with a subgroup of program coordinators to draft a semester timeline for
candidates and programs so all materials are submitted before the unit deadline. Program
requested more help with timeline creation and implementation. The edTPA timeline

actually is impacted by the student teaching year-long placement process so both
timelines are being done simultaneously to ensure a smooth transition.
The following table is the Program Summary by Rubric for the Fall 2013 administration.
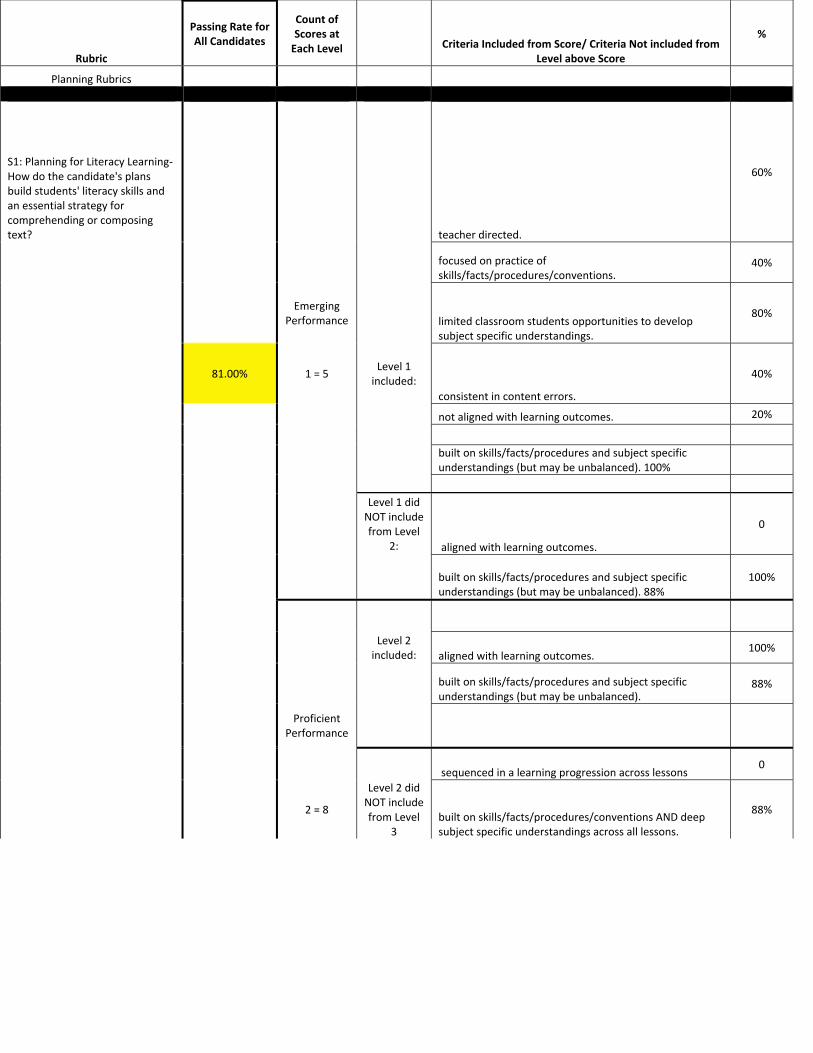
Rubric
Passing Rate for All Candidates
Count of Scores at Each Level
Criteria Included from Score/ Criteria Not included from
Level above Score
%
Planning Rubrics
S1: Planning for Literacy Learning‐ How do the candidate's plans build students' literacy skills and an essential strategy for comprehending or composing text?
teacher directed.
60%
focused on practice of
skills/facts/procedures/conventions. 40%
Emerging
Performance
limited classroom students opportunities to develop subject specific understandings.
80%
81.00% 1 = 5 Level 1 included:
consistent in content errors.
40%
not aligned with learning outcomes. 20%
built on skills/facts/procedures and subject specific understandings (but may be unbalanced). 100%
Level 1 did NOT include from Level
2: aligned with learning outcomes.
0
built on skills/facts/procedures and subject specific understandings (but may be unbalanced). 88%
100%
Level 2 included: aligned with learning outcomes.
100%
built on skills/facts/procedures and subject specific
understandings (but may be unbalanced). 88%
Proficient Performance
sequenced in a learning progression across lessons 0
2 = 8
Level 2 did NOT include from Level
3 built on skills/facts/procedures/conventions AND deep subject specific understandings across all lessons.
88%
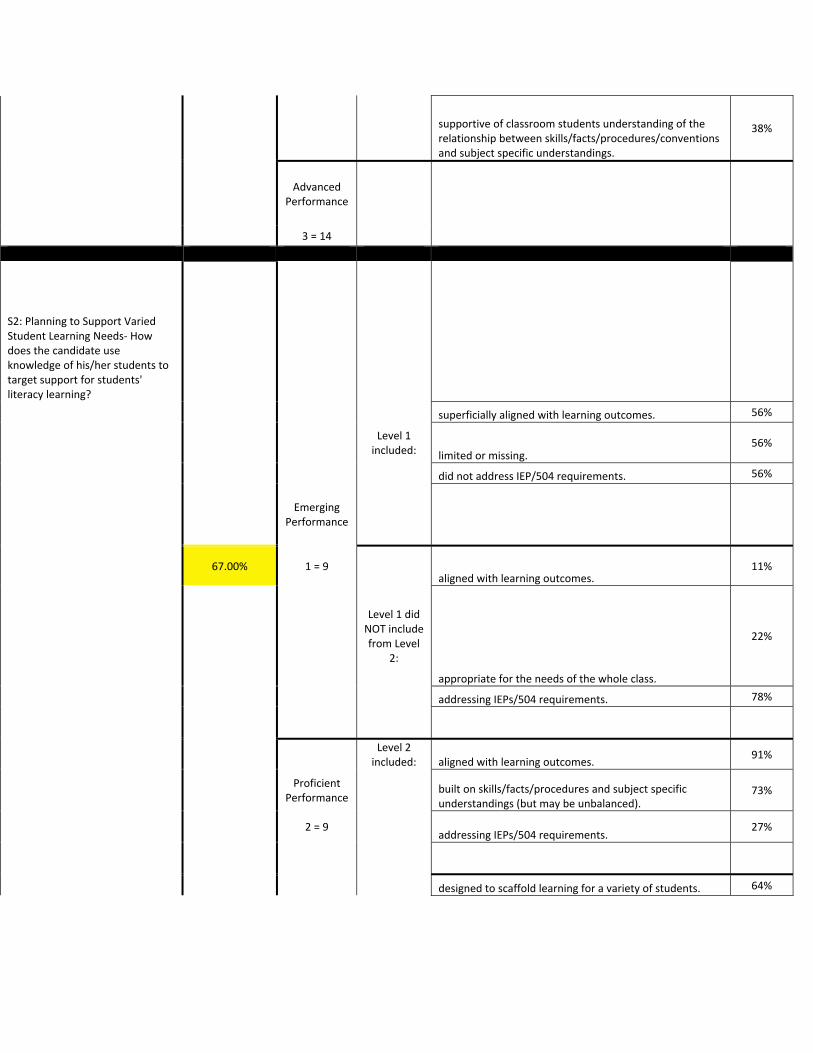
supportive of classroom students understanding of the relationship between skills/facts/procedures/conventions and subject specific understandings.
38%
Advanced
Performance
3 = 14
S2: Planning to Support Varied Student Learning Needs‐ How does the candidate use knowledge of his/her students to target support for students' literacy learning?
superficially aligned with learning outcomes. 56%
Level 1 included: limited or missing.
56%
did not address IEP/504 requirements. 56%
Emerging
Performance
67.00% 1 = 9
aligned with learning outcomes. 11%
Level 1 did NOT include from Level
2:
appropriate for the needs of the whole class.
22%
addressing IEPs/504 requirements. 78%
Level 2 included: aligned with learning outcomes.
91%
Proficient Performance
built on skills/facts/procedures and subject specific understandings (but may be unbalanced).
73%
2 = 9
addressing IEPs/504 requirements. 27%
designed to scaffold learning for a variety of students. 64%
Level 2 did NOT include from Level
3 identifying and responsive to potential misconceptions or partial understandings.
36%
Advanced
Performance
3 = 11
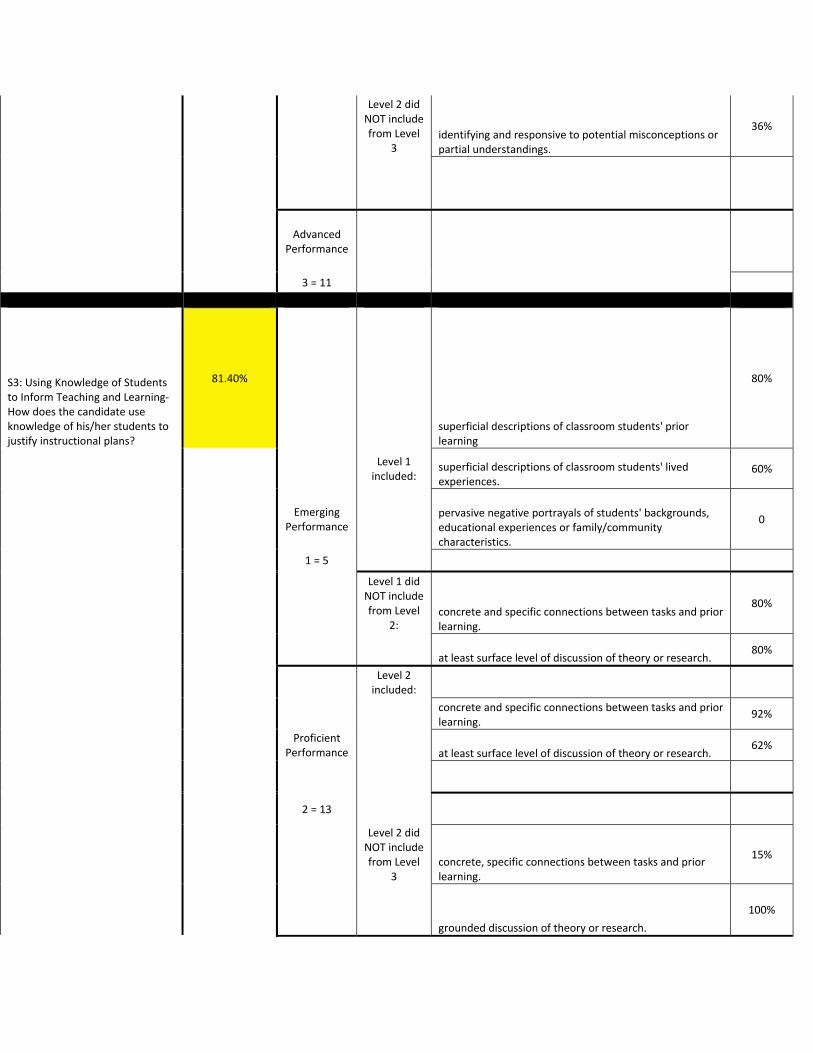
S3: Using Knowledge of Students to Inform Teaching and Learning‐ How does the candidate use knowledge of his/her students to justify instructional plans?
81.40%
superficial descriptions of classroom students' prior learning
80%
Level 1 included:
superficial descriptions of classroom students' lived experiences.
60%
Emerging
Performance
pervasive negative portrayals of students' backgrounds, educational experiences or family/community characteristics.
0
1 = 5
Level 1 did NOT include from Level
2: concrete and specific connections between tasks and prior learning.
80%
at least surface level of discussion of theory or research. 80%
Level 2 included:
concrete and specific connections between tasks and prior learning.
92%
Proficient Performance
at least surface level of discussion of theory or research.
62%
2 = 13
Level 2 did NOT include from Level
3 concrete, specific connections between tasks and prior learning.
15%
grounded discussion of theory or research.
100%

Advanced
Performance
3 = 11
S4: Identifying and Supporting Language Demands‐ How does the candidate identify and support language demands associated with a key literacy learning task?
81.40%
vocabulary that was only demand identified. 20%
a mismatch between language demands and language
function. 0%
Emerging Performance
Level 1 included:
a mismatch between language demands and language supports. 0%
1 = 5 a mismatch between language demands and the learning
tasks. 0%
supports that were not included or focused on vocabulary. 80%
Level 1 did NOT include from Level
2: language demands including function vocabulary AND discourse/syntax.
60%
supports that generally addressed vocabulary and one
other identified demand (function, discourse or syntax). 100%
Level 2 included:
language demands including function vocabulary AND discourse/syntax. 71%
Proficient
Performance
supports that generally addressed vocabulary and one other identified demand (function, discourse or syntax). 86%
2 = 13
Level 2 did NOT include from Level
3
supports that were strategically designed to address all language demands for students with varying characteristics and language needs.
100%
Advanced
Performance
3 = 11
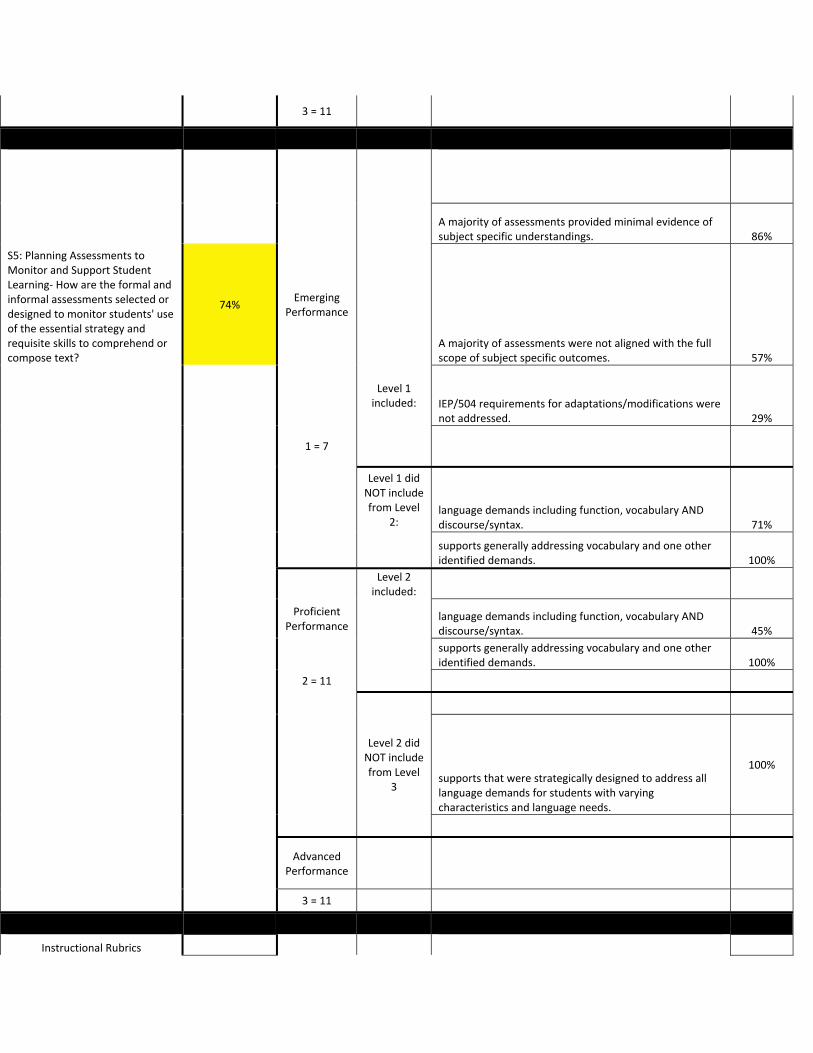
A majority of assessments provided minimal evidence of
subject specific understandings. 86%
S5: Planning Assessments to Monitor and Support Student Learning‐ How are the formal and informal assessments selected or designed to monitor students' use of the essential strategy and requisite skills to comprehend or compose text?
74% Emerging
Performance
A majority of assessments were not aligned with the full scope of subject specific outcomes. 57%
Level 1 included: IEP/504 requirements for adaptations/modifications were
not addressed. 29%
1 = 7
Level 1 did NOT include from Level
2: language demands including function, vocabulary AND discourse/syntax. 71%
supports generally addressing vocabulary and one other
identified demands. 100%
Level 2 included:
Proficient Performance
language demands including function, vocabulary AND discourse/syntax. 45%
supports generally addressing vocabulary and one other identified demands. 100%
2 = 11
Level 2 did NOT include from Level
3 supports that were strategically designed to address all language demands for students with varying characteristics and language needs.
100%
Advanced
Performance
3 = 11
Instructional Rubrics
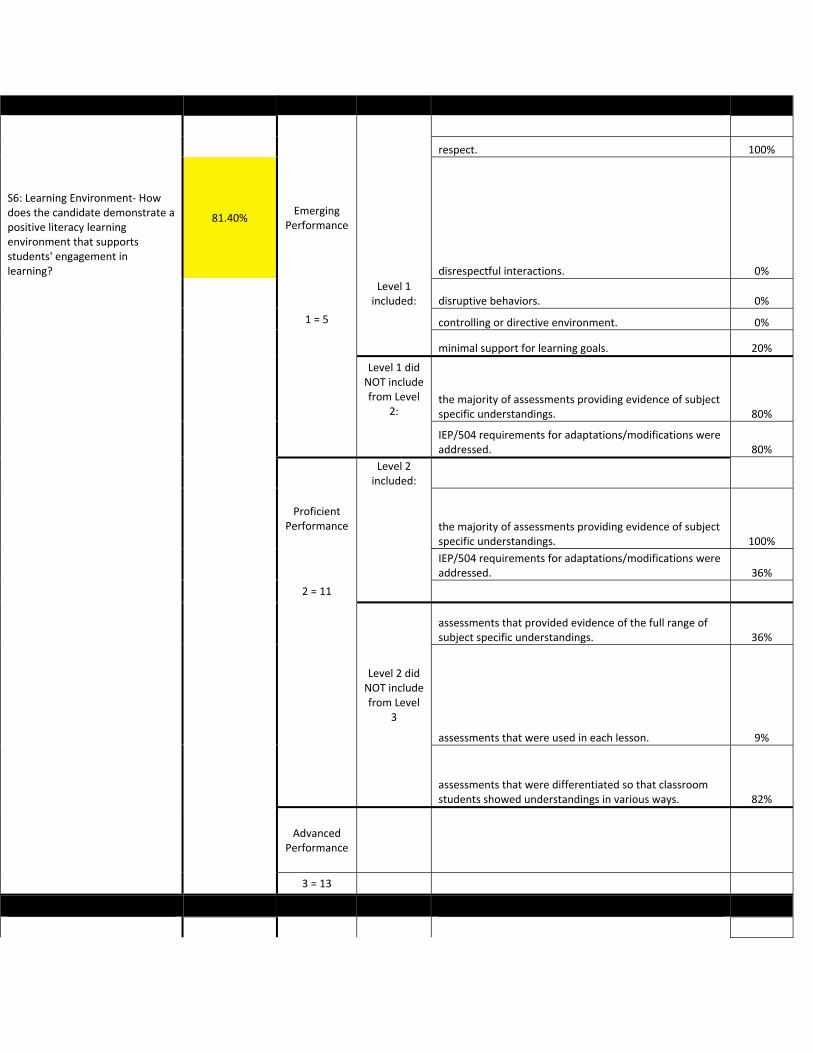
respect. 100%
S6: Learning Environment‐ How does the candidate demonstrate a positive literacy learning environment that supports students' engagement in learning?
81.40% Emerging
Performance
disrespectful interactions. 0%
Level 1 included: disruptive behaviors. 0%
1 = 5 controlling or directive environment. 0%
minimal support for learning goals. 20%
Level 1 did NOT include from Level
2: the majority of assessments providing evidence of subject specific understandings. 80%
IEP/504 requirements for adaptations/modifications were
addressed. 80%
Level 2 included:
Proficient
Performance
the majority of assessments providing evidence of subject specific understandings. 100%
IEP/504 requirements for adaptations/modifications were addressed. 36%
2 = 11
assessments that provided evidence of the full range of
subject specific understandings. 36%
Level 2 did NOT include from Level
3
assessments that were used in each lesson. 9%
assessments that were differentiated so that classroom students showed understandings in various ways. 82%
Advanced
Performance
3 = 13

loose connections between tasks and the central focus. 0%
tasks that focused on low‐level content. 100%
S7: Engaging Students in Learning‐ How does the candidate actively engage students in integrating strategies and skills to comprehend or compose text?
96.20% Emerging
Performance Level 1 included:
links to prior learning or lived experiences were limited. 0%
1 = 1
classroom students were confused by links to content. 0%
rapport. 100%
Level 1 did NOT include from Level
2:
mutual respect. 0%
low risk. 0%
Level 2 included: rapport. 92%
Proficient
Performance
mutual respect. 92%
low risk. 100%
2 = 13
challenge. 69%
Level 2 did NOT include from Level
3
perspective. 69%
Advanced Performance
3 = 15
surface level questions. 100%
candidate talk. 25%
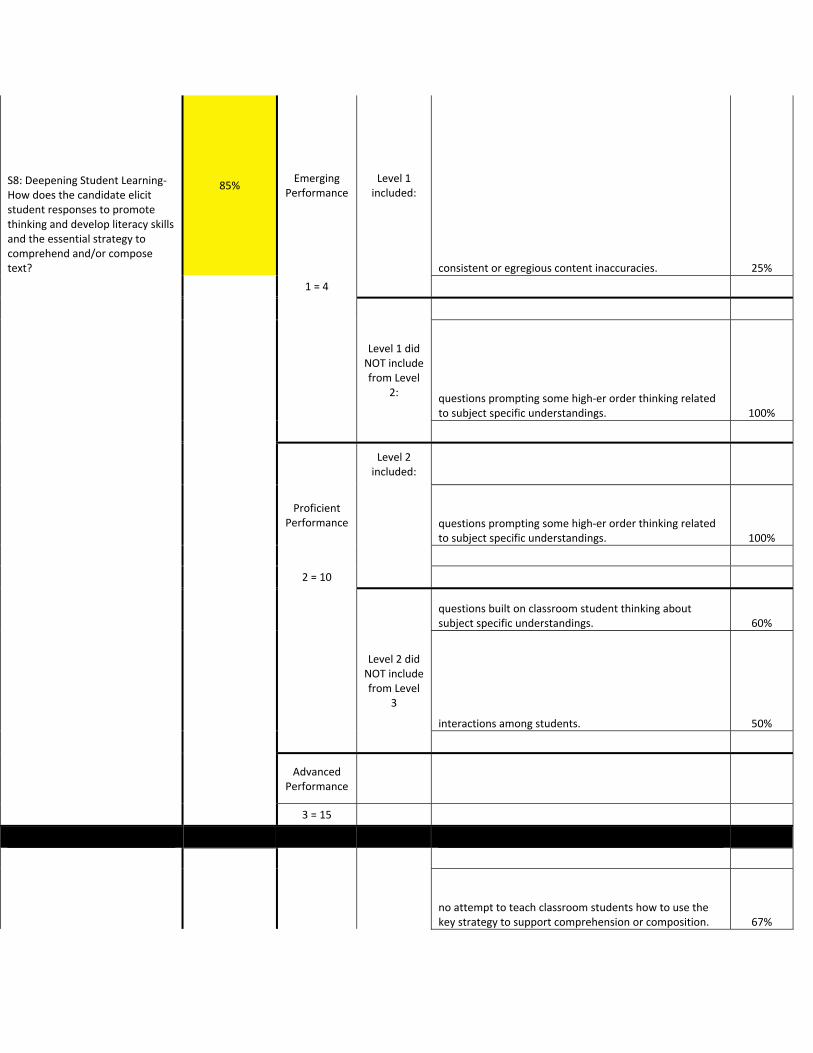
S8: Deepening Student Learning‐ How does the candidate elicit student responses to promote thinking and develop literacy skills and the essential strategy to comprehend and/or compose text?
85% Emerging
Performance Level 1 included:
consistent or egregious content inaccuracies. 25%
1 = 4
Level 1 did NOT include from Level
2: questions prompting some high‐er order thinking related to subject specific understandings. 100%
Level 2 included:
Proficient
Performance
questions prompting some high‐er order thinking related to subject specific understandings. 100%
2 = 10
questions built on classroom student thinking about
subject specific understandings. 60%
Level 2 did NOT include from Level
3
interactions among students. 50%
Advanced
Performance
3 = 15
no attempt to teach classroom students how to use the key strategy to support comprehension or composition. 67%
a clear mismatch between or among strategies, skills, and students' readiness to learn. 33%
significant content inaccuracies within the material that would lead to student misunderstandings. 0%
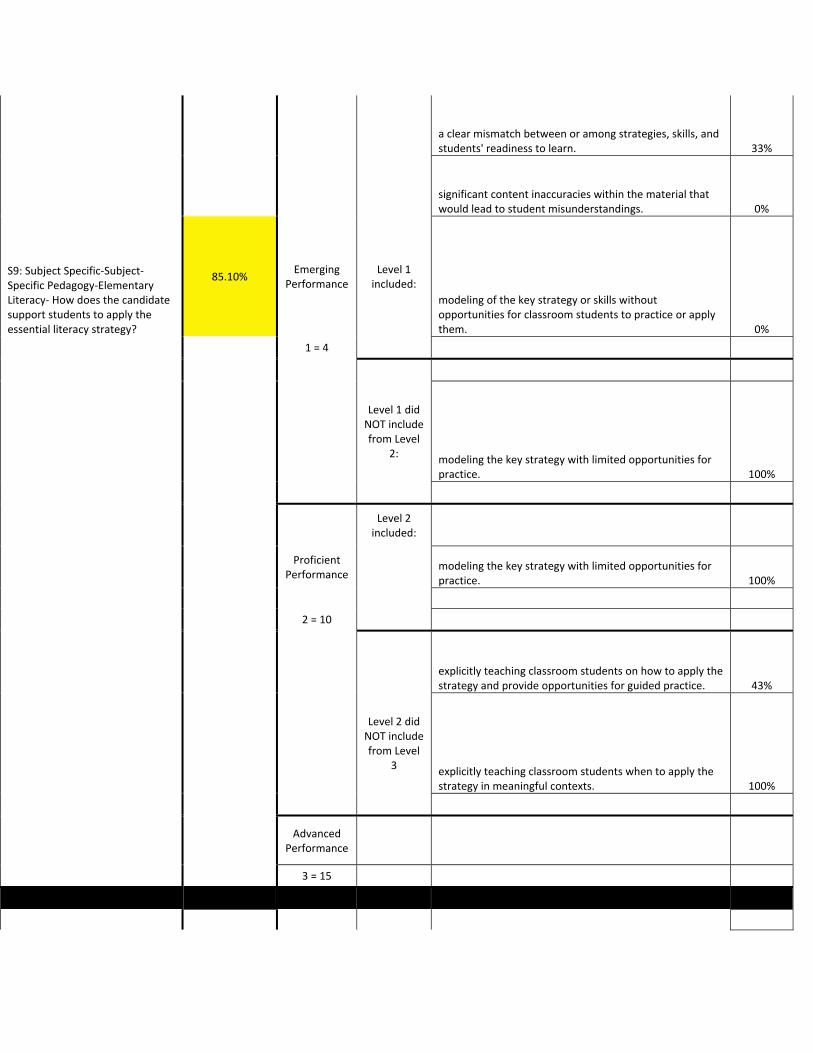
S9: Subject Specific‐Subject‐Specific Pedagogy‐Elementary Literacy‐ How does the candidate support students to apply the essential literacy strategy?
85.10% Emerging
Performance Level 1 included:
modeling of the key strategy or skills without opportunities for classroom students to practice or apply them. 0%
1 = 4
Level 1 did NOT include from Level
2: modeling the key strategy with limited opportunities for practice. 100%
Level 2 included:
Proficient Performance
modeling the key strategy with limited opportunities for practice. 100%
2 = 10
explicitly teaching classroom students on how to apply the strategy and provide opportunities for guided practice. 43%
Level 2 did NOT include from Level
3 explicitly teaching classroom students when to apply the strategy in meaningful contexts. 100%
Advanced
Performance
3 = 15
proposed changes that addressed their own behavior without reference to student learning. 67%
proposed changes suggested "more practice" or time to work on similar or identical tasks without revision. 33%
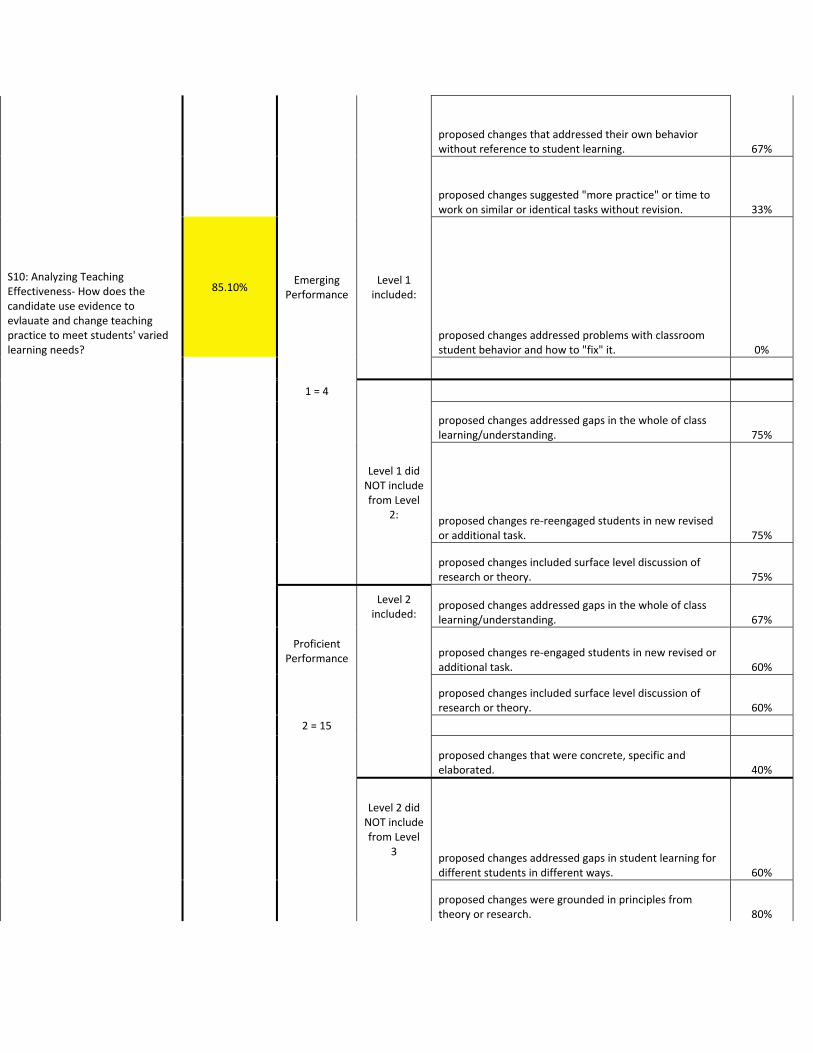
S10: Analyzing Teaching Effectiveness‐ How does the candidate use evidence to evlauate and change teaching practice to meet students' varied learning needs?
85.10% Emerging
Performance Level 1 included:
proposed changes addressed problems with classroom student behavior and how to "fix" it. 0%
1 = 4
proposed changes addressed gaps in the whole of class
learning/understanding. 75%
Level 1 did NOT include from Level
2: proposed changes re‐reengaged students in new revised or additional task. 75%
proposed changes included surface level discussion of
research or theory. 75%
Level 2 included:
proposed changes addressed gaps in the whole of class learning/understanding. 67%
Proficient
Performance proposed changes re‐engaged students in new revised or
additional task. 60%
proposed changes included surface level discussion of
research or theory. 60%
2 = 15
proposed changes that were concrete, specific and
elaborated. 40%
Level 2 did NOT include from Level
3 proposed changes addressed gaps in student learning for different students in different ways. 60%
proposed changes were grounded in principles from
theory or research. 80%

Advanced
Performance
3 = 10
8.25
Assessment
listing correct OR incorrect answers (but not both). 20%
claims that were unsupported by work samples. 60%
S11: Analysis of Student Learning‐ How does the candidate analyze evidence of student learning?
81.40% Emerging
Performance Level 1 included:
no alignment between assessment and objectives. 40%
1 = 5
listing both correct AND incorrect answers. 80%
Level 1 did NOT include from Level
2: listing some areas where the whole class excelled or struggled. 80%
75%
Level 2 included:
Proficient
Performance
listing both correct AND incorrect answers. 57%
listing some areas where the whole class excelled or
struggled. 86%
2 = 7
Level 2 did NOT include from Level
3 descriptions of classroom students' understandings and struggles citing evidence. 57%
learning trends that were related to individual or group
understandings/misunderstandings. 57%
Advanced Performance
3 = 15
listing correct OR incorrect answers. 60%
claims that were unsupported by work samples. 20%
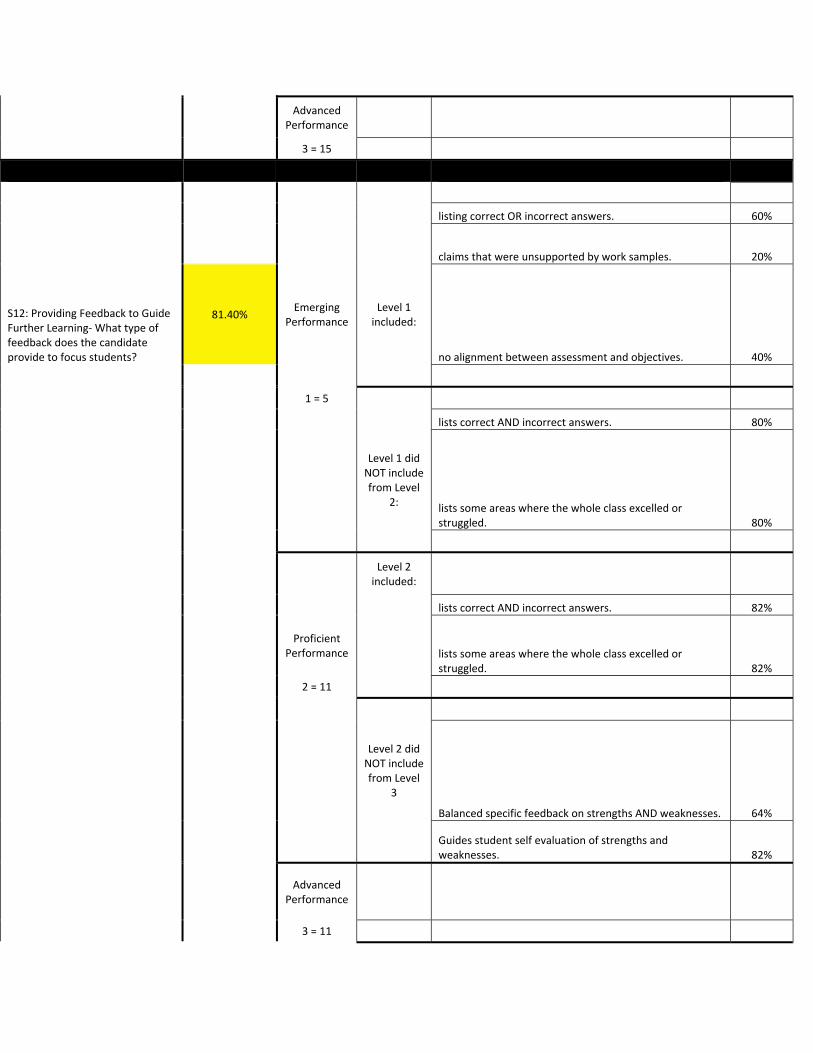
S12: Providing Feedback to Guide Further Learning‐ What type of feedback does the candidate provide to focus students?
81.40% Emerging
Performance Level 1 included:
no alignment between assessment and objectives. 40%
1 = 5
lists correct AND incorrect answers. 80%
Level 1 did NOT include from Level
2: lists some areas where the whole class excelled or struggled. 80%
Level 2 included:
lists correct AND incorrect answers. 82%
Proficient
Performance
lists some areas where the whole class excelled or struggled. 82%
2 = 11
Level 2 did NOT include from Level
3
Balanced specific feedback on strengths AND weaknesses. 64%
Guides student self evaluation of strengths and
weaknesses. 82%
Advanced
Performance
3 = 11

generic discussion for the use of feedback. 78%
no discussion for use of feedback. 33%
S13: Student Use of Feedback‐ How does the candidate provide opportunities for focus students to use the feedback to fuide their further learning?
66.60% Emerging
Performance Level 1 included:
no feedback given on samples. 33%
1 = 9
Level 1 did NOT include from Level
2: explicit discussion for how classroom students use feedback to improve work. 100%
Level 2 included:
Proficient
Performance
explicit discussion for how classroom students use feedback to improve work. 100%
2 = 9
Level 2 did NOT include from Level
3
discussion of support for student use of feedback. 22%
feedback that lead to deeper understandings of current or
future work. 78%
Advanced
Performance
3 = 9
listing only vocabulary use. 38%
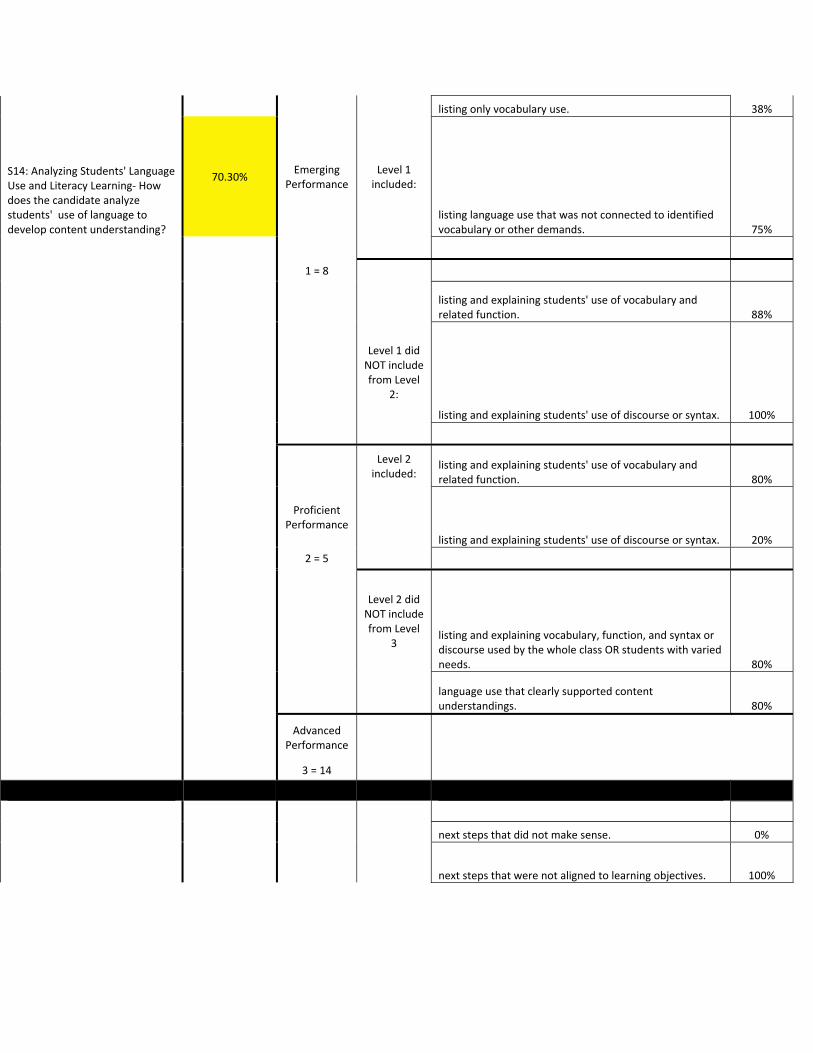
S14: Analyzing Students' Language Use and Literacy Learning‐ How does the candidate analyze students' use of language to develop content understanding?
70.30% Emerging
Performance Level 1 included:
listing language use that was not connected to identified vocabulary or other demands. 75%
1 = 8
listing and explaining students' use of vocabulary and
related function. 88%
Level 1 did NOT include from Level
2:
listing and explaining students' use of discourse or syntax. 100%
Level 2 included:
listing and explaining students' use of vocabulary and related function. 80%
Proficient
Performance
listing and explaining students' use of discourse or syntax. 20%
2 = 5
Level 2 did NOT include from Level
3 listing and explaining vocabulary, function, and syntax or discourse used by the whole class OR students with varied needs. 80%
language use that clearly supported content
understandings. 80%
Advanced
Performance
3 = 14
next steps that did not make sense. 0%
next steps that were not aligned to learning objectives. 100%
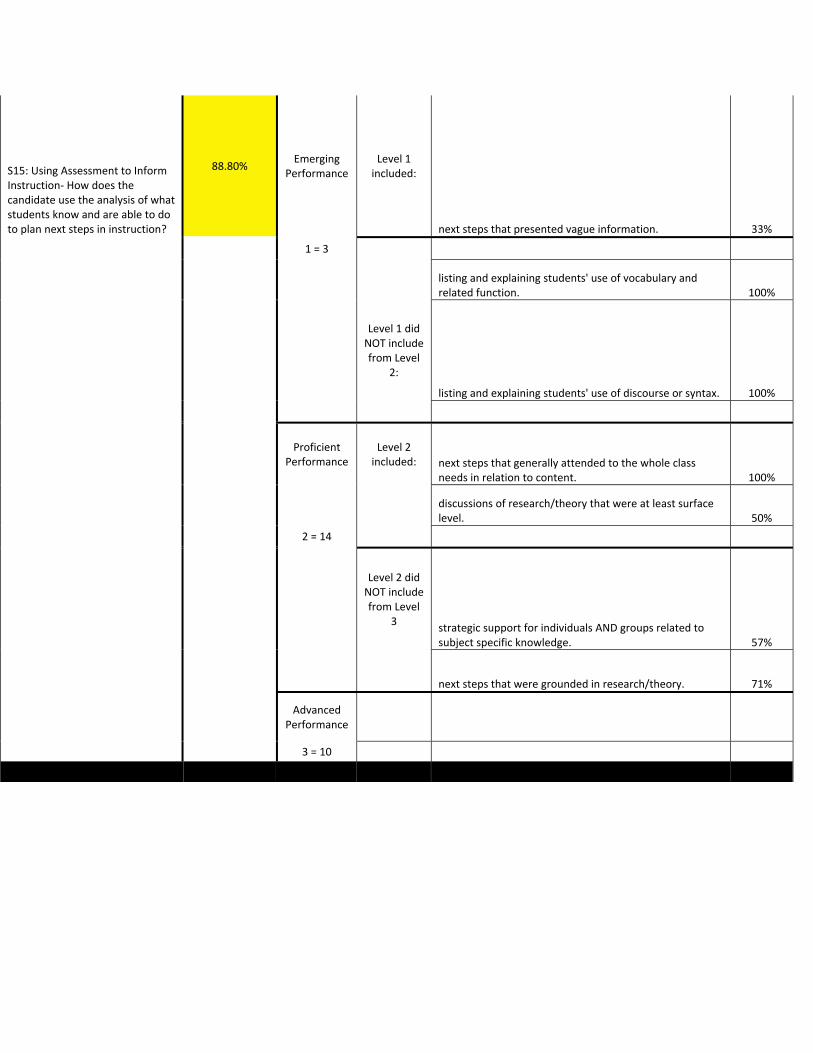
S15: Using Assessment to Inform Instruction‐ How does the candidate use the analysis of what students know and are able to do to plan next steps in instruction?
88.80% Emerging
Performance Level 1 included:
next steps that presented vague information. 33%
1 = 3
listing and explaining students' use of vocabulary and
related function. 100%
Level 1 did NOT include from Level
2:
listing and explaining students' use of discourse or syntax. 100%
Proficient
Performance Level 2 included: next steps that generally attended to the whole class
needs in relation to content. 100%
discussions of research/theory that were at least surface
level. 50%
2 = 14
Level 2 did NOT include from Level
3 strategic support for individuals AND groups related to subject specific knowledge. 57%
next steps that were grounded in research/theory. 71%
Advanced
Performance
3 = 10

Spring 2014 edTPA Implementation Summary
The Unit implemented edTPA for all graduating teacher candidates in Spring
2014. Two hundred twenty (220) candidates were required to complete an edTPA
portfolio to be eligible for program completion. Each candidates’ edTPA portfolio was
assigned to a rater and scored according to the three point Local Rubric provided by
SCALE. Each rater was required to complete a day long rubric training in order to be
qualified to review. Most spring reviewers were cooperating teachers or university
supervisors.
Rubric score analysis is currently ongoing. Preliminary results indicate that
spring completers are outperforming fall completers on all rubrics. It is important to note
that the spring semester saw a large increase in the number of portfolios submitted.
Upon completion of the data analysis each program will be provided with a
detailed summary of their candidate rubric scores. Included in the report are percent at
each level of each rubric as well as what specific “look for” items were included or
omitted from the portfolio. The Unit compiles and include this information in the
program reports to aid programs in program improvement. Attached are the program rubric
summaries and a sample of a program report for spring 2014 administration.
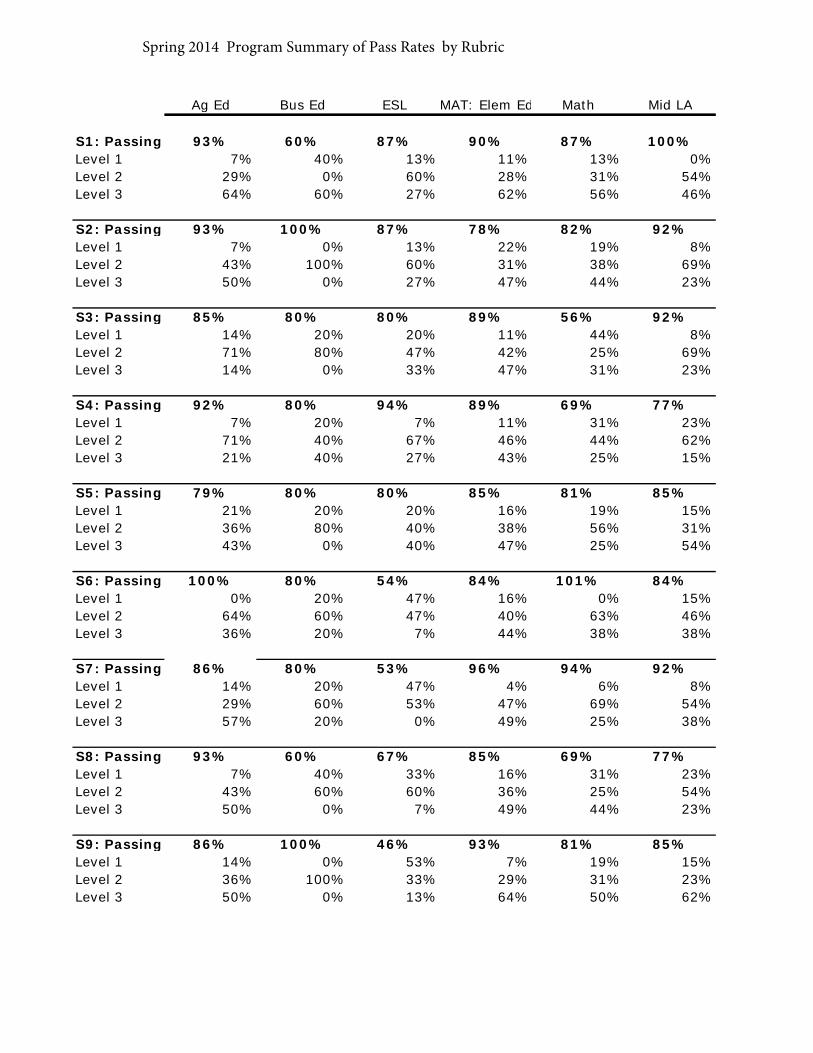
Ag Ed Bus Ed ESL MAT: Elem Ed Math Mid LA
S1: Passing 93% 60% 87% 90% 87% 100%Level 1 7% 40% 13% 11% 13% 0%Level 2 29% 0% 60% 28% 31% 54%Level 3 64% 60% 27% 62% 56% 46%
S2: Passing 93% 100% 87% 78% 82% 92%Level 1 7% 0% 13% 22% 19% 8%Level 2 43% 100% 60% 31% 38% 69%Level 3 50% 0% 27% 47% 44% 23%
S3: Passing 85% 80% 80% 89% 56% 92%Level 1 14% 20% 20% 11% 44% 8%Level 2 71% 80% 47% 42% 25% 69%Level 3 14% 0% 33% 47% 31% 23%
S4: Passing 92% 80% 94% 89% 69% 77%Level 1 7% 20% 7% 11% 31% 23%Level 2 71% 40% 67% 46% 44% 62%Level 3 21% 40% 27% 43% 25% 15%
S5: Passing 79% 80% 80% 85% 81% 85%Level 1 21% 20% 20% 16% 19% 15%Level 2 36% 80% 40% 38% 56% 31%Level 3 43% 0% 40% 47% 25% 54%
S6: Passing 100% 80% 54% 84% 101% 84%Level 1 0% 20% 47% 16% 0% 15%Level 2 64% 60% 47% 40% 63% 46%Level 3 36% 20% 7% 44% 38% 38%
S7: Passing 86% 80% 53% 96% 94% 92%Level 1 14% 20% 47% 4% 6% 8%Level 2 29% 60% 53% 47% 69% 54%Level 3 57% 20% 0% 49% 25% 38%
S8: Passing 93% 60% 67% 85% 69% 77%Level 1 7% 40% 33% 16% 31% 23%Level 2 43% 60% 60% 36% 25% 54%Level 3 50% 0% 7% 49% 44% 23%
S9: Passing 86% 100% 46% 93% 81% 85%Level 1 14% 0% 53% 7% 19% 15%Level 2 36% 100% 33% 29% 31% 23%Level 3 50% 0% 13% 64% 50% 62%
Spring 2014 Program Summary of Pass Rates by Rubric
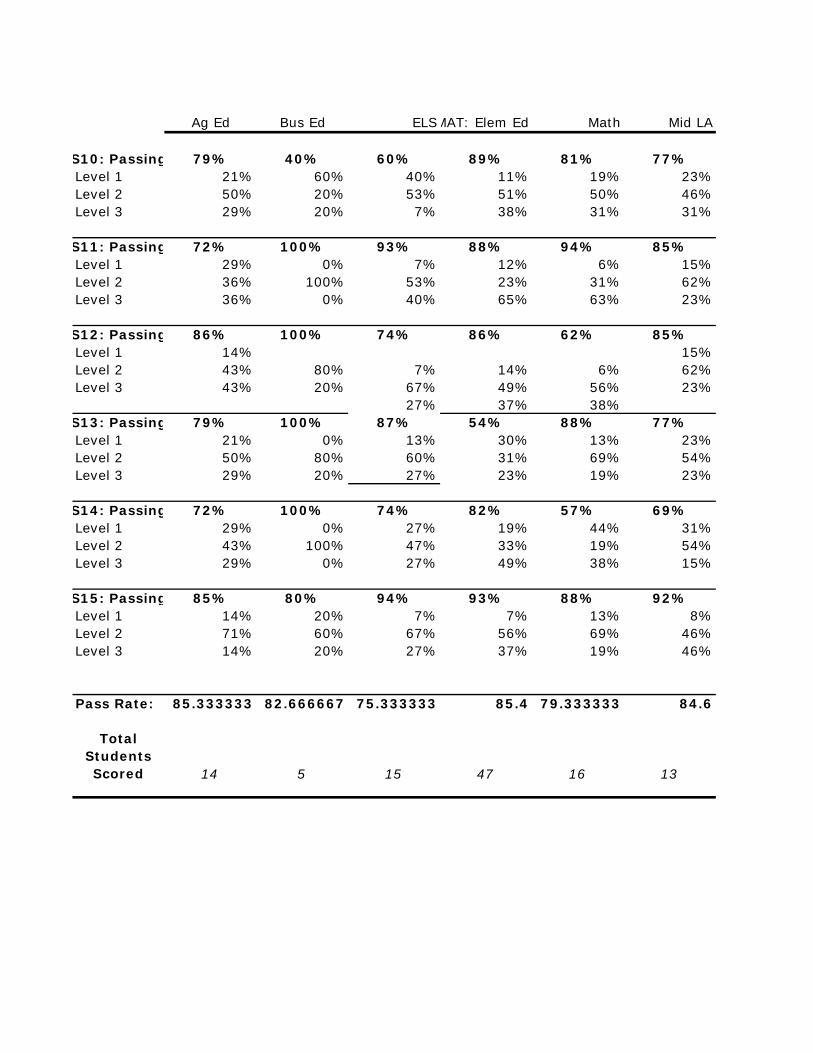
Ag Ed Bus Ed ELSMAT: Elem Ed Math Mid LA
S10: Passing 79% 40% 60% 89% 81% 77%Level 1 21% 60% 40% 11% 19% 23%Level 2 50% 20% 53% 51% 50% 46%Level 3 29% 20% 7% 38% 31% 31%
S11: Passing 72% 100% 93% 88% 94% 85%Level 1 29% 0% 7% 12% 6% 15%Level 2 36% 100% 53% 23% 31% 62%Level 3 36% 0% 40% 65% 63% 23%
S12: Passing 86% 100% 74% 86% 62% 85%Level 1 14% 15%Level 2 43% 80% 7% 14% 6% 62%Level 3 43% 20% 67% 49% 56% 23%
27% 37% 38%S13: Passing 79% 100% 87% 54% 88% 77%Level 1 21% 0% 13% 30% 13% 23%Level 2 50% 80% 60% 31% 69% 54%Level 3 29% 20% 27% 23% 19% 23%
S14: Passing 72% 100% 74% 82% 57% 69%Level 1 29% 0% 27% 19% 44% 31%Level 2 43% 100% 47% 33% 19% 54%Level 3 29% 0% 27% 49% 38% 15%
S15: Passing 85% 80% 94% 93% 88% 92%Level 1 14% 20% 7% 7% 13% 8%Level 2 71% 60% 67% 56% 69% 46%Level 3 14% 20% 27% 37% 19% 46%
Pass Rate: 85.333333 82.666667 75.333333 85.4 79.333333 84.6
Total Students Scored 14 5 15 47 16 13

Mid Sci Mid SS Sec Eng Sec Sci Sec SS Spec Ed Tech and Eng
91% 90% 90% 0% 94% 80% 85%9% 10% 10% 5% 20% 14%
26% 35% 42% 68% 50% 21%65% 55% 48% 26% 30% 64%
91% 90% 90% 0% 83% 80% 86%9% 10% 10% 17% 20% 14%
39% 60% 53% 50% 40% 36%52% 30% 37% 33% 40% 50%
87% 75% 70% 0% 94% 90% 78%13% 25% 30% 6% `0 21%57% 55% 43% 61% 70% 64%30% 20% 27% 33% 20% 14%
82% 65% 83% 0% 95% 80% 72%17% 35% 17% 6% 20% 29%65% 50% 53% 56% 40% 43%17% 15% 30% 39% 40% 29%
82% 90% 80% 0% 89% 70% 86%17% 10% 20% 11% 30% 14%17% 45% 47% 56% 30% 36%65% 45% 33% 33% 40% 50%
105% 95% 90% 0% 94% 90% 93%4% 5% 10% 6% 10% 7%
79% 60% 63% 50% 50% 43%26% 35% 27% 44% 40% 50%
87% 85% 87% 0% 88% 80% 93%13% 15% 13% 11% 20% 7%48% 60% 57% 44% 50% 79%39% 25% 30% 44% 30% 14%
78% 85% 84% 0% 89% 90% 86%22% 15% 17% 11% 10% 14%39% 60% 57% 56% 70% 57%39% 25% 27% 33% 20% 29%
87% 80% 80% 0% 89% 70% 92%13% 20% 20% 11% 30% 7%48% 55% 47% 72% 20% 21%39% 25% 33% 17% 50% 71%

Mid Sci Mid SS Sec Eng Sec Sci Sec SS Spec EdTech and Eng
69% 85% 70% 0% 95% 80% 64%30% 15% 30% 6% 20% 36%43% 50% 50% 67% 50% 50%26% 35% 20% 28% 30% 14%
91% 95% 86% 0% 100% 100% 86%9% 5% 13% 0% 0% 14%
52% 55% 43% 56% 80% 43%39% 40% 43% 44% 20% 43%
65% 90% 84% 0% 89% 90% 72%35% 10% 17% 11% 10% 29%43% 60% 57% 56% 60% 43%22% 30% 27% 33% 30% 29%
69% 55% 54% 0% 83% 90% 72%30% 45% 47% 17% 10% 29%39% 40% 37% 61% 60% 43%30% 15% 17% 22% 30% 29%
91% 65% 70% 0% 89% 80% 64%9% 30% 30% 11% 20% 36%
52% 50% 50% 39% 60% 14%39% 15% 20% 50% 20% 50%
65% 85% 83% 0% 89% 70% 78%35% 15% 17% 11% 30% 21%48% 55% 60% 50% 40% 57%17% 30% 23% 39% 30% 21%
82.666667 82 80.066667 0 90.666667 82.666667 80.466667
23 20 31 19 10 14
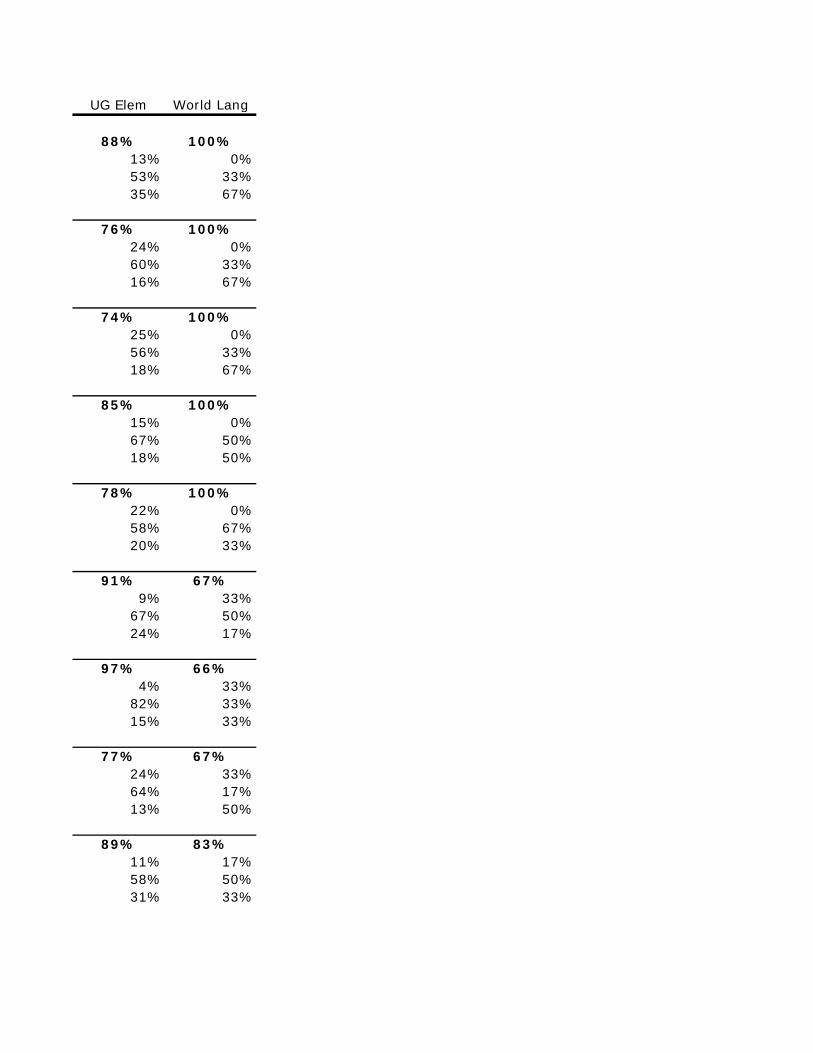
UG Elem World Lang
88% 100%13% 0%53% 33%35% 67%
76% 100%24% 0%60% 33%16% 67%
74% 100%25% 0%56% 33%18% 67%
85% 100%15% 0%67% 50%18% 50%
78% 100%22% 0%58% 67%20% 33%
91% 67%9% 33%
67% 50%24% 17%
97% 66%4% 33%
82% 33%15% 33%
77% 67%24% 33%64% 17%13% 50%
89% 83%11% 17%58% 50%31% 33%
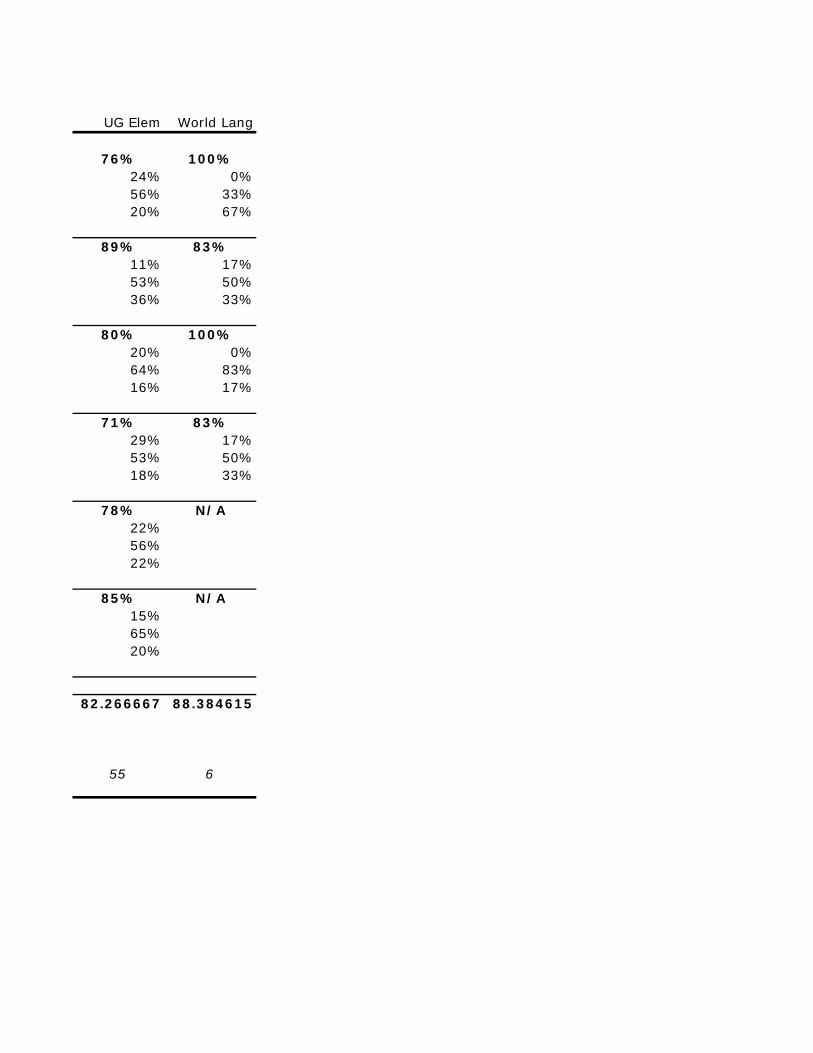
UG Elem World Lang
76% 100%24% 0%56% 33%20% 67%
89% 83%11% 17%53% 50%36% 33%
80% 100%20% 0%64% 83%16% 17%
71% 83%29% 17%53% 50%18% 33%
78% N/A22%56%22%
85% N/A15%65%20%
82.266667 88.384615
55 6
Rubric
Passing Rate
for All
Candidates
Count of
Scores at
Each Level
Criteria Included from Score/ Criteria Not
included from Level above Score
%
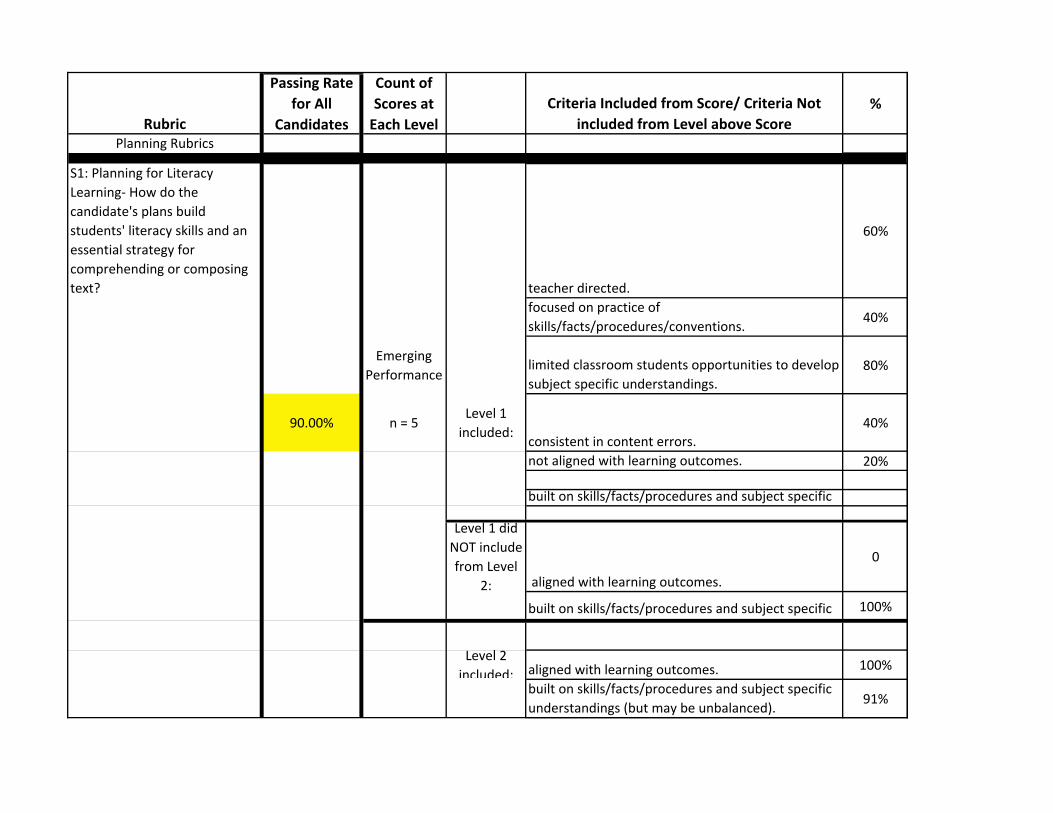
Planning Rubrics
S1: Planning for Literacy
Learning‐ How do the
candidate's plans build
students' literacy skills and an
essential strategy for
comprehending or composing
text? teacher directed.
60%
focused on practice of
skills/facts/procedures/conventions. 40%
Emerging
Performancelimited classroom students opportunities to develop
subject specific understandings.
80%
90.00% n = 5 Level 1
included:consistent in content errors.
40%
not aligned with learning outcomes. 20%
built on skills/facts/procedures and subject specific
Level 1 did
NOT include
from Level
2: aligned with learning outcomes.
0
built on skills/facts/procedures and subject specific 100%
Level 2
included: aligned with learning outcomes. 100%
built on skills/facts/procedures and subject specific
understandings (but may be unbalanced).91%

Proficient
Performance
sequenced in a learning progression across lessons 0
n = 13
Level 2 did
NOT include
from Level 3
built on skills/facts/procedures/conventions AND
deep subject specific understandings across all
lessons.
91%
supportive of classroom students understanding of
the relationship between
skills/facts/procedures/conventions and subject
specific understandings.
36%
Advanced
Performance
n = 30
S2: Planning to Support Varied
Student Learning Needs‐ How
does the candidate use
knowledge of his/her students
to target support for students'
literacy learning?
superficially aligned with learning outcomes. 50%
Level 1
included: limited or missing.60%
did not address IEP/504 requirements. 50%
Emerging
Performance
78.00% n = 10 aligned with learning outcomes.
10%
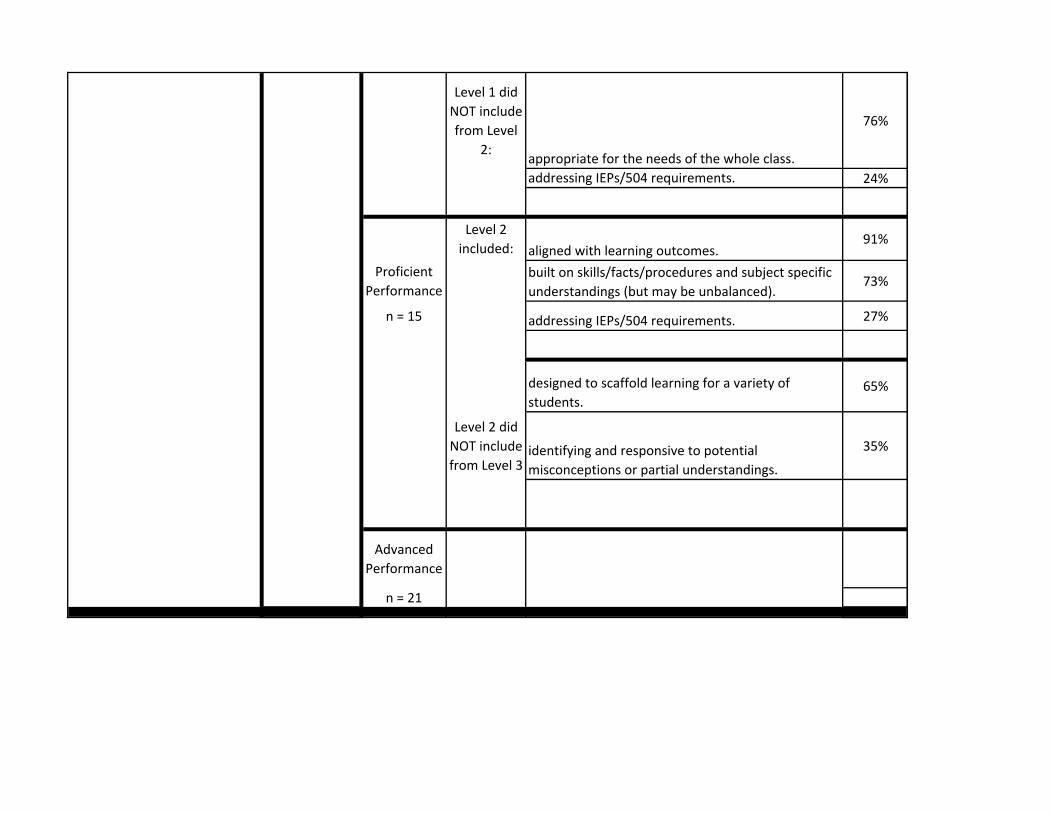
Level 1 did
NOT include
from Level
2:appropriate for the needs of the whole class.
76%
addressing IEPs/504 requirements. 24%
Level 2
included: aligned with learning outcomes.91%
Proficient
Performance
built on skills/facts/procedures and subject specific
understandings (but may be unbalanced).73%
n = 15 addressing IEPs/504 requirements. 27%
designed to scaffold learning for a variety of
students.65%
Level 2 did
NOT include
from Level 3identifying and responsive to potential
misconceptions or partial understandings.
35%
Advanced
Performance
n = 21

S3: Using Knowledge of
Students to Inform Teaching
and Learning‐ How does the
candidate use knowledge of
his/her students to justify
instructional plans?
89.00%
superficial descriptions of classroom students' prior
learning
80%
Level 1
included:
superficial descriptions of classroom students' lived
experiences.60%
Emerging
Performance
pervasive negative portrayals of students'
backgrounds, educational experiences or
family/community characteristics.
0
n = 5 Level 1 did
NOT include
from Level
2:
concrete and specific connections between tasks
and prior learning. 80%
at least surface level of discussion of theory or
research.80%
Level 2
included:
concrete and specific connections between tasks
and prior learning.95%
Proficient
Performance
at least surface level of discussion of theory or
research.70%
n = 20
Level 2 did
NOT include
from Level 3
concrete, specific connections between tasks and
prior learning.10%
grounded discussion of theory or research.100%

Advanced
Performance
n = 21
S4: Identifying and Supporting
Language Demands‐ How does
the candidate identify and
support language demands
associated with a key literacy
learning task?
89.00%
vocabulary that was only demand identified. 20%
a mismatch between language demands and
language function. 0%
Emerging
Performance
Level 1
included:
a mismatch between language demands and
language supports. 0%
n = 5 a mismatch between language demands and the
learning tasks. 0%
supports that were not included or focused on
vocabulary. 80%
Level 1 did
NOT include
from Level
2:language demands including function vocabulary
AND discourse/syntax.
60%
supports that generally addressed vocabulary and
one other identified demand (function, discourse or
syntax).
100%
Level 2
included:
AND discourse/syntax. 77%

Proficient
Performance
supports that generally addressed vocabulary and
one other identified demand (function, discourse or
syntax). 91%
n = 21
Level 2 did
NOT include
from Level 3
supports that were strategically designed to address
all language demands for students with varying
characteristics and language needs.
100%
Advanced
Performance
n = 20
A majority of assessments provided minimal
evidence of subject specific understandings. 86%S5: Planning Assessments to
Monitor and Support Student
Learning‐ How are the formal
and informal assessments
selected or designed to
monitor students' use of the
essential strategy and requisite
skills to comprehend or
compose text?
85%Emerging
Performance
A majority of assessments were not aligned with the
full scope of subject specific outcomes. 57%
Level 1
included:IEP/504 requirements for adaptations/modifications
were not addressed. 29%
n = 7

Level 1 did
NOT include
from Level
2:language demands including function, vocabulary
AND discourse/syntax. 71%
supports generally addressing vocabulary and one
other identified demands. 100%
Level 2
included:
Proficient
Performance
language demands including function, vocabulary
AND discourse/syntax. 67%
supports generally addressing vocabulary and one
other identified demands. 100%
n = 18
Level 2 did
NOT include
from Level 3
supports that were strategically designed to address
all language demands for students with varying
characteristics and language needs.
100%
Advanced
Performance
n = 21
Instructional Rubrics
respect. 86%
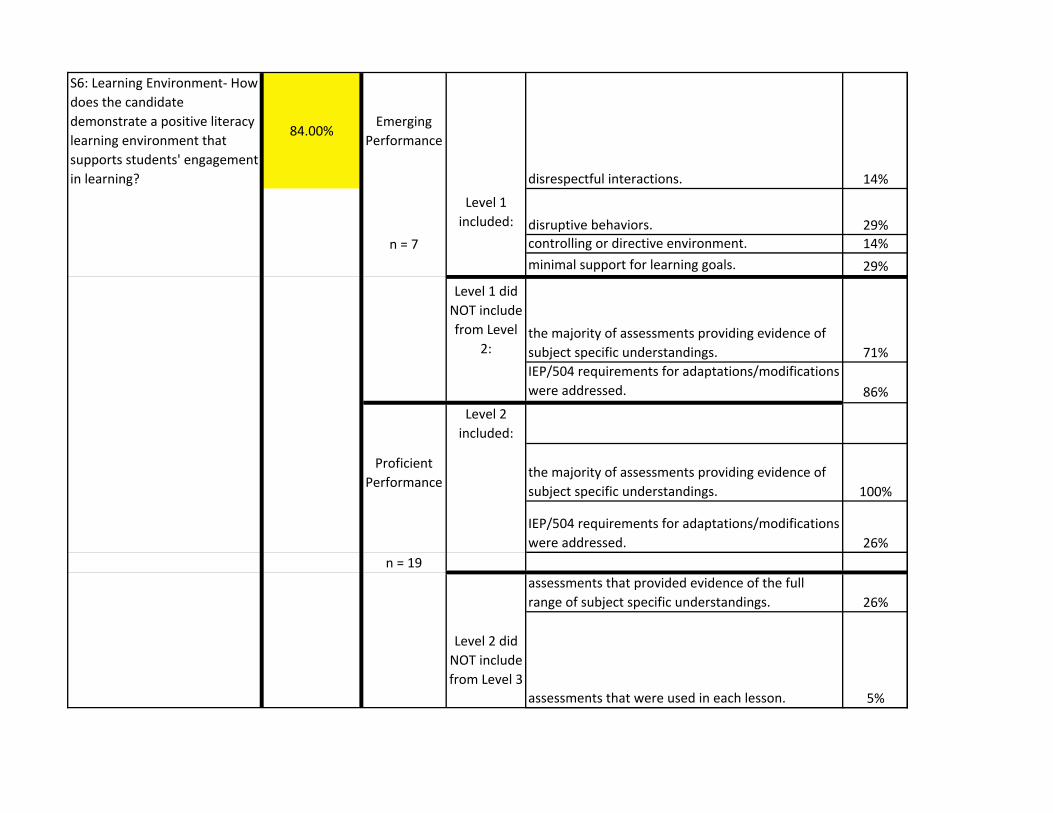
S6: Learning Environment‐ How
does the candidate
demonstrate a positive literacy
learning environment that
supports students' engagement
in learning?
84.00%Emerging
Performance
disrespectful interactions. 14%
Level 1
included: disruptive behaviors. 29%
n = 7 controlling or directive environment. 14%
minimal support for learning goals. 29%
Level 1 did
NOT include
from Level
2:the majority of assessments providing evidence of
subject specific understandings. 71%
IEP/504 requirements for adaptations/modifications
were addressed. 86%
Level 2
included:
Proficient
Performancethe majority of assessments providing evidence of
subject specific understandings. 100%
IEP/504 requirements for adaptations/modifications
were addressed. 26%
n = 19
assessments that provided evidence of the full
range of subject specific understandings. 26%
Level 2 did
NOT include
from Level 3
assessments that were used in each lesson. 5%
assessments that were differentiated so that
classroom students showed understandings in
various ways. 84%
Advanced
Performance
n = 20
loose connections between tasks and the central
focus. 0%
tasks that focused on low‐level content. 100%
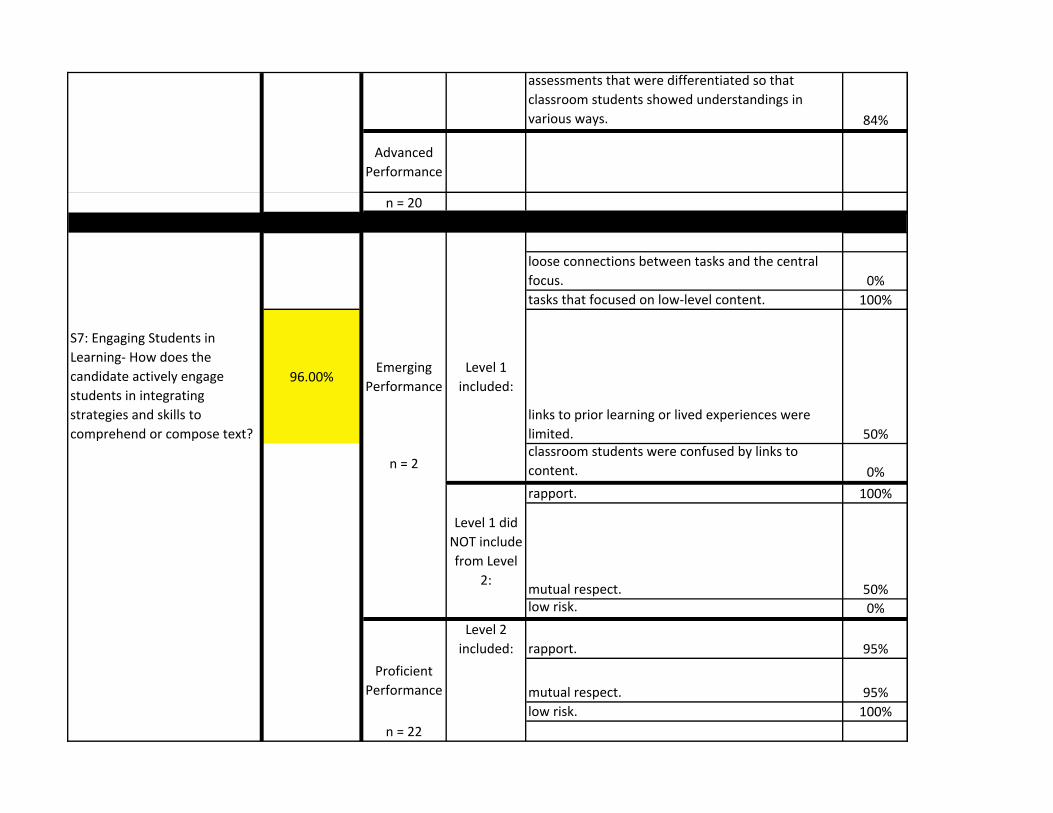
S7: Engaging Students in
Learning‐ How does the
candidate actively engage
students in integrating
strategies and skills to
comprehend or compose text?
96.00%Emerging
Performance
Level 1
included:
links to prior learning or lived experiences were
limited. 50%
n = 2 classroom students were confused by links to
content. 0%
rapport. 100%
Level 1 did
NOT include
from Level
2:mutual respect. 50%low risk. 0%
Level 2
included: rapport. 95%
Proficient
Performance mutual respect. 95%
low risk. 100%
n = 22
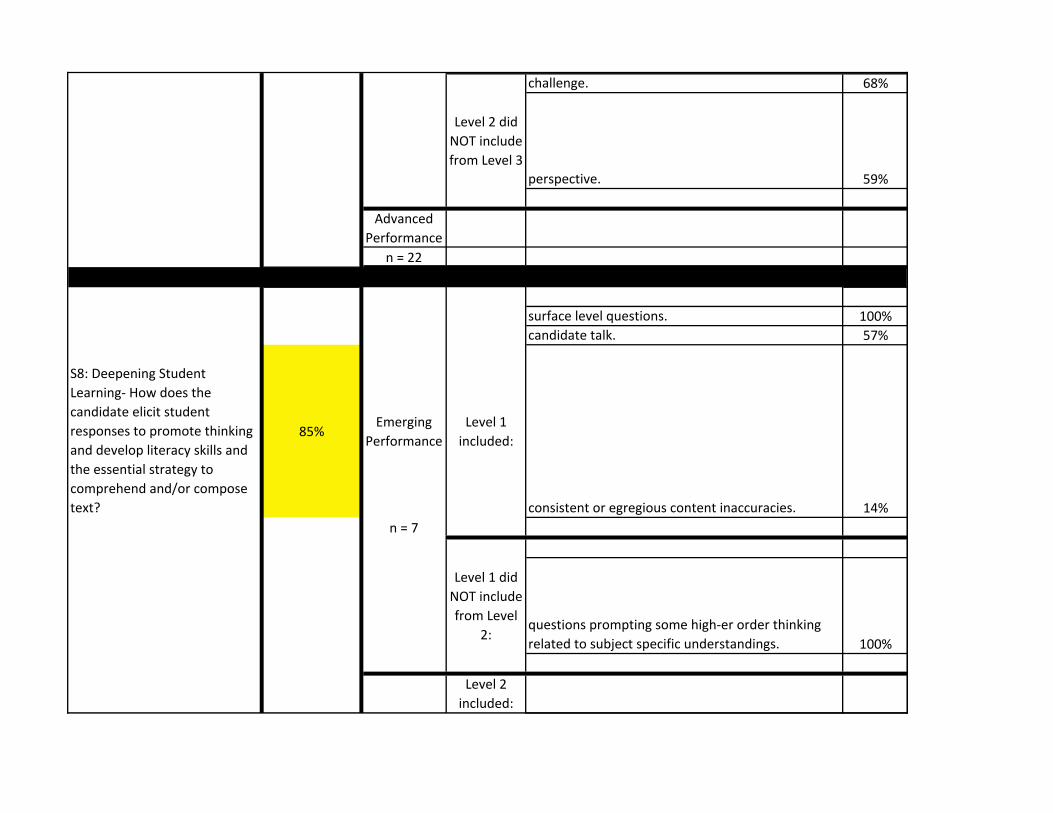
challenge. 68%
Level 2 did
NOT include
from Level 3
perspective. 59%
Advanced
Performance
n = 22
surface level questions. 100%
candidate talk. 57%
S8: Deepening Student
Learning‐ How does the
candidate elicit student
responses to promote thinking
and develop literacy skills and
the essential strategy to
comprehend and/or compose
text?
85%Emerging
Performance
Level 1
included:
consistent or egregious content inaccuracies. 14%
n = 7
Level 1 did
NOT include
from Level
2:questions prompting some high‐er order thinking
related to subject specific understandings. 100%
Level 2
included:
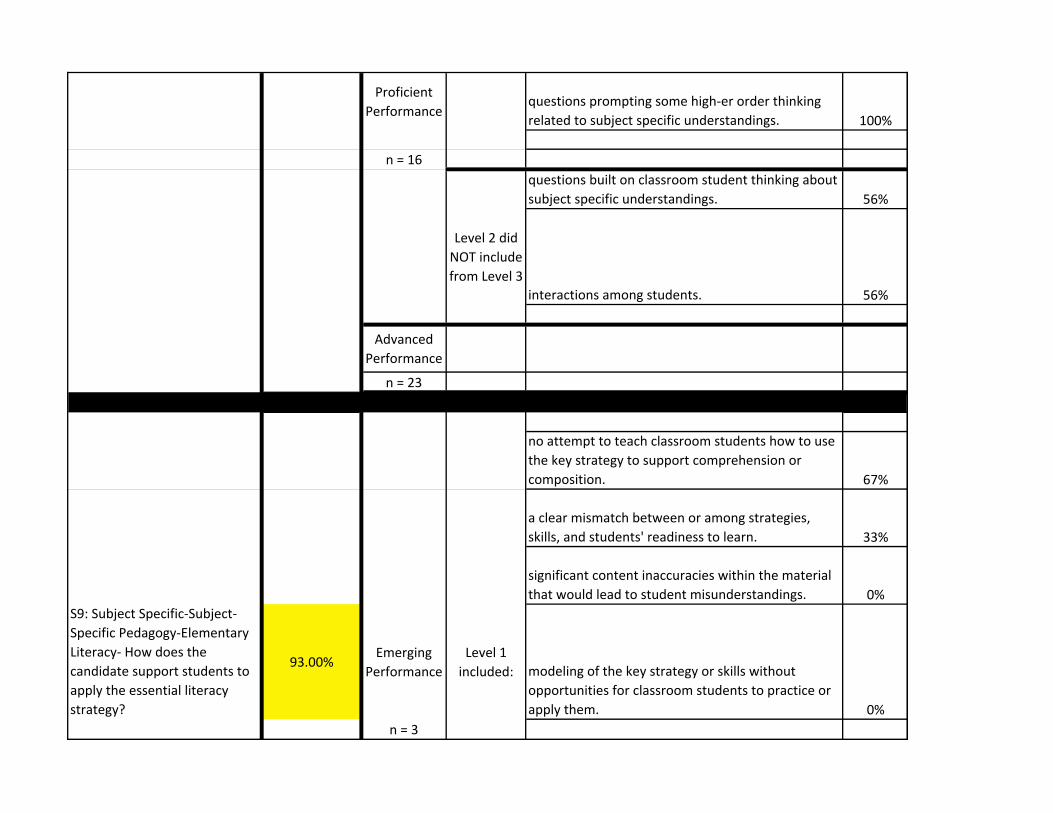
Proficient
Performancequestions prompting some high‐er order thinking
related to subject specific understandings. 100%
n = 16
questions built on classroom student thinking about
subject specific understandings. 56%
Level 2 did
NOT include
from Level 3
interactions among students. 56%
Advanced
Performance
n = 23
no attempt to teach classroom students how to use
the key strategy to support comprehension or
composition. 67%
a clear mismatch between or among strategies,
skills, and students' readiness to learn. 33%
significant content inaccuracies within the material
that would lead to student misunderstandings. 0%
S9: Subject Specific‐Subject‐
Specific Pedagogy‐Elementary
Literacy‐ How does the
candidate support students to
apply the essential literacy
strategy?
93.00%Emerging
Performance
Level 1
included: modeling of the key strategy or skills without
opportunities for classroom students to practice or
apply them. 0%
n = 3
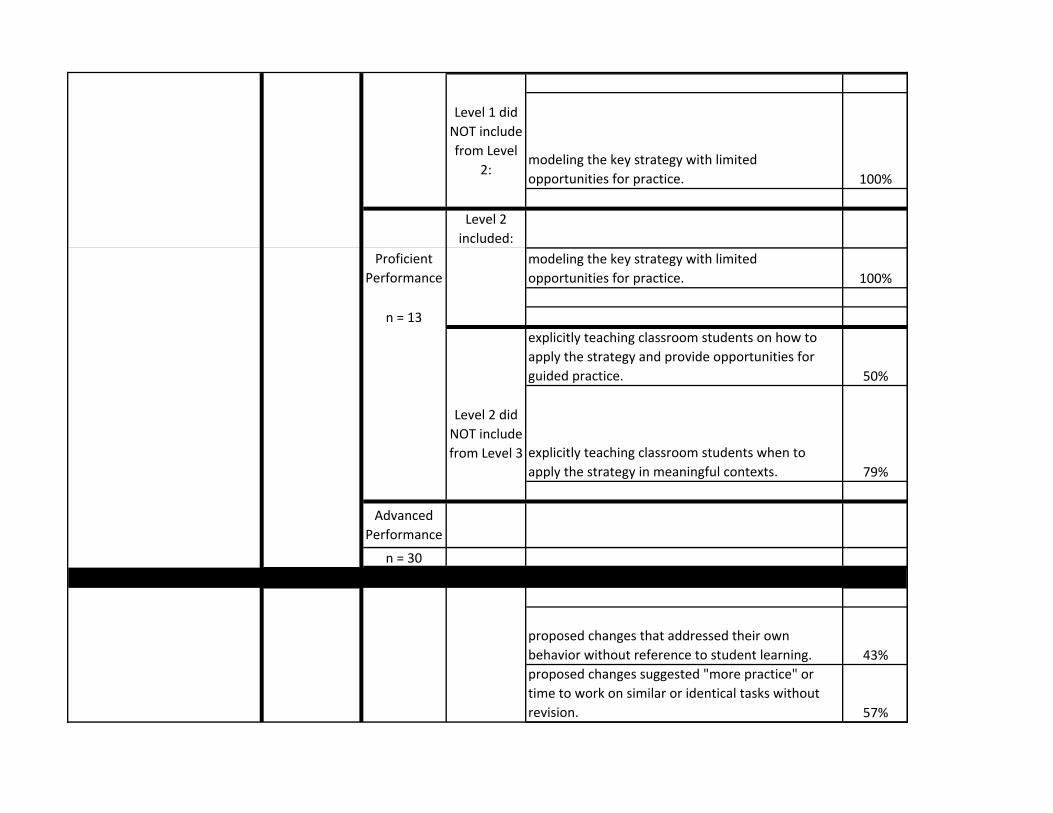
Level 1 did
NOT include
from Level
2:modeling the key strategy with limited
opportunities for practice. 100%
Level 2
included:
Proficient
Performance
modeling the key strategy with limited
opportunities for practice. 100%
n = 13
explicitly teaching classroom students on how to
apply the strategy and provide opportunities for
guided practice. 50%
Level 2 did
NOT include
from Level 3 explicitly teaching classroom students when to
apply the strategy in meaningful contexts. 79%
Advanced
Performance
n = 30
proposed changes that addressed their own
behavior without reference to student learning. 43%
proposed changes suggested "more practice" or
time to work on similar or identical tasks without
revision. 57%
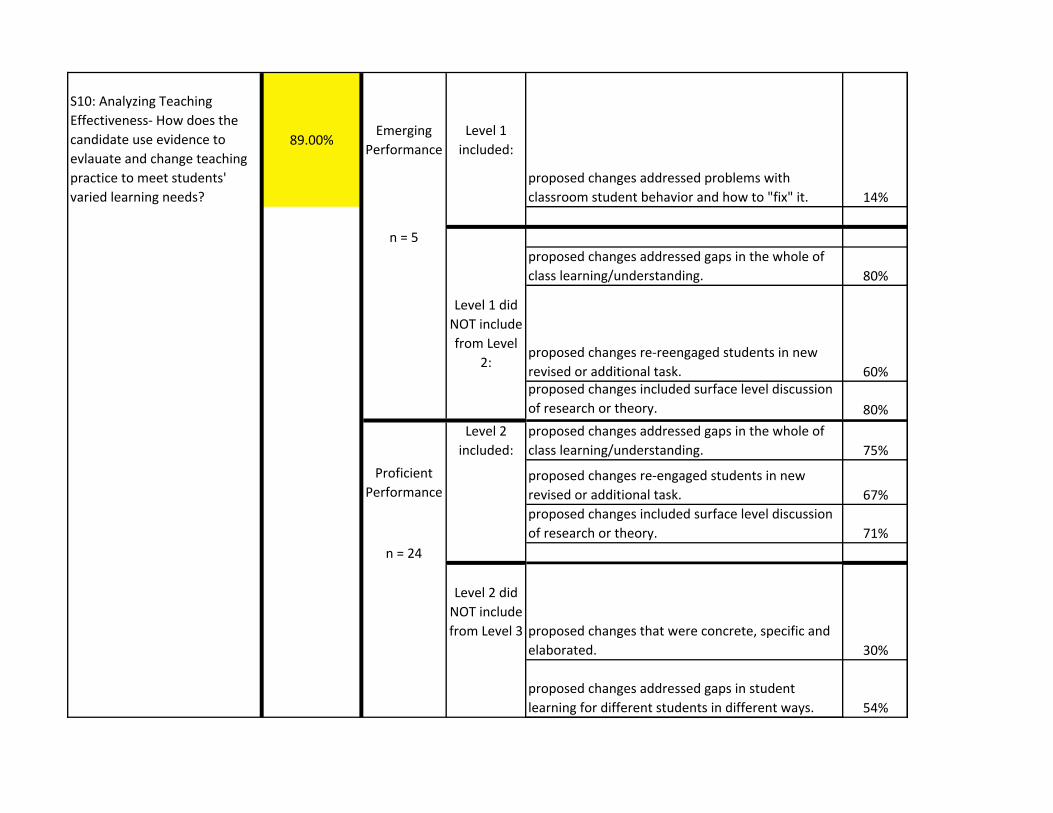
S10: Analyzing Teaching
Effectiveness‐ How does the
candidate use evidence to
evlauate and change teaching
practice to meet students'
varied learning needs?
89.00%Emerging
Performance
Level 1
included:
proposed changes addressed problems with
classroom student behavior and how to "fix" it. 14%
n = 5
proposed changes addressed gaps in the whole of
class learning/understanding. 80%
Level 1 did
NOT include
from Level
2:proposed changes re‐reengaged students in new
revised or additional task. 60%proposed changes included surface level discussion
of research or theory. 80%
Level 2
included:
proposed changes addressed gaps in the whole of
class learning/understanding. 75%
Proficient
Performanceproposed changes re‐engaged students in new
revised or additional task. 67%
proposed changes included surface level discussion
of research or theory. 71%
n = 24
Level 2 did
NOT include
from Level 3 proposed changes that were concrete, specific and
elaborated. 30%
proposed changes addressed gaps in student
learning for different students in different ways. 54%

proposed changes were grounded in principles from
theory or research. 75%
Advanced
Performance
n = 17
8.25
Assessment
listing correct OR incorrect answers (but not both). 20%
claims that were unsupported by work samples. 60%
S11: Analysis of Student
Learning‐ How does the
candidate analyze evidence of
student learning?
88.00%Emerging
Performance
Level 1
included:
no alignment between assessment and objectives. 40%
n = 5
listing both correct AND incorrect answers. 80%
Level 1 did
NOT include
from Level
2:listing some areas where the whole class excelled or
struggled. 80%
Level 2
included:
Proficient
Performancelisting both correct AND incorrect answers. 60%
listing some areas where the whole class excelled or
struggled. 90%
n = 10
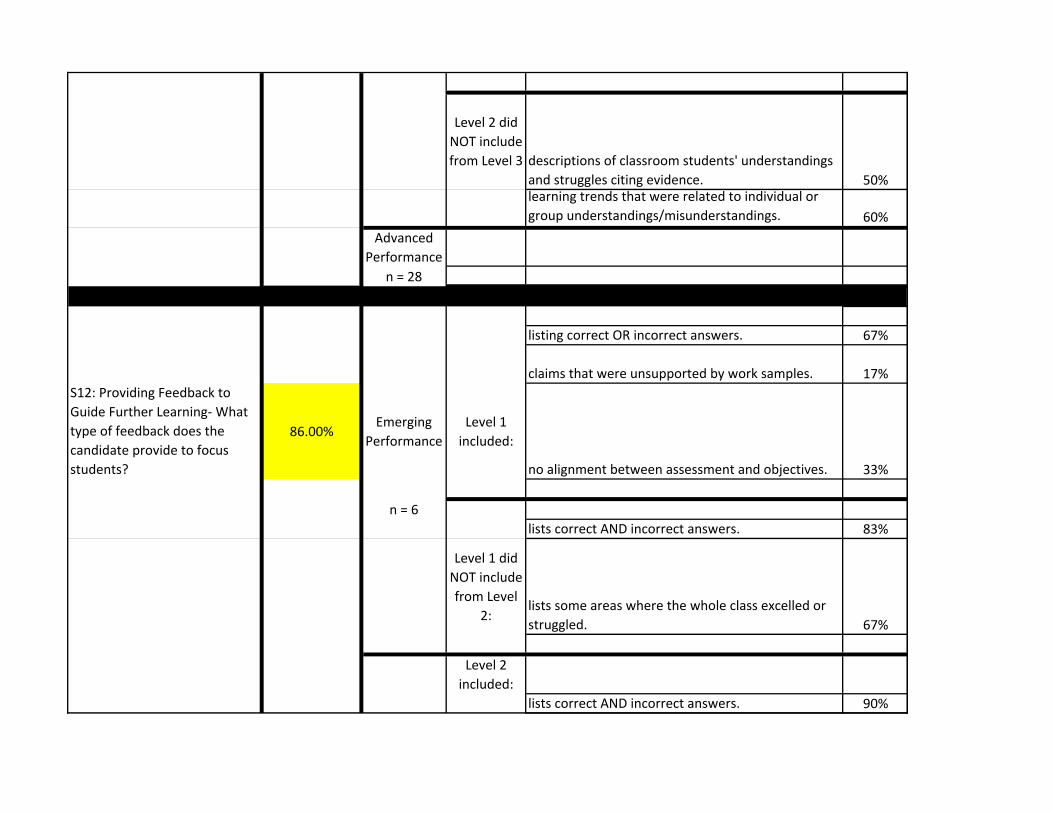
Level 2 did
NOT include
from Level 3 descriptions of classroom students' understandings
and struggles citing evidence. 50%learning trends that were related to individual or
group understandings/misunderstandings. 60%
Advanced
Performance
n = 28
listing correct OR incorrect answers. 67%
claims that were unsupported by work samples. 17%
S12: Providing Feedback to
Guide Further Learning‐ What
type of feedback does the
candidate provide to focus
students?
86.00%Emerging
Performance
Level 1
included:
no alignment between assessment and objectives. 33%
n = 6
lists correct AND incorrect answers. 83%
Level 1 did
NOT include
from Level
2:lists some areas where the whole class excelled or
struggled. 67%
Level 2
included:
lists correct AND incorrect answers. 90%

Proficient
Performancelists some areas where the whole class excelled or
struggled. 81%
n = 21
Level 2 did
NOT include
from Level 3 Balanced specific feedback on strengths AND
weaknesses. 38%Guides student self evaluation of strengths and
weaknesses. 90%
Advanced
Performance
n = 16
generic discussion for the use of feedback. 77%
no discussion for use of feedback. 31%
S13: Student Use of Feedback‐
How does the candidate
provide opportunities for focus
students to use the feedback to
fuide their further learning?
54.00%Emerging
Performance
Level 1
included:
no feedback given on samples. 23%
n = 10
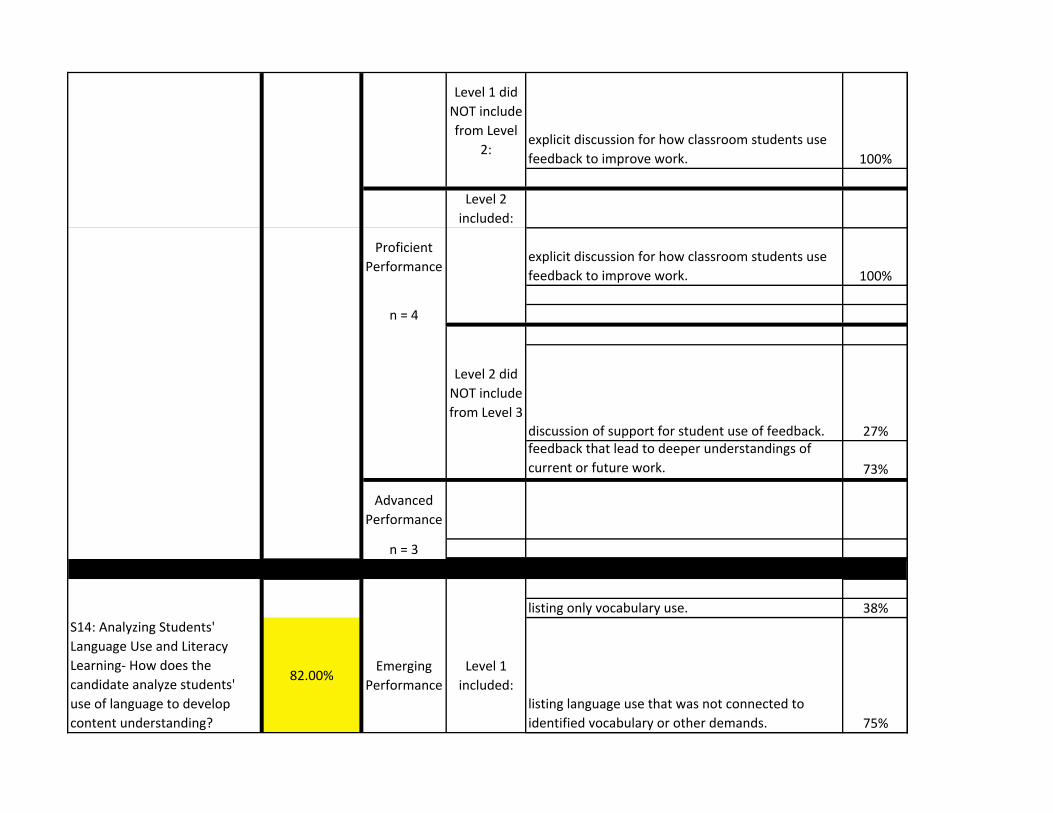
Level 1 did
NOT include
from Level
2:explicit discussion for how classroom students use
feedback to improve work. 100%
Level 2
included:
Proficient
Performanceexplicit discussion for how classroom students use
feedback to improve work. 100%
n = 4
Level 2 did
NOT include
from Level 3
discussion of support for student use of feedback. 27%feedback that lead to deeper understandings of
current or future work. 73%
Advanced
Performance
n = 3
listing only vocabulary use. 38%
S14: Analyzing Students'
Language Use and Literacy
Learning‐ How does the
candidate analyze students'
use of language to develop
content understanding?
82.00%Emerging
Performance
Level 1
included:
listing language use that was not connected to
identified vocabulary or other demands. 75%
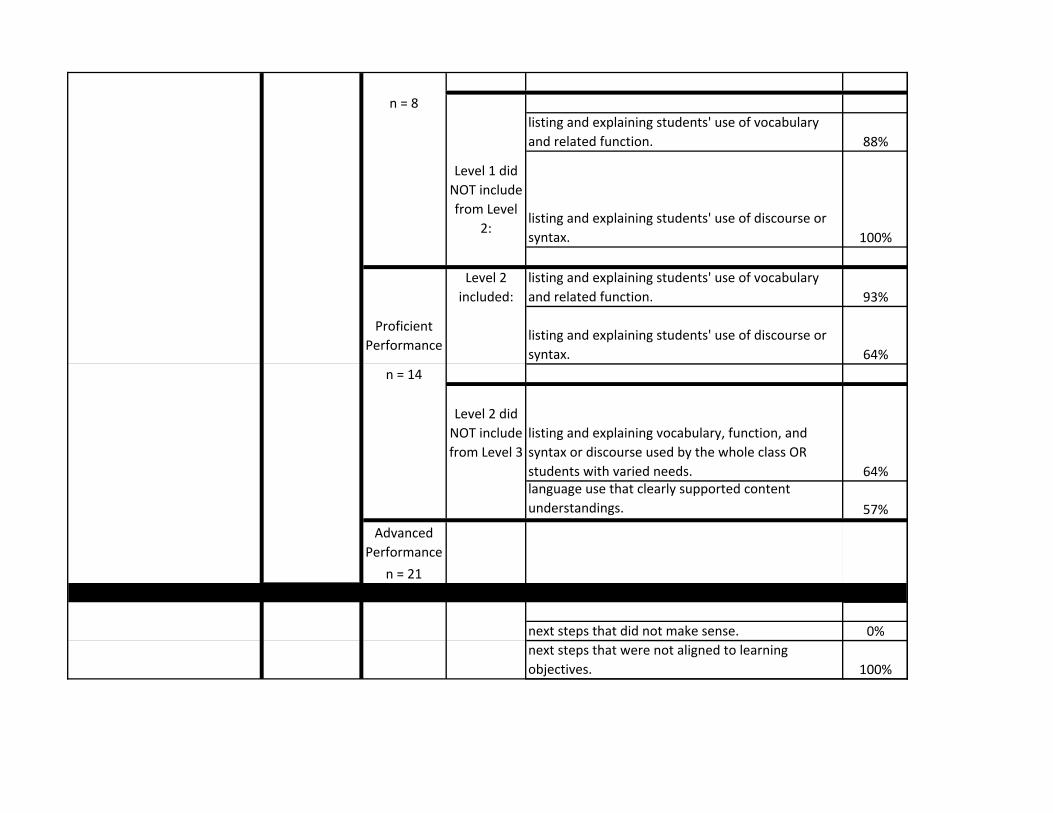
n = 8
listing and explaining students' use of vocabulary
and related function. 88%
Level 1 did
NOT include
from Level
2:listing and explaining students' use of discourse or
syntax. 100%
Level 2
included:
listing and explaining students' use of vocabulary
and related function. 93%
Proficient
Performancelisting and explaining students' use of discourse or
syntax. 64%
n = 14
Level 2 did
NOT include
from Level 3
listing and explaining vocabulary, function, and
syntax or discourse used by the whole class OR
students with varied needs. 64%language use that clearly supported content
understandings. 57%
Advanced
Performance
n = 21
next steps that did not make sense. 0%
next steps that were not aligned to learning
objectives. 100%
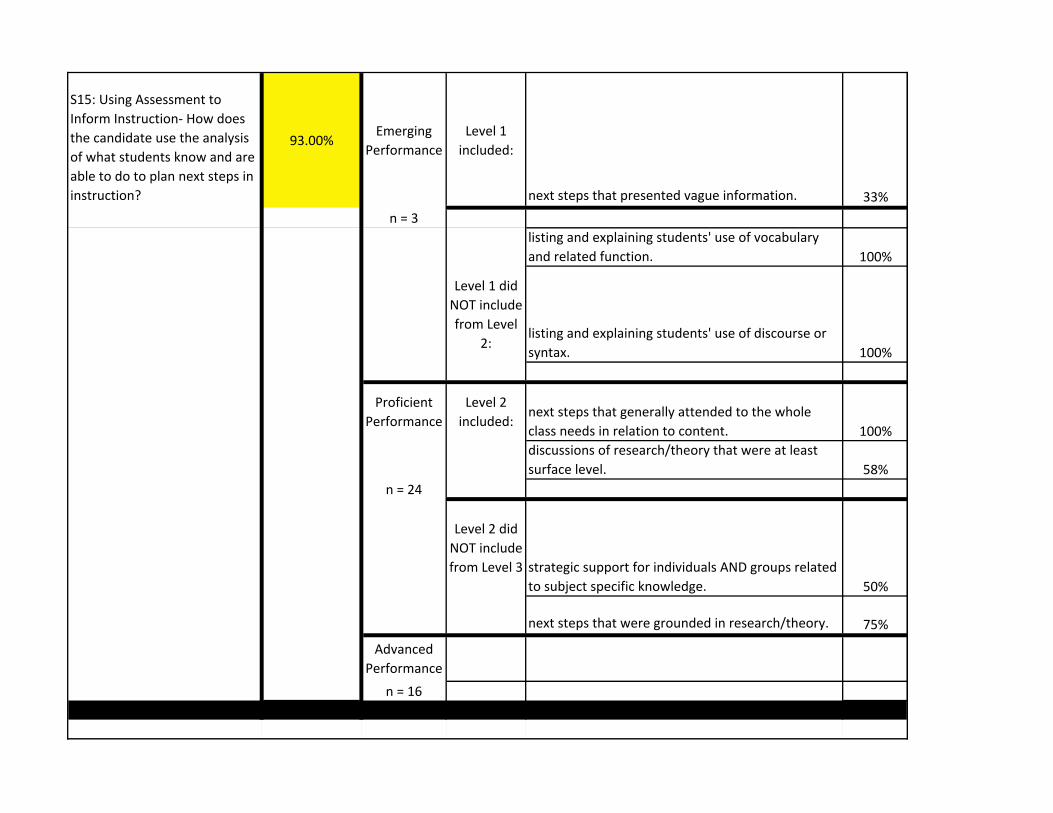
S15: Using Assessment to
Inform Instruction‐ How does
the candidate use the analysis
of what students know and are
able to do to plan next steps in
instruction?
93.00%Emerging
Performance
Level 1
included:
next steps that presented vague information. 33%
n = 3
listing and explaining students' use of vocabulary
and related function. 100%
Level 1 did
NOT include
from Level
2:listing and explaining students' use of discourse or
syntax. 100%
Proficient
Performance
Level 2
included:next steps that generally attended to the whole
class needs in relation to content. 100%
discussions of research/theory that were at least
surface level. 58%
n = 24
Level 2 did
NOT include
from Level 3 strategic support for individuals AND groups related
to subject specific knowledge. 50%
next steps that were grounded in research/theory. 75%
Advanced
Performance
n = 16


