Download - Edelman Trust Barometer 2016 - UK Results

United Kingdom
2016 Edelman Trust Barometer

Informed Public
‣ 8 years in 20+ markets
‣ Represents 15% of total global population
‣ 500 respondents in U.S. and China; 200 in all other countries
Must meet 4 criteria:
‣ Ages 25-64‣ College educated‣ In top 25% of household income per age group in each country‣ Report significant media consumption and engagement in business news
General Online Population
‣ 5 years in 25+ markets
‣ Ages 18+
‣ 1,150 respondents per country
Methodology
28-country global data margin of error: General Population +/-0.6% (N=32,200), Informed Public +/- 1.2% (N=6,200), Mass Population +/- 0.6% (26,000). Country-specific data margin of error: General Population +/- 2.9 ( N=1,150), Informed Public +/- 6.9% (N = min 200, varies by country), China and U.S. +/- 4.4% (N=500), Mass Population +/- 3.0 to 3.6 (N =min 740, varies by country), half sample Global General Online Population +/- 0.8 (N=16,100).
‣ 16 years of data‣ 33,000+ respondents total‣ All fieldwork was conducted between
October 13th and November 16th, 2015
‣ 1,000 General Online Population‣ 250 Low Income Households‣ 100 High Net Worth individuals
Online Survey in 28 Countries
Mass Population
‣ All population not including Informed Public
‣ Represents 85% of total global population
2
UK Supplement Survey
UK data for 2016 Trust Barometer included an October 2015 wave of 1,150 General Online Population including Informed Publics, a January 2016 wave of 1,000 General Online Population plus additional boosts for 250 Low Income Households and 100 High Net Worth individuals. A total of 2,500 were conducted

63
51
31
28
28
12
46
43
14
22
30
6
Trust Matters
3
Percent who engage in each behavior based on trust
Behaviors for Distrusted Companies Behaviors for Trusted Companies
Refused to buy products/services
Criticized companies
Paid more than wanted
Shared negative opinions
Disagreed with others
Chose to buy products/services
Recommended them to a friend/colleague
Paid more
Shared positive opinions
Defended company
Bought shares
General Population
Source: 2016 Edelman Trust Barometer Q371-589. Thinking back over the past 12 months, have you taken any of the following actions in relation to companies that you trust? Please answer yes or no to each action. General Population, 28-country global total, questions asked of half the sample. Q377-380. Still thinking about the past 12 months, have you taken any of the following actions in relation to companies that you do not trust? Please answer yes or no to each action. General Population, UK total, question asked of half the sample.
most trusted content creators: #1
Friends and Family
most trusted media source: #1
Traditional Media
Bought shares
1 State of Trust
46 4433 34
50 4636 36
51 52
38 43
61 6052 55
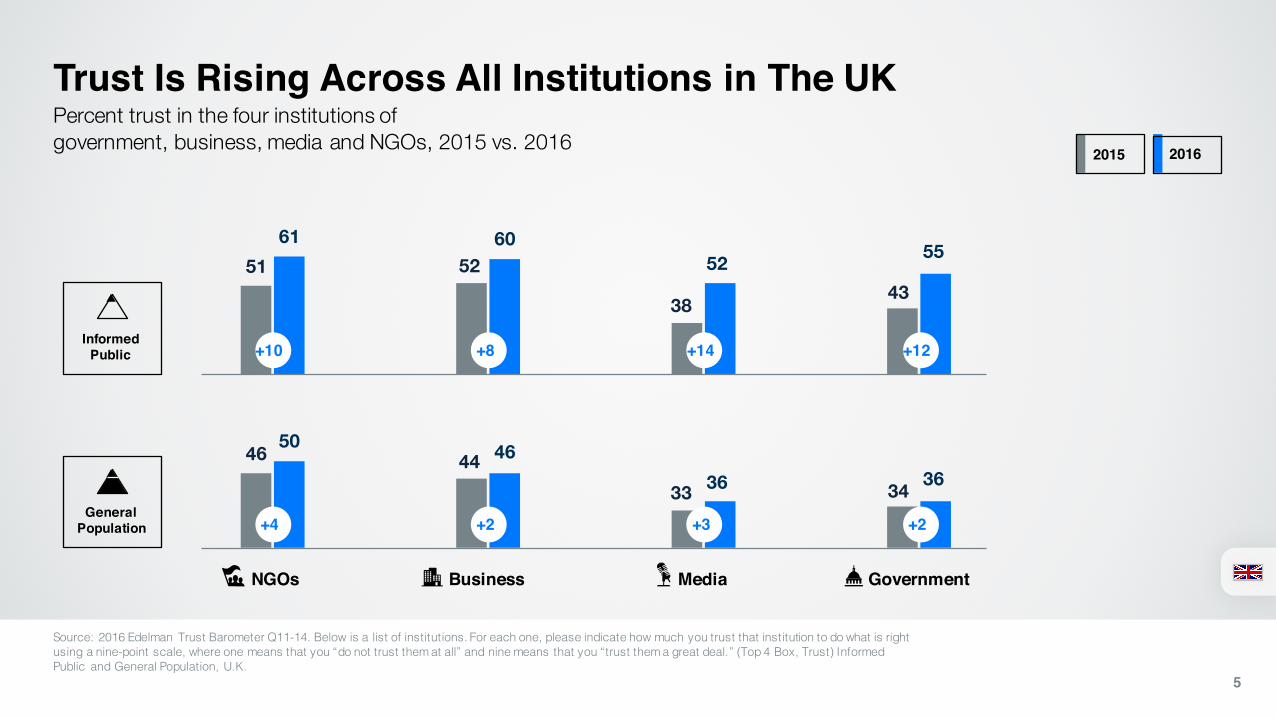
Trust Is Rising Across All Institutions in The UK
Source: 2016 Edelman Trust Barometer Q11-14. Below is a list of institutions. For each one, please indicate how much you trust that institution to do what is right using a nine-point scale, where one means that you “do not trust them at all” and nine means that you “trust them a great deal.” (Top 4 Box, Trust) Informed Public and General Population, U.K.
5
Percent trust in the four institutions of government, business, media and NGOs, 2015 vs. 2016
Informed Public
General Population
NGOs Business Media Government
+10 +8 +14 +12
2015 2016
+4 +2 +3 +2

61
67
51
61
52 5146
50
38
4742 43
55
29
37 36 34 36
2012 2013 2014 2015 2016
38
56 5652
60
38
4945 44 46
2012 2013 2014 2015 2016
Source: 2016 Edelman Trust Barometer Q11-14. Below is a list of institutions. For each one, please indicate how much you trust that institution to do what is right using a nine-point scale, where one means that you “do not trust them at all” and nine means that you “trust them a great deal.” (Top 4 Box, Trust) Informed Public and General Population, U.K.
6
Percent trust in the four institutions of government, business, media and NGOs, 2012 vs. 2016
37
47
4138
52
32
36 37
3336
NGO’s
Government
Media
Business
Trust Levels In The UK Are Now At Post-Recession HighsInformed Public
GeneralPopulation
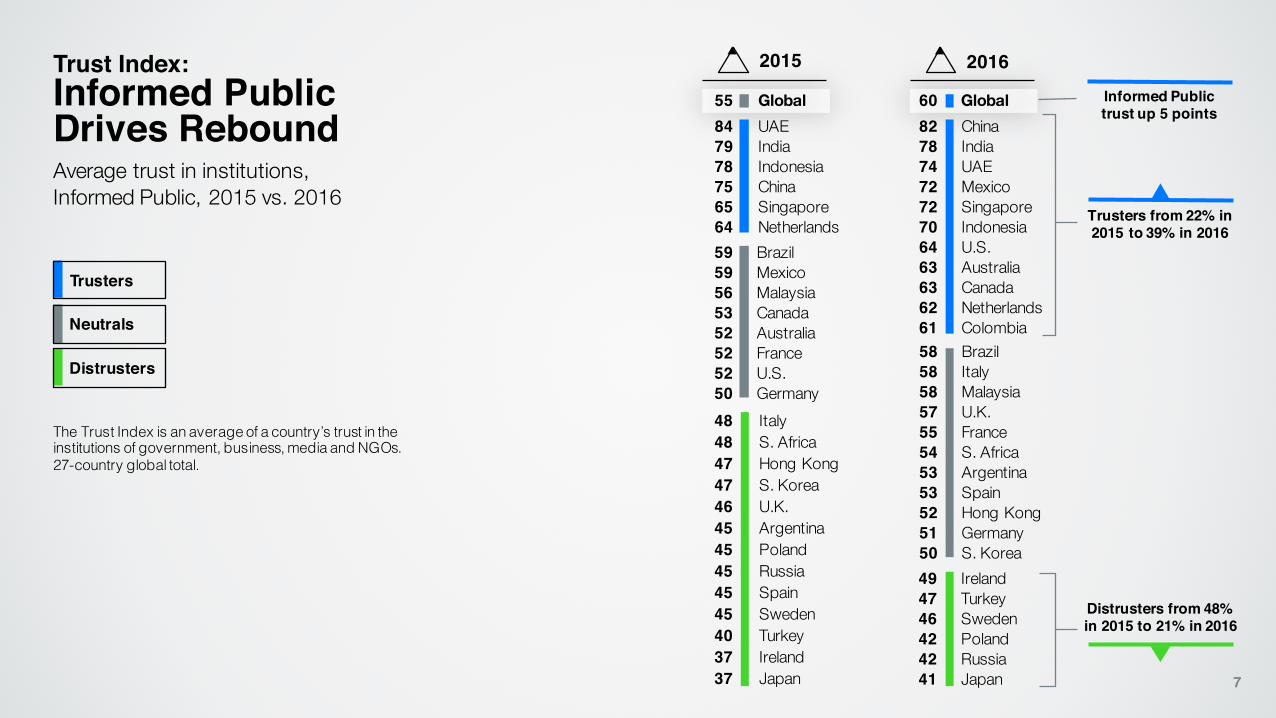
55 Global 60 Global82 China78 India74 UAE72 Mexico72 Singapore70 Indonesia64 U.S.63 Australia63 Canada62 Netherlands61 Colombia
84 UAE79 India78 Indonesia75 China65 Singapore64 Netherlands
49 Ireland47 Turkey46 Sweden42 Poland42 Russia41 Japan
48 Italy48 S. Africa47 Hong Kong47 S. Korea46 U.K.45 Argentina45 Poland45 Russia45 Spain45 Sweden40 Turkey37 Ireland37 Japan
58 Brazil58 Italy58 Malaysia57 U.K.55 France54 S. Africa53 Argentina53 Spain52 Hong Kong51 Germany50 S. Korea
59 Brazil59 Mexico56 Malaysia53 Canada52 Australia52 France52 U.S.50 Germany
Trust Index:Informed Public Drives ReboundAverage trust in institutions,Informed Public, 2015 vs. 2016
2015 2016Informed Public trust up 5 points
Trusters from 22% in 2015 to 39% in 2016
Distrusters from 48% in 2015 to 21% in 2016
Trusters
Neutrals
Distrusters
7
The Trust Index is an average of a country’s trust in the institutions of government, business, media and NGOs. 27-country global total.

49 Ireland47 Turkey46 Sweden42 Poland42 Russia41 Japan
49 Australia49 Italy49 U.S.47 Hong Kong46 Spain45 S. Africa42 Germany42 S. Korea42 U.K.41 France41 Ireland41 Turkey39 Russia38 Japan37 Sweden35 Poland
73 China66 UAE65 India64 Singapore62 Indonesia60 Mexico
82 China78 India74 UAE72 Mexico72 Singapore70 Indonesia64 U.S.63 Australia63 Canada62 Netherlands61 Colombia
56 Canada55 Colombia52 Netherlands51 Argentina51 Malaysia50 Brazil58 Brazil
58 Italy58 Malaysia57 U.K.55 France54 S. Africa53 Argentina53 Spain52 Hong Kong51 Germany50 S. Korea
Trust Index:General Population LagsAverage trust in institutions, Informed Public vs. General Population, 2016
Nearly 6 in 10 countries are
distrusters among the General Population
The Trust Index is an average of a country’s trust in the institutions of government, business, media and NGOs. 28-country global total.
InformedPublic
GeneralPopulation
60 Global 50 Global
8
Trusters
Neutrals
Distrusters

49 Australia49 Italy49 U.S.47 Hong Kong46 Spain45 S. Africa42 Germany42 S. Korea42 U.K.41 France41 Ireland41 Turkey39 Russia38 Japan37 Sweden35 Poland
73 China66 UAE65 India64 Singapore62 Indonesia60 Mexico 57 Mexico
55 Canada55 Colombia52 Netherlands50 Argentina50 Malaysia
48 Brazil47 Australia47 Italy46 Hong Kong45 U.S.44 S. Africa44 Spain42 Germany40 S. Korea40 U.K.39 France39 Ireland39 Russia39 Turkey38 Japan36 Sweden34 Poland
71 China65 UAE62 India62 Indonesia62 Singapore
56 Canada55 Colombia52 Netherlands51 Argentina51 Malaysia50 Brazil
Trust Index:Mass Population Left BehindAverage trust in institutions, Informed Public vs. General Population vs. Mass Population
For the mass population,
17 of 28 countries are distrusters
The Trust Index is an average of a country’s trust in the institutions of government, business, media and NGOs. 28-country global total.
GeneralPopulation
MassPopulation
50 Global 48 Global
49 Ireland47 Turkey46 Sweden42 Poland42 Russia41 Japan
82 China78 India74 UAE72 Mexico72 Singapore70 Indonesia64 U.S.63 Australia63 Canada62 Netherlands61 Colombia58 Brazil58 Italy58 Malaysia57 U.K.55 France54 S. Africa53 Argentina53 Spain52 Hong Kong51 Germany50 S. Korea
InformedPublic
60 Global For the mass population, the
global index falls into distruster territory
9
Trusters
Neutrals
Distrusters

2 An Opportunity for Business
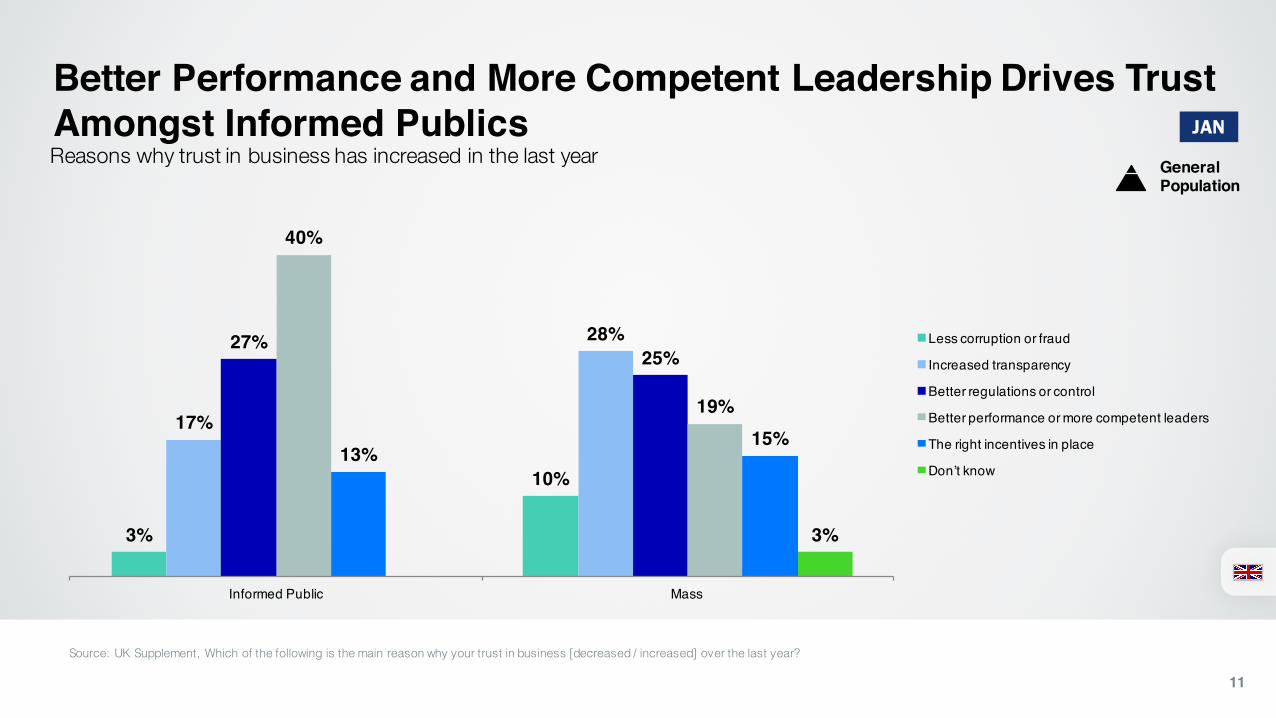
Better Performance and More Competent Leadership Drives Trust Amongst Informed Publics
11
Reasons why trust in business has increased in the last year
3%
10%
17%
28%27%25%
40%
19%
13%15%
3%
Informed Public Mass
Less corruption or fraud
Increased transparency
Better regulations or control
Better performance or more competent leaders
The right incentives in place
Don’t know
JAN
General Population
Source: UK Supplement, Which of the following is the main reason why your trust in business [decreased / increased] over the last year?

Corruption, Fraud, and Wrong Incentives Driving Distrust In Business
12
Reasons why trust in business has decreased in the last year
28% 29%
8%11%11%
16%
3%
12%
50%
28%
Informed Public Mass
Corruption or fraud
Transparency issues
Lack of regulation or control
Poor performance or incompetence
Wrong incentives driving business decisions (such as too much focus on bonuses/ compensation)
Don’t know
JAN
General Population
Source: UK Supplement, Which of the following is the main reason why your trust in business [decreased / increased] over the last year?

51 52
38 43
61 6052 55
46 4433 34
50 4636 36
NGOs Business Media Government
+10 +8 +14 +12
+4 +2 +3 +2
Business is in A Position of Strength – Closing NGOs Long-Held Lead In Trust
Source: 2016 Edelman Trust Barometer Q11-14. Below is a list of institutions. For each one, please indicate how much you trust that institution to do what is right using a nine-point scale, where one means that you “do not trust them at all” and nine means that you “trust them a great deal.” (Top 4 Box, Trust) Informed Public and General Population, U.K.
13
Percent trust in the four institutions of, 2015 vs. 2016
Informed Public
General Population
2015 2016

51 52
3843
61 6052
5560
69 66
54
46 44
33 34
50 48
36 36
49
5954
59
NGOs Business Media Government
Business Most Trusted to Keep Pace
14
Percent trust, and percent who trust each institution to keep up with the changing times, 2016
Informed Public
General Population
Trust2016
Trusted to keep pace
Source: 2016 Edelman Trust Barometer Q11-14. Below is a list of institutions. For each one, please indicate how much you trust that institution to do what is right using a nine-point scale, where one means that you “do not trust them at all” and nine means that you “trust them a great deal.” (Top 4 Box, Trust) Q441-444 Below is a list of institutions. For each one, please indicate how much you trust that institution to keep up with the changing times using a 9-point scale where one means that you “do not trust them at all to keep up with change” and nine means that you “trust them a great deal to keep up with change”. (Top 4 Box, Trust) Informed Public and General Population, UK total.
Business in the lead
Trust2015

Business Must Lead to Solve Problems
Source: 2016 Edelman Trust Barometer Q249. Please indicate how much you agree or disagree with the following statement? (Top 4 Box, Agree). General Population, UK total, question asked of half the sample..
80% agree
“A company can take specific actions that both increase profits and improve the economic and social conditions in the community where it operates.”
up from 74% in 2015
General Population
15

Purpose Impacts TrustPercent who cite each as a reason for why their trust in business has increased or decreased
Source: 2016 Edelman Trust Barometer Q328-329. For which of the following reasons, if any, has your trust in each institution listed below increased over the past year? Q330-331. For which of the following reasons, if any, has your trust in each institution listed below decreased over the past year? General Population, U.K.
Reasons Trust in Business Has Increased
Reasons Trust in Business Has Decreased
Produces economic growth
Contributes to the greater good
Provides a range of public services
Fails to contribute to the greater good
Does not have good leadership
Lacks economic growth
52%
37%
34%
55%
33%
32%
General Population
16

Access to education/training
Address income inequality
Access to healthcare
Protecting/improving the environment
Reducing poverty
Supporting human & civil rights
Modern infrastructure
E
E
P
H
Source: 2016 Edelman Trust Barometer Q561-573 Thinking about businesses in your country, how important is it that they play a role in solving each of the following societal issues? Please use a nine-point scale where one means that it is “not at all important” and nine means that it is “extremely important”. (Top 4 Box, Importance) General Population, 28-country global total, question asked of one quarter the sample.
Societal Expectations Vary
17
Most important issue for business to address in each country
Canada
Brazil
GermanyFrance
ChinaU.S.
Poland
Argentina
Sweden
Mexico
U.K.IrelandNetherlands
Turkey
Singapore
Hong Kong
MalaysiaColombia
Japan
Australia
Russia
S. KoreaItaly
Spain
Indonesia
UAE
S. Africa
India
General Population
R
I
IE
E
R
H
E
EE
EE
P
P
E
H
P
E
H
H
H
E
E
E
E
E
P
I
H
E
I

3 Leadership

6259
54 5246 48
2831
27
66 66
56 5552
47
40 38 36
Peers, Employees More Credible than Leaders
Source: 2016 Edelman. Trust Barometer Q130-587. Below is a list of people. In general, when forming an opinion of a company, if you heard information about a company from each person, how credible would the information be—extremely credible, very credible, somewhat credible, or not credible at all? (Top 2 Box, Very/Extremely Credible) General Population, U.K., question asked of half the sample.
19
Percent who rate each spokesperson as extremely/very credible
+12 +9
Technical Expert
Academic Expert
A person like
yourself
Financial Industry Analyst
Employee CEONGO representative
Board of Directors
Government official/regul
ator
CEO credibilityincreased the most
General Population
2015 2016
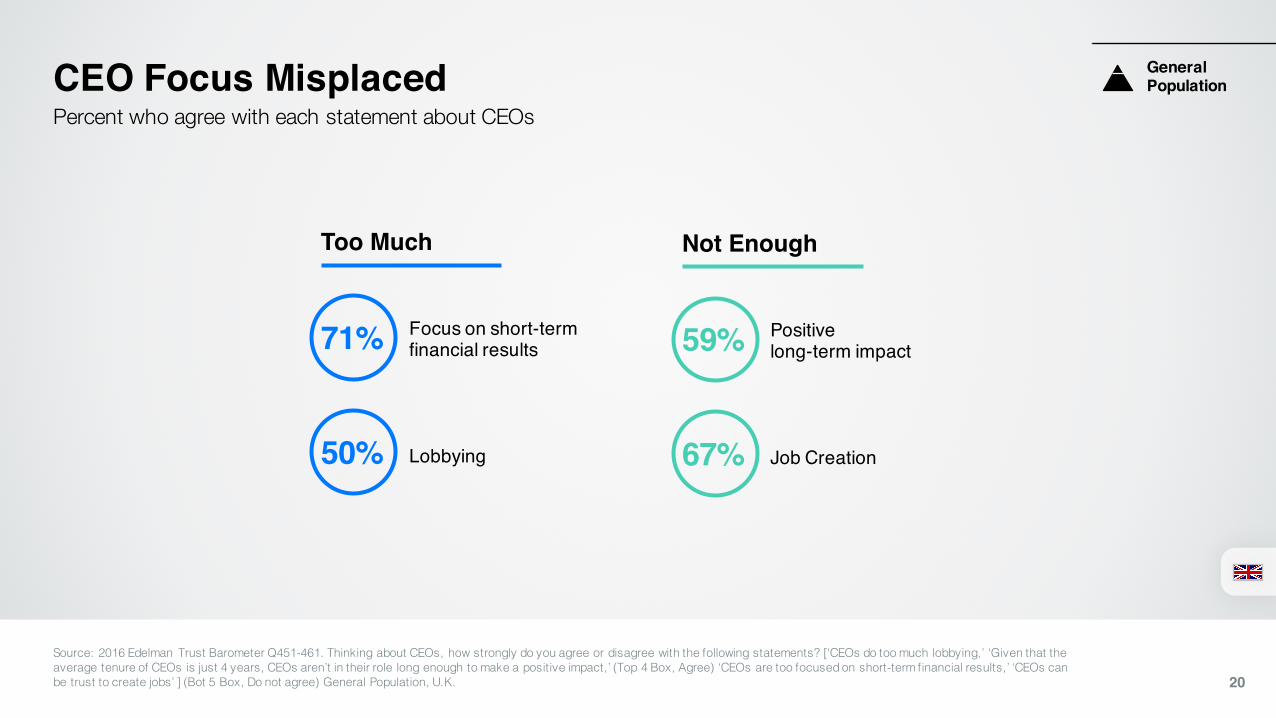
CEO Focus Misplaced
20
Percent who agree with each statement about CEOs
Focus on short-term financial results
Lobbying
Too Much
71%
50%
Positive long-term impact
Job Creation
Not Enough
59%
67%
General Population
Source: 2016 Edelman Trust Barometer Q451-461. Thinking about CEOs, how strongly do you agree or disagree with the following statements? [‘CEOs do too much lobbying,’ ‘Given that the average tenure of CEOs is just 4 years, CEOs aren’t in their role long enough to make a positive impact,’ (Top 4 Box, Agree) ‘CEOs are too focused on short-term financial results,’ ‘CEOs can be trust to create jobs’ ] (Bot 5 Box, Do not agree) General Population, U.K.

Purpose and Profits Matter
Source: 2016 Edelman Trust Barometer Q496-506. How visible do you think a CEO should personally be in these different types of business situations? Please use a 9-point scale where one means that it is “not visible at all” and nine means that it is “extremely visible”. (Top 4 Box, Visible) General Population, UK total, question asked of half the sample. 21
Percent who agree that CEOs should be personally visible in discussing…
80%Societal Issues
‣ Income inequality‣ Public policy discussions‣ Personal views on
societal issues
74%Financial Results
General Population

47%
60%61%
76%
Their education and how it shaped them
Their personal success story
The obstacles they have overcome
Their personal values
Personal Values and History Matter
Source: 2016 Edelman Trust Barometer Q507-514. Thinking about how a CEO communicates with a variety of groups and individuals, how important are each of the following activities a CEO could engage in? Please use a 9-point scale where one means that attribute is “not at all important to building your trust” and nine means it is “extremely important to building your trust”. (Top 4 Box, Important) General Population, 28-country global total, question asked of half the sample. [Media Engagement net = Q507 ‘Interviews with the media,’ and ‘Q512 ‘Sharing their views on a blog or on social media.’ Direct Engagement net = Q508 ‘Communications with employees,’ and ‘Participation in industry conferences.’] Q516-524. For you to trust a CEO, how important is it that you have information on each of the following aspects of the CEO’s personal life outside of their business? Please use a 9-point scale where one means that attribute is “not at all important to building your trust” and nine means it is “extremely important to building your trust. (Top 4 Box, Important) General Population, UK total, question asked of half the sample.
Percent who agree that each type of information is important in building trust in a CEO
via company communications or conferences is 14% more important than media engagement
General Population
22
Direct Engagement

Industry 2012 2013 2014 2015 20165 yr.
Trend
Technology 71% 71% 74% 72% 69% 2
Food & Beverage 64% 68% 70% 68% 64% 0
Consumer Packaged Goods 55% 61% 63% 63% 59% 4
Telecommunications 51% 57% 57% 56% 52% 1
Pharmaceutical 49% 50% 52% 50% 47% 2
Automotive 55% 61% 64% 63% 45% 10
Energy 29% 37% 31% 37% 43% 14
Financial Service 29% 35% 37% 36% 41% 1220%
30%
40%
50%
60%
70%
80%
Sector Trends:Financial Services Rebounds
Source: 2016 Edelman Trust Barometer Q45-429. Please indicate how much you trust businesses in each of the following industries to do what is right. Again, please use the same 9-point scale where one means that you “do not trust them at all” and nine means that you “trust them a great deal”. (Top 4 Box, Trust) General Population, U.K.
*From 2012-2014, Pharma included as subsector(Q61f-65f). **From 2012-2015, Pharma included as an industry sector (Q43-60). 2012-2014 data recalibrated as a sector.
Trust in each industry sector, 2012 - 2016
2012 2013 2014 2015 2016
General Population
23
4 Trust Inequality
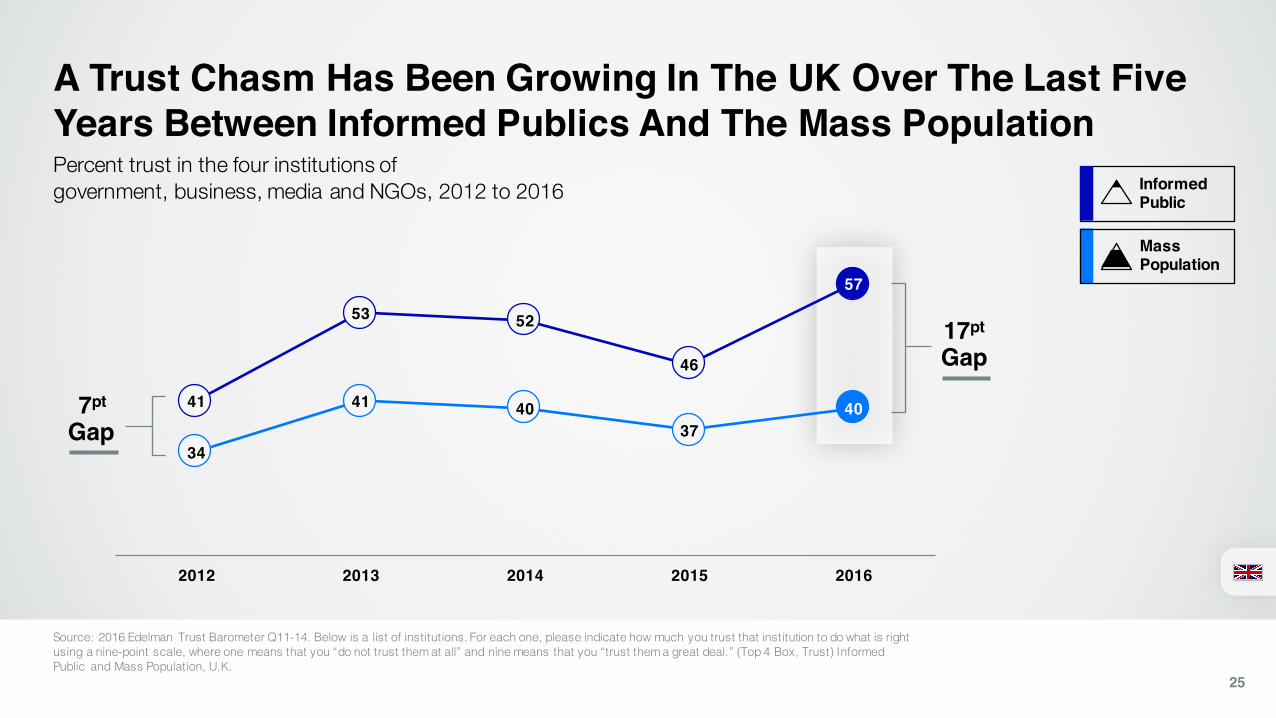
41
53 52
46
57
34
41 4037
40
2012 2013 2014 2015 2016
A Trust Chasm Has Been Growing In The UK Over The Last Five Years Between Informed Publics And The Mass Population
Source: 2016 Edelman Trust Barometer Q11-14. Below is a list of institutions. For each one, please indicate how much you trust that institution to do what is right using a nine-point scale, where one means that you “do not trust them at all” and nine means that you “trust them a great deal.” (Top 4 Box, Trust) Informed Public and Mass Population, U.K.
25
Percent trust in the four institutions of government, business, media and NGOs, 2012 to 2016 Informed
Public
MassPopulation
17pt
Gap
7pt
Gap

10
40 44
19
51
2534
56
10
Income Levels Split Opinion About 2016 – Low Income 4 Times More Likely to Say Things Will Get Worse than the High Net Worth
Source: UK Supplement, Q15. Do you feel your standard of living in terms of your level of wealth, comfort and access to material goods and necessities will getbetter, get worse or stay the same over the course of 2016? Low income households (n250), General population (n1000), High net worth (n100)
26
Standard of living over the course of 2016
Low income households
General population
High net worth
My standard of living will get better
My standard of living will stay the same
My standard of living will get worse
JAN

2029
4031
3723
4740
13
And Looking Further Into The Future, The High Net Worth Get More, The Lower Income Will Get Less
Source: UK Supplement, Q16. Thinking about the economic prospects for yourself and your family, how do you think you and your family will be doing in five years’ time? Low income households
27
Economic prospects for yourself and your familyLow income households
General population
High net worth
Better off About the same as today
Worse off
JAN

44
35 3426
44 43
3237
54
67
4654
NGOs Business Media Government
Business Sees Huge Trust Advantage Among High Net Worth, and Government is Very Low Among Those with Lower Income
Source: 2016 Edelman Trust Barometer Q11-14 Below is a list of institutions. For each one, please indicate how much you trust that institution to do what is right using a nine-point scale, where one means that you “do not trust them at all” and nine means that you “trust them a great deal.” (Top 4 Box, Trust) Low income households (n250), General population (n1000), High net worth (n100) 28
Percent trust in the four institutions of government, business, media and NGOs Low income households
General population
High net worth
JAN
10 pointgap
32 pointgap 12 point
gap28 point
gap

4 Trust In Politics, Parties AndLeaders

37%41%
31% 29%
38%
23% 22%
36% 36%
25% 27%
36%
20%15%
38%
31%
23%19%
29%
22%16%
Conservatives Labour Liberal Democrats UKIP Green Party Scottish National Party Plaid Cymru
201420152016
Trust remains steady for the Conservatives and evaporates for the other parties
30
Trust in political parties to do what is right
Source: UK Supplement, Q14. Please indicate how much you trust each of the following political parties to do what is right using a nine-point scale where one means that you “do not trust them at all” and nine means that you “trust them a great deal”. TOP 4 BOX. General populations
JAN
General Population
Wales35%
Scotland45%

33%
43%
33%27% 25%
13% 11%
34%39%
29%23%
28%
20%16% 14%
40%37%
18% 18%21%
28%
19%16%
David Cameron Boris Johnson Ed Miliband / Jeremy Corbyn
Nick Clegg / Tim Farron
Nigel Farage Nicola Sturgeon Natalie Bennett Leanne Wood
201420152016
David Cameron steals the lead from Boris Johnson at a national level leaving the opposition leaders struggling
31
Trust in POLITICAL LEADERS to do what is right
Q15. Please indicate how much you trust the following political leaders to do what is right using the same nine-point scale where one means that you “do not trust them at all” and nine means that you “trust them a great deal”. TOP 4 BOX. General populations
JAN
General Population
Wales37%
Scotland51%
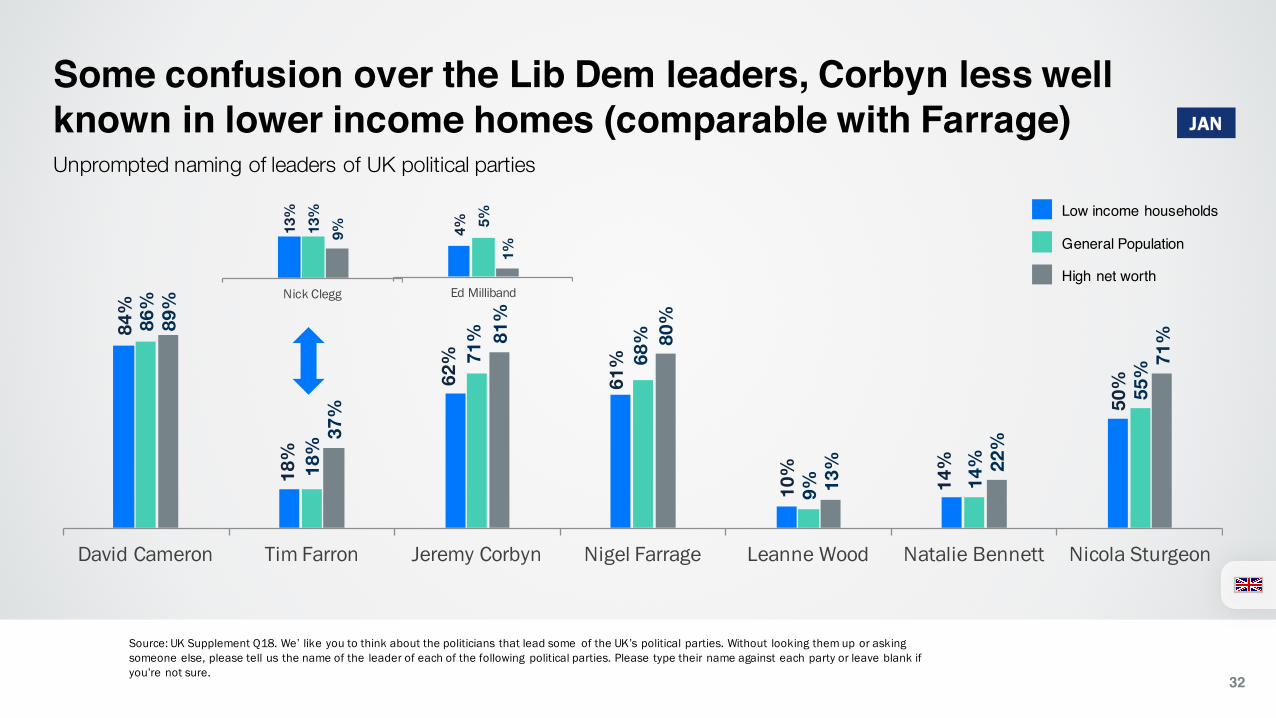
Some confusion over the Lib Dem leaders, Corbyn less well known in lower income homes (comparable with Farrage)
32
Unprompted naming of leaders of UK political parties
Source: UK Supplement Q18. We’ like you to think about the politicians that lead some of the UK’s political parties. Without looking them up or askingsomeone else, please tell us the name of the leader of each of the following political parties. Please type their name against each party or leave blank if you’re not sure.
84%
18%
62%
61%
10%
14%
50%
86%
18%
71%
68%
9% 14%
55%
89%
37%
81%
80%
13% 22
%
71%
David Cameron Tim Farron Jeremy Corbyn Nigel Farrage Leanne Wood Natalie Bennett Nicola Sturgeon
13%
13%
9%
Nick Clegg
4% 5%1%
Ed Milliband
Low income households
General Population
High net worth
JAN
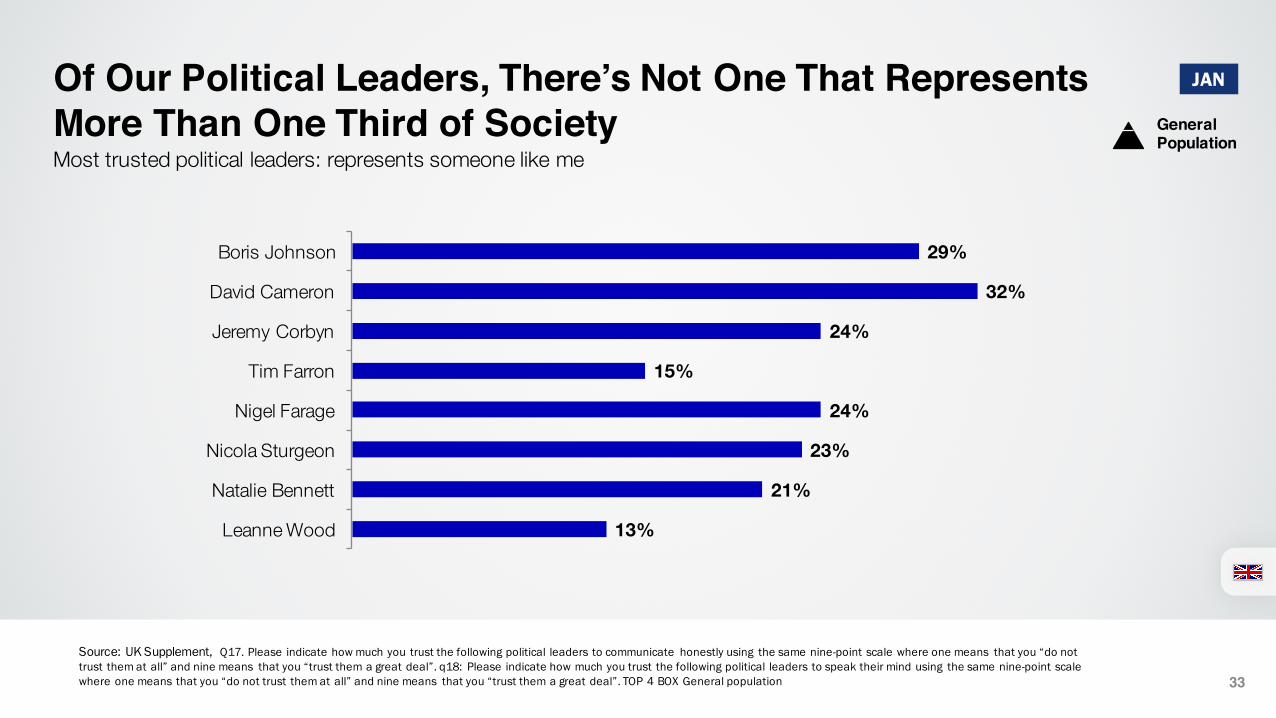
Of Our Political Leaders, There’s Not One That Represents More Than One Third of Society
33
Most trusted political leaders: represents someone like me
Source: UK Supplement, Q17. Please indicate how much you trust the following political leaders to communicate honestly using the same nine-point scale where one means that you “do not trust them at all” and nine means that you “trust them a great deal”. q18: Please indicate how much you trust the following political leaders to speak their mind using the same nine-point scale where one means that you “do not trust them at all” and nine means that you “trust them a great deal”. TOP 4 BOX General population
JAN
29%
32%
24%
15%
24%
23%
21%
13%
Boris Johnson
David Cameron
Jeremy Corbyn
Tim Farron
Nigel Farage
Nicola Sturgeon
Natalie Bennett
Leanne Wood
General Population

40%
46%
14%
46%
41%
14%
48%
35%
17%
The UK to remain part of the European Union
The UK to leave the European Union
Don’t know
2014 2015 2016
Steady increase with the UK remaining part of the EU – The Informed Public are significantly more in favour
34
UK and the European union
Source: UK Supplement Q35. Thinking about the United Kingdom’s membership of European Union, please indicate whether you WANT the UK to leave the European Union or the UK to remain part of the European Union. General populations Q36. Please indicate how much your trust in the UK would be affected if the UK were to leave the European Union. General populations
JAN
General Population
34%
47%
19%
61%
26%
13%
The UK to remain part of the European Union
The UK to leave the European Union
Don’t know
Low income
Informed Public
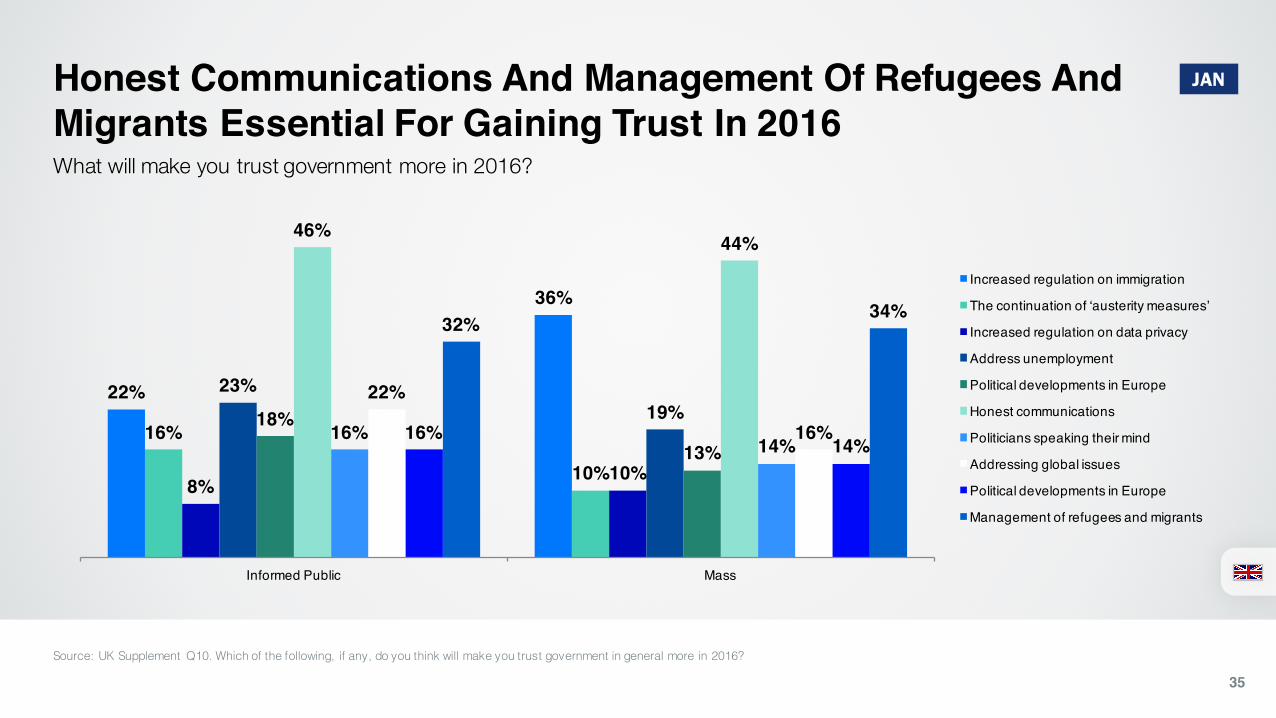
Honest Communications And Management Of Refugees And Migrants Essential For Gaining Trust In 2016
Source: UK Supplement Q10. Which of the following, if any, do you think will make you trust government in general more in 2016?
35
What will make you trust government more in 2016?
22%
36%
16%
10%8%
10%
23%19%18%
13%
46%44%
16%14%
22%
16%16%14%
32%34%
Informed Public Mass
Increased regulation on immigration
The continuation of ‘austerity measures’
Increased regulation on data privacy
Address unemployment
Political developments in Europe
Honest communications
Politicians speaking their mind
Addressing global issues
Political developments in Europe
Management of refugees and migrants
JAN

4 Trust In Media

Traditional Media Most Trusted News Source Amongst Informed Publics
Source: 2016 Edelman Trust Barometer Q178-182. When looking for general news and information, how much would you trust each type of source for general news and information? Please use a nine-point scale where one means that you “do not trust it at all” and nine means that you “trust it a great deal.” (Top 4 Box, Trust) General Population and Millennials, 25-country global total.
*From 2012-2015, “Online Search Engines” were included as a media type. In 2016, this was changed to “Search Engines.”**From 2012-2015, “Hybrid Media” was included as a media type. In 2016, this was changed to “Online-Only media.”
Percent trust in each source for general news and information
37
Informed Public
43%
49%
62%
70%
Owned media
Hybrid media
Online search engines
Traditional media
JAN

The Public Want More Trustworthy Information About BusinessAnd The World Around Them
Source: UK Supplement, Q12. Thinking specifically about traditional media how much to you agree or disagree with the following statements? (By traditional media we mean mainstream media sources that are available in a print or broadcast format, such as newspapers, magazines, television news and radio news) 38
82%
78%
59%
59%
57%
42%
37%
We all need more trustworthy information about business and the world around us
There is a lot of bad news in the world and I want to be sure I am getting reliable information about it
More modern media such as social media seem less trustworthy than sources I grew up with
We can rely less and less on the government to provide news and information for us
Compared to newer forms of media, I find traditional media more reliable and trustworthy
I think that social media is really just a way of accessing traditional media
The media’s conduct and ethics are less of an issue than in recent years
JAN
General Population


